Ad-Hoc vs. Standardized and Optimized Arthropod Diversity Sampling

Abstract
:
1. Introduction
2. Results and Discussion

| Ad-hoc | COBRA | |||
|---|---|---|---|---|
| Total | Riparian corridor | Meadow | ||
| Person-days | 24 | 8 | 4 | 4 |
| Individuals (n) | 1375 | 2538 | 1566 | 972 |
| Species richness (S) | 163 | 140 | 82 | 94 |
| Sampling intensity (n/S) | 8 | 18 | 19 | 10 |
| Singletons (%) | 36 (22%) | 37 (26%) | 25 (30%) | 30 (32%) |
| Doubletons (%) | 22 (13%) | 7 (5%) | 8 (10%) | 8 (9%) |
| Estimated richness | ||||
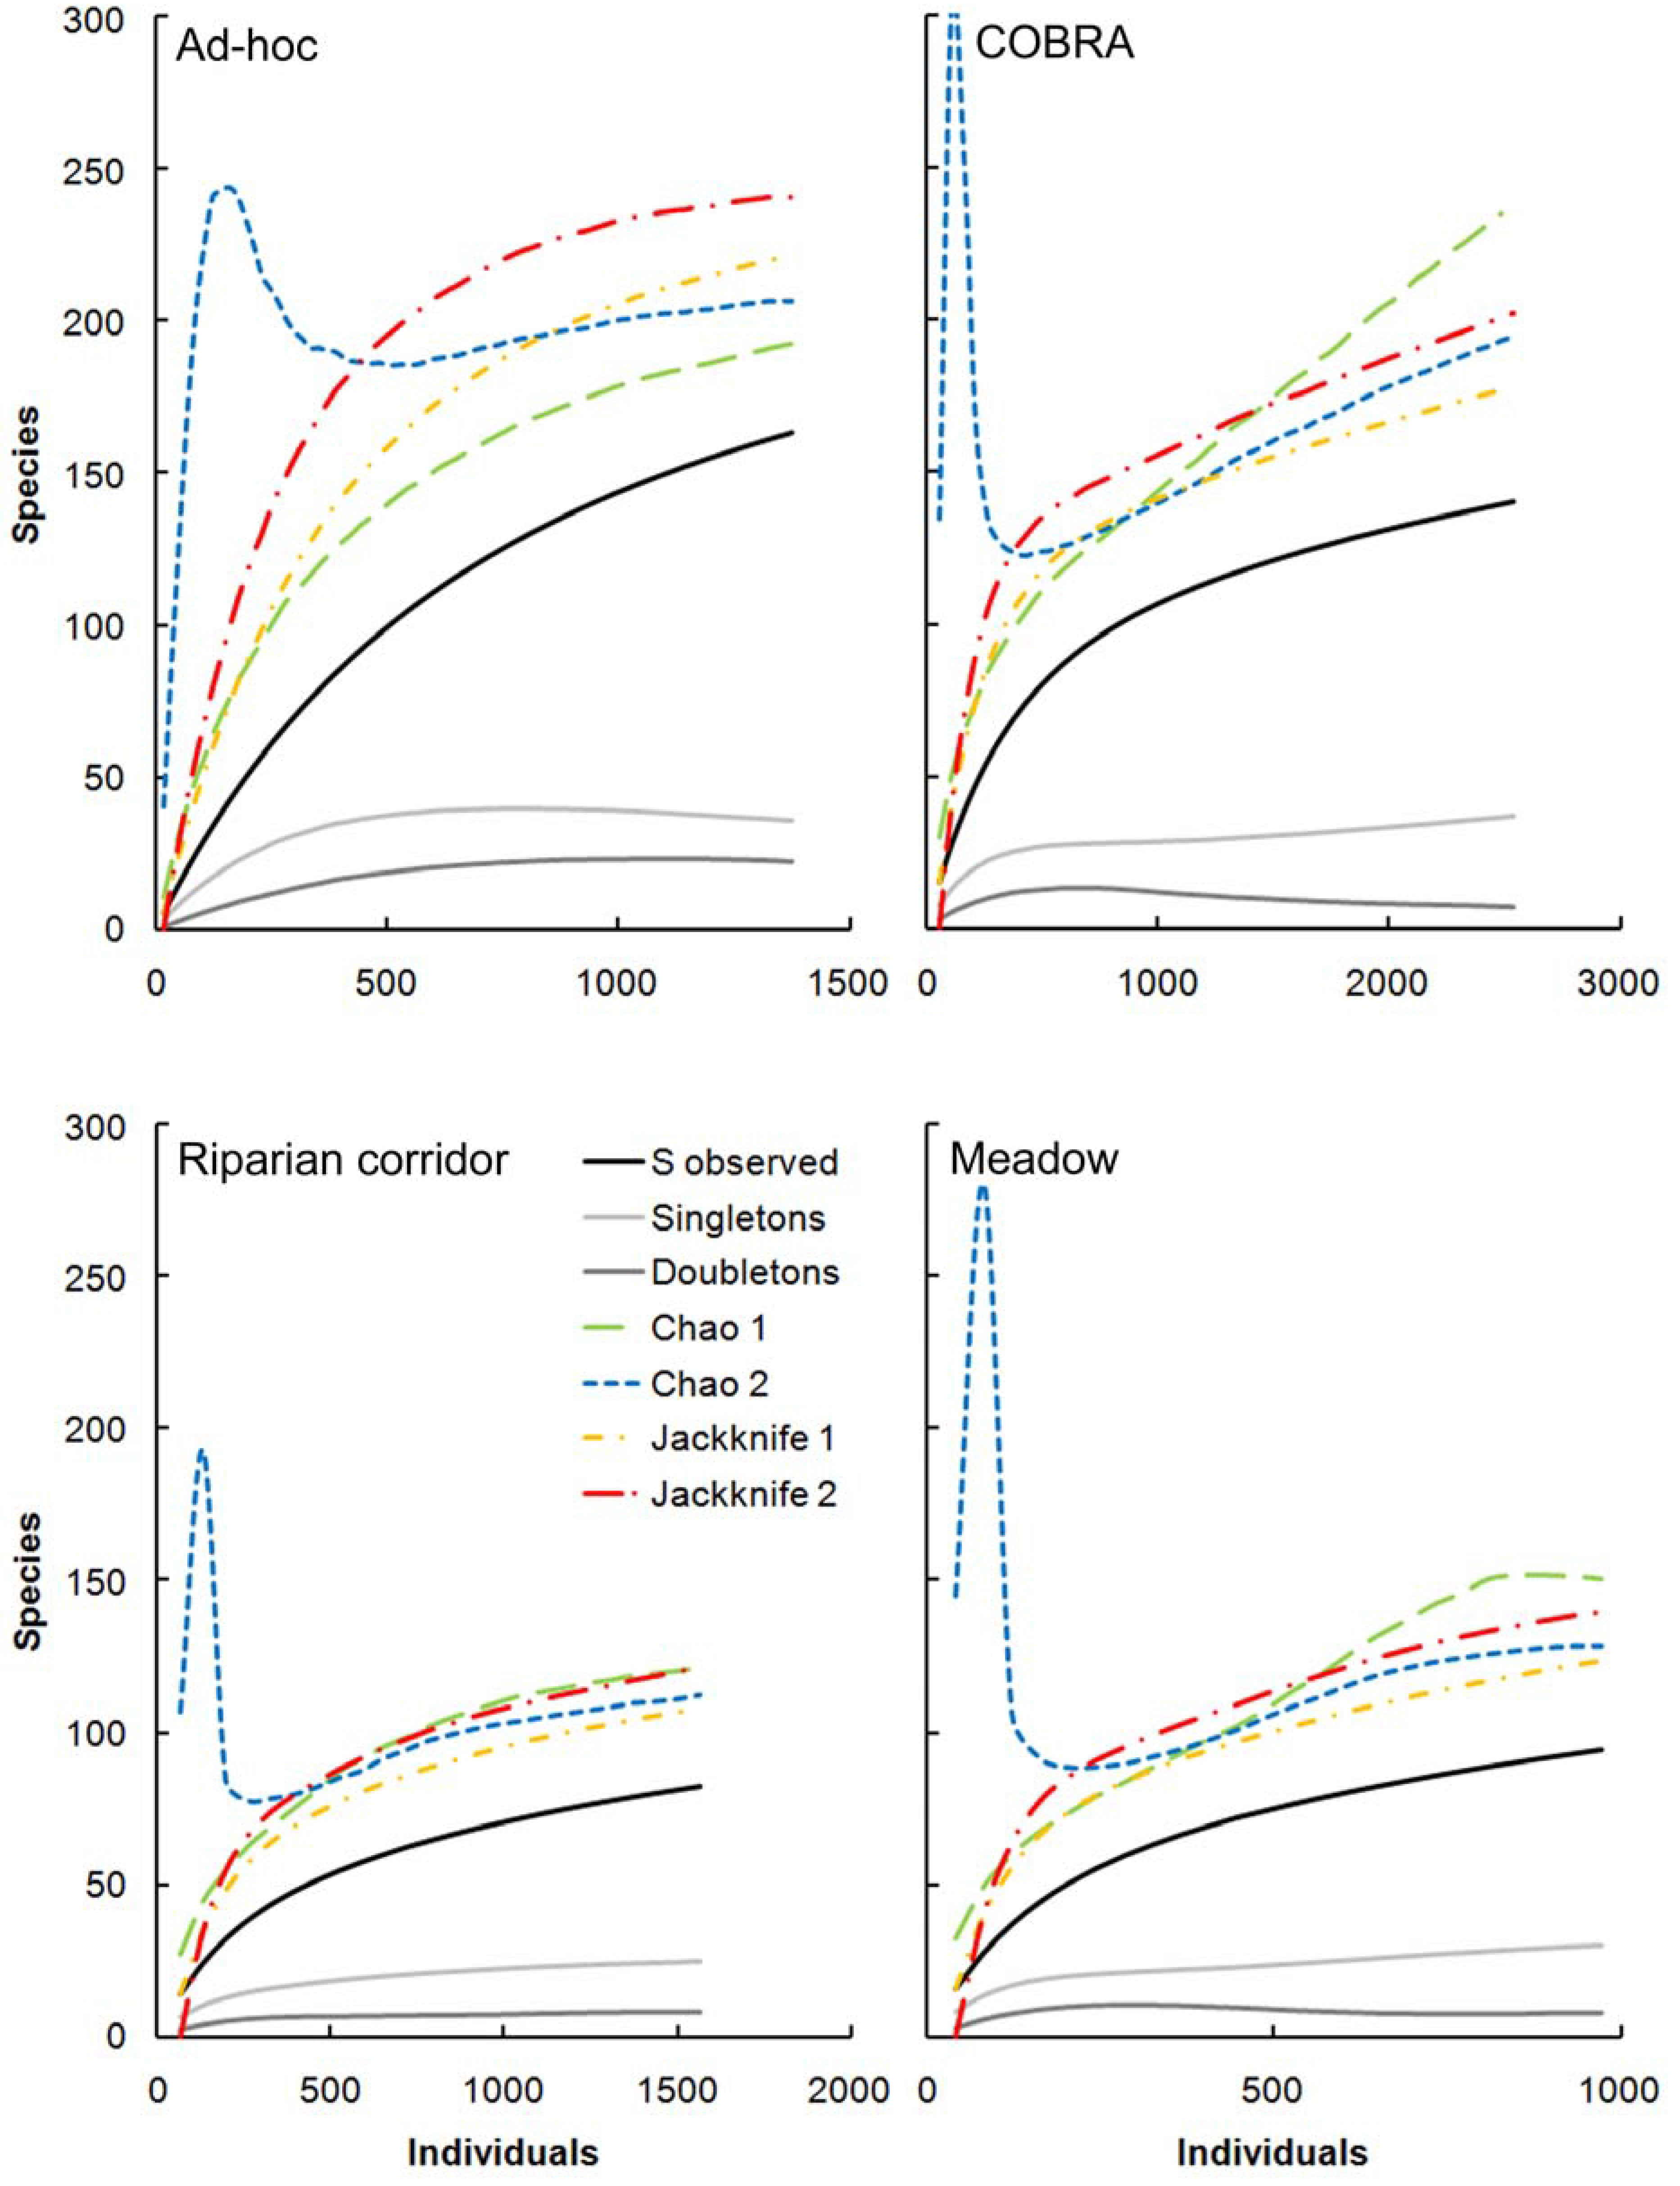
| Chao 1 | 192 | 238 | 121 | 150 |
| Chao 2 | 207 | 194 | 112 | 128 |
| Jackknife 1 | 221 | 178 | 108 | 124 |
| Jackknife 2 | 240 | 202 | 122 | 140 |
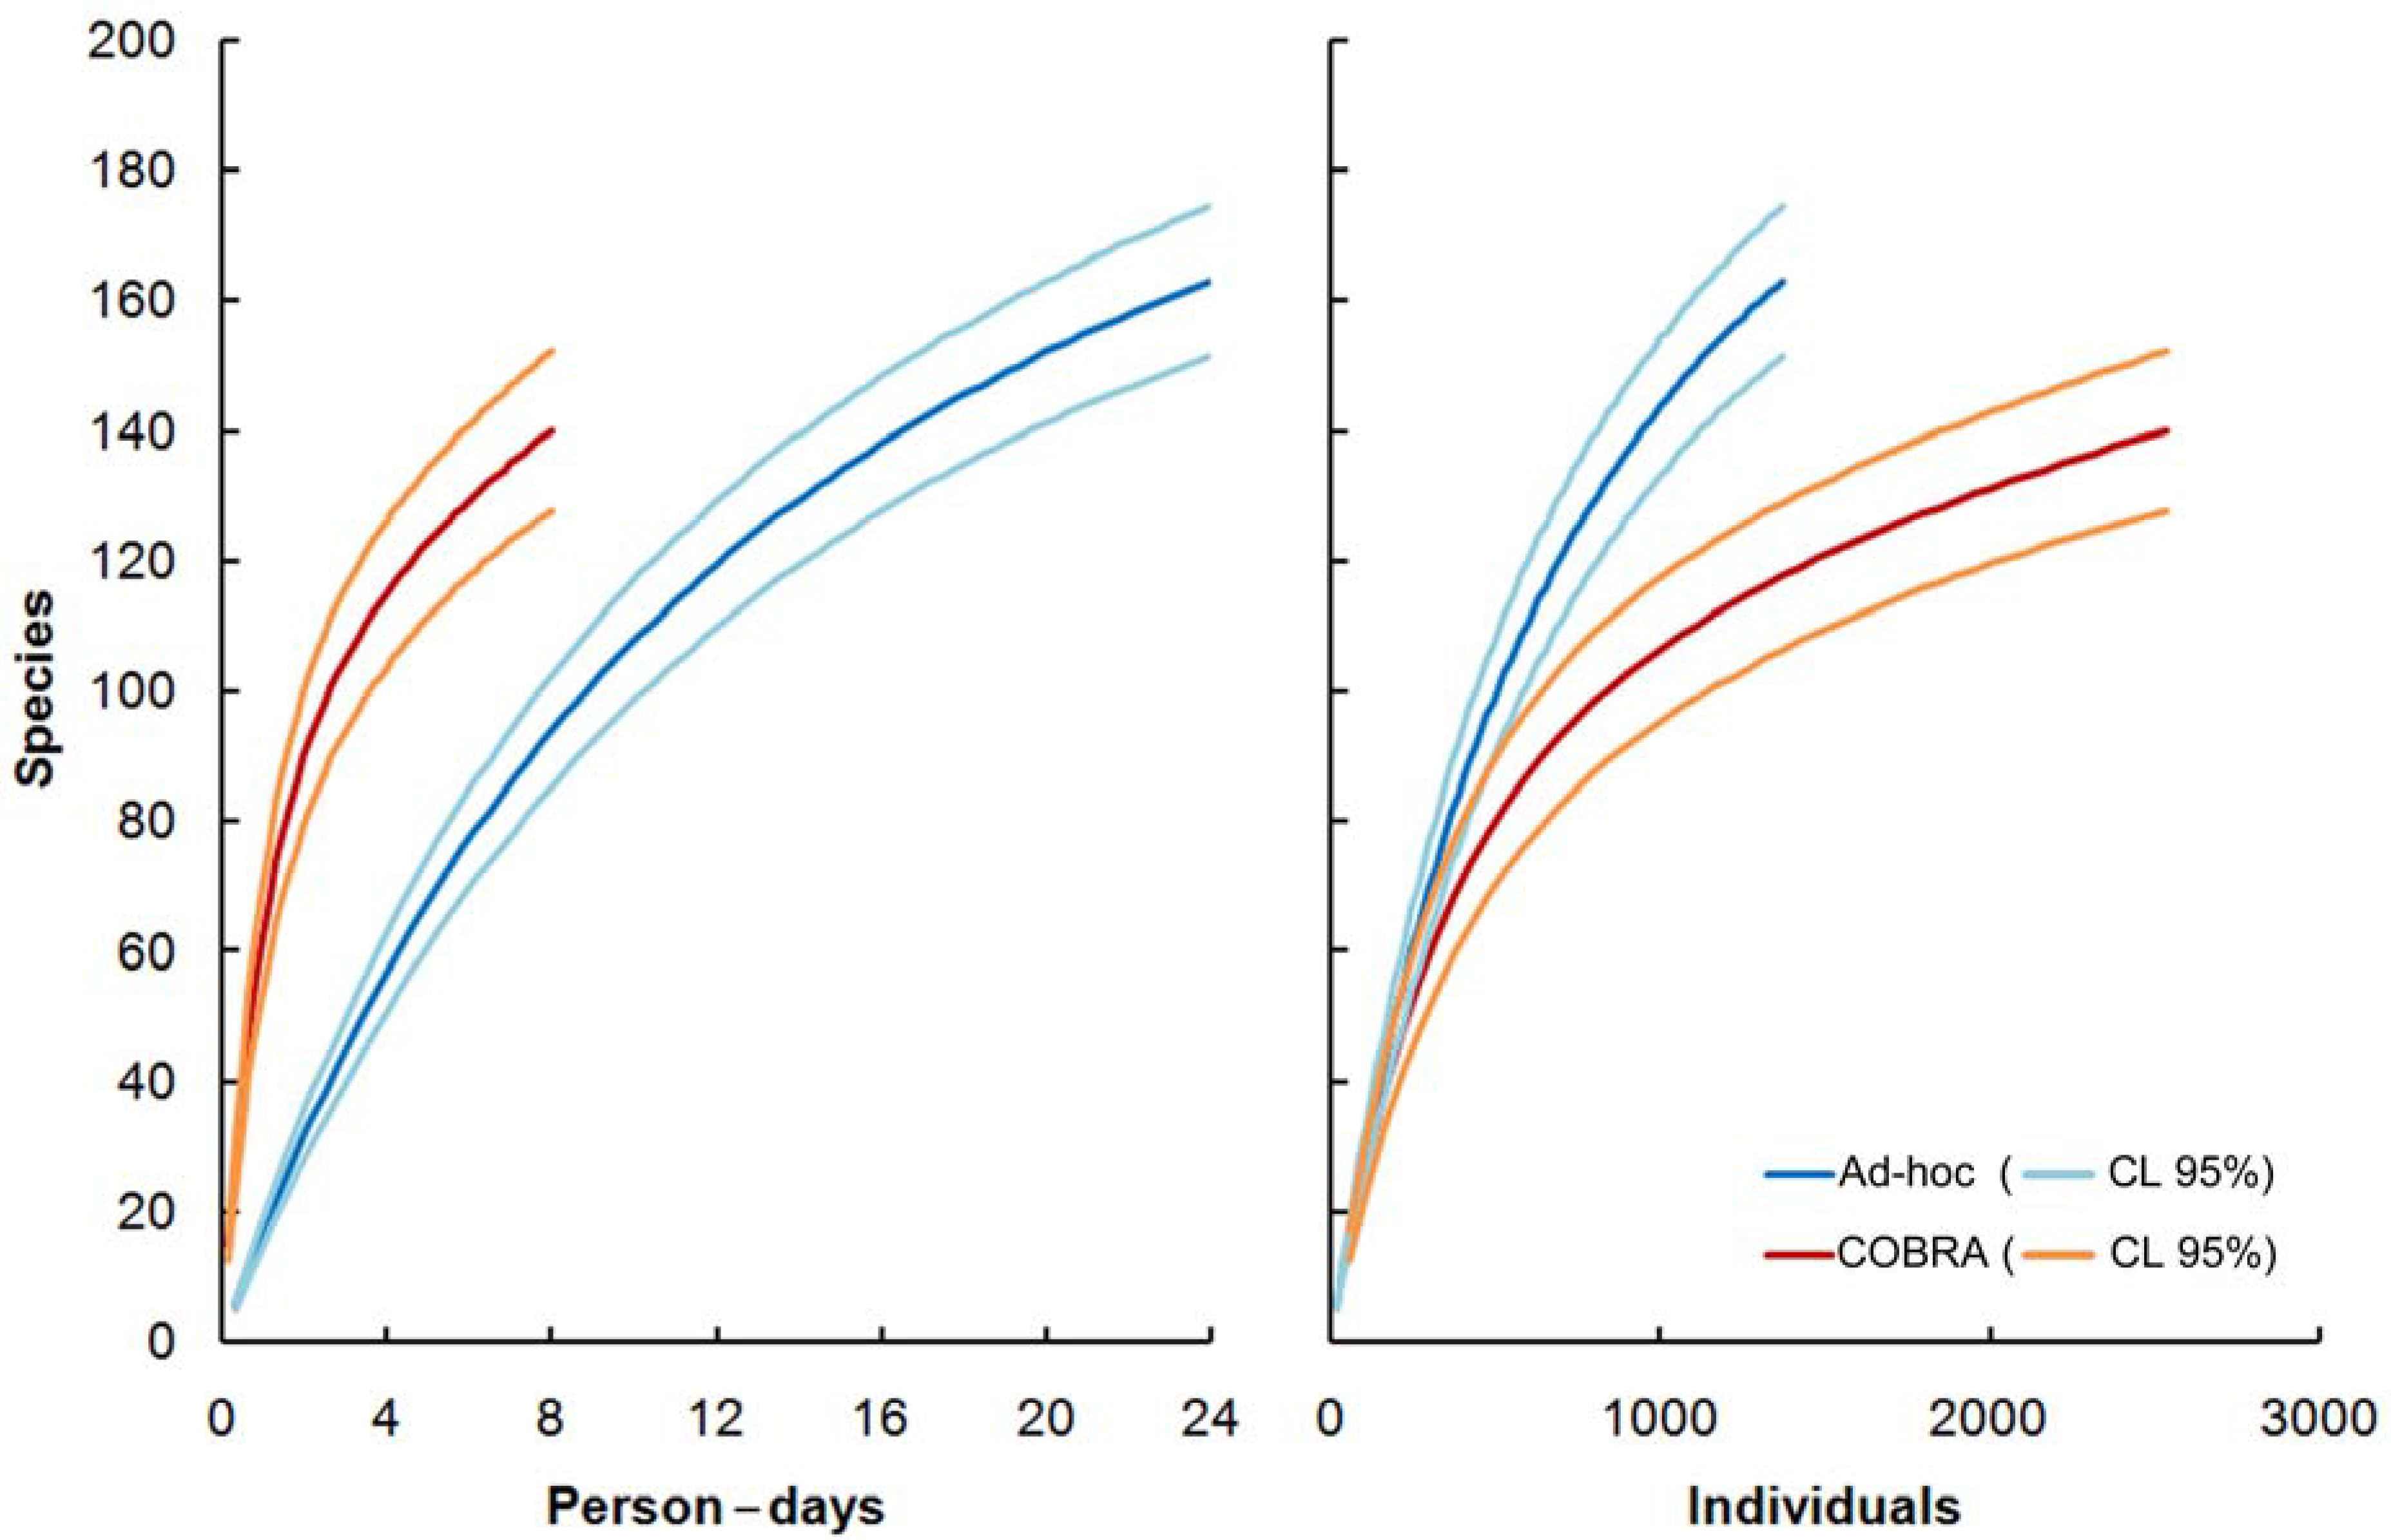
2.1. Efficiency by Unit of Time

2.2. Efficiency by Individuals Captured
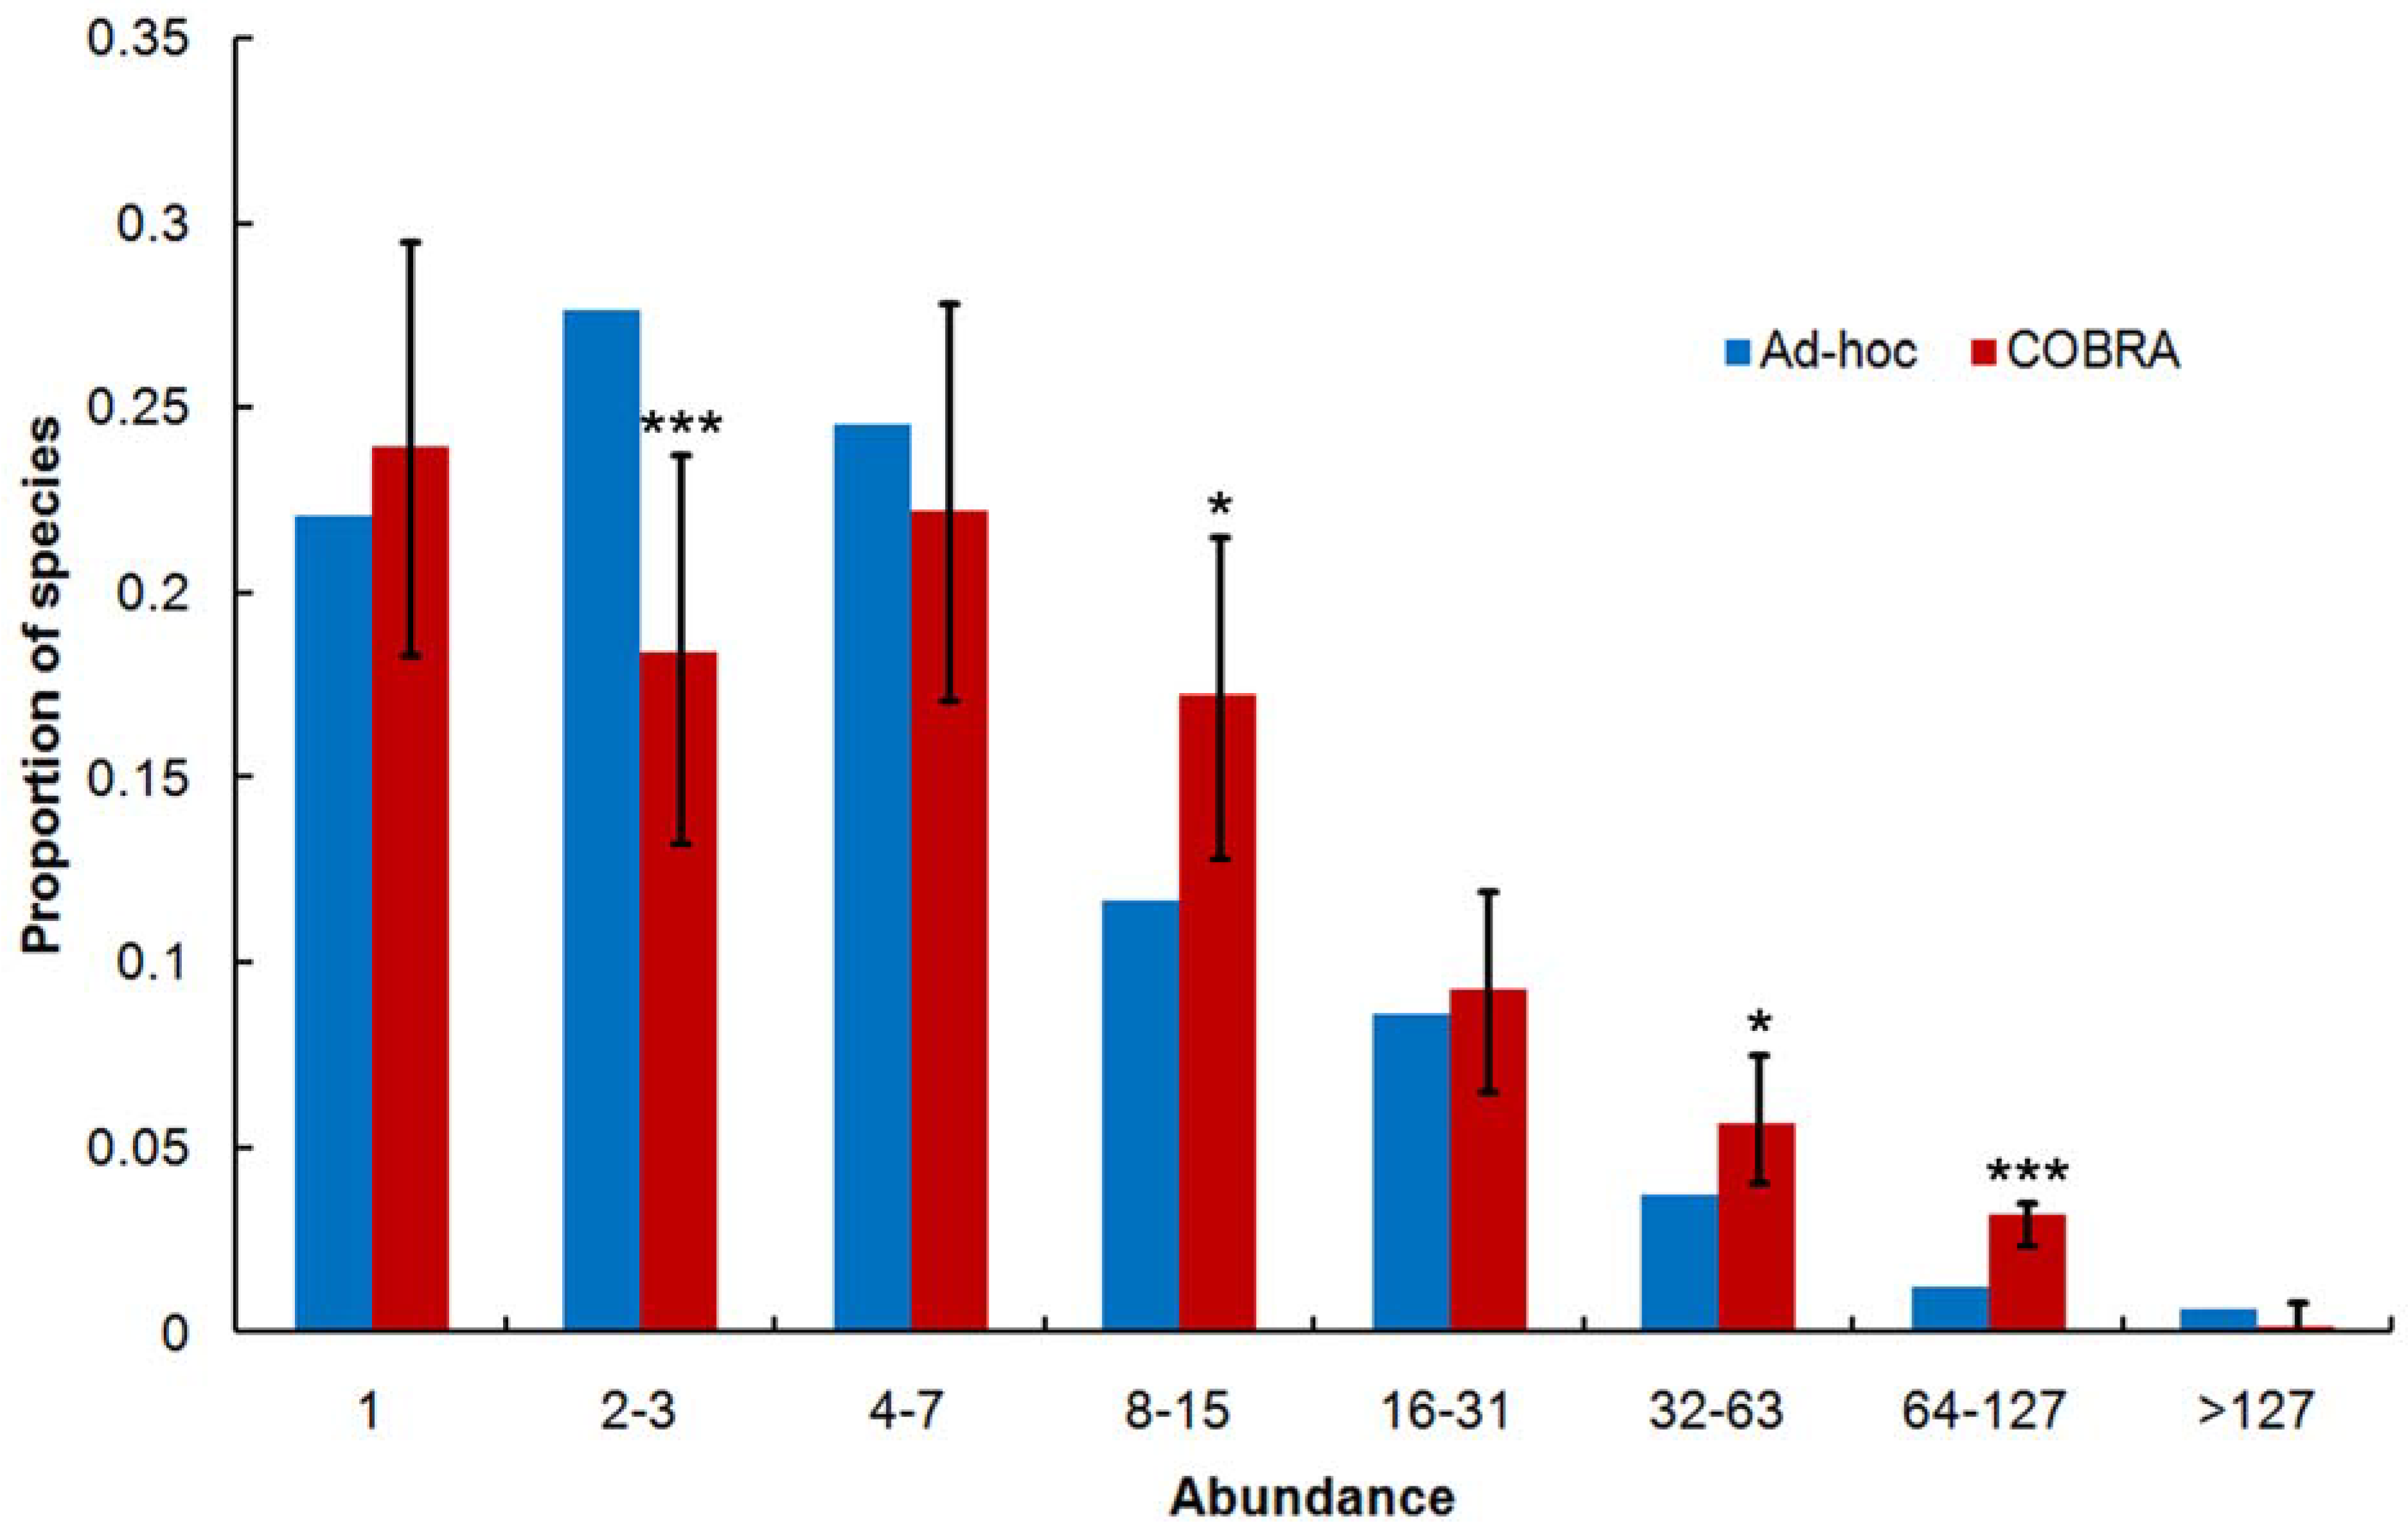
2.3. Over-Collecting of Common Species
2.4. Singletons Proportion
2.5. Species Abundance Distribution

2.6. Average Specimen Size
2.7. Average Taxonomic Distinctness
2.8. Behavior of Richness Estimators
3. Experimental Section
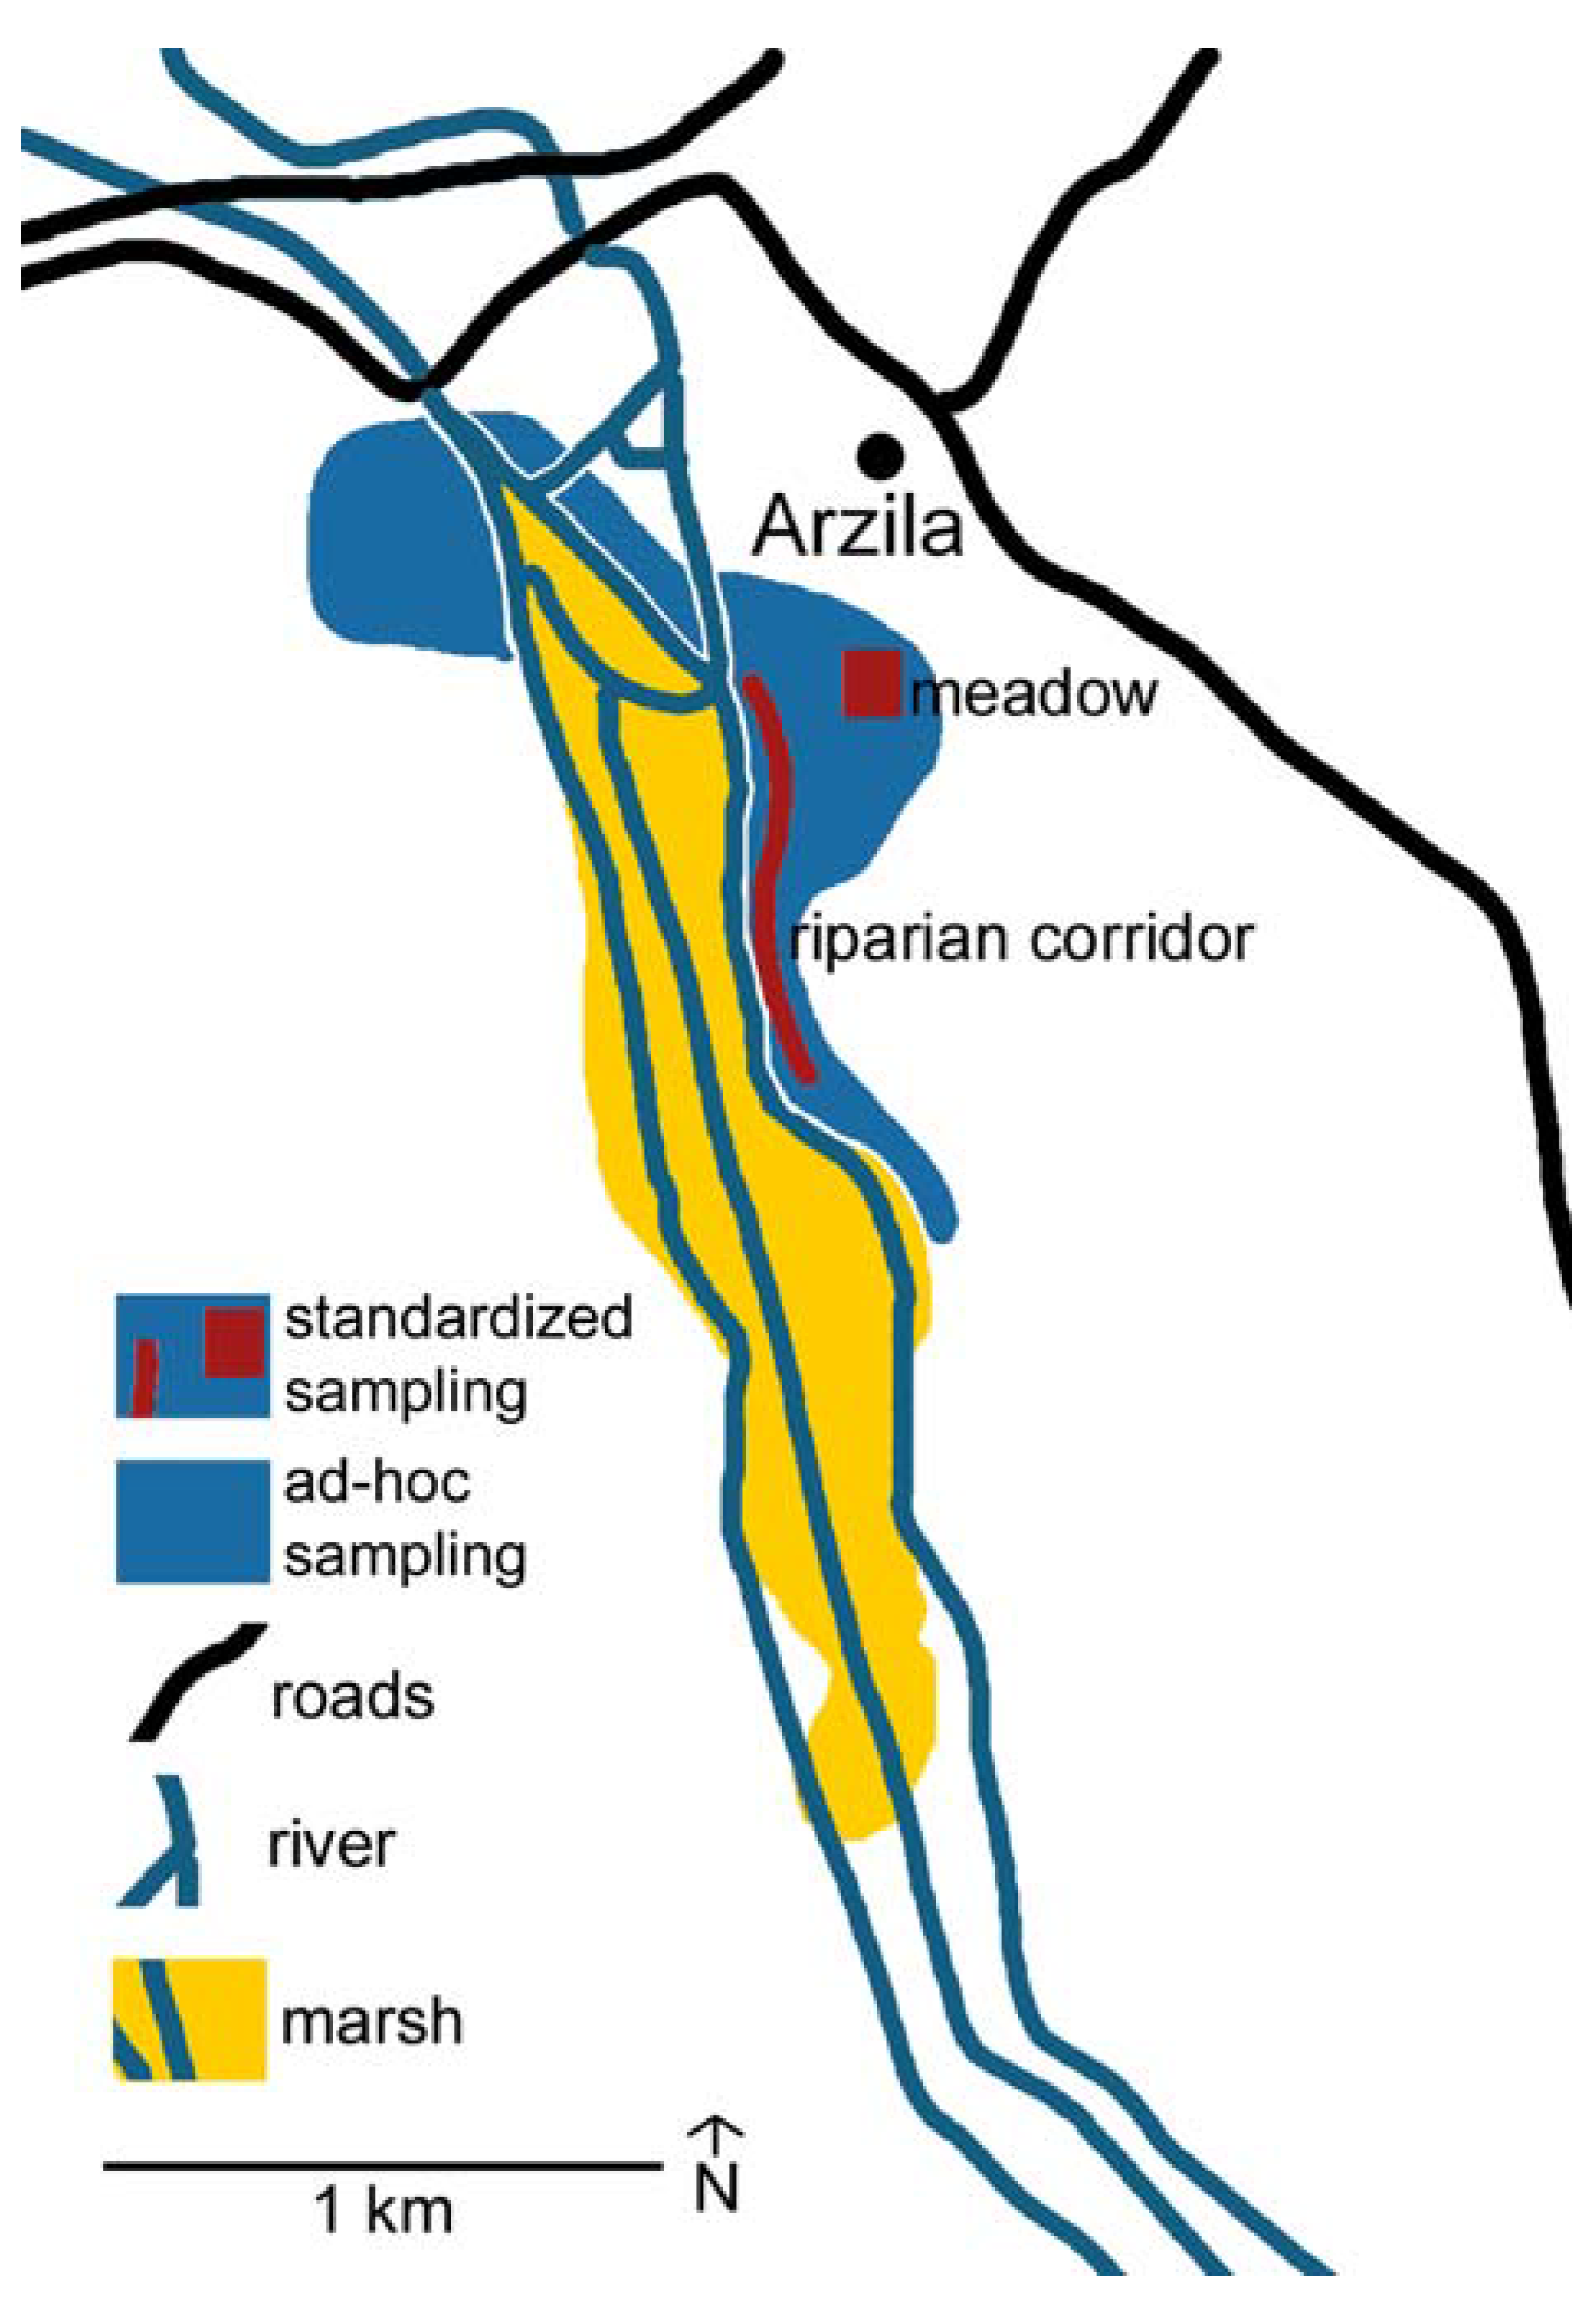
3.1. Study Area


3.2. Ad-hoc Sampling
3.3. Standardized and Optimized Sampling
| Site | Riparian corridor | Meadow |
|---|---|---|
| Aerial sampling night | 4 | 0 |
| Beating day | 2 | 0 |
| Beating night | 2 | 0 |
| Ground sampling night | 0 | 4 |
| Sweeping day | 2 | 4 |
| Sweeping night | 2 | 4 |
| Pitfall traps | 12 | 12 |
| Total | 24 | 24 |
3.4. Statistical Analyses
4. Conclusions
Acknowledgements
References
- Droege, S.; Cyr, A.; Larivée, J. Checklists: an under-used tool for the inventory and monitoring of plants and animals. Conserv. Biol. 1998, 12, 1134–1138. [Google Scholar] [CrossRef]
- Gordon, J.E.; Newton, A.C. Efficient floristic inventory for the assessment of tropical tree diversity: a comparative test of four alternative approaches. For. Ecol. Manage. 2006, 237, 564–573. [Google Scholar]
- Roberts, R.L.; Donald, P.F.; Green, R.E. Using simple species lists to monitor trends in animal populations: new methods and a comparison with independent data. Anim. Conserv. 2007, 10, 332–339. [Google Scholar] [CrossRef]
- Platnick, N.I. The world spider catalog. American Museum of Natural History, version 9.5. 2009. Available online: http://research.amnh.org/entomology/spiders/catalog/index.html (accessed August 3, 2009).
- Coddington, J.A.; Griswold, C.E.; Silva-Dávila, D.; Peñaranda, E.; Larcher, S.F. Designing and testing sampling protocols to estimate biodiversity in tropical ecosystems. In The Unity of Evolutionary Biology: Proceedings of the Fourth International Congress of Systematic and Evolutionary Biology; Dudley, E.C., Ed.; Dioscorides Press: Portland, OR, USA, 1991; pp. 44–60. [Google Scholar]
- Cardoso, P.; Scharff, N.; Gaspar, C.; Henriques, S.S.; Carvalho, R.; Castro, P.H.; Schmidt, J.B.; Silva, I.; Szüts, T.; Castro, A.; Crespo, L.C. Rapid biodiversity assessment of spiders (Araneae) using semi-quantitative sampling: a case study in a Mediterranean forest. Insect Conserv. Divers. 2008, 1, 71–84. [Google Scholar]
- Sørensen, L.L.; Coddington, J.A.; Scharff, N. Inventorying and estimating subcanopy spider diversity using semiquantitative sampling methods in an afromontane forest. Environ. Entomol. 2002, 31, 319–330. [Google Scholar] [CrossRef]
- Cardoso, P.; Gaspar, C.; Pereira, L.C.; Silva, I.; Henriques, S.S.; Silva, R.R.; Sousa, P. Assessing spider species richness and composition in Mediterranean cork oak forests. Acta Oecol. 2008, 33, 114–127. [Google Scholar] [CrossRef]
- Cardoso, P.; Henriques, S.S.; Gaspar, C.; Crespo, L.C.; Carvalho, R.; Schmidt, J.B.; Sousa, P.; Szűts, T. Species richness and composition assessment of spiders in a Mediterranean scrubland. J. Insect Conserv. 2009, 13, 45–55. [Google Scholar] [CrossRef]
- Scharff, N.; Coddington, J.A.; Griswold, C.E.; Hormiga, G.; Bjorn, P.P. When to quit? Estimating spider species richness in a northern European deciduous forest. J. Arachnol. 2003, 31, 246–273. [Google Scholar] [CrossRef]
- Duelli, P. Biodiversity evaluation in agricultural landscapes: an approach at two different scales. Agr. Ecosyst. Environ. 1997, 62, 81–91. [Google Scholar] [CrossRef]
- Duelli, P.; Obrist, M.K.; Schmatz, D.R. Biodiversity evaluation in agricultural landscapes: above-ground insects. Agr. Ecosyst. Environ. 1999, 74, 33–64. [Google Scholar] [CrossRef]
- Jones, D.T.; Eggleton, P. Sampling termite assemblages in tropical forests: testing a rapid biodiversity assessment protocol. J. Appl. Ecol. 2000, 37, 191–203. [Google Scholar] [CrossRef]
- Stork, N.E.; Samways, M.J.; Eeley, H.A.C. Inventorying and monitoring biodiversity. Trends Ecol. Evol. 1996, 11, 39–40. [Google Scholar]
- Delabie, J.H.C.; Fisher, B.L.; Majer, J.D.; Wright, I.W. Sampling effort and choice of methods. In Ants–Standard Methods for Measuring and Monitoring Biodiversity; Agosti, D., Majer, J.D., Alonso, L.E., Schultz, T.R., Eds.; Biological Diversity Handbook Series, Smithsonian Institution Press: Washington, DC, USA, 2000; pp. 145–154. [Google Scholar]
- Ellison, A.M.; Record, S.; Arguello, A.; Gotelli, N.J. Rapid inventory of the ant assemblage in a temperate hardwood forest: species composition and assessment of sampling methods. Environ. Entomol. 2007, 36, 766–775. [Google Scholar] [CrossRef]
- Missa, O.; Basset, Y.; Alonso, A.; Miller, S.E.; Curletti, G.; Meyer, M.D.; Eardley, C.; Mansell, M.W.; Wagner, T. Monitoring arthropods in a tropical landscape: relative effects of sampling methods and habitat types on trap catches. J. Insect Conserv. 2009, 13, 103–118. [Google Scholar] [CrossRef]
- Snyder, B.A.; Draney, M.L.; Sierwald, P. Development of an optimal sampling protocol for millipedes (Diplopoda). J. Insect Conserv. 2006, 10, 277–288. [Google Scholar] [CrossRef]
- Cardoso, P. Standardization and optimization of arthropod inventories–the case of Iberian spiders. Biodivers. Conserv. 2009, in press. [Google Scholar] [CrossRef]
- Crespo, L.C.; Cardoso, P.; Carvalho, R.; Henriques, S.S.; Rufino, A.C. Spiders (Arachnida: Araneae) from the Paúl de Arzila Natural Reserve (Portugal). Bol. Soc. Entomol. Aragonesa 2009, 44, 305–313. [Google Scholar]
- Cardoso, P.; Silva, I.; Oliveira, N.G.; Serrano, A.R.M. Seasonality of spiders (Araneae) in Mediterranean ecosystems and its implications in the optimum sampling period. Ecol. Entomol. 2007, 32, 516–526. [Google Scholar] [CrossRef]
- Hedgren, O.; Weslien, J. Detecting rare species with random or subjective sampling: a case study of red-listed saproxylic beetles in Boreal Sweden. Conserv. Biol. 2008, 22, 212–215. [Google Scholar] [CrossRef]
- Cáceres, M.E.S.; Lücking, R.; Rambold, G. Efficiency of sampling methods for accurate estimation of species richness of corticolous microlichens in the Atlantic rainforest of northeastern Brazil. Biodivers. Conserv. 2008, 17, 1285–1301. [Google Scholar] [CrossRef]
- Barrientos, J.A. Le statut taxonomique des Oxyopes Latreille, 1804, de la Péninsule Ibérique. Rev. Arachnol. 1984, 5, 153–159. [Google Scholar]
- Barrientos, J.A.; Cardoso, P. The genus Malthonica Simon, 1898 in the Iberian Peninsula (Araneae: Agelenidae). Zootaxa 2007, 1460, 59–68. [Google Scholar]
- Pekár, S.; Cardoso, P. Ant-eating spiders (Araneae, Zodariidae) of Portugal: additions to the current knowledge. Zootaxa 2005, 1009, 51–60. [Google Scholar]
- Longino, J.; Colwell, R.K.; Coddington, J.A. The ant fauna of a tropical rainforest: estimating species richness three different ways. Ecology 2002, 83, 689–702. [Google Scholar] [CrossRef]
- Coddington, J.A.; Agnarsson, I.; Miller, J.A.; Kuntner, M.; Hormiga, G. Undersampling bias: the null hypothesis for singleton species in tropical arthropod surveys. J. Anim. Ecol. 2009, 78, 573–584. [Google Scholar] [CrossRef]
- Diekmann, M.; Kühne, A.; Isermann, M. Random vs non-random sampling: effects on patterns of species abundance, species richness and vegetation-environment relationships. Folia Geobot. 2007, 42, 179–190. [Google Scholar] [CrossRef]
- Dennis, R.L.H.; Shreeve, T.G.; Isaac, N.J.B.; Roy, D.B.; Hardy, P.B.; Fox, R.; Asher, J. The effects of visual apparency on bias in butterfly recording and monitoring. Biol. Conserv. 2006, 128, 486–492. [Google Scholar] [CrossRef]
- Ferrand de Almeida, F.; Ferrand de Almeida, P.; Ferrand de Almeida, N.; Moura, A.; Silva, M.; Paiva, J.; Nogueira, I.; Soares, A.; Reis, R.; Godinho, M.; Oliveira, J. Aspectos faunísticos, florísticos, geológicos e geográficos do Paúl de Arzil. Cienc. Biol. 1983, 5, 43–78. [Google Scholar]
- Ferrand de Almeida, F.; Ferrand de Almeida, N.; Ferrand de Almeida, P. Nova contribuição para o conhecimento da fauna do Paúl de Arzila. Cienc. Biol. 1984, 5, 191–194. [Google Scholar]
- Moreno, C.E.; Halffter, G. Assessing the completeness of bat biodiversity inventories using species accumulation curves. J. Appl. Ecol. 2000, 37, 149–158. [Google Scholar] [CrossRef]
- Thompson, G.G.; Thompson, S.A.; Withers, P.C.; Fraser, J. Determining adequate trapping effort and species richness using species accumulation curves for environmental impact assessments. Austral Ecol. 2007, 32, 570–580. [Google Scholar] [CrossRef]
- Gotelli, N.J.; Colwell, R.K. Quantifying biodiversity: procedures and pitfalls in the measurement and comparison of species richness. Ecol. Lett. 2001, 4, 379–391. [Google Scholar] [CrossRef]
- Willott, S.J. Species accumulation curves and the measure of sampling effort. J. Appl. Ecol. 2001, 38, 485–487. [Google Scholar] [CrossRef]
- Moreno, C.E.; Halffter, G. On the measure of sampling effort used in species accumulation curves. J. Appl. Ecol. 2001, 38, 487–490. [Google Scholar] [CrossRef]
- Colwell, R.K.; Mao, C.X.; Chang, J. Interpolating, extrapolating, and comparing incidence-based species accumulation curves. Ecology 2004, 85, 2717–2727. [Google Scholar]
- Mao, C.X.; Colwell, R.K.; Chang, J. Estimating the species accumulation curve using mixtures. Biometrics 2005, 61, 433–441. [Google Scholar]
- Colwell, R.K. EstimateS: statistical estimation of species richness and shared species from samples. Version 8. 2006. [Google Scholar]
- Smith, B.; Wilson, J.B. A consumer's guide to evenness indices. Oikos 1996, 76, 70–82. [Google Scholar] [CrossRef]
- Simpson, E.H. Measurement of diversity. Nature 1949, 163, 688. [Google Scholar]
- Magurran, A.E. Measuring Biological Diversity, 2nd ed.; Blackwell Publishing: Oxford, UK, 2004. [Google Scholar]
- Norris, K.C. Quantifying change through time in spider assemblages: sampling methods, indices and sources of error. J. Insect Conserv. 1999, 3, 309–325. [Google Scholar] [CrossRef]
- Floerl, O.; Inglis, G.J.; Gordon, D.P. Patterns of taxonomic diversity and relatedness among native and non-indigenous bryozoans. Divers. Distrib. 2009, 15, 438–449. [Google Scholar] [CrossRef]
- Clarke, K.R.; Warwick, R.M. A taxonomic distinctness index and its statistical properties. J. Appl. Ecol. 1998, 35, 523–531. [Google Scholar]
- Warwick, R.M.; Clarke, K.R. Practical measures of marine biodiversity based on relatedness of species. Oceanogr. Mar. Biol. Annu. Rev. 2001, 39, 207–231. [Google Scholar]
© 2009 by the authors; licensee Molecular Diversity Preservation International, Basel, Switzerland. This article is an open-access article distributed under the terms and conditions of the Creative Commons Attribution license (http://creativecommons.org/licenses/by/3.0/).
Share and Cite
Cardoso, P.; Crespo, L.C.; Carvalho, R.; Rufino, A.C.; Henriques, S.S. Ad-Hoc vs. Standardized and Optimized Arthropod Diversity Sampling. Diversity 2009, 1, 36-51. https://doi.org/10.3390/d1010036
Cardoso P, Crespo LC, Carvalho R, Rufino AC, Henriques SS. Ad-Hoc vs. Standardized and Optimized Arthropod Diversity Sampling. Diversity. 2009; 1(1):36-51. https://doi.org/10.3390/d1010036
Chicago/Turabian StyleCardoso, Pedro, Luís C. Crespo, Rui Carvalho, Ana C. Rufino, and Sérgio S. Henriques. 2009. "Ad-Hoc vs. Standardized and Optimized Arthropod Diversity Sampling" Diversity 1, no. 1: 36-51. https://doi.org/10.3390/d1010036