Review

Amphibian Declines Are Not Uniquely High amongst the Vertebrates: Trend Determination and the British Perspective

by
Trevor J. C. Beebee
1,2,*,
John W. Wilkinson
2 and
John Buckley
2
1
School of Life Sciences, University of Sussex, Falmer, Brighton BN1 9QG, UK
2
Amphibian and Reptile Conservation Trust, 655a Christchurch Rd, Bournemouth, Dorset BH1 4AP, UK
*
Author to whom correspondence should be addressed.
Diversity 2009, 1(1), 67-88; https://doi.org/10.3390/d1010067
Submission received: 12 August 2009 / Accepted: 21 September 2009 / Published: 24 September 2009
(This article belongs to the Special Issue Amphibian Conservation)

Abstract

:
Although amphibians have experienced major global declines and an increasing extinction rate, recent results indicate that they are not as uniquely disadvantaged as previously supposed. Acquisition of robust data is evidently crucial to the determination of both absolute and relative rates of biodiversity declines, and thus in prioritising conservation actions. In Britain there is arguably a longer history of recording, and attempting to conserve, a wide range of species groups than anywhere else in the world. This stems from the early activities of Victorian naturalists in the nineteenth century, the establishment of natural history societies and, since the mid-twentieth century, a range of national recording schemes and organisations actively involved in conservation. In this review we summarise comparative evidence for British amphibians and reptiles concerning historical abundance, population trends and their causes, and outline how they relate to the situation elsewhere in Europe (and possibly the World). We discuss possible reasons why the plight of ectothermic vertebrates (fish, amphibians and reptiles) seems generally worse than that of endotherms (birds and mammals), as well as research priorities and factors likely to impact amphibians and reptile conservation in future.

1. Introduction

Following the first indications of widespread amphibian declines about 20 years ago [1], a rapidly expanding research effort has attempted to quantify the extent of these declines and understand their causes. A major milestone was the completion of a global amphibian assessment (GAA) by the IUCN, which indicated that amphibians had indeed decreased more rapidly over the previous 30 years than other vertebrates for which data were available [2]. This and other studies highlighted multiple likely causes, including habitat destruction, climate change, agrochemicals, pollution, enhanced UV-irradiation and emerging diseases (e.g., [3,4,5]). The chytrid fungus Batrachochytrium dendrobatidis, in particular, has been associated with so-called “enigmatic” amphibian declines in apparently pristine habitats and is probably the proximal cause of numerous population crashes and extinctions [6]. Amphibians have consequently been proposed as models for investigating environmental change [7], and wide-ranging efforts to ameliorate declines, such as captive breeding and reintroduction programs, have been advocated [8].
This review focuses on two aspects of amphibian declines. Firstly, they are considered relative to those of other vertebrates and especially to reptiles, a group of animals often researched in parallel with amphibians by specialists interested in both classes (i.e., herpetologists). This commonality of interest is more a historical accident than a function of biological relationships, since the two taxonomic groups are not closely related. Nevertheless, amphibians and reptiles are both widely distributed around the world and, as ectotherms, share some broadly comparable physiological features not common to birds or mammals. Furthermore, there were early indications that at least in Europe reptile declines might be of similar severity to those of amphibians [9], in line with model-based studies suggesting that apparent disparities in declines and extinction rates among taxa may not be robust [10]. Secondly, population trends are best examined in the context of long time periods to reduce the influence of short-term fluctuations on conclusions about long-term viability. Amphibian population sizes can fluctuate over several orders of magnitude, to an extent very variable between species, over multi-year time-scales and separating such fluctuations from long-term declines is a widely acknowledged problem (e.g., [11]). Because Britain has a long history of amphibian and reptile recording, critical analysis of trends there and in countries with similarly extensive monitoring schemes could be useful for interpreting events elsewhere around the world, or at least in comparatively developed temperate zone countries. Here we consider the extent to which available evidence supports the contention that amphibian declines are more severe than those in other vertebrate taxa (especially reptiles), and the difficulties in obtaining robust data demonstrating long-term declines in amphibians and reptiles.

2. Methods

Numbers of publications in various categories were obtained by Web of Science searches focused on the most recent five years (2005–2009 inclusive) and confined to “biodiversity and conservation” category journals. Data on species numbers were from the IUCN website [12], as were European amphibian and reptile and assessments [13,14]. Information on status and population trends of British amphibians and reptiles were taken from a wide range of published sources (see results section) and from the natterjack toad site register and rare species database, both maintained by the Amphibian and Reptile Conservation Trust. These data sets have records primarily from expert observers, and extend back to the 1970s. For the two rare species Bufo calamita (natterjack toad) and Lacerta agilis (sand lizard) the records have been pooled into defined sites, so that population trends can be assessed on the basis of changing site numbers. This was possible because both animals use a restricted set of sites with specialised habitats (usually heaths or coastal dunes). Some sites are geographically discrete while others are semi-contiguous, with likely low-level migration between them, but have been used for convenience with consistent geographical definition. Britain was defined as the combined land masses of England, Scotland and Wales totaling approximately 230,000 km2. Statistical tests employed STATISTIX software version 7 (Tallahassee, FL, USA).

3. Results

3.1. Taxonomic Group Comparisons

Global numbers of amphibian, reptile, mammal and bird species, together with numbers of recent publications on their ecology and conservation, and on their declines, are summarised in Table 1. Publication numbers based on literature searches are inevitably approximate. Thus searches based on “amphibian” as a collective, or “frog or toad or newt or salamander” produced reasonably similar total numbers (504 and 452 respectively); however, “reptile” was much less commonly employed as a collective term, and the data in Table 1 (total 749) are based on “lizard or snake or crocodile or turtle”—not a comprehensive list of reptiles, but certainly covering the great majority of reptile publications (data not shown). Using reptile alone yielded just 295 hits. This same caveat might also be true, but more difficult to check, with respect to mammal and bird publication searches and numbers for these classes are therefore likely to be conservative underestimates. Even so, based on relative species diversity, mammals and birds were more highly represented in recent biodiversity and conservation publications, and amphibians and reptiles less represented, than expected by chance (χ2 = 1258, df = 3, P < 0.0001). Conversely, publications in this same category but also concerning declines were significantly higher than expected for amphibians, but lower in the three other vertebrate groups (χ2 = 352, df = 3, P < 0.0001). The same pattern was seen if journals specializing in herpetology were searched. For example, in the six such journals with relevant papers listed on the Web of Science, there were, in the last five years and using the same search definitions, 39 papers on amphibian but only nine on reptile declines. Evidently there has been a significant bias towards study of declines in the amphibians which, as a group, still receive less attention than might be expected from their biodiversity.
The recent focus on amphibian declines has, however, had an interesting and disproportionate effect on global estimates of species richness. Intensive studies, especially in tropical hotspots of endemism such as Sri Lanka, New Guinea and Madagascar, have rapidly increased the number of known extant amphibian species even during the period of global declines [15]. Based on various previous surveys [2,16,17,18] and current (2008) IUCN estimates, amphibian species known to science have increased recently by about 4% per year; reptiles by 2.2% per year, mammals by 1.3% per year and birds by 0.5% per year. These different rates may reflect variable efforts among researchers of the taxonomic groups, or (perhaps more likely) lower recent baselines of knowledge for amphibian and reptile biodiversity.
Table 1. Taxonomic comparisons (global). Numbers of publications are over the period 2005-2009 inclusive, in “biodiversity and conservation” category journals.
Taxon groupNumber of species
(IUCN 2008)
Total number of publicationsNumber of “decline”
publications (%)
Amphibians6,347504153 (30)
Reptiles8,73474942 (6)
Mammals5,4881,29824 (2)
Birds9,9902,793161 (6)
Searches based just on the native amphibians and reptiles of Britain indicated a similar bias towards studies of amphibian decline. There were, during 2005–2009, 69 “biodiversity and conservation” papers on the seven native British amphibians and just 20 papers on the six native terrestrial reptiles, albeit with a further 52 on the regular summer migrant marine turtle, Dermochelys coriacea. Most of these papers did not specifically involve British populations, since all the species involved occur widely across Europe and sometimes beyond. Once again, “decline” papers (25 for amphibians, 10 for reptiles including the turtle) were significantly biased towards amphibians (χ2 = 7.13, df = 1, P < 0.01).
Evidently the question arises as to whether the bias in favour of amphibian decline research is justified on the basis of risk. The GAA indicated that amphibians were indeed suffering more declines and extinctions than other taxonomic groups for which data were comprehensively available [2]. As shown in Table 2A, however, the relatively sparse global information concerning reptiles casts some doubt on this conclusion. Mammal and bird declines, with virtually all known species evaluated, did indeed seem to be slower than those of amphibians although in the case of mammals the rates of decline were certainly substantial. But although only 5% of reptiles were listed as threatened, this figure is highly misleading since only a small fraction of known species had been assessed. For those species that have been evaluated, the proportion in decline was at least as high as for amphibians. An evidently much needed global reptile assessment (GRA) is underway, but not yet complete. Regional ones have however been carried out, and results for Europe are summarised in Table 2B. This analysis confirmed that, at least in Europe, reptiles are in as much trouble as amphibians, supporting an earlier, preliminary study of the global situation [16]. Indeed, a substantially higher proportion of European reptiles than of amphibians was in the Critically Endangered Threat category.
The situation in Britain mirrors that in Europe, and probably (judging by the data of Table 2A) in the rest of the World. Britain has a relatively impoverished amphibian and reptile fauna, but the proportional declines are identical for the two groups (Table 3). Mammals and, especially birds are, however, not far behind. Farmland birds, especially passerines, have declined substantially in Britain mostly due to agricultural intensification since the mid twentieth century.
Of course in all these taxonomic groups there are also species with increasing population sizes. These are not discussed here for two reasons. Firstly, in all groups they seem to make up a small proportion (usually <1%) of the total. Secondly, increases may be transient whereas declines are much more significant because (as per the “gamblers’ ruin” model) they can and have lead to extinctions.
Table 2. (A) Risk comparisons (global). Data from the IUCN (2008).
Taxon
group
% of species
evaluated
Number of threatened speciesNumber of threatened species as:
% of species% of evaluated species
Amphibians98.619053030
Reptiles15.9423531
Mammals100.011412121
Birds100.012221212
Table 2. (B) Risk comparisons (Europe). Data from [13] and [14]. All values are % of total native species.
Taxon groupThreatenedNear threatenedDeclining
TotalCritically endangeredEndangeredVulnerable
Amphibians22.92.47.213.316.959
Reptiles19.44.37.97.112.942
Table 3. Conservation status (Britain). Data from IUCN (2008) and [19]. Mammals include terrestrial and marine natives, birds are native breeding species.
Taxon groupNumber of native speciesNumber of declining and/or strictly protected species (%)Number of extinctions
(as resident, breeding) since 1950
Amphibians73 (43)1
Reptiles73 (43)0
Mammals5914 (24)2
Birds22388 (39)1

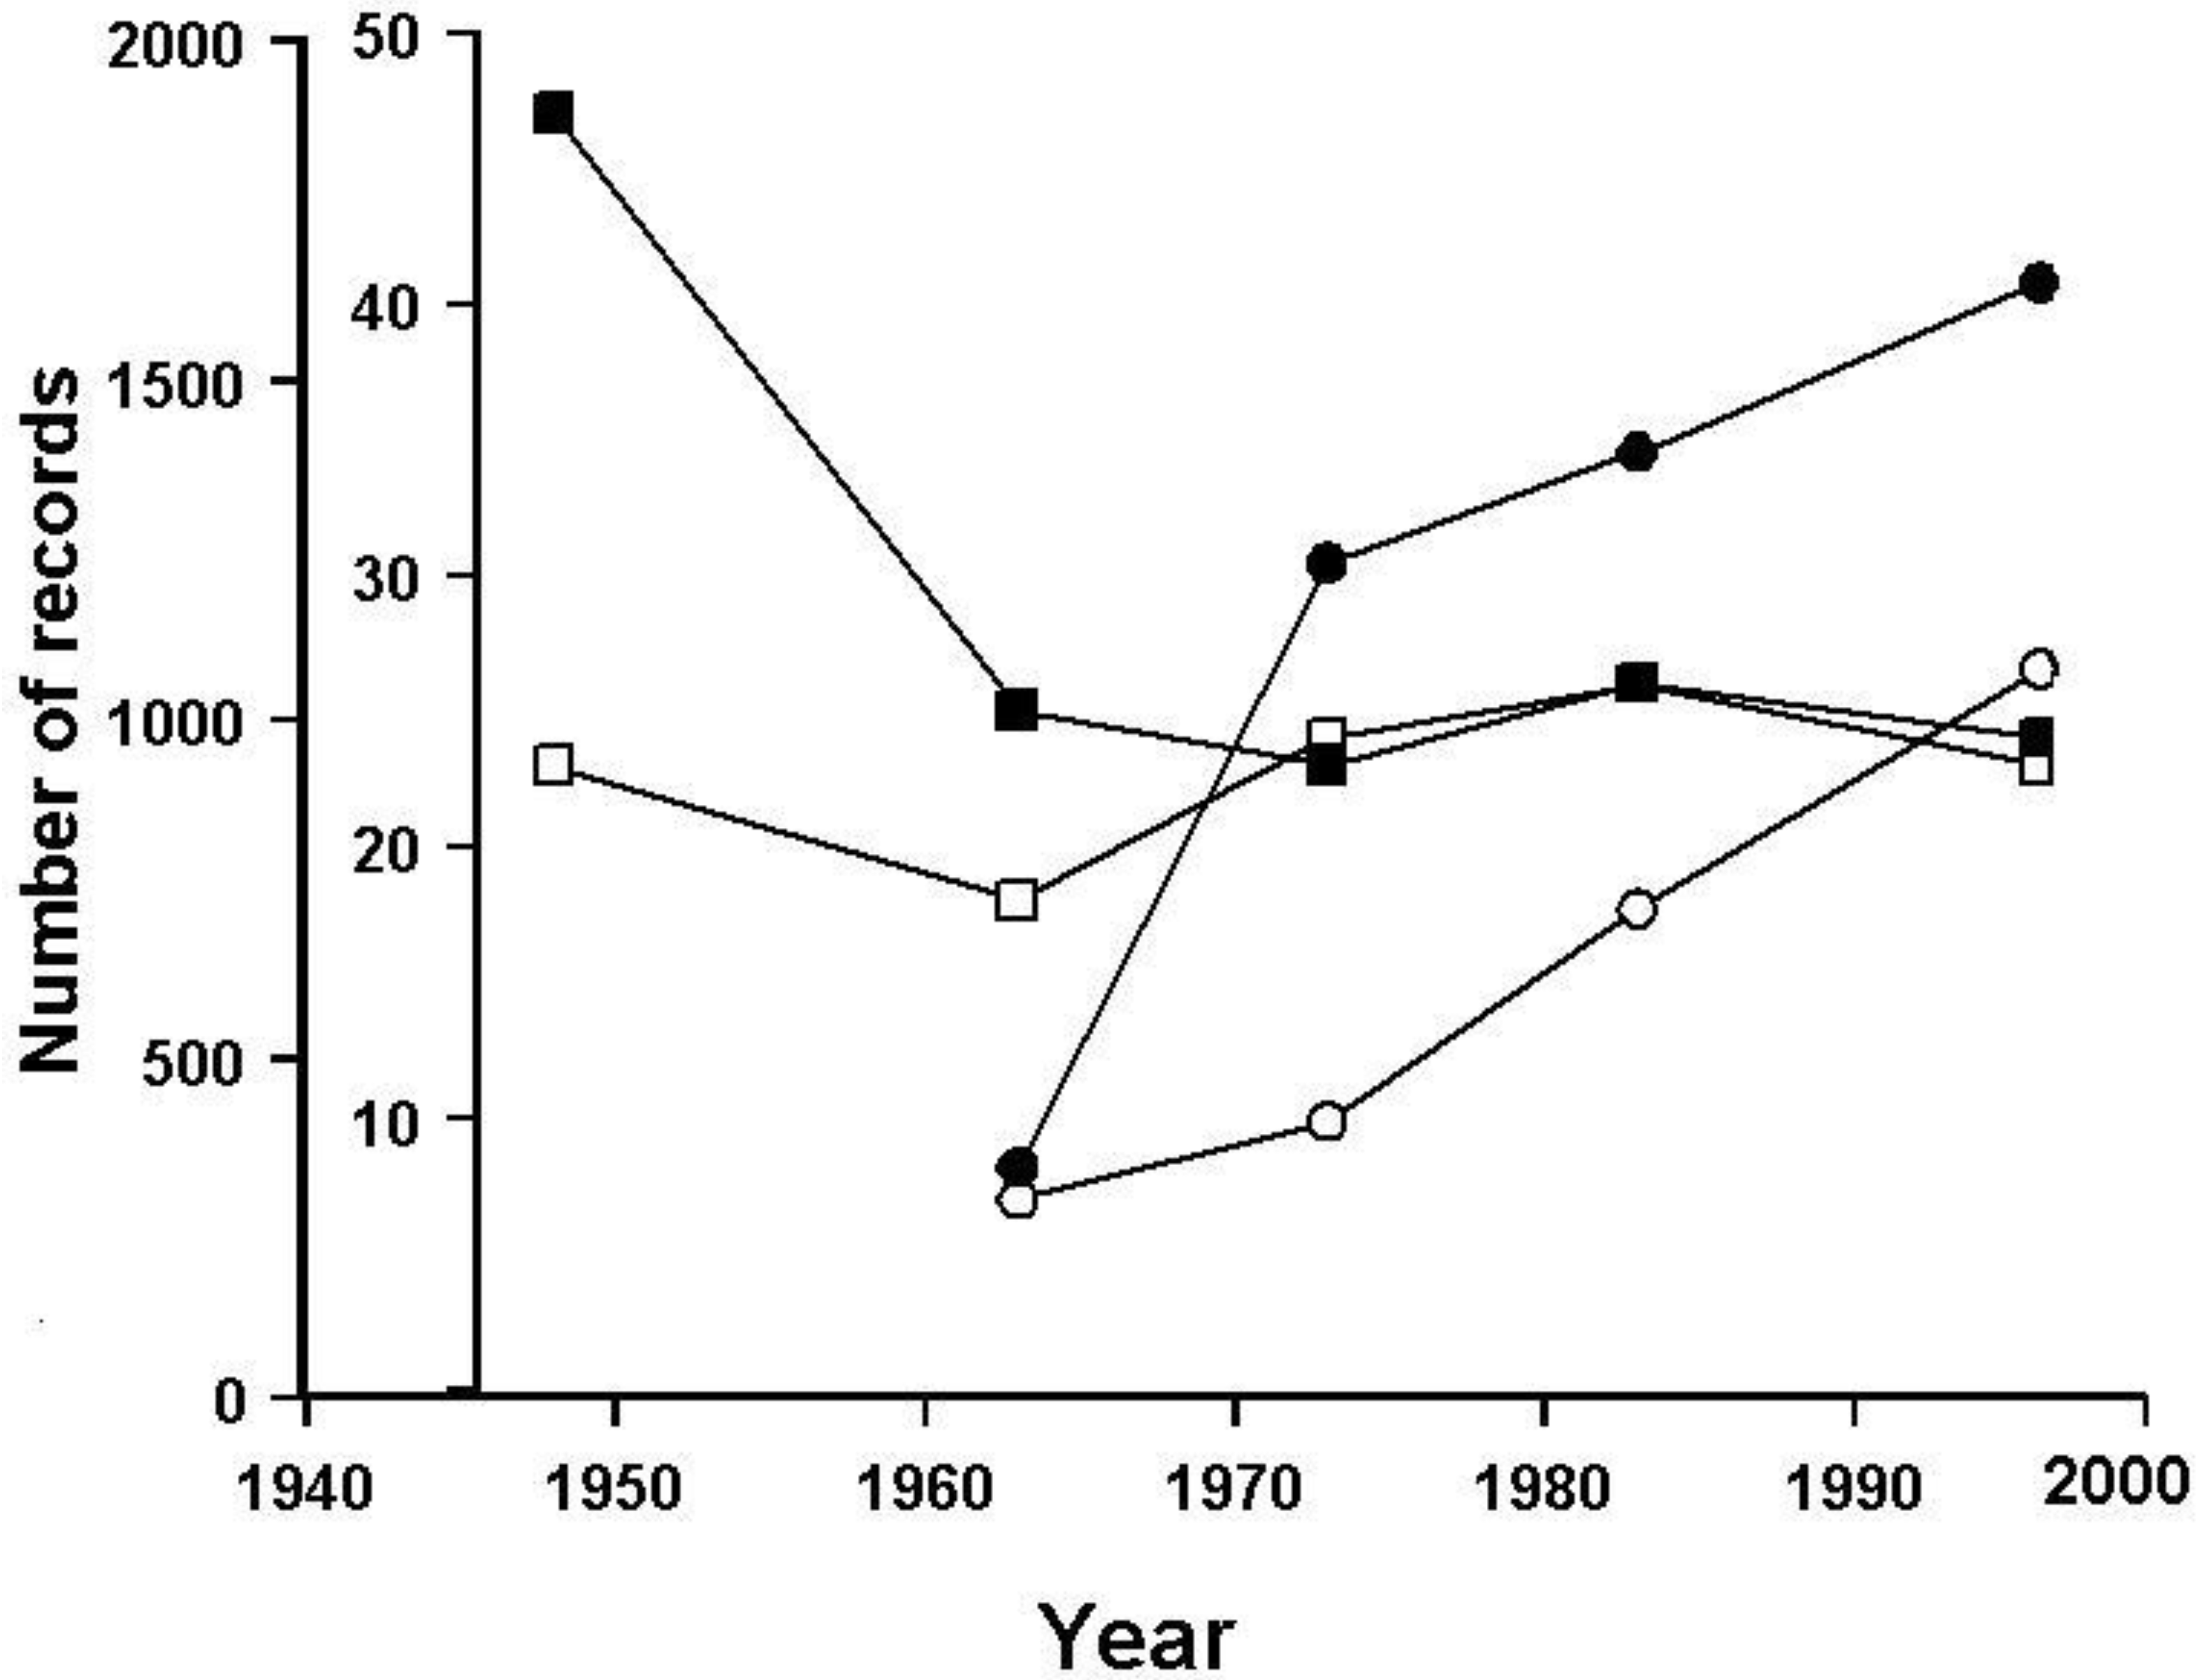
3.2. The British Situation: Seeking a Baseline

It is now widely recognised that seven species of amphibians and seven reptiles are post-glacial natives of Britain. These are constituted by four anurans (Rana temporaria, Rana/Pelophylax lessonae, Bufo bufo and Bufo/Epidalea calamita); three urodeles (Triturus/Lissotriton vulgaris, Triturus/Lissotriton helveticus and Triturus cristatus); six squamate reptiles including three lizards (Lacerta/Zootoca vivipara, Lacerta agilis, Anguis fragilis) and three snakes (Natrix natrix, Vipera berus and Coronella austriaca), and the marine chelonian Dermochelys coriacea. Recently proposed changes of nomenclature following taxonomic revisions are indicated above [20,21]. Ten of these species are widespread throughout Britain, while four (R. lessonae, B. calamita, L. agilis and C. austriaca) are much rarer, with very localised distributions. Remarkably for such a crowded and well-recorded country, one species (R. lessonae) was only recognised as native within the last decade [22]. This exemplifies a significant difficulty with the study of population trends, notably the identification of a “baseline” data set with which to compare subsequent events. Nevertheless, with so few species, a high human population density and a longstanding general interest in natural history, Britain should be uniquely positioned for assessing changes in biodiversity. While this may be true, the considerable remaining uncertainties in Britain demonstrate just how difficult the problems must be for parts of the world without these advantages.
Table 4 summarises the early history of amphibian and reptile recording in Britain. The first attempt to collate national data, in 1869 [23], gave an accurate general picture for eight of the 14 species, mostly very common ones that occurred over most of the country. Even so, no information was provided for two very widespread amphibians (B. bufo and T. helveticus) and one reptile (C. austriaca) was not recognised at all. Remarkably, no comprehensive distributional accounts of the above two amphibians were published until nearly a century later [27]. Coronella austriaca was recognised by 1893 [24], albeit with a substantial error in its proposed distribution (Dumfries, in Scotland, is much further north than any verified record) and the ranges of the two rare reptiles (C. austriaca and L. agilis) was broadly known by 1903 [25,26]. The general distribution of the rare amphibian B. calamita was, however, incompletely reported until 1948 [27]. During this period (1869–1948) the resolution of British species distributions increased progressively, from a primarily national one (England, Scotland, Wales, Ireland) through to vice-county level. Early recorders arbitrarily divided Britain into similarly sized vice-counties, 112 altogether in England, Wales and Scotland with an average area of 2,000 km2 (thus approximating to 45 × 45 km2). By 1948 vice-county resolution was normal for most species, although there were spot maps (individual specific locality records) for the rare C. austriaca, L. agilis and B. calamita. For some subsequent status studies, the 1948 data [27] were considered a baseline against which to assess population changes. Unfortunately, problems with this assumption were substantial, including the existence of as yet undiscovered populations of rare species, crude resolution of widespread species distributions, and a complete lack of validation of species identification, exemplified by the Dumfries record of C. austriaca. Indeed, the issue of baseline reference points has haunted efforts to quantify population changes to the present day, despite major efforts to overcome all the above difficulties.
Subsequent attempts to quantify amphibian and reptile status changes were based on spot maps, mostly (post-1970) translating individual records into 10 × 10 km2 resolutions. Some results from this ongoing exercise, between 1963 and 1996 [28,29,30,31], are shown for four species (one widespread and one rare amphibian, one widespread and one rare reptile) in Figure 1. Despite the continuously improving database, interpretation problems remained, and certainly for widespread species sometimes masked issues of conservation concern. The dramatic apparent increase in common frogs (R. temporaria), for example, ran contrary to evidence of major declines in this species across much of Britain during the 1960s [32] and thus confused the issue of assessing status changes. For both the widespread species in Figure 1, there was little sign of record saturation after more than 30 years. Attempts to distinguish old and new records also failed to identify trends. The ratio of pre-1947 to post-1947 records of R. temporaria was around 0.17 [28], while the ratio for pre-1970 to post-1970 records, after frog declines in the 1960s, was actually lower at about 0.11 [29].
Table 4. Recording history of amphibians and reptiles in Britain.
Year [reference]
1869 [23]1893 [24]1901–1903 [25,26]1948 [27]
ResolutionMostly national, some countyMostly national, some countyRegional and vice-countyVice-county
R. temporariaCommon in Britain & Ireland
R. lessonaePresent in East Anglia
B. bufo Absent from Ireland Widespread in Britain
B. calamitaHampshire, London, East Anglia & SolwaySurrey, Suffolk & south-west Ireland Dorset, Cheshire, Lancashire
T. vulgarisWidespread & common Commoner than T. cristatus, and occurs in Ireland
T. helveticusEdinburgh, Dorset, Isle of Wight, SomersetDevon & Hereford Widespread in Britain, absent in Ireland
T. cristatusWidespread & common
L. viviparaCommon in Britain (including Scotland) & Ireland
L. agilisDorset Surrey, Hants, Cheshire, Lancashire
A. fragilisWidespread, including ScotlandAbsent from Ireland
N. natrixCommon in England, maybe Scotland, not in Ireland Common in south. Only in south of Scotland Rare in northern England, absent from Scotland
V. berusIn Britain, not Ireland Common in Scotland
C. austriaca Dumfries (!) Hants & DorsetSurrey & Berkshire
D. coriaceaCornwall, Dorset & North Sea coasts
Figure 1. Species records (10 × 10 km2) 1947-1996. Widespread: ●, R. temporaria; ○, L. vivipara; both with Y-axis up to 2000. Rare: ■, B. calamita; □, L. agilis, both with Y-axis up to 50.
Diversity 01 00067 g001
By contrast, the record patterns for the two rare species seemed more credible indicators of population trends than those for the widespread ones. There were no increase trends, and at least for B. calamita the 1948 record numbers were followed by consistently lower ones following a period when other evidence suggested this species probably experienced major declines [33]. Also, for both of the rare species the ratios of early:recent records were high during periods of likely substantive declines. For B. calamita, these ratios were 1.44 (pre-/post- 1947) and 2.70 (pre-/post- 1970), and for L. agilis the corresponding ratios were 1.22 and 1.67 respectively [28,29]. Validation of species identification, however, remained a critical concern for these recording schemes. This was quantifiable for the rare species by subsequent detailed investigation of every record and its site of origin. For B. calamita, errors accounted for an average (1963, 1973, old and new records; [28,29]) of nearly 17% of all published records while for L. agilis the average error estimate was as high as 33%. These levels of mistakes were greater in old records (averaging 30% for both species) than in newer ones (averaging 20%), but remained disconcertingly high. The mainstream species recording schemes, despite their increasing data sets, therefore proved unreliable as an approach to assess population trends for any of the British species.

3.3. Population Trends in Britain

Limitations of standard recording schemes for detecting population declines were first recognised about 40 years ago, especially for widespread species, when British herpetologists became aware that amphibian and reptile declines were occurring [34]. In addition to the complication of increasing recorder effort, presence/absence reporting at the scale of 10 × 10 km2 has low power for identifying declines or increases of initially very common organisms. Alternative approaches were therefore developed [22,32,33,34,35,36,37,38,39,40,41,42,43,44,45,46,47], including extensive use of questionnaire surveys, but also intensive fieldwork and estimates of habitat loss for the rare species (Table 5).
Questionnaire surveys, mostly to a standardized format, dominated widespread species studies and were distributed to as large a number of experienced naturalists (normally >100) as possible, widely spread across Britain. The (usually) subjective estimates of all these individuals (decline, no change, increase) were then pooled for statistical inferences of trend, which often turned out to be significant and of varying strength. In many cases regional differences in trends within Britain were also identified. On the basis of this evidence, referenced in Table 5, the two widespread anurans (R. temporaria and B. bufo) declined sharply during the 1950s/1960s. Declines ameliorated in the 1970s but, whereas R. temporaria showed signs of recovery after that, B. bufo entered another phase of sharper decline by the late 1980s, especially in the south and east of England. The two small newts (T. vulgaris and T. helveticus) showed generally minor declines, if any, during the 1970s and 1980s whereas the larger T. cristatus experienced strong early declines which were only partly ameliorated by the 1980s. The widespread reptiles fared at least as badly as the amphibians. Both lizards (L. vivipara and A. fragilis) underwent moderate declines in the 1970s and 1980s. Anguis fragilis may have subsequently stabilised, but there is no such evidence for L. vivipara and anecdotal accounts have indicated continuing declines of this species, at least in southern England. The two snakes have also declined, though apparently with different kinetics. Natrix natrix declines, initially severe, seem to have moderated while those of V. berus were apparently accelerating by the early 2000s.
Considering the heavy reliance on questionnaires to assess status changes of widespread species, there have been rather few attempts at validation of this method. It has, for example, been widely realised that no matter how carefully questions are worded, there may be a bias towards recording declines. However, assessing questionnaire results that indicated B. bufo declines [37], by visiting sites and talking to respondents, broadly supported the overall conclusion of relatively severe declines in southern and eastern England but nevertheless did suggest an exaggeration of decline extent [48]. Overall, questionnaire surveys have probably given a generally fair impression of population trends but this approach clearly lacks quantitative rigour.
Table 5. Evidence of amphibian and reptile status changes in Britain. For indices based on questionnaires, values <0.05 = no significant change; 0.05–0.15 = small change; 0.15–0.3 = medium change; >0.3 = major change.
SpeciesTimespanChangeEvidence typeReferences
R. temporaria1940–1970Major declineQuestionnaire[32]
1970–1980Small decline Questionnaire [35]
1980–1990Medium increaseQuestionnaire[36]
R. lessonae1990–2000ExtinctionFieldwork[22]
B. bufo1940–1970Major decline Questionnaire [32]
1970–1980Small decline Questionnaire [35]
1980–1990Small decline Questionnaire [36]
1985–2000Medium declineQuestionnaire[37]
1985–2003Major declinesRoad casualties[38]
B. calamita1900–1970Major decline Fieldwork/ [33]
1970–1999No changeliterature/ [ 39]
questionnaire
Fieldwork
T. vulgaris1970–1980Medium declineQuestionnaire [35]
1980–1990No changeQuestionnaire[36]
T. helveticus1970–1980Small decline Questionnaire [35]
1980–1990Small decline Questionnaire[36]
T. cristatus1950–1970Strong declineQuestionnaire[40]
1970–1980Strong decline Questionnaire [35]
1980–1990Medium declineQuestionnaire[36]
L. vivipara1970–1980Medium decline Questionnaire [35]
1980–1990 Medium declineQuestionnaire[36]
L. agilis1970–1987Strong declineFieldwork[41]
1800–2000Strong declineHabitat loss[42,43,44,45]
A. fragilis1970–1980Medium decline Questionnaire[35]
1980–1990Medium decline Questionnaire[36]
1980–2003No changeQuestionnaire/
fieldwork
[46]
N. natrix1970–1980Major decline Questionnaire[35]
1980–1990Medium decline Questionnaire[36]
V. berus1970–1980Small decline Questionnaire [36]
1980–1990Medium declineQuestionnaire[36]
1980–2003Major declineQuestionnaire/
fieldwork
[46]
C. austriaca1970–1987Minor declineFieldwork[47]
Because the four rare British species have always had a very restricted distribution, an alternative approach of directly monitoring a high proportion of all the populations has been attempted since the early 1970s and recorded in specialist databases (see Methods). Thus far, however, this method has proved most valuable for just two species, B. calamita and L. agilis. Rana lessonae was only recognised as a native species in the early 2000s, by which time it was already extinct [22], although currently the subject of a reintroduction attempt. Previously, all R. lessonae populations in Britain were considered recent introductions from mainland Europe, which indeed most of them (but not all) evidently were. Coronella austriaca is extremely secretive, and although subject to a one-off intensive survey in the 1980s [47], systematic monitoring of recent population trends has not yet been evaluated in Britain.
Although knowledge of B. calamita distribution at the 10 × 10 km2 scale was essentially complete by 1970 (Figure 1), intensive study discovered increasing numbers of individual populations within these squares for a further 20 years. The last new population was found in 1993 [39], and knowledge at this finest scale, as “number of occupied sites”, has almost certainly been complete since that time. These toad populations are monitored annually by local surveyors, who check for continued presence and also count the numbers of spawn strings as indicators of population size. Because the toads congregate at a finite number of ponds in spring, all of this is a relatively straightforward exercise. For the lizard L. agilis, monitoring is more difficult. Networks of artificial refugia (sheets of tin or roofing felt laid on the ground) efficiently attract some British reptiles, but L. agilis is not among them [49]. Surveying for L. agilis therefore requires multiple site visits under weather conditions likely to promote basking, usually in spring or early autumn, and direct counts of exposed animals. This is of course much less satisfactory as a quantitative estimate of population size than spawn string counts for B. calamita, since the proportion of a population basking, and/or seen even when exposed, varies much more unpredictably according to weather and observer skill. Changes in status of these two rare species, at the level of site occupancy, are summarised in Table 6. Total site numbers assume that those discovered since 1970 were always present. For B. calamita, the increasing number of sites (17% since 1970) reflects a surplus of successful translocations (i.e., those that have given rise to new, self-sustaining populations) over recent extinctions, though the latter have continued despite extensive conservation efforts and include failures of some translocations that initially looked promising (translocations that showed no signs of success are not included). However, this approach ignores changes of population size within sites, and therefore assumes all sites contribute equally to the species’ overall status. This is certainly not true but, even for B. calamita where spawn string counts have provided information on population sizes, it has proved difficult to obtain sufficiently comprehensive data for detailed analysis. Model-based statistical tests on spawn count data indicated that, at least during the 1990s, overall numbers of B. calamita in Britain probably did not change significantly [39]. For L. agilis the increase over recent decades was even more dramatic, a 35% increase in sites since the 1970s, mostly due to an extremely successful translocation programme. In this case, though, there are no data on changes in the overall lizard population size, which has probably decreased on numerous unmanaged sites.
Most recently, new approaches to monitoring amphibians and reptiles have been developed in the hope of providing robust quantitative estimates of change over time relative to a baseline. Work along these lines began during the 1990s in the Netherlands, focusing on a large number of locations spread across the country (Table 7). Observers (mostly volunteers) visited each site and recorded abundance of each species, following standard guidelines, on a scale from 0 (absent) to 3 (very common). Within a decade or so, statistically significant trends were detected for 11 of the 16 amphibians and for all seven reptiles native to the Netherlands [50,51]. Similar ventures were initiated elsewhere, such as the North American Amphibian Monitoring Program, primarily based on vocalisation surveys, instigated in 1997 [52]. In Britain, a National Amphibian and Reptile Recording Scheme (NARRS) was instigated in 2007 [53], mostly for the 10 widespread species though it is possible that both the rare reptiles (L. agilis and C. austriaca) will also be included. This is also based on a widely distributed site network and the use of skilled volunteers. Unlike the Netherlands scheme, however, it is based solely on presence/ absence records and site locations will be changed randomly over time to try and account for any new populations arising, perhaps in improving habitats. Otherwise, using purely absence/presence data, there would be a bias towards only detecting stability or decline. Relying on trends in site occupancy depends heavily on detection efficiency, and NARRS survey protocols are under development based on occupancy modelling [54] with field data from a range of experimental study sites.
Table 6. Changes of status in Britain of B. calamita and L. agilis. Local extinctions and translocations are the number in each decade.
1970-19791980-19891990-19992000-2009
B. calamita
Total sites42444749
Extinctions 0426*
Translocations0658
L. agilis
Total sites8993110120
Extinctions22231
Translocations762011
*Includes 3 previous translocations; only translocations with second-generation successful breeding are included.
Table 7. Site network systems for species monitoring.
CountryStart dateCoverage
(no. species)
Coverage (geographical)Measurement
Netherlands1997 amphibians
1994 reptiles
16 amphibians7 reptiles320 areas
>500 areas
Presence and abundance
Britain (NARRS)2007 amphibians 2007 reptiles5 amphibians
6 reptiles
400 ponds
400 1 km2
Presence

3.4. Reasons for Amphibian and Reptile Declines

European amphibian and reptile assessments [13,14] quantified factors impacting negatively on both taxonomic groups, as summarised in Table 8. Intrinsic factors, which might predispose extinction in a general evolutionary context, were potentially relevant for a substantial fraction of the threatened species, mostly those with very restricted distributions in specialised habitats. Anthropogenic influences were clearly the most important, however, and habitat loss was identified as the main cause of decline in all cases. Other important factors were invasive species, especially impacting on widespread species of both amphibians and reptiles; pollution/climate change were also identified as having a major impact, especially for amphibians. Invasive species included pathogens such as B. dendrobatidis, which has had serious effects in tropical regions but, thus far at least, rather limited ones (mostly in Spain) within Europe [55]. Accidental deaths (road kills etc.), disturbance and persecution (especially of snakes) were apparently much more relevant for reptiles than for amphibians. Overall comparisons of the percentages of amphibians and reptiles threatened by the factors listed in Table 8 indicated no significant differences between the two groups (Wilcoxon signed rank test P = 0.191). A dominant role for habitat loss reflects the global situation, at least for amphibians [2] and very likely for reptiles when the facts are known. Certainly this is true of Britain, where agricultural intensification in particular reduced population sizes of the widespread species from the mid 20th century onwards, and most sharply during the 1950s and 1960s [32,34,35,36,40]. Habitat loss effects have, however, been context dependent with respect to timing and were manifest much earlier in highly populated, developed regions such as Europe than in areas retaining extensive unfarmed wilderness [56]. Dramatic losses of the heath and coastal dune habitats of three of the rare species (B. calamita, L. agilis and C. austriaca), mostly for urban development and pine plantations, were also the dominant factors in their declines [33,41,42,43,44,45,47,57]. In Britain, though, accidental deaths (road kills) are much more often reported for amphibians than for reptiles. Indeed, one study of B. bufo declines was based on counting numbers of road casualties [38]. Disturbance and persecution are, however, problems especially for reptiles in Britain just as elsewhere in Europe and may be contributing particularly to recent declines of V. berus [46].
Despite much effort and a lot of convincing evidence, substantial uncertainties remain about the importance of some proximal causes of amphibian and reptile declines in Britain. Some of these are summarised in Table 9. They indicate a continuously changing situation in which new threats, such as inbreeding depression in increasingly isolated small populations, require constant vigilance and often new responses by conservation biologists. Table 9 includes some very recent concerns for which, as yet, only preliminary data are available (notably a possible link between chytrid infection and declines of some B. calamita populations, and the disappearance of L. agilis in an area where non-native P. muralis has recently become common). Even this is not the whole story. In the Netherlands there are data that show L. vivipara, unlike the other native reptiles, has recently declined very fast for unknown reasons [51] and there are suspicions of similar declines in southern England.
Virtually all of these proximal causes are due, in one way or another, to human activities. A fundamental reason for most of them is increased pressure on the environment by humans, which in turn can be related to human numbers. In Europe, amphibians and reptile (herpetofauna) and bird declines correlated significantly (r = 0.719, P = 0.004 and r = 0.792, P = <0.001 respectively) with human population density [61] as shown in Figure 2.
Figure 2. Human population density and wildlife declines. ●, herpetofauna (amphibians and reptiles combined); ○, birds. A, Austria; B, Belgium; CH, Switzerland; D, Germany; DM, Denmark; ES, Spain; F, France; GB, Britain; I, Italy; IR, Ireland; N, Norway; NL, Netherlands; P, Portugal; SW, Sweden. Reproduced with permission from [61].
Diversity 01 00067 g002

4. Discussion

4.1. Amphibian and Other Declines

It is increasingly clear that, at least in Europe, amphibian declines are not in a class of their own but share a high rate with some other vertebrates. As well as reptiles, fishes may also be in severe difficulties but by 2008 only about 11% of the estimated 30,700 species were evaluated globally. It is therefore premature to generalise about them, especially as many marine species are extraordinarily difficult to assess. Even so, it is notable that of the 11% thus far investigated, 37% were considered threatened [12]—an even higher proportion than for amphibians or reptiles. Moreover, a comprehensive study of European freshwater fishes in conjunction with the IUCN indicated an almost identical estimate (38%) of threatened species (200 out of 522) and, unlike either amphibians or reptiles in Europe, some species are already extinct [62]. Perhaps these results, removing amphibians from the pinnacle of catastrophic declines, is not too surprising. It has been apparent for some time that the main hypothesised extra risk factors for amphibians, such as permeable skins and dual habitat requirements, have not been supported by empirical studies and that amphibians are not especially good indicators of environmental health (e.g., [4,63,64]). What, then, accounts for the high vulnerabilities of the three ectothermic groups compared with the two endothermic ones? Comparisons of relative risk factors for European terrestrial mammals [12] with those for amphibians and reptiles, using the categories listed in Table 8, may provide clues. Although those for amphibians and reptiles were not significantly different, relative threat factors were almost significantly different for mammals and amphibians (Wilcoxon signed rank test P = 0.065) and were significantly different for mammals and reptiles (P = 0.01). While still the most important factor, habitat loss has impacted a smaller proportion of European mammal species (46%) than of amphibians or reptiles. The same is true, but to a lesser extent, of most of the other factors (with the exceptions of native population dynamics and disturbance). It seems possible that ectotherms may, on average, be more vulnerable to habitat change than endotherms perhaps because ectothermic physiology is more heavily constrained by environmental temperature regimes, which in turn impose constraints on tolerable habitat structures and migration routes. In addition many amphibians, as well as fish and some reptiles, depend on high quality freshwater and such habitats are among the most threatened all over the world [65]. However, there may be no simple answers to this question. With mammals, for example, major predictors of extinction risk vary widely across the class and interact differently according to life history and other ecological factors [66]. Focusing attention on vertebrates in any case ignores problems, which may be more severe, with much more numerous and species-rich taxa such as plants and invertebrates. In Britain, and elsewhere, declines in all these groups have been very substantial (e.g., [67]).
Table 8. Major causes of European amphibian and reptile declines [12,13]. Numbers are of species; Amphibians, n = 83 total, 19 threatened; Reptiles n = 139 total, 27 threatened. Brackets = % of respective totals. “Native population dynamics” = changes in levels of predation, competition, hybridisation. “Intrinsic factors” = body size, fecundity, specialisation, range. Invasives include pathogens (chytrid fungus etc). Some species have no doubt been affected by more than one of the factors listed.
Taxonomic groupHabitat lossInvasivesHarvestingAccidents Persecution
Amphibians77(92)40(48)22(26)3(4)0
Threatened17(89)5(26)6(32)1(1)0
Reptiles 98(71)22(16)36(26)28(20)35(25)
Threatened22(81)9(33)16(60)4[15)4(15)
Taxonomic groupPollution/
climate change
Native population
dynamics
Intrinsic factorsDisturbance
Amphibians62(75)11(13)26(31)5(6)
Threatened10(53)3(16)12(63)4(21)
Reptiles 34(24)8(6)22(16)16(13)
Threatened10(37)2(7)10(37)8(30)
Table 9. Other factors influencing British amphibian and reptile declines.
SpeciesFactorLikely impactReferences
B. bufo(1) Road mortalityMinor/moderate[37,38,48]
(2) Changes in habitat managementModerate[37]
(3) Climate change reducing female fecundity and survivalMinor/moderate[58]
B. calamita(1) Pond acidificationMinor[59]
(2) Competition from B. bufo after habitat changeSevere[57]
(3) Inbreeding in isolated populationsMinor[60]
(4) Chytrid infectionUncertainUnpublished
R. lessonaeChanges in habitat management and water abstraction levelsSevere[22]
V. berusHabitat fragmentation and inbreeding effectsModerate[46]
L. agilisCompetition with introduced lizards (Podarcis muralis)MinorUnpublished

4.2. Trend Detection and the British Experience

Underpinning all the efforts of conservation biologists to understand population declines is a requirement for robust, quantifiable data. The history of such data acquisition in Britain extends over about 150 years. Despite an impoverished herpetofauna with a mere 14 native species of amphibians and reptiles to investigate, and a relatively high human population density providing an active herpetological research community, obtaining reliable data has been a protracted (indeed ongoing) and complex task. There are several facets to the problem. Methods for detecting each species must be effective but as simple as possible to use on a large scale, for example by networks of trained volunteers. In general these methods have improved over time and involve systematic direct observations (including vocalisations, 52) assisted by various types of capture apparatus such as nets, bottle-traps and artificial refugia [68]. Then there are strategic, essentially statistical issues concerning geographical coverage and, especially, establishing confidence limits on the reliability of negative observations (i.e., if a species is not found, is it really absent?). Application of occupancy modeling [54] is increasingly valuable in this context, and has been pioneered in Switzerland for European amphibians and reptiles (e.g., [69,70]).
With the possible exceptions of B. calamita and L. agilis in Britain, for which there are sound data extending back about 30 years, practical and theoretical advances have thus far only produced credible quantitative data on trends in amphibian and reptile populations within the past 10–15 years, for example in the Netherlands [50,51]. New programmes, such as the NARRS in Britain [53], at last offer the prospect of systematic, reliable trend-recording in future decades. The amount of effort required to achieve this goal is very considerable even for relatively affluent, well-resourced countries. All of this raises questions about the accuracy of accounts of species declines and extinctions in large areas of tropical rainforests where survey and monitoring cannot often apply such rigour. There certainly have been well-documented declines and extinctions in these places, but we should be particularly cautious about allegations of extinction. This concern is reinforced by recent (since 2006) reports of “rediscovered” frogs previously considered to be casualties of chytrid fungus infection, including the tree frog Isthmohyla rivularis in Costa Rica, four species of harlequin frogs (Atelopus carrikeri, A. laetissimus, A. nahumae and A. sonsonensis) in Columbia, and the armoured mistfrog (Litoria lorica) in Australia, all featuring in recent web-news reports.

4.3. Research Needs and Future Prospects

Where declines are rapid and dramatic, as is often the case with amphibians in tropical regions infested with B. dendrobatidis, existing well-tried methods are adequate to demonstrate them. Thus, in Panama, intensive transect observations were sufficient to document declines of eight families of frogs and salamanders [71], and rapid declines of the stream frog Craugastor punctariolus in the same country were affirmed using capture-mark-recapture studies as the disease moved through a specific population [72]. Where declines are slower, however, and especially where widespread species are involved, novel strategies likely to generate robust evidence as quickly as possible are required. This requires an initial consideration of statistical power, since the larger the number of populations monitored, the more rapidly will shallow trends be convincingly demonstrated. Occupancy modeling, monitoring presence or absence (and maybe also abundance) at networks of sites with high confidence limits has been developed for amphibians and reptiles and increasingly applied in the field [50,51,54]. These procedures vary in important detail among species and localities, and because most declines apart from chytrid-mediated ones are relatively slow, the necessary research to accomplish this would benefit many future studies around the world.
Since the role of B. dendrobatidis in the numerous, previously “enigmatic” amphibian declines is becoming better understood (e.g., [73,74]), it is probably fair to say that general factors accounting for the vast majority of declines are known, as summarised in Table 8. Of course there is much more to learn about the details of many of these causes, including chytridiomycosis. Unfortunately, though, the history of wildlife disease control, excepting the relatively few situations where vaccination is possible, is not encouraging. Thus despite substantive efforts to reduce spread, Britain’s native crayfish Austropotamobius pallipes continues to decline as a result of infection by the fungus Aphanomyces astaci, and red squirrels Sciurus vulgaris are similarly under ongoing attack from squirrel parapoxvirus [75,76]. Research may therefore be better prioritised towards optimising conservation management, especially habitat restoration, for amphibian and reptile populations. This approach has been shown to ameliorate or reverse population declines in many cases, including for B. calamita and L. agilis in Britain [77,78]. Creation of new ponds, in suitable habitat, can be a very effective way of conserving amphibians [79]. The recently developed robust monitoring protocols have revealed similar management successes for several species, within a decade, in the Netherlands [50,51].
By definition, conservation biology is an applied science with a responsibility for political lobbying close to its heart. However effectively we learn to conserve amphibian and reptile populations by targeted research programmes, failure to confront the overriding causes may predispose failure in the longer term. Ever more demanding land use, especially for food production, underpinned most of the amphibian and reptile declines in developed countries such as Britain in the mid 20th century [61]. These pressures are set to re-intensify around the world as the human population continues its upward spiral in the 21st century. Most of the big environmental issues of the day, including climate change, are rooted in the unsustainability of escalating human numbers. Ranking taxonomic groups according to their rates of decline and extinction is of marginal interest relative to this underlying cause of the biodiversity crisis. Surely only a long-overdue political will to address this question, in developed as well as developing countries, holds out any long-term hope for biodiversity conservation.

References and Notes

  1. Wake, D.B. Declining amphibian populations. Science 1991, 253, 860. [Google Scholar] [PubMed]
  2. Stuart, S.N.; Chanson, J.S.; Cox, N.A.; Young, B.E.; Rodrigues, A.S.L.; Fischmann, D.L.; Waller, R.W. Status and trends of amphibian declines and extinctions worldwide. Science 2004, 306, 1783–1786. [Google Scholar] [CrossRef] [PubMed]
  3. Collins, J.P.; Storfer, A. Global amphibian declines: sorting the hypotheses. Divers. Distrib. 2003, 9, 89–98. [Google Scholar] [CrossRef]
  4. Beebee, T.J.C.; Griffiths, R.A. The amphibian decline crisis: a watershed for conservation biology? Biol. Conserv. 2005, 125, 271–285. [Google Scholar] [CrossRef]
  5. Pounds, J.A.; Bustamante, M.R.; Coloma, L.A.; Consuegra, J.A.; Fogden, M.P.L.; Foster, P.N.; La Marca, E.; Masters, K.L.; Merino-Viteri, A.; Puschendorf, R.; Ron, S.R.; Sánchez-Azofeifa, G.A.; Still, C.J.; Young, B.E. Widespread amphibian extinctions from epidemic disease driven by global warming. Nature 2006, 439, 161–167. [Google Scholar] [CrossRef] [PubMed]
  6. Daszak, P.; Cunningham, A.A.; Hyatt, A.D. Infectious disease and amphibian population declines. Divers. Distrib. 2003, 9, 141–150. [Google Scholar] [CrossRef]
  7. Hopkins, W.A. Amphibians as models for studying environmental change. Ilar. J. 2007, 48, 270–277. [Google Scholar] [CrossRef] [PubMed]
  8. Griffiths, R.A.; Pavajeau, L. Captive breeding, reintroduction, and the conservation of amphibians. Conserv. Biol. 2008, 22, 852–861. [Google Scholar] [CrossRef] [PubMed]
  9. Beebee, T.J.C. Amphibian decline? Nature 1992, 355, 120. [Google Scholar] [CrossRef]
  10. McKinney, M.L. High rates of extinction and threat in poorly studied taxa. Conserv. Biol. 1999, 13, 1273–1281. [Google Scholar] [CrossRef]
  11. Pechmann, J.H.K.; Scott, D.E.; Semlitsch, R.D.; Caldwell, J.P.; Vitt, L.J.; Gibbons, J.W. Declining amphibian populations: the problem of separating human impacts from natural fluctuations. Science 1991, 253, 892–895. [Google Scholar] [CrossRef] [PubMed]
  12. Available online: www.IUCN.org (accessed 21 September, 2009).
  13. Temple, H.J.; Cox, N.A. European Red List of Amphibians; Cambridge Publications: Cambridge, UK, 2009. [Google Scholar]
  14. Cox, N.A.; Temple, H.J. European Red List of Reptiles; Cambridge Publications: Cambridge, UK, 2009. [Google Scholar]
  15. Collins, J.P.; Halliday, T.R. Forecasting changes in amphibian biodiversity: aiming at a moving target. Phil. Trans. Roy. Soc. B–Biol. Sci. 2005, 360, 309–314. [Google Scholar]
  16. Gibbons, J.W.; Scott, D.E.; Ryan, T.J.; Buhlmann, K.A.; Tuberville, T.D.; Metts, B.S.; Greene, J.L.; Mills, T.; Leiden, Y.; Poppy, S.; Winne, C.T. The global decline of reptiles, déjà vu amphibians. BioScience 2000, 50, 653–666. [Google Scholar] [CrossRef]
  17. Schipper, J.; Chanson, J.S.; Chiozza, F.; Cox, N.A.; Hoffmann, M.; Katariya, V.; Lamoreux, J.; Rodrigues, A.S.L.; Stuart, S.N.; Temple, H.J.; et al. The status of the world’s land and marine mammals: diversity, threat and knowledge. Science 2008, 322, 225–230. [Google Scholar] [CrossRef] [PubMed]
  18. ekercioğlu, C.; Daily, G.C.; Ehrlich, P.R. Ecosystem consequences of bird declines. Proc. Nat. Acad. Sci. USA 2004, 101, 18042–18047. [Google Scholar] [CrossRef] [PubMed]
  19. Harris, S.; Yalden, D.W. Mammals of the British Isles: Handbook, 4th ed.; The Mammal Society: Southampton, UK, 2008. [Google Scholar]
  20. Mayer, W.; Bischoff, W. Beitrage zur taxonomischen revision der gattung Lacerta (Reptilia: Laceridae).1. Zootoca, Omanosaura, Timon and Tiera als eigenstandige gattungen. Salamandra 1996, 32, 163–170. [Google Scholar]
  21. Frost, D.R.; Grant, T.; Faivovich, J.; Bain, R.H.; Haas, A.; Haddad, C.F.B.; Desa, R.O.; Channing, A.; Wilkinson, M.; Donnellan, S.C.; Raxworthy, C.J.; Campbell, J.A.; Blotto, B.L.; Moler, P.; Derwes, R.C.; Nussbaum, R.A.; Lynch, J.D.; Green, D.M.; Wheeler, W.C. The amphibian tree of life. Bull. Am. Mus. Nat. Hist. 2006, 297, 1–370. [Google Scholar] [CrossRef]
  22. Beebee, T.J.C.; Buckley, J.; Evans, I.; Foster, J.P.; Gent, A.H.; Gleed-Owen, C.P.; Kelly, G.; Rowe, G.; Snell, C.; Wycherley, J.T.; Zeisset, E. Neglected native or undesirable alien? Resolution of a conservation dilemma concerning the pool frog. Rana lessonae. Biodivers. Conser. 2005, 14, 1607–1626. [Google Scholar] [CrossRef]
  23. Bell, T. A History of British Reptiles, 2nd ed.; J. Van Voorst: London, UK, 1869. [Google Scholar]
  24. Cooke, M.C. Our Reptiles and Batrachians; W.H. Allen & Co.: London, UK, 1893. [Google Scholar]
  25. Leighton, G.R. The Life-History of British Serpents; Blackwood & Sons: London, UK, 1901. [Google Scholar]
  26. Leighton, G.R. British Lizards; Blackwood & Sons: London, UK, 1903. [Google Scholar]
  27. Taylor, R.H.R. The distribution of reptiles and amphibia in the British Isles, with notes on species recently introduced. Brit. J. Herpetol. 1948, 1, 1–38. [Google Scholar]
  28. Taylor, R.H.R. The distribution of amphibians and reptiles in England and Wales, Scotland and Ireland and the Channel Islands: a revised survey. Brit. J. Herpetol. 1963, 3, 95–115. [Google Scholar]
  29. Arnold, H.R. Provisional Atlas of the Amphibians and Reptiles of the British Isles; Biological Records Centre: Abbots Ripton, UK, 1973. [Google Scholar]
  30. Arnold, H.R. Distribution Maps of the Amphibians and Reptiles of the British Isles; Biological Records Centre: Abbots Ripton, UK, 1983. [Google Scholar]
  31. Arnold, H.R. Atlas of Amphibians and Reptiles in Britain; ITE Research Publication 10; HMSO: London, UK, 1996.
  32. Cooke, A.S. Indications of recent changes of status in the British Isles of the frog (Rana temporaria) and the toad (Bufo bufo). J. Zoo. (London) 1972, 167, 161–178. [Google Scholar] [CrossRef]
  33. Beebee, T.J.C. The natterjack toad (Bufo calamita) in the British Isles: a study of past and present status. Brit. J. Herpetol. 1976, 5, 515–521. [Google Scholar]
  34. Prestt, I.; Cooke, A.S.; Corbett, K.F. British Amphibians and Reptiles. In The Changing Flora and Fauna of Britain; Hawksworth, D.L., Ed.; Academic Press: London, UK, Systematics Association Special Volume No. 6.
  35. Cooke, A.S.; Scorgie, H.R.A. The Status of the Commoner Amphibians and Reptiles in Britain; Nature Conservancy Council: Peterborough, UK, 1983; Focus on Nature Conservation 3. [Google Scholar]
  36. Hilton-Brown, D.; Oldham, R.S. The Atatus of the Widespread Amphibians and Reptiles in Britain, 1990, and Changes during the 1980’s; Nature Conservancy Council: Peterborough, UK, 1991; Nature Conservancy Council Contract Survey 131. [Google Scholar]
  37. Carrier, J-A.; Beebee, T.J.C. Recent, substantial and unexplained declines of the common toad Bufo bufo in lowland England. Biol. Conserv. 2003, 111, 395–399. [Google Scholar] [CrossRef]
  38. Cooke, A.S.; Sparks, T.H. Population declines of common toads (Bufo bufo): the contribution of road traffic and monitoring value of casualty counts. Brit. Herpetol. Soc. Bull. 2004, 88, 13–26. [Google Scholar]
  39. Buckley, J.; Beebee, T.J.C. Monitoring the conservation status of an endangered amphibian: the natterjack toad Bufo calamita in Britain. Anim. Conserv. 2004, 7, 221–228. [Google Scholar] [CrossRef]
  40. Beebee, T.J.C. Changes in status of the great crested newt Triturus cristatus in the British Isles. Brit. J. Herpetol. 1975, 5, 481–490. [Google Scholar]
  41. Corbett, K.F. Distribution and status of the sand lizard, Lacerta agilis agilis, in Britain. Mertensiella 1988, 1, 92–99. [Google Scholar]
  42. Moore, N.W. The heaths of Dorset and their conservation. J. Ecol. 1962, 50, 369–391. [Google Scholar] [CrossRef]
  43. Jackson, H.C. The decline of the sand lizard, Lacerta agilis L. population on the sand dunes of the Merseyside coast, England. Biol. Conserv. 1979, 15, 177–193. [Google Scholar]
  44. Webb, N. Changes on the heathlands of Dorset, England between 1978 and 1987. Biol. Conserv. 1990, 51, 273–286. [Google Scholar] [CrossRef]
  45. Rose, R.J.; Webb, N.R.; Clarke, R.T.; Traynor, C.H. Changes on the heathland in Dorset, England, between 1987 and 1996. Biol. Conserv. 2000, 93, 117–125. [Google Scholar] [CrossRef]
  46. Baker, J.; Suckling, J.; Carey, R. Status of the Adder Vipera Berus and Slow-Worm Anguis Fragilis in England; English Nature: Peterborough, UK, 2004; English Nature Research report 546. [Google Scholar]
  47. Braithwaite, A.C.; Buckley, J.; Corbett, K.F.; Edgar, P.W.; Haslewood, E.S.; Haslewood, G.A.D.; Langton, T.E.S.; Whitaker, W.J. The distribution in England of the smooth snake (Coronella austriaca Laurenti). Herpetol. J. 1989, 1, 370–376. [Google Scholar]
  48. Young, S.L.; Beebee, T.J.C. An Investigation of Recent Declines in the Common Toad Bufo Bufo; English Nature: Peterborough, UK, 2004; English Nature Research Report 584. [Google Scholar]
  49. Reading, C.J. A proposed standard method for surveying reptiles on dry lowland heath. J. Appl. Ecol. 1997, 34, 1057–1069. [Google Scholar] [CrossRef]
  50. Goverse, E.; Smit, G.; van der Meij, T. 10 Years of Amphibian Monitoring in the Netherlands: Preliminary Results. In Proceedings of the 14th European Congress of Herpetology, Porto, Portugal; 2007. [Google Scholar]
  51. Zuiderwijk, A.; Janssen, I. Results of 14 Years Reptile Monitoring in the Netherlands. In Proceedings of the 6th World Congress of Herpetology, Manaus, Brazil; 2008. [Google Scholar]
  52. Weir, L.A.; Royle, J.A.; Nanjappa, P.; Jung, R.E. Modeling anuran detection and site occupancy on North American amphibian monitoring program (NAAMP) routes in Maryland. J. Herpetol. 2005, 39, 627–639. [Google Scholar]
  53. Available online: http://www.narrs.org.uk (accessed 21 September, 2009).
  54. MacKenzie, D.I.; Nichols, J.D.; Lachman, G.B.; Droege, S.; Royle, J.A.; Langtim, C.A. Estimating site occupancy rates when detection probabilities are less than one. Ecology 2002, 83, 2248–2255. [Google Scholar] [CrossRef]
  55. Bosch, J.; Carrascal, L.M.; Durán, L.; Walker, S.; Fisher, M.C. Climate change and outbreaks of amphibian chytridiomycosis in a montane area of central Spain: is there a link? Proc. Roy. Soc. B–Biol. Sci. 2007, 274, 253–260. [Google Scholar]
  56. Houlahan, J.E.; Findlay, C.S.; Schmidt, B.R.; Meyer, A.H.; Kuzmin, S.L. Quantitative evidence for global amphibian population declines. Nature 2000, 404, 752–755. [Google Scholar] [CrossRef] [PubMed]
  57. Beebee, T.J.C. Environmental change as a cause of natterjack toad (Bufo calamita) declines in Britain. Biol. Conserv. 1977, 11, 87–102. [Google Scholar] [CrossRef]
  58. Reading, C.J. Linking global warming to amphibian declines through its effects on female body condition and survivorship. Oecologia 2007, 151, 125–131. [Google Scholar] [CrossRef] [PubMed]
  59. Beebee, T.J.C.; Flower, R.J.; Stevenson, A.C.; Patrick, S.T.; Appleby, P.G.; Fletcher, C.; Marsh, C.; Natkanski, J.; Rippey, B.; Battarbee, R.W. Decline of the natterjack toad (Bufo calamita) in Britain: Palaeoecological, documentary and experimental evidence for breeding site acidification. Biol. Conserv. 1990, 53, 1–20. [Google Scholar] [CrossRef]
  60. Rowe, G.; Beebee, T.J.C. Population on the verge of a mutational meltdown? Fitness costs of genetic load for an amphibian in the wild. Evolution 2003, 57, 177–181. [Google Scholar] [CrossRef] [PubMed]
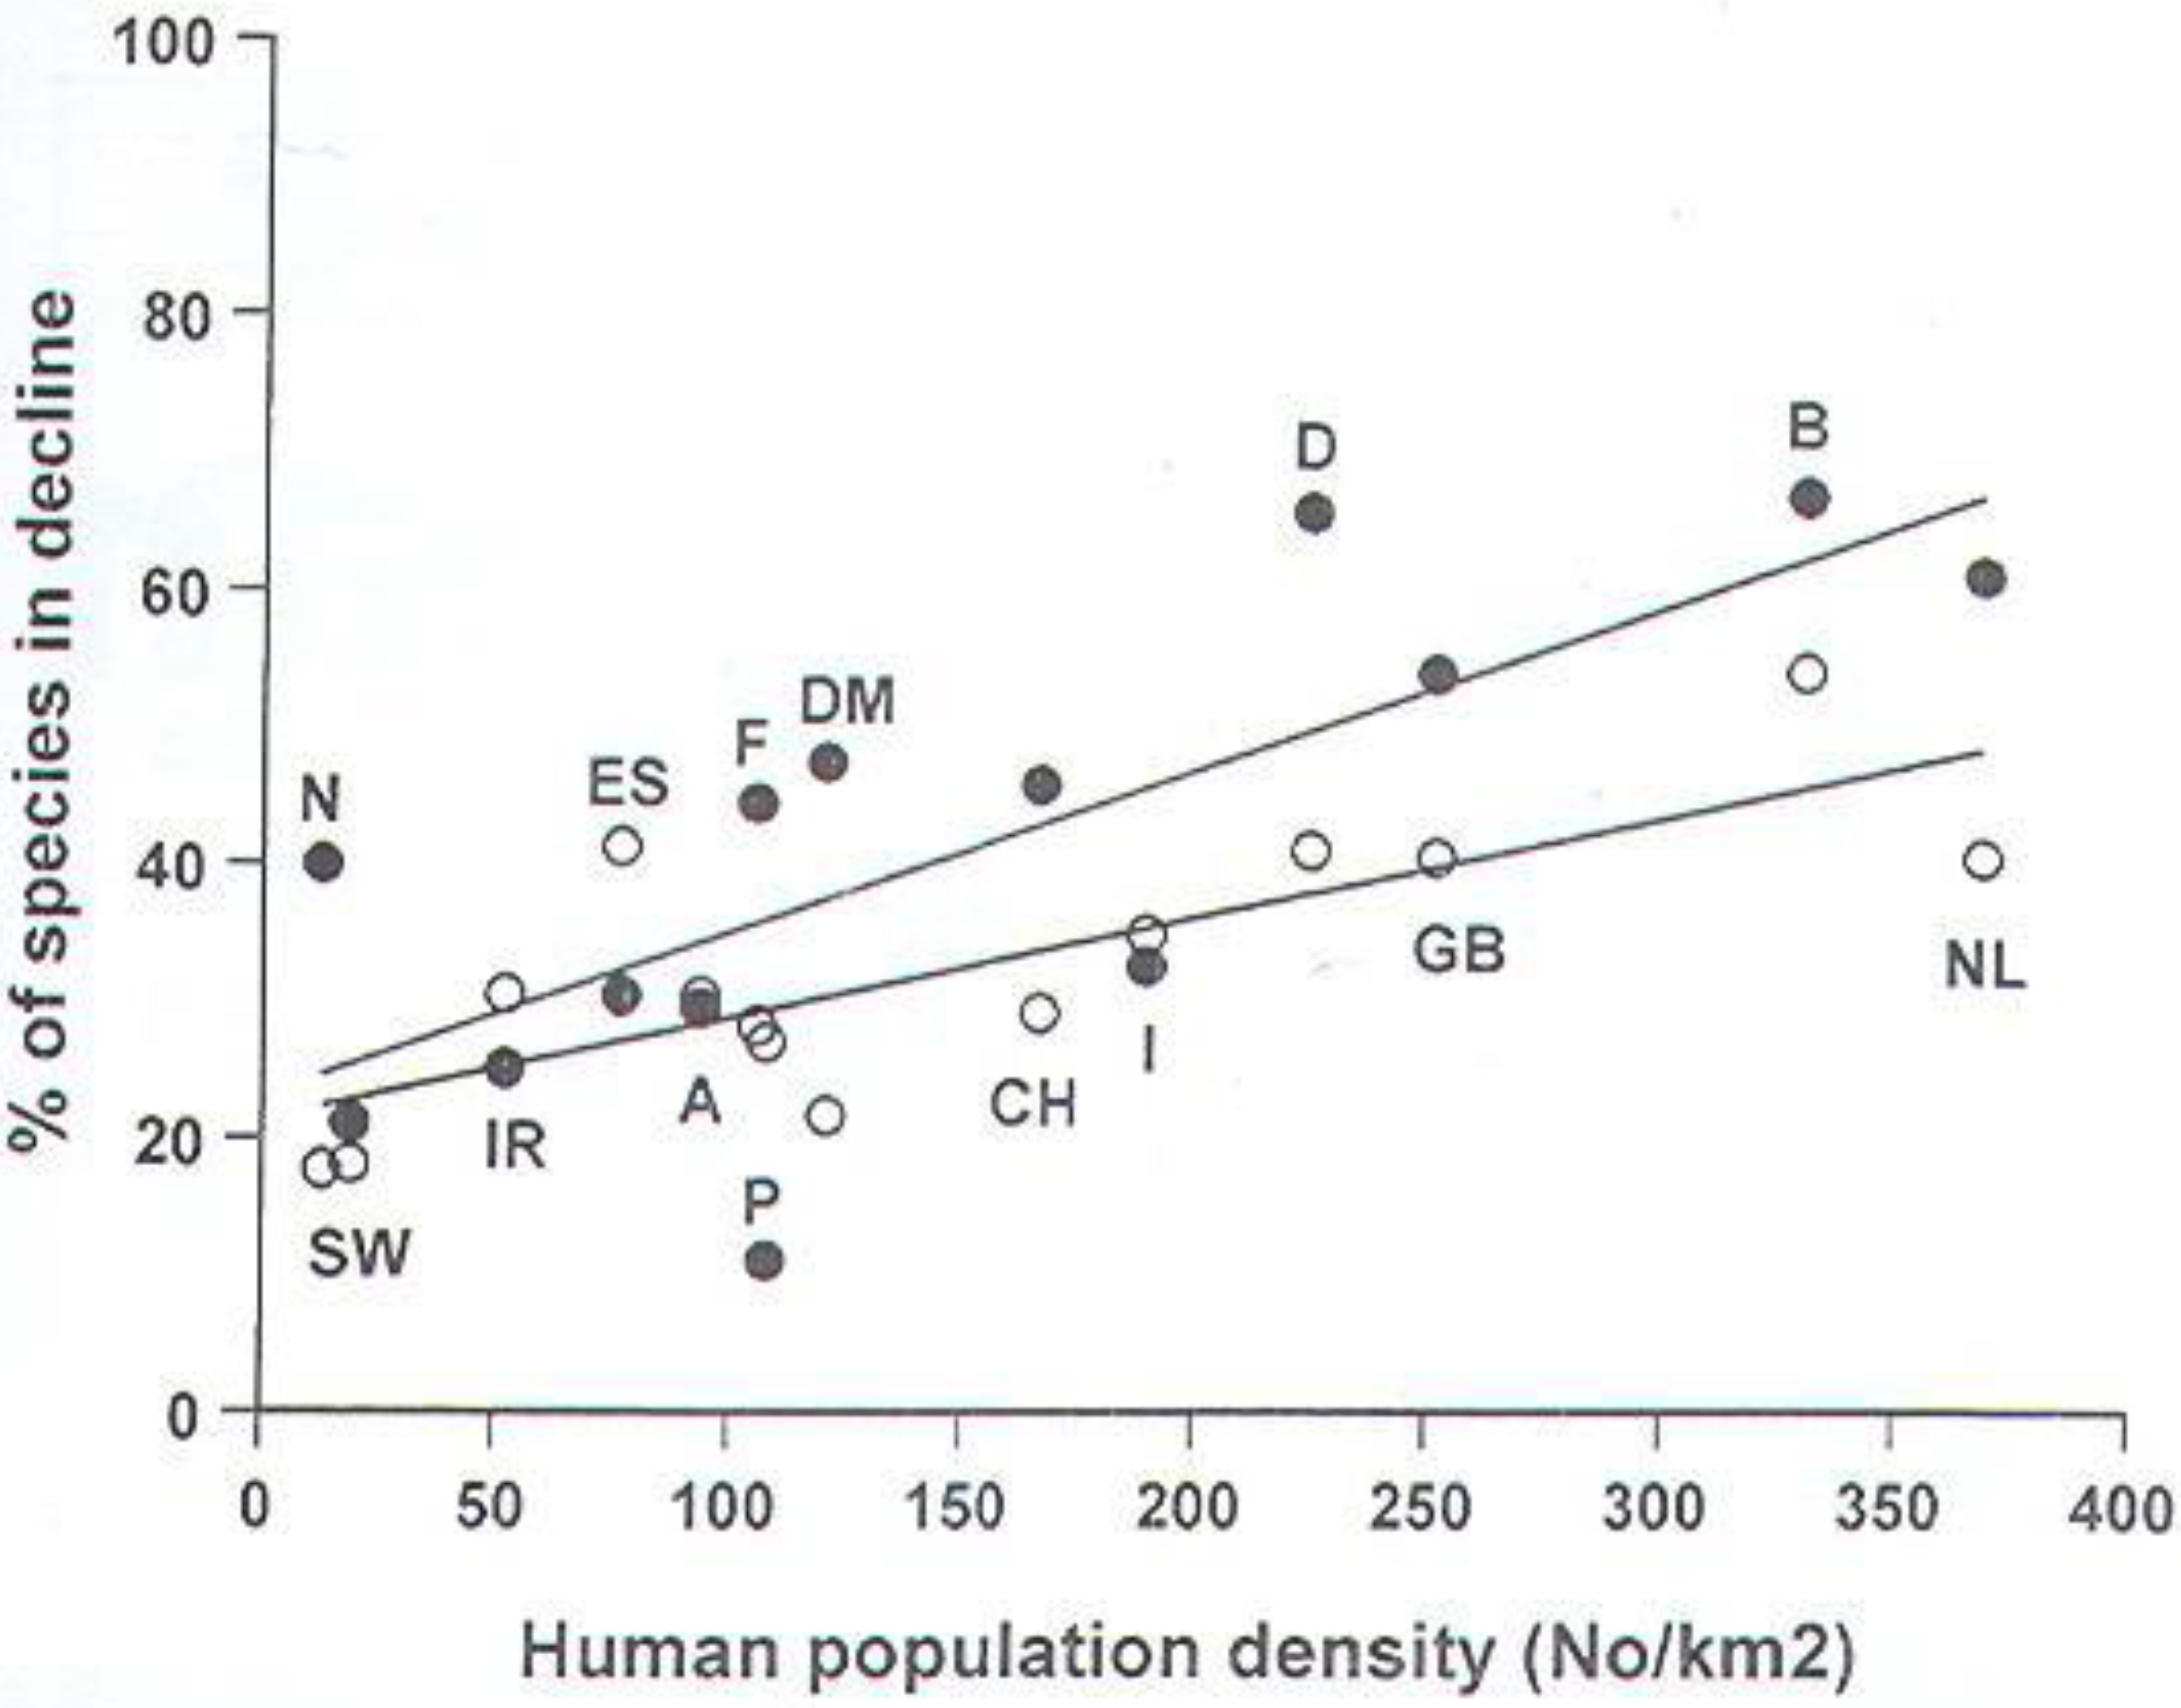
  61. Beebee, T.J.C. British wildlife and human numbers: the ultimate conservation issue? Brit. Wildlife 2001, 13, 1–8. [Google Scholar]
  62. Kotterat, M.; Freyhof, J. Handbook of European Freshwater Fishes; IUCN: Gland, Swiss, 2007. [Google Scholar]
  63. Hall, R.J.; Henry, P.F.P. Assessing the effects of pesticides on amphibians and reptiles: status and needs. Herpetol. J. 1992, 2, 65–71. [Google Scholar]
  64. Lawler, J.J.; White, D.; Sifneos, J.C.; Master, L.L. Rare species and the use of indicator groups for conservation planning. Conserv. Biol. 2003, 17, 875–882. [Google Scholar] [CrossRef]
  65. Dudgeon, D.; Arthrington, A.H.; Gessner, M.O.; Kawabata, Z.I.; Knowler, J.D.; Leveque, C.; Naiman, R.J.; Prieur-Richard, A.H.; Soto, D.; Stiassny, M.L.J.; Sullivan, C.A. Freshwater biodiversity: importance, threats, status and conservation challenges. Biol. Rev. 2006, 81, 163–182. [Google Scholar]
  66. Davidson, A.D.; Hamilton, M.J.; Boyer, A.G.; Brown, J.H.; Ceballos, G. Multiple ecological pathways to extinction in mammals. Proc. Nat. Acad. Sci. USA 2009, 106, 10702–10705. [Google Scholar] [CrossRef] [PubMed]
  67. Thomas, J.A.; Telfer, M.G.; Roy, D.B.; Preston, C.D.; Greenwood, J.J.D.; Aher, J.; Fox, R.; Clarke, R.T.; Lawton, J.H. Comparative losses of British butterflies, birds and plants and the global extinction crisis. Science 2004, 303, 1879–1881. [Google Scholar] [CrossRef] [PubMed]
  68. Gent, T.; Gibson, S. Herpetofauna Workers’ Manual; Joint Nature Conservation Committee: Peterborough, UK, 1998.
  69. Pellet, J.; Schmidt, B.R. Monitoring distributions using call surveys: estimating site occupancy, detection probabilities and inferring absence. Biol. Conser. 2005, 123, 27–35. [Google Scholar] [CrossRef]
  70. Kéry, M.; Schmidt, B.R. Imperfect detection and its consequences for monitoring for conservation. Community Ecol. 2008, 9, 207–216. [Google Scholar] [CrossRef] [Green Version]
  71. Lips, K.R.; Brem, F.; Brenes, R.; Reeve, J.D.; Alford, R.A.; Voyles, J.; Carey, C.; Livo, L.; Pessier, A.P.; Collins, J.P. Emerging infectious disease and the loss of biodiversity in a neotropical amphibian community. Proc. Nat. Acad. Sci. USA 2006, 103, 3165–3170. [Google Scholar] [CrossRef] [PubMed]
  72. Ryan, M.J.; Lips, K.R.; Eichholz, M.W. Decline and extirpation of an endangered Panamanian stream frog population (Craugastor punctariolus) due to an outbreak of cytridiomycosis. Biol. Conserv. 2008, 141, 1636–1647. [Google Scholar] [CrossRef]
  73. Bosch, J.; Carrascal, L.M.; Durán, L.; Walker, S.; Fisher, M.C. Climate change and outbreaks of amphibian chytridiomycosis in a montane area of central Spain: is there a link? Proc. Roy. Soc. B–Biol. Sci. 2006, 274, 253–260. [Google Scholar]
  74. Rodder, D.; Veith, M.; Loetters, S. Environmental gradients explaining the prevalence and intensity of infection with the amphibian chytrid fungus: the host’s perspective. Anim. Conserv. 2008, 11, 513–517. [Google Scholar] [CrossRef]
  75. Holdich, D.; Sibley, P.; Peay, S. The white-clawed crayfish—a decade on. Brit. Wildlife 2004, 16, 153–164. [Google Scholar]
  76. Rushton, S.P.; Lurz, P.W.W.; Gurnell, J.; Nettleton, P.; Bruemmer, C.; Shirley, M.D.F.; Sainsbury, A.W. Disease threats posed by alien species: the role of a poxvirus in the decline of the native red squirrel in Britain. Epidemiol. Infect. 2006, 134, 521–533. [Google Scholar] [CrossRef] [PubMed]
  77. Denton, J.S.; Hitchings, S.P.; Beebee, T.J.C.; Gent, A. A recovery program for the natterjack toad (Bufo calamita) in Britain. Conserv. Biol. 1997, 11, 1329–1338. [Google Scholar] [CrossRef]
  78. Corbett, K.F.; Moulton, N.R. The Sand Lizard Species Recovery Programme Project (1994-1997); English Nature: Peterborough, UK, 1994; English Nature Research reports No. 288. [Google Scholar]
  79. Baker, J.M.R.; Halliday, T.R. Amphibian colonization of new ponds in an agricultural landscape. Herpetol. J. 1999, 9, 1–8. [Google Scholar]

