Ants in Australia’s Monsoonal Tropics: CO1 Barcoding Reveals Extensive Unrecognised Diversity


1
CSIRO Tropical Ecosystems Research Centre, PMB 44 Winnellie, Darwin, NT 0822, Australia
2
Research Institute for the Environment and Livelihoods, Charles Darwin University, Darwin, NT 0909, Australia
3
Research School of Biology, Australian National University, Acton Canberra, ACT 2600, Australia
*
Author to whom correspondence should be addressed.
Diversity 2018, 10(2), 36; https://doi.org/10.3390/d10020036
Submission received: 17 April 2018
/
Revised: 2 May 2018
/
Accepted: 10 May 2018
/
Published: 14 May 2018
(This article belongs to the Special Issue DNA Barcoding for Biodiversity)
Abstract
:The Australian monsoonal tropics (AMT) is a significant biodiversity hotspot, and recent genetic studies of several vertebrate groups have revealed its level of diversity is far higher than previously thought. However, the extent to which this applies to the AMT’s insect fauna, which represents most AMT faunal species, remains unknown. Here we examine the extent of unrecognised diversity in the AMT’s ecologically dominant insect group, ants. We used CO1 barcoding in combination with morphological variation and geographic distribution to explore diversity within seven taxa currently recognised as single species occurring throughout the AMT: one species of Papyrius Shattuck 1992, one of Iridomyrmex Mayr 1862, two from the Cardiocondyla nuda (Mayr 1866) group, and three from the Camponotus novaehollandiae (Mayr 1870) group. We found six of the seven target species each to represent several species, based on a combination of CO1 divergence (ranging up to 13%), morphological differentiation and geographic distribution. Our findings indicate that the levels of diversity and endemism of the AMT ant fauna are far higher than currently realised. We urge the need for further research in insect biodiversity in the AMT, both for a better understanding of the evolution of its remarkable biota, and as a basis for improved conservation planning.
1. Introduction
The Australian monsoonal tropics (AMT) extends across the northern third of the continent (Figure 1) and is a significant biodiversity hotspot as a result of ancient refugia among complex and ancient landforms [1]. High diversity is also a product of marked latitudinal variation in mean annual rainfall, ranging from about 2000 mm on the Tiwi Islands north of Darwin [2], to 500 mm at the AMT’s southern border on the fringe of Australia’s central arid zone [3]. Consequently, the AMT is a centre of endemism for a wide range of taxa, including vascular plants [4], termites [5], ants [6], frogs [7], lizards [8] and mammals [9]. Yet vast areas of the AMT remain poorly surveyed, and these may hold even more phylogenetically distinct and endemic groups [10].
The AMT has recently become the focus of much phylogenetic research (e.g., [11,12,13]), and such studies are consistently revealing that actual diversity in the AMT has been considerably under-appreciated due to inadequate taxonomic attention along with extensive, often morphologically cryptic, genetic divergence within taxonomically recognised species. For example, genetic analysis of reptiles, a rich and geographically structured AMT faunal group [14], has repeatedly demonstrated that snake [15], gecko [16,17,18] and skink [19,20] taxa previously considered to be widespread species actually represent diverse complexes of genetically and often also morphologically differentiated taxa, often having very narrow distributional ranges [21,22,23]. Substantial unrecognised diversity has also been revealed for trees [24], land snails [25], fish [26], frogs [27], and marsupials [28,29]. Meta-analyses of high resolution, comparative phylogeographic diversity across taxa with low dispersal have also revealed new hotspots of endemism that are important to recognise for conservation [30,31,32].
Unrecognised diversity is likely to be especially pronounced for insects in the AMT given that they are so diverse and generally under-studied taxonomically. However, this remains to be investigated. A fuller understanding of true levels of diversity and endemism in the AMT is important not just for an improved understanding of the evolution of its remarkable biota, but also as a basis for improved conservation planning. There is increasing pressure for economic development of the AMT [33], which foreshadows extensive land clearing for irrigated agriculture, aquaculture and improved pastures. Such clearing is occurring in the context of a limited understanding of patterns of diversity and endemism, and with no consideration of insect biodiversity.
Here we examine unrecognised diversity in ants, the ecologically dominant insect group throughout the AMT [6], and one that is widely used as a bio-indicator in land management [34]. The AMT ant fauna is dominated by arid-adapted elements derived from Australia’s megadiverse arid zone [6,35,36]. In 2000, the AMT ant fauna was estimated to comprise about 1500 species [6], but it has since become clear that this is a gross under-estimation. The extent of ant diversity more generally in arid, semi-arid and seasonally arid Australia is widely under-appreciated, with integrated morphological and genetic analysis indicating a level of species richness that is an order of magnitude higher than reported in recent taxonomic revisions [37,38,39]. The AMT ant fauna also shows remarkably high levels of endemism. For example, 60% of the >900 morpho-species recorded from the Top End of the Northern Territory have not been found elsewhere [40], and 40% of the ant species known from the Mitchell Falls area of the North Kimberley appear to be endemic [41]. Despite such high levels of regional endemism, a substantial proportion of the AMT ant species appear to be distributed throughout the region [40].
Our study examines the extent of unrecognised diversity in the AMT ant fauna through extensive CO1 barcoding of seven species currently considered to occur throughout the AMT: a species of Papyrius Shattuck 1992 (Papyrius sp. 1), Iridomyrmex ‘pallidus’ Forel 1901, two species from the Cardiocondyla nuda (Mayr 1866) group (Car. ‘nuda’ and Car. ‘atalanta’ Forel 1901), and three species from the Camponotus novaehollandiae (Mayr 1870) group (Cam. ‘novaehollandiae’ Mayr 1870, Cam. ‘crozieri’ McArthur and Leys 2006 and Cam. sp. 9). These taxa were chosen to cover the most abundant and diverse ant subfamilies (Myrmicinae, Formicinae and Dolichoderinae) in the AMT, and to represent a broad range of ecological types and body sizes.
Although the CO1 barcoding approach is widely used to infer species boundaries, especially for hyper-diverse groups (e.g., [42,43,44,45,46]), it has significant limitations [47,48,49,50,51]. There is no uniform level of CO1 divergence that can be used to define a species. The level of CO1 variation among ant species is typically 1–3% [52], as is the case for many other insect groups (e.g., Ephemeroptera [53], Plecoptera [54], Trichoptera [55], Lepidoptera [56,57], Heteroptera [45,58], aquatic beetles [59], bees [60], and Diptera [61,62]), but can be substantially higher [38,63]. Moreover, terminal clade structure based on CO1 data does not always reflect species boundaries, due to a range of factors including Wolbachia-associated divergence in the mitochondrial genome, incomplete lineage sorting, introgressive hybridisation and genetic drift [51,64,65]. Consequently, it is important to use conceptually different delimitation methods when assessing species limits [66,67]. Therefore, we take an integrated approach to our assessments of species delimitation [68], considering a combination of CO1 divergence, sequence-based algorithms, morphological differentiation, and geographic distribution.
2. Materials and Methods
2.1. Study Taxa and CO1 Barcoding
Papyrius is a dolichoderine genus endemic to Australia and New Guinea, comprising a single nominal species (P. nitidus Mayr 1862), with three described subspecies: P. nitidus clittelarius Vehmeyer 1925, P. nitidus oceanicus Forel 1901 and P. nitidus queenslandensis Forel 1901. Based on specimens in the Commonwealth Scientific Industrial Research Organisation (CSIRO) Tropical Ecosystems Research Centre’s (TERC) ant collection in Darwin, there appears to be at least 26 valid species, one of which (Papyrius sp. 1) seemingly occurs throughout the AMT [40,41] and is one of our target species (Figure 2A). Syntypes of P. nitidus queenslandica are from Mackay on the central Queensland (Qld) coast, and Papyrius sp. 1 is possibly this taxon. Several other species of Papyrius with more-limited distributions also occur in the AMT [6], but are not considered here. We obtained sequence data from the CO1-barcoding region for 29 specimens of Papyrius sp. 1 collected from throughout the AMT. For comparison, we also included two morphologically distinctive species from outside the AMT, one from south-eastern Qld in which the vertexal margin of the head is only feebly concave (Papyrius sp. 2; Figure 2B), and another from South Australia (SA) where the propodeum has a conspicuous anterior lobe (Papyrius sp. 3; Figure 2C).
The Cardiocondyla nuda group includes two Australian species, Car. ‘nuda’ (Figure 3A) and Car. ‘atalanta’ Forel 1901, with the latter recently revealed as a sister species of Car. ‘nuda’ [69]. They can be separated by morphometric characters [69], but are most readily distinguished by sculpturing on the head and mesosoma, which is more conspicuous in Car. ‘nuda’ (Figure 3B,C). Both species are widely distributed across the AMT and beyond, with Car. ‘nuda’ restricted to subcoastal areas of higher rainfall, and Car. ‘atalanta’ occurring throughout most of inland Australia [69]. We sequenced 16 specimens from the AMT, and an additional eight specimens from elsewhere in Australia.
Iridomyrmex ‘pallidus’ (Figure 4A–C) is considered in a recent revision of the genus [70] to represent a single species occurring throughout northern Australia and also in New Guinea. This conception of the species includes a morphologically distinct taxon from far North Qld (Figure 4D) with a very broad head, smaller and more-rounded eyes (Figure 4E), and erect hairs throughout the hind tibiae (Figure 4F) that is sorted as a separate species in the TERC collection. We sequenced 34 specimens from throughout the AMT, including two specimens of the distinctive North Qld taxon.
The three target species of the Camponotus novaehollandiae group represent three distinct colour forms that occur throughout the AMT [6]: uniformly yellowish (Cam. ‘novaehollandiae’ Mayr 1870; Figure 5A), bicoloured, with blackish head and gaster contrasting with yellowish mesosoma (Cam. ‘crozieri’ McArthur and Leys 2006; Figure 5B), and dark throughout (mesosoma only slightly paler than dark brown head and gaster; referred to as Camponotus sp. 9 (novaehollandiae group) in previous publications of ants in northern Australia; Figure 5C). However, there is substantial colour variation within all three forms in the TERC collection. These forms all have finely scalloped and relatively shiny integuments, in contrast to the densely punctate Cam. fieldeae Forel 1902, another member of the Cam. novaehollandiae group that is widespread in the AMT [6]. We sequenced 61 specimens of the three target species, along with five specimens of Cam. fieldeae and one specimen of Cam. extensus Mayr 1876, another densely-punctate member of the Cam. novaehollandiae group but from south-eastern Qld and with extremely long antennal scapes.
All specimens were obtained from the TERC collection. DNA was extracted from tissue of the foreleg for larger specimens or the entire body (excluding gaster) for smaller specimens. DNA extraction and sequencing were conducted through the Barcode of Life Data (BOLD) System (http://www.boldsystems.org/). All processed specimens were assigned a 6–8 digit identification code (e.g., AMT 093, TEA 350, CAMPO 028, IRIDO 269). The original data sequences are deposited in GenBank; BankIt2111481: MH290565–MH290719.
2.2. Sequence Analysis and Tree Inference
The DNA sequences were checked and edited in Geneious 10.0.9 [71]. The consensus sequences were then aligned using MUSCLE software [72] and translated into [invertebrate] proteins in MEGA 7 [73] to check for stop codons and nuclear paralogues. The aligned sequences were trimmed accordingly, resulting in 657 base pairs for species of Papyrius, Cardiocondyla and Iridomyrmex, and 660 base pairs for Camponotus species.
To explore overall CO1 diversity within the samples, the mean genetic pairwise distances between sequences were calculated in MEGA 7. This was done using the Kimura 2-parameter (K2P) [74] model to ensure results were comparable to most other studies of insect DNA barcoding, with 500 bootstrap replicates and the ‘pairwise deletion’ option of missing data (to remove all ambiguous positions for each sequences pair). Analysis involved all nucleotide sequences (excluding those of the outgroup). Codon positions included were 1st + 2nd + 3rd + noncoding.
For each taxon, a sequence from a specimen belonging to another genus from the same subfamily was used as an outgroup: Papyrius—Iridomyrmex ‘pallidus’; Iridomyrmex ‘pallidus’—Papyrius sp. 1; Cardiocondyla nuda group—Solenopsis sp.; and Camponotus novaehollandiae group—Melophorous mjobergi Forel 1915. Outgroups were used only to help inform tree topology and appropriate rooting (by the sequence closest to the outgroup), and were not shown in the final trees.
Tree inference by maximum likelihood was initially conducted in both RAxML [75] and IQ-TREE [76]. The resulting tree topologies were similar, but IQ-TREE consistently had higher bootstrap clade support. Given this, and because it has been shown to be a robust algorithm for tree inference that compares favourably to other methods [76], we used IQ-TREE for construction of all final trees. All trees were constructed through the IQ-TREE web server (http://iqtree.cibiv.univie.ac.at/ [77]) using ultrafast bootstrap approximation [78]. Model selection was inferred using a 3-codon partition file and linked branch lengths with the AutoMRE ‘ModelFinder’ function to find the best-fit model for tree inference [79]. Trees were viewed and edited in FigTree v1.4.3 [80] and annotated using Photoshop CS5.1. Distribution maps of hypothetical species, corresponding to the final trees, were created in ArcGIS [81].
To help infer hypothetical species, we employed two widely-used statistical methods of species delimitation. The automatic barcode gap discovery (ABGD) [82] procedure defines hypothetical species within sequence alignment data based on a statistically inferred ‘barcode gap’ in the distribution of pairwise distances. The aligned data sequences of all four ant taxa were subjected to ABGD analysis using the web server (http://wwwabi.snv.jussieu.fr/public/abgd/abgdweb.html) at a prior maximum divergence of intraspecific diversity (P) ranging from 0.001 to 0.1 and a relative gap width (X) of 1.0. The Poisson tree processes (PTP) model infers species boundaries via the number of substitutions between and among species in a maximum likelihood tree [83]. We subjected trees of all four ant taxa to the PTP algorithm through the web server (http://species.h-its.org/ptp/) using the standard settings of 100,000 MCMC generations, 100 thinning and 0.1 burn-in. Both these sequence-based methods have been shown to be a useful starting point in defining hypothetical species from sequence data, as part of an integrative taxonomic approach that also incorporates morphological and geographic information [82,83,84]. When assessing morphological variation, we also considered, when available, other samples from the same collections as those of the specimens sequenced.
3. Results
All four CO1 trees showed moderate (70–89) to high (≥90) Bayesian posterior probability at the tips, while basal node support was generally lower and poorly resolved in all except Camponotus. Some poorly resolved clades were nested among other better supported clades (e.g., Cardiocondyla and Camponotus), and were supported by differences in locality and morphology. Six of the seven target species (the exception being Cam. sp. 9) were revealed to represent multiple, and in some cases many, apparent species.
3.1. Papyrius sp. 1
Twenty-six of the 29 specimens of Papyrius sp. 1 were shown to represent a single species (sp. 1A) that occurs throughout the AMT with just 0.6% mean CO1 variation among specimens (6). This clade is well supported by both ABGD and PTP results (Appendix A Table A1). The remaining three AMT specimens each had >4.0% mean CO1 divergence from the 26 specimens that comprised sp. 1A, and were shown to be more-closely related to Papyrius sp. 2 from south-eastern Qld (Figure 6). These three specimens and sp. 2 lack the strongly infuscated antennal scape and first funicular segment of sp. 1A (Figure 7A). We found the three AMT specimens from this clade to represent two additional species (sp. 1B and sp. 1C in Figure 6; 1.9% mean CO1 divergence). They are recognised as such by PTP, but not by ABGD (Appendix A Table A1). The head is narrower and scapes longer in the two specimens from the Kimberley region of Western Australia (WA) (sp. 1B, Figure 7B) compared with the specimen from Kakadu National Park in the Northern Territory (NT) (sp. 1C; Figure 7C), and we assessed this as sufficient for recognising them as separate species. Papyrius sp. 3 from SA had a mean divergence of 6.5% from all other specimens.
3.2. Iridomyrmex ‘pallidus’
The mean CO1 divergence among specimens of Iridomyrmex ‘pallidus’ was 3.1%, and we assessed these samples as representing at least six hypothetical species (spp. P1–6). ABGD and PTP analysis delimit 5 and 6 hypothetical species respectively (Appendix A Table A2), with the latter exactly matching our hypothetical species (Figure 8). This includes the broad-headed form from far North Qld (sp. P2), which had >3% divergence from other species (Figure 8). The identified species show a range of variation in head shape (ranging from narrowly triangular with a slightly convex vertexal margin, to broadly-rounded with a concave vertexal margin) and scape length (Figure 4B,E and Figure 9). Species P4 (known only from North Qld) can be distinguished from all others by having erect hairs scattered throughout most of the sides of its head (Figure 9D; only visible at bottom right). There is substantial clade structure within sp. P1 and this does not match geography (for example, specimens from Kakadu NP are placed within each of the three main sub-clades; Figure 8)—it is therefore possible that this taxon represents multiple species.
3.3. Cardiocondyla nuda Group
AGBD and PTP analyses identify nine and 11 hypothetical species respectively among the 24 sequenced specimens of the Cardiocondyla nuda group (Appendix A Table A3), and our assessment is that there are 10 species, six attributable to Car. ‘atalanta’ (spp. A1–6) and four to Car. ‘nuda’ (spp. N1–4) (Figure 10), with a mean genetic distance among them of 5.4%. Our hypothetical species match exactly the putative species identified by AGBD analysis, except its eighth species includes both Car. ‘nuda’ sp. 3 and Car. ‘atalanta’ sp. 6 (Appendix A Table A3), which are clearly differentiated morphologically. PTP analysis identifies two hypothetical species within the taxon we have assessed as Car. ‘nuda’ sp. 1 (Appendix A Table A3).
Our CO1 tree suggests that specimens attributable to each of Car. ‘atalanta’ and Car. ‘nuda’ are polyphyletic, but the higher relationships have weak bootstrap support. In terms of Car. ‘atalanta’, one species (sp. A2) occurs in all northern Australian states, two (sp. A1 and sp. A5) in both the WA’s Kimberley region and the NT’s Top End, two (sp. A3 and sp. A4) are known only from the Top End, and one (sp. A6) only from Qld (Figure 10). All are bicoloured (reddish brown mesosoma with contrasting dark-brown gaster, Figure 3A), except for sp. A4, which is uniformly dark brown (Figure 11A). Otherwise, clear morphological differences among the species are not apparent, and morphological variation appears to be inconsistent. For example, in the three specimens of sp. A2 from the Kimberley (including from Mitchell Falls) the propodeal dorsum is smooth and shiny, whereas in the Mitchell Falls specimen of sp. A1 the propodeal dorsum is finely sculptured and dull. However, the NT and Qld specimens of sp. A2 also have a dull propodeal dorsum.
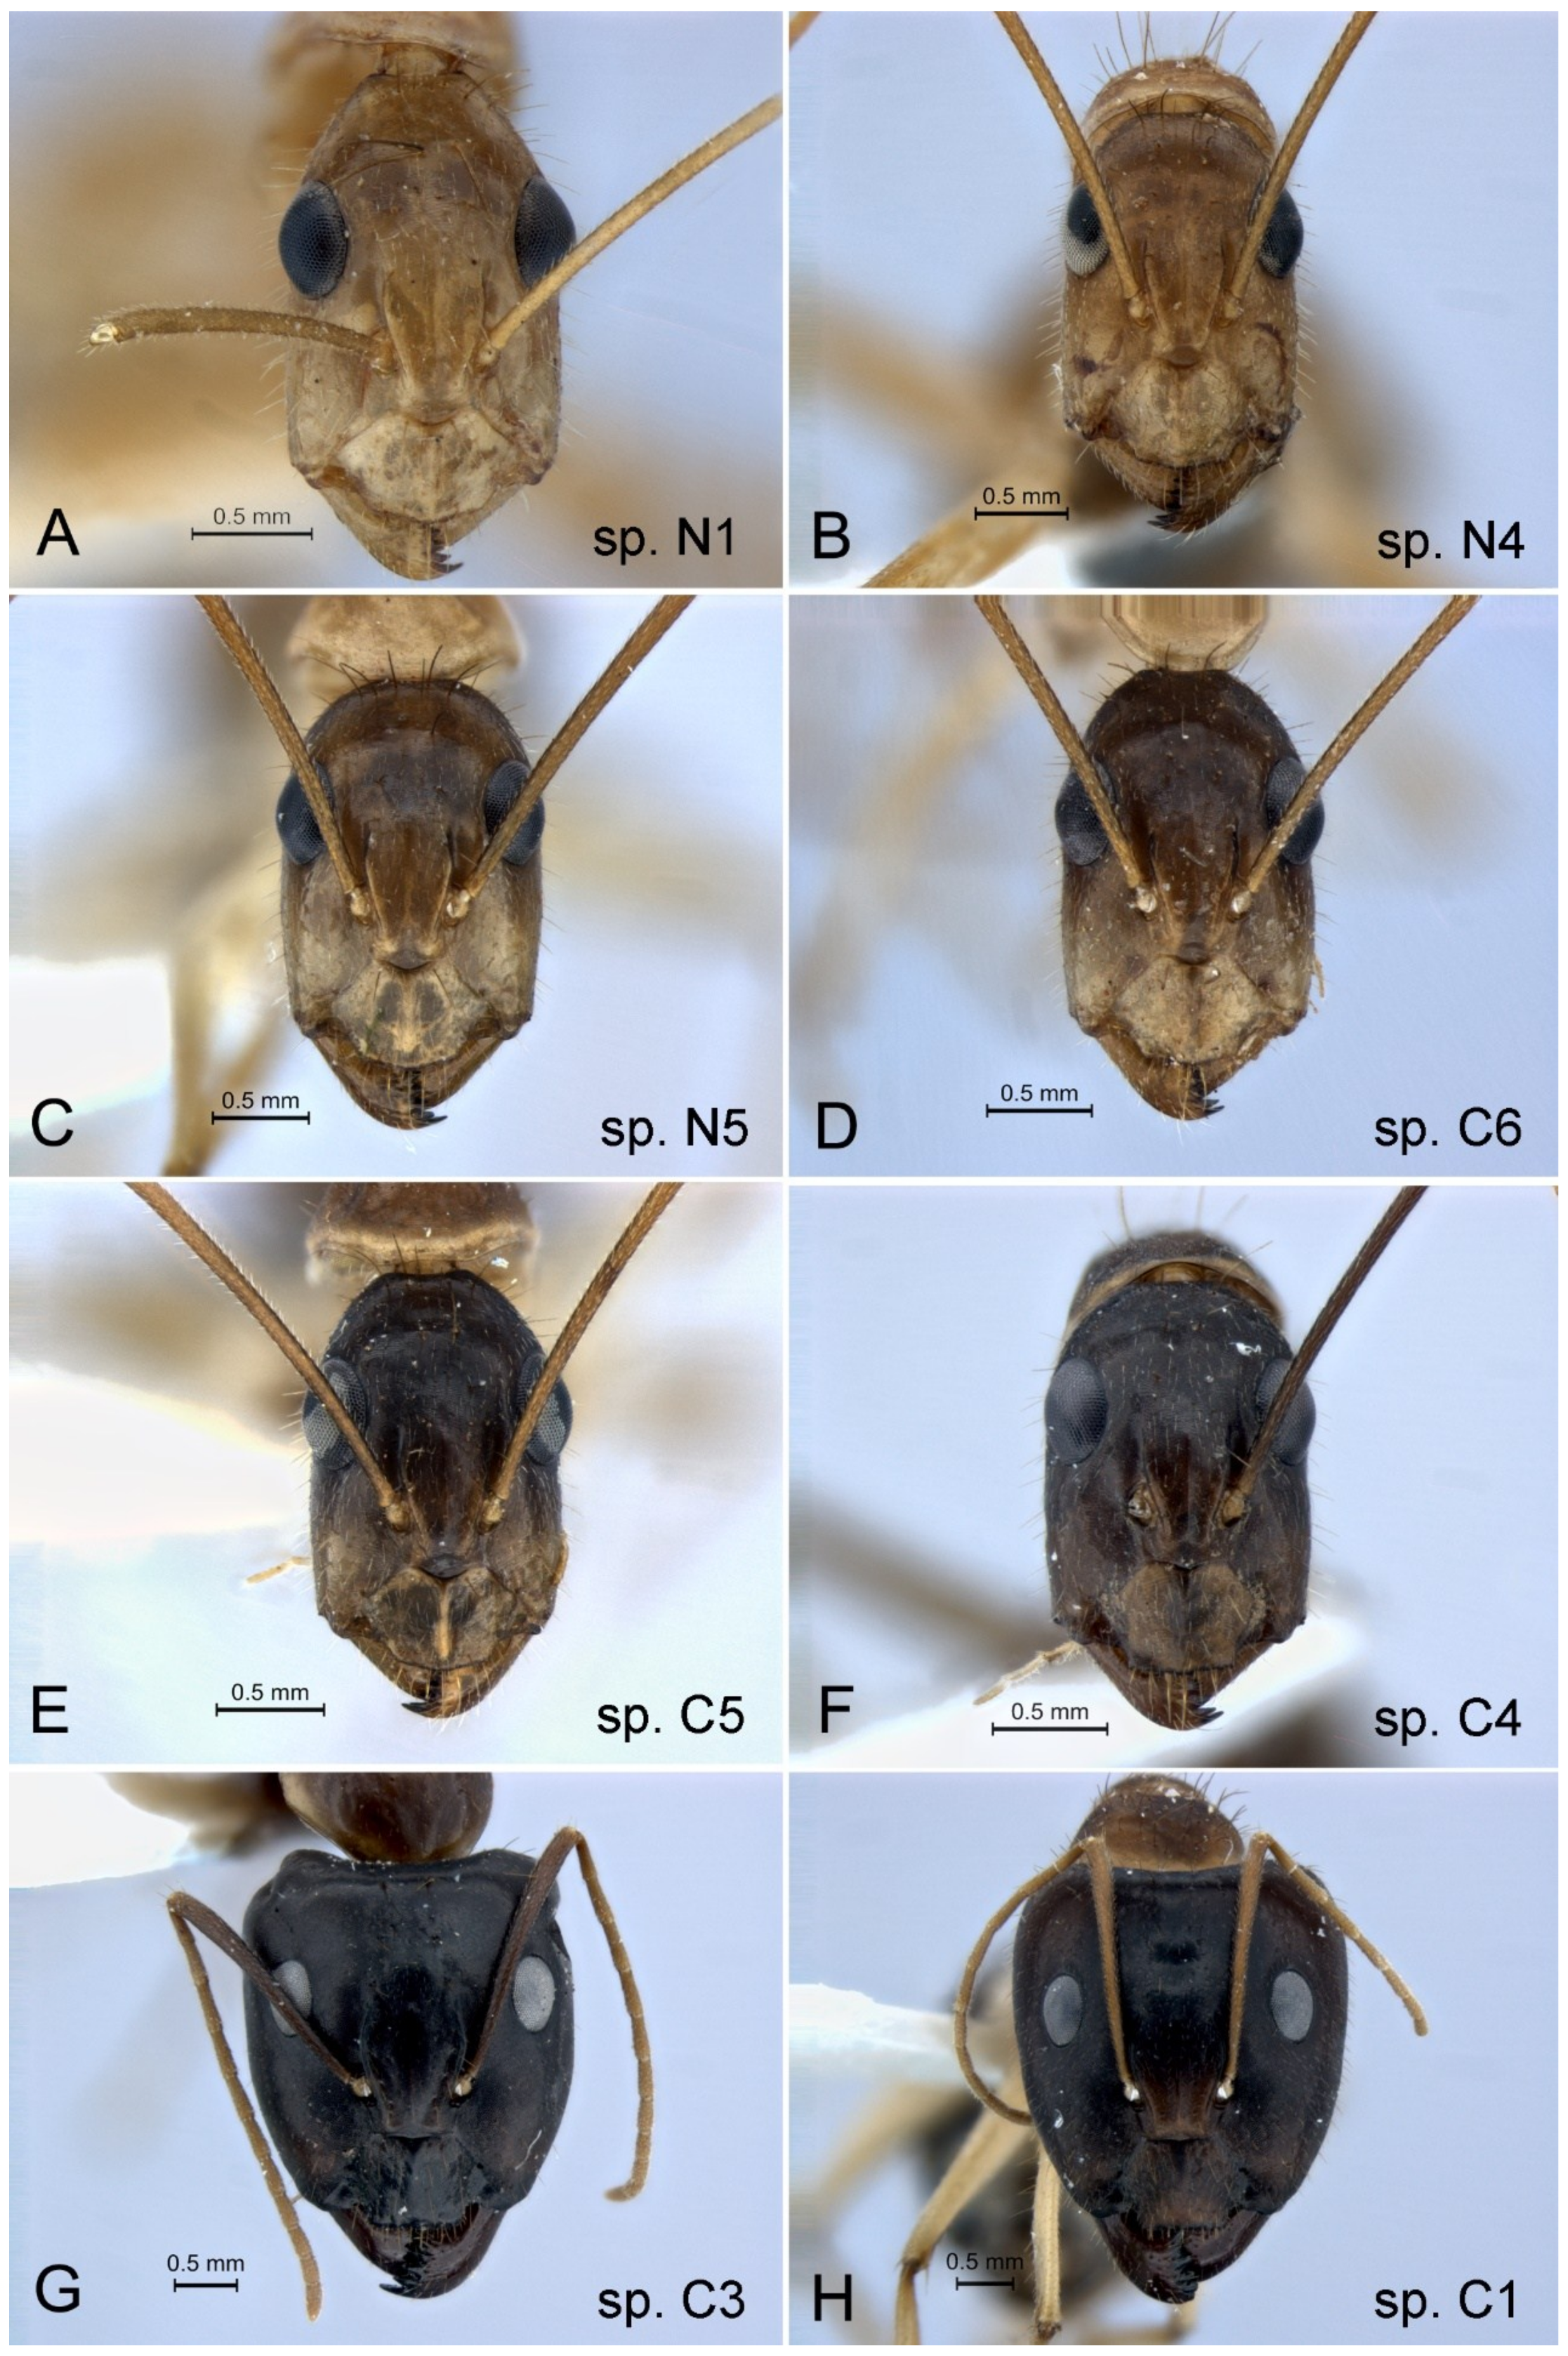
Cardiocondyla ‘nuda’ includes a species (sp. N4) from Lord Howe Island (off the NSW coast) that is highly divergent and shown as being sister to all other Cardiocondyla specimens sequenced (but with low bootstrap support; Figure 10). It has a yellow-brown mesosoma, and longer gastric pubescence (Figure 11C) than is typical of species of the C. nuda group (Figure 11B). Specimens of sp. N2 (known only from the Darwin region, including the Tiwi Islands) are uniformly dark brown, and have particularly dense and long gastric pubescence (Figure 11D). Species N1 and N3 are both very widely distributed in higher rainfall regions of Australia. All specimens of sp. N3 have a dark reddish-brown head, mesosoma and waist, and gastric pubescence is short and sparse (Figure 11B). Mesosoma colour in sp. N1 is highly variable, ranging from yellow to dark brown.
3.4. Camponotus novaehollandiae Group
ABGD and PTP analyses identified 17 and 21 hypothetical species respectively among our 67 sequenced samples (Appendix A Table A4). Both analyses identified Cam. fieldeae as a complex of species, but we assess it as a single, widely distributed species (with a mean of 2.7% CO1 divergence across its range throughout the AMT). The CO1 tree indicated that Cam. fieldeae is sister to Cam. extensus (Figure 12), which is consistent with morphology. CO1 analysis showed that both the uniformly yellow (Cam. ‘novaehollandiae’) and bicoloured (Cam. ‘crozieri’) forms represent many taxa, and the colour forms are polyphyletic. We recognise nine and six species, respectively, among the samples, 13 of which are from a single state, and none from all states.
There was very high CO1 divergence across the nine Cam. ‘novaehollandiae’ species identified here (spp. N1–9). For example, sp. N8 differed from all others by >10%, with as much as 13% from sp. N7, and sp. N1 showed high mean genetic distance from others including sp. N7 (13%), sp. N9 (11%), sp. N8 (11%) and sp. N6 (10%). There is also marked variation in worker head shape. For example, in sp. N1 (from the central and northern regions of the NT) the sides of the head diverge anteriorly beyond the eyes, and they are strongly convergent behind them (Figure 13A). Such divergence and convergence are less marked in sp. N4 (from the NT and eastern Kimberley region of WA; Figure 13B), and in sp. N5 (from Mt Isa, Qld) the head is widest at its midpoint and the vertex is broadly domed (Figure 13C).
Mean CO1 divergence among the six identified species within Cam. ‘crozieri’ (spp. C1–6) ranged from 1.9—6.8%. Variation in head shape is less pronounced than in species of C. ‘novaehollandiae’, but head and antennal colour shows clear variation. For example, in minors of sp. C6 the head is distinctly bicoloured (yellowish anteriorly), and the antennae are yellow (Figure 13D); in sp. C5 the anterior of the head is only slightly yellowish, but the antennae are yellow (Figure 13E); and in sp. C4 the head is uniformly dark brown and the antennal scapes are similarly coloured (Figure 13F). In the major workers of sp. C3 the antennal scapes are concolorous with the dark-brown head (Figure 13G), whereas in sp. C1 they are contrasting yellow (Figure 13H).
Both ABGD and PTP results support most of our hypothetical species (Table A4). One exception involves sp. C6 and sp. N1, which are grouped by both algorithms. However, they can be easily separated by head colour and shape (Figure 13A,D), and they have very different distributions (Figure 12). ABGD and PTP respectively grouped and divided sp. N2 and sp. N3 (Appendix A Table A4); the latter is supported by differences in their morphology (the head of sp. N3 is much more infuscated, shiny and sculptured, and the femur of sp. N2 more densely haired) and by their geographic separation.
All 11 sequenced specimens of the uniformly dark-brown Cam. sp. 9 (Figure 5C) are shown to belong to a single clade of 28 total specimens with only 1.2% mean CO1 variation across its range throughout the high rainfall zone of the AMT (Figure 12). This clade is consistent with both ABGD and PTP results (indicated as ‘species 7’ in Appendix A Table A4). However, it includes other colour forms, and we suspect that it represents a complex of species, rather than geographically structured colour morphs. For example, the five specimens from Kakadu National Park in the NT fall into three subclades that match variation in colour. Two specimens (CAMPO 032 and CAMPO 046) belong to a subclade of a uniformly dark form that is widely distributed in the Top End of the NT. Another two specimens (AMT 019 and CAMPO 008) form a separate subclade and are uniformly yellow, and the final specimen (AMT 009) is bicoloured and forms another subclade.
4. Discussion
Using a combination of DNA barcoding, morphology and geography we have identified extensive unrecognised diversity within AMT ant taxa that were previously considered to be widespread species. The sequenced samples of Papyrius sp. 1, I. ‘pallidus’, Car. ‘nuda’, Car. ‘atalanta’, Cam. ‘novaehollandiae’ and Cam. ‘crozieri’ appear to represent 3, 6, 6, 4, 9 and 6 species, respectively. These figures are likely to be highly conservative estimates of true diversity in these taxa given the limited number of samples available for analysis. The TERC collection houses numerous other specimens from additional localities that are too old for CO1 analysis, with many showing morphological variation that is not represented by the sequenced specimens.
Our findings highlight the remarkable diversity of the AMT ant fauna and how poorly its levels of diversity and endemism are understood. By way of comparison, a recent CO1 analysis of the ant fauna of Brazil’s southern Atlantic Forest indicated that species richness was only 10% higher than previously appreciated [85], rather than the several-fold increase that is apparent for the AMT. Our findings call for a re-evaluation of the recent assessment based on the TERC collection that 900 species are known from the Top End of the Northern Territory [40]. Since this assessment, an extensive survey of remote areas of Kakadu and Nitmiluk National Parks have revealed >100 additional species (Oberprieler and Andersen unpubl. data), which pushes the Top End fauna to >1000 known species. However, our study indicates that that this figure is a gross under-estimation of the fauna even as represented by sorted morpho-species in the TERC collection. For example, our findings indicate that I. ‘pallidus’ includes three species from the Top End, and that Car. ‘atalanta’ likely includes five Top End species. Our findings suggest that a large majority of ant taxa that are considered to be widespread AMT species are in fact complexes of multiple species. This also likely applies to many species known only from the Top End. Given that much of the Top End remains to be surveyed for ants, we believe that its total ant fauna likely exceeds 1500 species, which is as many as a previous estimate for the entire AMT [6].
Many of our assessed species are really not cryptic in that they are clearly differentiated morphologically [67]. Their lack of recognition is, therefore, more a reflection of inadequate taxonomic attention than of cryptic speciation. This has also been the case for a number of AMT vertebrates, including in frogs [27] and geckos [86,87,88], where morphological variation had been recognised but incorrectly attributed to intraspecific geographic variation. However, we also found cases of truly cryptic divergence (e.g., in species of Cardiocondyla), where specimens from independently evolving lineages as indicated by CO1 analysis cannot be readily differentiated morphologically. This is likewise the case for a range of AMT vertebrate taxa, such as Gehyra [18,88] and Crenadactylus [22] geckos, Carlia skinks [19], Ramphotyphlops snakes [15], Uperoleia frogs [27], Leiopotherapon fish [26] and even kangaroos [28].
Further sampling effort and extension of this assessment to nuclear genes (e.g., SNP’s and 18S) would be needed to validate many of our assessed species. However, we are confident that CO1 analysis has provided a reliable indication of diversity within our target taxa. This has been shown to be the case even if CO1 analysis has not got all species exactly correct (e.g., [89]). Moreover, sequenced-based methods such as ABGD and PTP have been shown to result in consistent species estimates across multiple genes [90,91]. We found that ABGD always resulted in more conservative species counts within taxa (4–17) than did PTP (5–21), which is typically the case [90,92]. Results of PTP analysis were more consistent with our assessed species based on an integration of clade structure with morphological variation and geography. PTP uses a more-objective approach to species delimitation than does ABGD, where results can vary across a range of parameters that are inputted by the user [91].
The underestimation of AMT biodiversity, and especially the extent of local endemism, has important conservation implications in light of increasing threats to this biome, such as invasive species, inappropriate fire regimes, and agricultural development [17,31]. Threats that were once considered to affect small parts of the ranges of widespread species may in fact have an impact on the entire ranges of species. The implications are particularly important for the extensive land clearing for pastoral intensification and irrigated agriculture that is planned in the AMT as part of the Australian government’s push for northern development [33]. For the conservation of the AMT’s remarkable biodiversity, it is critical that land-use plans are informed by a sound understanding of species distributions [31]. Our study has shown that such an understanding is particularly inadequate for the AMT’s dominant insect group. This most likely applies to insects more generally.
Author Contributions
S.K.O. and A.N.A. conceived the study and wrote the first draft of the manuscript; S.K.O. undertook the analysis of the CO1 data and imaging of the specimens; A.N.A. developed the TERC collection and assessed specimens; C.C.M. contributed to the writing of the paper and interpretation of results.
Funding
This research received no external funding.
Acknowledgments
We are most grateful to Owain Edwards (CSIRO) for awarding the first author a stipend that aided in funding the barcoding of specimens. We also thank Jodie Hayward (CSIRO) for the specimens she helped prepare for barcoding, Dan Rosauer (ANU) for his advice on phylogenetic analysis, Sarah Banks (ANU) for her assistance in tree inference, Kate Sparks (Department of Agriculture) for advice on DNA sequence analysis, and Phil Ward (University of California), Ben Hofffman (CSIRO) and Xuankun Li (CSIRO) for their comments on the manuscript.
Conflicts of Interest
The authors declare no conflict of interest.
Appendix A

Table A1.
Hypothetical species of Papyrius defined using automatic barcode gap discovery (ABGD) and PTP sequence-based algorithms. The Poisson tree processes (PTP) model shows maximum-likelihood support values. The closest matched hypothetical species as illustrated in the trees are indicated.
Table A1.
Hypothetical species of Papyrius defined using automatic barcode gap discovery (ABGD) and PTP sequence-based algorithms. The Poisson tree processes (PTP) model shows maximum-likelihood support values. The closest matched hypothetical species as illustrated in the trees are indicated.
| ABGD * | Hypothetical Species | PTP | Support | Hypothetical Species |
|---|---|---|---|---|
| TEA375 Dutchmans Stern SA | 3 | TEA375 Dutchmans Stern SA | 1.000 | 3 |
| TEA377 south-eastern Qld | 2 | TEA377 south-eastern Qld | 0.999 | 2 |
| AMT095 Prince Regent WA; AMT086 Nitmiluk NT; AMT087 Kakadu NT; AMT088 Kakadu NT; AMT089 Kakadu; NT AMT090 Lake Woods NT; AMT091 Nhulunbuy NT; AMT092 Melville Islands NT; AMT093 Melville Islands NT; TEA355 Cape York Pen Qld; TEA354 Limmen NT; TEA352 Lakefield NT; TEA351 Lakefield NT; TEA350 Nhulunbuy NT; TEA348 Nitmiluk NT; TEA347 Nitmiluk NT; TEA379 Bridge Creek NT; TEA372 Old Telegraph Track Qld; TEA368 Cairns Qld; TEA367; Cairns Qld; TEA366 Nhulunbuy NT; TEA364 Kakadu NT; TEA363 Kakadu NT; TEA362 Lake Woods NT; TEA360 Kununurra WA; TEA380 South Daly Waters NT | 1A | AMT090 Lake Woods NT; AMT089 Kakadu NT; TEA363 Kakadu NT; AMT087 Kakadu NT; TEA360 Kununurra WA; TEA352 Lakefield NT; TEA368 Cairns Qld; AMT088 Kakadu NT; AMT092 Melville Islands NT; AMT093 Melville Islands NT; TEA355 Cape York Pen Qld; TEA372 Old Telegraph Track Qld; TEA367 Cairns Qld; TEA351 Lakefield NT; TEA348 Nitmiluk NT; TEA379 Bridge Creek NT; AMT086 Nitmiluk NT; TEA354 Limmen NT; TEA347 Nitmiluk NT; TEA362 Lake Woods NT; TEA364 Kakadu NT; TEA366 Nhulunbuy NT; TEA350 Nhulunbuy NT; AMT091 Nhulunbuy NT; TEA380 South Daly Waters NT; AMT095 Prince Regent WA | 0.090 | 1A |
| AMT094 Kimberley WA; TEA346 Kakadu NT; TEA358 Nth Kimberley WA | 1B, 1C | TEA358 Nth Kimberley WA; AMT094 Kimberley WA | 0.476 | 1B |
| TEA346 Kakadu NT | 0.974 | 1C |
* Partitions at prior maximal distances from P = 0.001668 to P = 0.007743.
Table A2.
Hypothetical species of Iridomyrmex ‘pallidus’ defined using ABGD and PTP sequence-based algorithms. PTP shows maximum-likelihood support values. The closest matched hypothetical species as illustrated in the trees are indicated.
Table A2.
Hypothetical species of Iridomyrmex ‘pallidus’ defined using ABGD and PTP sequence-based algorithms. PTP shows maximum-likelihood support values. The closest matched hypothetical species as illustrated in the trees are indicated.
| ABGD * | Hypothetical Species | PTP | Support | Hypothetical Species |
|---|---|---|---|---|
| AMT062 Mitchell Falls WA | P5 | AMT062 Mitchell Falls WA | 0.990 | P5 |
| AMT056 Boydong Islands Qld | P4 | AMT056 Boydong Islands Qld | 0.979 | P4 |
| AMT057 Wallace Islet Qld; IRIDO332 Iron Range Qld | P2 | AMT057 Wallace Islet Qld; IRIDO332 Iron Range Qld | 0.703 | P2 |
| AMT033 Kakadu NT; AMT036 Gove Peninsula NT; AMT039 Nitmiluk NT; AMT041 Kakadu NT; AMT042 Kakadu NT; AMT043 Kakadu NT; AMT044 Lakefield NT; AMT048 South Daly Waters NT; AMT049 Newcastle Waters NT; AMT050 Newcastle Waters NT; AMT052 Lake Woods NT; AMT053 Litchfield NT; AMT054 Litchfield NT; AMT055 Lizard Island Qld; AMT063 Kununurra WA; AMT064 Mt Elizabeth WA; AMT065 Mt Elizabeth WA; IRIDO326 Nitmiluk NT; IRIDO327 Kakadu NT; IRIDO329 Lizard Isand Qld; IRIDO330 Kimberley WA; IRIDO331 Kununurra WA; IRIDO333 Kakadu NT; IRIDO365 Limmen NT; IRIDO366 Lorella NT; IRIDO367 Darwin NT; IRIDO369 Lakefield NP Qld; IRIDO370 Kimberley NT | P1, P3, P6 | AMT048 South Daly Waters NT; AMT041 Kakadu NT; AMT050 Newcastle Waters NT; AMT064 Mt Elizabeth WA; AMT065 Mt Elizabeth WA; AMT042 Kakadu NT; AMT054 Litchfield NT2; IRIDO367 Darwin NT; AMT049 Newcastle Waters NT; AMT052 Lake Woods NT; AMT063 Kununurra WA; AMT044 Lakefield NT; AMT053 Litchfield NT; IRIDO331 Kununurra WA; IRIDO327 Kakadu NT; AMT033 Kakadu NT | 0.284 | P1 |
| AMT034 Wongalara NT; AMT037 Nhulunbuy NT | P3 | AMT036 Gove Peninsula NT; AMT043 Kakadu NT; IRIDO330 Kimberley WA; IRIDO370 Kimberley WA; IRIDO365 Limmen NT; IRIDO366 Lorella NT; IRIDO329 Lizard Island Qld; AMT055 Lizard Island Qld; IRIDO369 Lakefield NT; AMT037 Nhulunbuy NT; AMT034 Wongalara NT; IRIDO333 Kakadu NT | 0.047 | P3 |
| IRIDO326 Nitmiluk NT; AMT039 Nitmiluk NT | 0.511 | P6 |
* Partitions at prior maximal distances from P = 0.001668 to P = 0.004642.
Table A3.
Hypothetical species of Cardiocondyla nuda group defined using ABGD and PTP sequence-based algorithms. PTP shows maximum-likelihood support values. The closest matched hypothetical species as illustrated in the trees are indicated.
Table A3.
Hypothetical species of Cardiocondyla nuda group defined using ABGD and PTP sequence-based algorithms. PTP shows maximum-likelihood support values. The closest matched hypothetical species as illustrated in the trees are indicated.
| ABGD * | Hypothetical Species | PTP | Support | Hypothetical Species |
|---|---|---|---|---|
| AMT077 Mitchell Plateau WA; AMT078 Nitmiluk NT | A1 | AMT077 Mitchell Plateau WA; AMT078 Nitmiluk NT | 0.70 | A1 |
| TEA113 Weddell NT; AMT084 Darwin NT | N2 | TEA104 Mt Isa Qld; TEA112 Kimberley WA; TEA111 Kimberley WA; TEA110 Mitchell Falls WA; TEA103 Lizard Island Qld; AMT075 Kakadu NT; TEA096 Kakadu NT | 0.448 | A2 |
| TEA102 Tiwi NT | A3 | TEA102 Tiwi NT | 0.950 | A3 |
| TEA096 Kakadu NT; TEA112 Kimberley WA; TEA111 Kimberley WA; TEA110 Mitchell Falls WA; TEA104 Mt Isa Qld; TEA103 Lizard Island Qld; AMT075 Kakadu NT | A2 | TEA114 Kakadu NT | 0.961 | A4 |
| TEA114 Kakadu NT | A4 | TEA097 Lorella NT | 0.515 | A5 |
| TEA119 Sydney NSW; TEA115 south-eastern Qld; AMT079 Kangaroo Island SA | N1 | TEA109 Prince Regent WA | 0.515 | A5 |
| TEA109 Prince Regent WA; TEA097 Lorella NT | A5 | TEA115 south-eastern Qld; AMT079 Kangaroo Island SA | 0.444 | N1 |
| TEA121 Eurardy WA; TEA120 Eurardy WA; TEA117 south-eastern Qld; TEA107 south-eastern Qld; AMT076 Nitmiluk NT | A6, N3 | TEA119 Sydney NSW | 0.579 | N1 |
| TEA118 Lord Howe Island NSW | N4 | TEA113 Weddell NT; AMT084 Darwin NT | 0.493 | N2 |
| TEA121 Eurardy WA; TEA120 Eurardy WA; TEA117 south-eastern Qld; TEA107 south-eastern Qld; AMT076 Nitmiluk NT | 0.634 | A6, N3 | ||
| TEA118 Lord Howe Island NSW | 1.00 | N4 |
* Partitions at prior maximal distances from P = 0.004642 to P = 0.012915.
Table A4.
Hypothetical species of Camponotus novaehollandiae group defined using ABGD and PTP sequence-based algorithms. PTP shows maximum-likelihood support values. The closest matched hypothetical species as illustrated in the trees are indicated.
Table A4.
Hypothetical species of Camponotus novaehollandiae group defined using ABGD and PTP sequence-based algorithms. PTP shows maximum-likelihood support values. The closest matched hypothetical species as illustrated in the trees are indicated.
| ABGD * | Hypothetical Species | PTP | Support | Hypothetical Species |
|---|---|---|---|---|
| CAMPO051 Atherton Qld | N6 | CAMPO051 Atherton Qld | 1.000 | N6 |
| AMT021 Gove Peninsula NT | N7 | AMT021 Gove Peninsula NT | 1.000 | N7 |
| CAMPO024 Prince Regent WA | N9 | CAMPO024 Prince Regent WA | 1.000 | N9 |
| CAMPO018 Mt Isa Qld; CAMPO015 south Daly Waters NT | N8 | CAMPO018 Mt Isa Qld; CAMPO015 south Daly Waters NT | 0.777 | N8 |
| CAMPO059 south-eastern Qld | extensus | CAMPO059 south-eastern Qld | 1.000 | extensus |
| AMT001 Litchfield NT; AMT011 Berry Springs NT; AMT002 Litchfield NT; AMT005 Gove Peninsula NT; AMT008 Hughes NT; CAMPO030 Nhulunbuy NT | C1 | AMT005 Gove Peninsula NT; AMT008 Hughes NT; AMT001 Litchfield NT; AMT002 Litchfield NT; AMT011 Berry Springs NT; CAMPO030 Nhulunbuy NT | 0.588 | C1 |
| AMT015 Annaburroo NT; AMT016 Annaburroo NT; AMT017 Annaburroo NT; AMT019 Kakadu NT; AMT022 Gove Peninsula NT; AMT026 Litchfield NT; AMT027 Litchfield NT; AMT028 Annaburroo NT; AMT030 Bachsten Creek WA; AMT009 Kakadu NT; AMT010 Nitmiluk NT; AMT003 Bridge Creek NT; AMT006 Gove Peninsula NT; CAMPO050 Kimberley WA; CAMPO048 Arnhem NT; CAMPO047 Nitmiluk NT; CAMPO046 Kakadu NT; CAMPO045 Elsey NP NT; CAMPO044 Ringwood NT; CAMPO043 Roper River NT; CAMPO036 Mitchell Falls WA; CAMPO034 Ringwood NT; CAMPO033 NATT NT; CAMPO032 Nitmiluk NT; CAMPO031 Nitmiluk NT; CAMPO029 south-eastern Qld; CAMPO020 Mitchell Falls WA; CAMPO008 Kakadu NT | 9 | AMT027 Litchfield NT; CAMPO050 Kimberley WA; CAMPO033 NATT NT; CAMPO029 south-eastern Qld; AMT009 Kakadu NT; CAMPO008 Kakadu NT; AMT019 Kakadu NT; AMT022 Gove Peninsula NT; AMT006 Gove Peninsula NT; CAMPO046 Kakadu NT; CAMPO044 Ringwood NT; AMT028 Annaburroo NT; AMT003 Bridge Creek NT; AMT010 Nitmiluk NT; CAMPO032 Nitmiluk NT; CAMPO031 Nitmiluk NT; AMT016 Annaburroo NT; AMT017 Annaburroo NT; AMT015 Annaburroo NT; CAMPO034 Ringwood NT; CAMPO048 Arnhem NT; CAMPO047 Nitmiluk NT; CAMPO043 Roper River NT; CAMPO045 Elsey NP NT; AMT026 Litchfield NT; AMT030 Bachsten Creek WA; CAMPO036 Mitchell Falls WA; CAMPO020 Mitchell Falls WA | 0.600 | 9 |
| AMT024 Mitchell Falls WA; CAMPO039 Kununurra WA; CAMPO038 Kimberley WA; CAMPO021 Prince Regent WA | C2 | AMT024 Mitchell Falls WA; CAMPO039 Kununurra WA; CAMPO038 Kimberley WA; CAMPO021 Prince Regent WA | 0.957 | C2 |
| AMT012 Mt Elizabeth WA; CAMPO042 Lawn Hill Qld; CAMPO041 Mt Isa Qld; CAMPO040 Mt Isa Qld; CAMPO037 Prince Regent WA | C3, C4, C5 | CAMPO042 Lawn Hill Qld | 0.999 | C3 |
| CAMPO056 Newcastle Waters NT | fieldeae | CAMPO037 Prince Regent; AMT012 Mt Elizabeth WA | 0.784 | C4 |
| CAMPO054 Mt Isa Qld | fieldeae | CAMPO041 Mt Isa Qld; CAMPO040 Mt Isa Qld | 0.509 | C5 |
| CAMPO057 south Daly Waters NT | fieldeae | CAMPO056 Newcastle Waters NT | 0.694 | fieldeae |
| AMT031 Mt Elizabeth WA; CAMPO055 Nitmiluk NT | fieldeae | CAMPO054 Mt Isa Qld | 0.694 | fieldeae |
| CAMPO019 MtIsa Qld | N5 | CAMPO057 south Daly Waters NT | 0.711 | fieldeae |
| AMT018 Kakadu NT; CAMPO022 Kununurra WA; CAMPO013 North Daly Waters NT; CAMPO012 south Edith NT; CAMPO007 Nitmiluk NT | N4, N8 | AMT031 Mt Elizabeth WA | 0.754 | fieldeae |
| AMT014 Litchfield NT; CAMPO028 south-eastern Qld; CAMPO023 Brisbane Qld; CAMPO016 Newcastle Waters NT; CAMPO009 Nhulunbuy NT | N1, C6 | CAMPO055 Nitmiluk NT | 0.856 | fieldeae |
| AMT023 Mt Elizabeth WA; AMT025 Lizard Island Qld | N2, N3 | CAMPO019 Mt Isa Qld | 0.932 | N5 |
| CAMPO022 Kununurra WA; AMT018 Kakadu NT; CAMPO012 south Edith NT; CAMPO013 North Daly Waters NT; CAMPO007 Nitmiluk NT | 0.863 | N4 | ||
| CAMPO028 south-eastern QLD; CAMPO023 Brisbane Qld; CAMPO016 Newcastle Waters NT; AMT014 Litchfield NT; CAMPO009 Nhulunbuy NT | 0.821 | N1, C6 | ||
| AMT023 Mt Elizabeth WA | 0.663 | N2 | ||
| AMT025 Lizard Island Qld | 0.663 | N3 |
* Partitions at prior maximal distances from P = 0.001668 to P = 0.004642.
References
- Bowman, D.; Brown, G.; Braby, M.; Brown, J.; Cook, L.; Crisp, M.; Ford, F.; Haberle, S.; Hughes, J.; Isagi, Y. Biogeography of the Australian monsoon tropics. J. Biogeogr. 2010, 37, 201–216. [Google Scholar] [CrossRef]
- Kalippa, C.; Kerinaiua, W.; Wonaeamirri, M.; Hadden, K. Tiwi Islands Regional Natural Resource Management Strategy; Tiwi Land Council: Darwin, Australia, 2003; p. 134. [Google Scholar]
- Cook, G.D.; Heerdegen, R.G. Spatial variation in the duration of the rainy season in monsoonal Australia. Int. J. Climatol. 2001, 21, 1723–1732. [Google Scholar] [CrossRef]
- Woinarski, J.; Hempel, C.; Cowie, I.; Brennan, K.; Kerrigan, R.; Leach, G.; Russell-Smith, J. Distributional pattern of plant species endemic to the northern territory, Australia. Aust. J. Bot. 2006, 54, 627–640. [Google Scholar] [CrossRef]
- Andersen, A.N.; Jacklyn, P.; Dawes-Gromadzki, T.; Morris, I. Termites of Northern Australia; Barker Souvenirs: Alice Springs, Australia, 2005. [Google Scholar]
- Andersen, A.N. The Ants of Northern Australia: A Guide to the Monsoonal Fauna; CSIRO Publishing: Victoria, Australia, 2000. [Google Scholar]
- Slatyer, C.; Rosauer, D.; Lemckert, F. An assessment of endemism and species richness patterns in the Australian anura. J. Biogeogr. 2007, 34, 583–596. [Google Scholar] [CrossRef]
- Smith, K.L.; Harmon, L.J.; Shoo, L.P.; Melville, J. Evidence of constrained phenotypic evolution in a cryptic species complex of agamid lizards. Evolution 2011, 65, 976–992. [Google Scholar] [CrossRef] [PubMed]
- Potter, S.; Eldridge, M.D.; Taggart, D.A.; Cooper, S.J. Multiple biogeographical barriers identified across the monsoon tropics of northern Australia: Phylogeographic analysis of the brachyotis group of rock-wallabies. Mol. Ecol. 2012, 21, 2254–2269. [Google Scholar] [CrossRef] [PubMed]
- Criscione, F.; Köhler, F. Conserved shell disguises diversity in mesodontrachia land snails from the Australian monsoon tropics (gastropoda: Camaenidae). Zool. Scr. 2013, 42, 389–405. [Google Scholar] [CrossRef]
- Shapcott, A. Conservation and genetics in the fragmented monsoon rainforest in the northern territory, Australia: A case study of three frugivore-dispersed species. Aust. J. Bot. 2000, 48, 397–407. [Google Scholar] [CrossRef]
- Gopurenko, D.; Hughes, J.M. Regional patterns of genetic structure among Australian populations of the mud crab, scylla serrata (crustacea: Decapoda): Evidence from mitochondrial DNA. Mar. Freshw. Res. 2002, 53, 849–857. [Google Scholar] [CrossRef]
- Stępkowski, T.; Watkin, E.; McInnes, A.; Gurda, D.; Gracz, J.; Steenkamp, E.T. Distinct bradyrhizbium communities nodulate legumes native to temperate and tropical monsoon Australia. Mol. Phylogenet. Evol. 2012, 63, 265–277. [Google Scholar] [CrossRef] [PubMed]
- Woinarski, J.C.Z. Biogeography and conservation of reptiles, mammals and birds across north-western Australia: An inventory and base for planning an ecological reserve system. Wildl. Res. 1992, 19, 665–705. [Google Scholar] [CrossRef]
- Marin, J.; Donnellan, S.C.; Hedges, S.B.; Puillandre, N.; Aplin, K.P.; Doughty, P.; Hutchinson, M.N.; Couloux, A.; Vidal, N. Hidden species diversity of Australian burrowing snakes (ramphotyphlops). Biol. J. Linn. Soc. 2013, 110, 427–441. [Google Scholar] [CrossRef]
- Oliver, P.M.; Adams, M.; Doughty, P. Molecular evidence for ten species and oligo-miocene vicariance within a nominal Australian gecko species (crenadactylus ocellatus, diplodactylidae). BMC Evol. Biol. 2010, 10, 386. [Google Scholar] [CrossRef] [PubMed]
- Moritz, C.; Fujita, M.; Rosauer, D.; Agudo, R.; Bourke, G.; Doughty, P.; Palmer, R.; Pepper, M.; Potter, S.; Pratt, R. Multilocus phylogeography reveals nested endemism in a gecko across the monsoonal tropics of Australia. Mol. Ecol. 2015, 25, 1354–1366. [Google Scholar] [CrossRef] [PubMed]
- Moritz, C.; Pratt, R.C.; Bank, S.; Bourke, G.; Bragg, J.G.; Doughty, P.; Keogh, J.S.; Laver, R.J.; Potter, S.; Teasdale, L.C. Cryptic lineage diversity, body size divergence and sympatry in a species complex of Australian lizards (gehyra). Evolution 2017, 72, 54–66. [Google Scholar] [CrossRef] [PubMed]
- Couper, P.J.; Wilmer, J.W.; Roberts, L.; Amey, A.P.; Zug, G.R. Skinks currently assigned to carlia aerata (scincidae: Lygosominae) of north-eastern queensland: A preliminary study of cryptic diversity and two new species. Aust. J. Zool. 2005, 53, 35–49. [Google Scholar] [CrossRef]
- Potter, S.; Xue, A.T.; Bragg, J.G.; Rosauer, D.F.; Roycroft, E.J.; Moritz, C. Pleistocene climatic changes drive diversification across a tropical savanna. Mol. Ecol. 2017, 27, 520–532. [Google Scholar] [CrossRef] [PubMed]
- Pepper, M.; Ho, S.; Fujita, M.; Keogh, J. The genetic legacy of aridification: Miocene refugia fostered diversification while pleistocene climate cycles erased diversity in desert lizards. Mol. Phylogenet. Evol. 2011, 61, 750–759. [Google Scholar] [CrossRef] [PubMed]
- Oliver, P.M.; Doughty, P.; Palmer, R. Hidden biodiversity in rare northern Australian vertebrates: The case of the clawless geckos (crenadactylus, diplodactylidae) of the Kimberley. Wildl. Res. 2012, 39, 429–435. [Google Scholar] [CrossRef]
- Shea, G.; Couper, P.; Wilmer, J.W.; Amey, A. Revision of the genus cyrtodactylus gray, 1827 (squamata: Gekkonidae) in Australia. Zootaxa 2011, 3146, 1–63. [Google Scholar]
- Edwards, R. Biogeography of the Australian Monsoon Flora, with Emphasis on the Broad-Leaved Paperbarks (melaleuca leucadendra Species Complex). Ph.D. Thesis, School of Biological Sciences, University of Queensland, Brisbane, Australia, 2012. [Google Scholar]
- Koehler, F. Uncovering local endemism in the kimberley, western Australia: Description of new species of the genus amplirhagada iredale, 1933 (pulmonata, camaenidae). Rec. Aust. Mus. 2010, 62, 217–284. [Google Scholar] [CrossRef]
- Bostock, B.; Adams, M.; Laurenson, L.; Austin, C. The molecular systematics of leiopotherapon unicolor (günther, 1859): Testing for cryptic speciation in Australia’s most widespread freshwater fish. Biol. J. Linn. Soc. 2006, 87, 537–552. [Google Scholar] [CrossRef]
- Catullo, R.A.; Lanfear, R.; Doughty, P.; Keogh, J.S. The biogeographical boundaries of northern Australia: Evidence from ecological niche models and a multi-locus phylogeny of uperoleia toadlets (anura: Myobatrachidae). J. Biogeogr. 2014, 41, 659–672. [Google Scholar] [CrossRef]
- Eldridge, M.D.; Potter, S.; Johnson, C.N.; Ritchie, E.G. Differing impact of a major biogeographic barrier on genetic structure in two large kangaroos from the monsoon tropics of northern Australia. Ecol. Evol. 2014, 4, 554–567. [Google Scholar] [CrossRef] [PubMed]
- Westerman, M.; Blacket, M.J.; Hintz, A.; Armstrong, K.; Woolley, P.A.; Krajewski, C. A plethora of planigales: Genetic variability and cryptic species in a genus of dasyurid marsupials from northern Australia. Aust. J. Zool. 2016, 64, 303–311. [Google Scholar] [CrossRef]
- Oliver, P.M.; Bourke, G.; Pratt, R.C.; Doughty, P.; Moritz, C. Systematics of small gehyra (squamata: Gekkonidae) of the southern kimberley, western Australia: Redescription of g. Kimberleyi börner & schüttler, 1983 and description of a new restricted range species. Zootaxa 2016, 4107, 49–64. [Google Scholar] [CrossRef] [PubMed]
- Rosauer, D.; Blom, M.; Bourke, G.; Catalano, S.; Donnellan, S.; Gillespie, G.; Mulder, E.; Oliver, P.; Potter, S.; Pratt, R. Phylogeography, hotspots and conservation priorities: An example from the top end of Australia. Biol. Conserv. 2016, 204, 83–93. [Google Scholar] [CrossRef]
- Rosauer, D.F.; Pollock, L.J.; Linke, S.; Jetz, W. Phylogenetically informed spatial planning is required to conserve the mammalian tree of life. Proc. R. Soc. B 2017, 284, 20170627. [Google Scholar] [CrossRef] [PubMed]
- Australian Government. Our North, Our Futue: White Paper on Developing Northern Australia. Commonwealth of Australia. 2015. Available online: http://northernAustralia.gov.au/files/files/NAWP-FullReport.pdf (accessed on 22 November 2017).
- Andersen, A.N.; Majer, J.D. Ants show the way down-under: Invertebrates as bioindicators in land management. Front. Ecol. Environ. 2004, 2, 291–298. [Google Scholar] [CrossRef]
- Andersen, A.N.; Del Toro, I.; Parr, C.L. Savanna ant species richness is maintained along a bioclimatic gradient of increasing latitude and decreasing rainfall in northern Australia. J. Biogeogr. 2015, 42, 2313–2322. [Google Scholar] [CrossRef]
- Andersen, A.N. Ant megadiversity and its origins in arid Australia. Austral Entomol. 2016, 55, 132–137. [Google Scholar] [CrossRef]
- Andersen, A.N.; Arnan, X.; Sparks, K. Limited niche differentiation within remarkable co-occurrences of congeneric species: Monomorium ants in the Australian seasonal tropics. Austral Ecol. 2013, 38, 557–567. [Google Scholar] [CrossRef]
- Andersen, A.N.; Hoffmann, B.D.; Sparks, K. The megadiverse Australian ant genus melophorus: Using co1 barcoding to assess species richness. Diversity 2016, 8, 30. [Google Scholar] [CrossRef]
- Sparks, K.S.; Andersen, A.N.; Austin, A.D. Systematics of the monomorium rothsteini forel species complex (hymenoptera: Formicidae), a problematic ant group in Australia. Zootaxa 2014, 3893, 489–529. [Google Scholar] [CrossRef] [PubMed]
- Andersen, A.N.; Hoffmann, B.D.; Oberprieler, S.K. Diversity and biogeography of a species-rich ant fauna of the Australian seasonal tropics. Insect Sci. 2016, 1–8. [Google Scholar] [CrossRef] [PubMed]
- Andersen, A.N.; Lanoue, J.; Radford, I. The ant fauna of the remote mitchell falls area of tropical north-western Australia: Biogeography, environmental relationships and conservation significance. J. Insect Conserv. 2010, 14, 647–661. [Google Scholar] [CrossRef]
- Ball, S.L.; Armstrong, K.F. DNA barcodes for insect pest identification: A test case with tussock moths (lepidoptera: Lymantriidae). Can. J. For. Res. 2006, 36, 337–350. [Google Scholar] [CrossRef]
- Smith, M.A.; Woodley, N.E.; Janzen, D.H.; Hallwachs, W.; Hebert, P.D. DNA barcodes reveal cryptic host-specificity within the presumed polyphagous members of a genus of parasitoid flies (diptera: Tachinidae). Proc. Natl. Acad. Sci. USA 2006, 103, 3657–3662. [Google Scholar] [CrossRef] [PubMed]
- Barrett, R.D.; Hebert, P.D. Identifying spiders through DNA barcodes. Can. J. Zool. 2005, 83, 481–491. [Google Scholar] [CrossRef]
- Park, D.-S.; Foottit, R.; Maw, E.; Hebert, P.D. Barcoding bugs: DNA-based identification of the true bugs (insecta: Hemiptera: Heteroptera). PLoS ONE 2011, 6, e18749. [Google Scholar] [CrossRef] [PubMed]
- Cordero, R.D.; Sánchez-Ramírez, S.; Currie, D.C. DNA barcoding of aquatic insects reveals unforeseen diversity and recurrent population divergence patterns through broad-scale sampling in northern canada. Polar Biol. 2017, 40, 1687–1695. [Google Scholar] [CrossRef]
- Moritz, C.; Cicero, C. DNA barcoding: Promise and pitfalls. PLoS Biol. 2004, 2, e354. [Google Scholar] [CrossRef] [PubMed] [Green Version]
- Meyer, C.P.; Paulay, G. DNA barcoding: Error rates based on comprehensive sampling. PLoS Biol. 2005, 3, e422. [Google Scholar] [CrossRef] [PubMed]
- Rubinoff, D.; Cameron, S.; Will, K. A genomic perspective on the shortcomings of mitochondrial DNA for “barcoding” identification. J. Hered. 2006, 97, 581–594. [Google Scholar] [CrossRef] [PubMed]
- Will, K.W.; Mishler, B.D.; Wheeler, Q.D. The perils of DNA barcoding and the need for integrative taxonomy. Syst. Biol. 2005, 54, 844–851. [Google Scholar] [CrossRef] [PubMed]
- Toews, D.P.L.; Brelsford, A. The biogeography of mitochondrial and nuclear discordance in animals. Mol. Ecol. 2012, 21, 3907–3930. [Google Scholar] [CrossRef] [PubMed]
- Smith, M.A.; Fisher, B.L.; Hebert, P.D. DNA barcoding for effective biodiversity assessment of a hyperdiverse arthropod group: The ants of Madagascar. Philos. Trans. R. Soc. Lond. B Biol. Sci. 2005, 360, 1825–1834. [Google Scholar] [CrossRef] [PubMed]
- Webb, J.M.; Jacobus, L.M.; Funk, D.H.; Zhou, X.; Kondratieff, B.; Geraci, C.J.; DeWalt, R.E.; Baird, D.J.; Richard, B.; Phillips, I. A DNA barcode library for north american ephemeroptera: Progress and prospects. PLoS ONE 2012, 7, e38063. [Google Scholar] [CrossRef] [PubMed]
- Elwess, N.L.; Latourelle, S.M.; Myers, L. DNA barcoding of stoneflies (plecoptera) in a general genetics course. J. Biol. Educ. 2017, 1–9. [Google Scholar] [CrossRef]
- Zhou, X.; Adamowicz, S.J.; Jacobus, L.M.; DeWalt, R.E.; Hebert, P.D. Towards a comprehensive barcode library for arctic life-ephemeroptera, plecoptera, and trichoptera of churchill, manitoba, canada. Front. Zool. 2009, 6, 30. [Google Scholar] [CrossRef] [PubMed]
- Zahiri, R.; Lafontaine, J.D.; Schmidt, B.C.; Zakharov, E.V.; Hebert, P.D. A transcontinental challenge—A test of DNA barcode performance for 1,541 species of canadian noctuoidea (lepidoptera). PLoS ONE 2014, 9, e92797. [Google Scholar] [CrossRef] [PubMed]
- Hajibabaei, M.; Janzen, D.H.; Burns, J.M.; Hallwachs, W.; Hebert, P.D. DNA barcodes distinguish species of tropical lepidoptera. Proc. Natl. Acad. Sci. USA 2006, 103, 968–971. [Google Scholar] [CrossRef] [PubMed]
- Raupach, M.J.; Hendrich, L.; Küchler, S.M.; Deister, F.; Morinière, J.; Gossner, M.M. Building-up of a DNA barcode library for true bugs (insecta: Hemiptera: Heteroptera) of germany reveals taxonomic uncertainties and surprises. PLoS ONE 2014, 9, e106940. [Google Scholar] [CrossRef] [PubMed]
- Monaghan, M.T.; Balke, M.; Gregory, T.R.; Vogler, A.P. DNA-based species delineation in tropical beetles using mitochondrial and nuclear markers. Philos. Trans. R. Soc. Lond. B Biol. Sci. 2005, 360, 1925–1933. [Google Scholar] [CrossRef] [PubMed]
- Schmidt, S.; Schmid-Egger, C.; Morinière, J.; Haszprunar, G.; Hebert, P.D. DNA barcoding largely supports 250 years of classical taxonomy: Identifications for central european bees (hymenoptera, apoidea partim). Mol. Ecol. Resour. 2015, 15, 985–1000. [Google Scholar] [CrossRef] [PubMed]
- Nzelu, C.O.; Cáceres, A.G.; Arrunátegui-Jiménez, M.J.; Lañas-Rosas, M.F.; Yañez-Trujillano, H.H.; Luna-Caipo, D.V.; Holguín-Mauricci, C.E.; Katakura, K.; Hashiguchi, Y.; Kato, H. DNA barcoding for identification of sand fly species (diptera: Psychodidae) from leishmaniasis-endemic areas of peru. Acta Trop. 2015, 145, 45–51. [Google Scholar] [CrossRef] [PubMed]
- Renaud, A.K.; Savage, J.; Adamowicz, S.J. DNA barcoding of northern Nearctic Muscidae (diptera) reveals high correspondence between morphological and molecular species limits. BMC Ecol. 2012, 12, 24. [Google Scholar] [CrossRef] [PubMed]
- Wild, A.L. Evolution of the Neotropical ant genus linepithema. Syst. Entomol. 2009, 34, 49–62. [Google Scholar] [CrossRef]
- Kodandaramaiah, U.; Simonsen, T.J.; Bromilow, S.; Wahlberg, N.; Sperling, F. Deceptive single-locus taxonomy and phylogeography: Wolbachia-associated divergence in mitochondrial DNA is not reflected in morphology and nuclear markers in a butterfly species. Ecol. Evol. 2013, 3, 5167–5176. [Google Scholar] [CrossRef] [PubMed]
- Chong, J.P.; Harris, J.L.; Roe, K.J. Incongruence between mtdna and nuclear data in the freshwater mussel genus cyprogenia (bivalvia: Unionidae) and its impact on species delineation. Ecol. Evol. 2016, 6, 2439–2452. [Google Scholar] [CrossRef] [PubMed]
- Carstens, B.C.; Pelletier, T.A.; Reid, N.M.; Satler, J.D. How to fail at species delimitation. Mol. Ecol. 2013, 22, 4369–4383. [Google Scholar] [CrossRef] [PubMed]
- Struck, T.H.; Feder, J.L.; Bendiksby, M.; Birkeland, S.; Cerca, J.; Gusarov, V.I.; Kistenich, S.; Larsson, K.-H.; Liow, L.H.; Nowak, M.D. Finding evolutionary processes hidden in cryptic species. Trends Ecol. Evol. 2017, 33, 153–163. [Google Scholar] [CrossRef] [PubMed]
- Schlick-Steiner, B.C.; Steiner, F.M.; Moder, K.; Seifert, B.; Sanetra, M.; Dyreson, E.; Stauffer, C.; Christian, E. A multidisciplinary approach reveals cryptic diversity in western palearctic tetramorium ants (hymenoptera: Formicidae). Mol. Phylogenet. Evol. 2006, 40, 259–273. [Google Scholar] [CrossRef] [PubMed]
- Seifert, B. Cardiocondyla atalanta forel, 1915, a cryptic sister species of cardiocondyla nuda (mayr, 1866)(hymenoptera: Formicidae). Myrmecol. News 2008, 11, 43–48. [Google Scholar]
- Heterick, B.; Shattuck, S. Revision of the ant genus iridomyrmex (hymenoptera: Formicidae). Zootaxa 2011, 2845, 1–174. [Google Scholar]
- Kearse, M.; Moir, R.; Wilson, A.; Stones-Havas, S.; Cheung, M.; Sturrock, S.; Buxton, S.; Cooper, A.; Markowitz, S.; Duran, C. Geneious basic: An integrated and extendable desktop software platform for the organization and analysis of sequence data. Bioinformatics 2012, 28, 1647–1649. [Google Scholar] [CrossRef] [PubMed]
- Edgar, R.C. Muscle: Multiple sequence alignment with high accuracy and high throughput. Nucleic Acids Res. 2004, 32, 1792–1797. [Google Scholar] [CrossRef] [PubMed]
- Kumar, S.; Stecher, G.; Tamura, K. Mega7: Molecular evolutionary genetics analysis version 7.0 for bigger datasets. Mol. Biol. Evol. 2016, 33, 1870–1874. [Google Scholar] [CrossRef] [PubMed]
- Kimura, M. A simple method for estimating evolutionary rates of base substitutions through comparative studies of nucleotide sequences. J. Mol. Evol. 1980, 16, 111–120. [Google Scholar] [CrossRef] [PubMed]
- Stamatakis, A. Raxml version 8: A tool for phylogenetic analysis and post-analysis of large phylogenies. Bioinformatics 2014, 30, 1312–1313. [Google Scholar] [CrossRef] [PubMed]
- Nguyen, L.-T.; Schmidt, H.A.; von Haeseler, A.; Minh, B.Q. Iq-tree: A fast and effective stochastic algorithm for estimating maximum-likelihood phylogenies. Mol. Biol. Evol. 2014, 32, 268–274. [Google Scholar] [CrossRef] [PubMed]
- Trifinopoulos, J.; Nguyen, L.-T.; von Haeseler, A.; Minh, B.Q. W-iq-tree: A fast online phylogenetic tool for maximum likelihood analysis. Nucleic Acids Res. 2016, 44, W232–W235. [Google Scholar] [CrossRef] [PubMed]
- Minh, B.Q.; Nguyen, M.A.T.; von Haeseler, A. Ultrafast approximation for phylogenetic bootstrap. Mol. Biol. Evol. 2013, 30, 188–1195. [Google Scholar] [CrossRef] [PubMed]
- Chernomor, O.; von Haeseler, A.; Minh, B.Q. Terrace aware data structure for phylogenomic inference from supermatrices. Syst. Biol. 2016, 65, 997–1008. [Google Scholar] [CrossRef] [PubMed]
- Rambaut, A. Figtree: Molecular Evolution, Phylogenetics and Epidemiology. Available online: http://tree.bio.ed.ac.uk/software/figtree/ (accessed on 23 February 2017).
- ESRI. Arcgis Desktop: Release 9.2; Environmental Systems Research Institute: Redlands, CA, USA, 2008. [Google Scholar]
- Puillandre, N.; Lambert, A.; Brouillet, S.; Achaz, G. Abgd, automatic barcode gap discovery for primary species delimitation. Mol. Ecol. 2012, 21, 1864–1877. [Google Scholar] [CrossRef] [PubMed]
- Zhang, J.; Kapli, P.; Pavlidis, P.; Stamatakis, A. A general species delimitation method with applications to phylogenetic placements. Bioinformatics 2013, 29, 2869–2876. [Google Scholar] [CrossRef] [PubMed]
- Kekkonen, M.; Mutanen, M.; Kaila, L.; Nieminen, M.; Hebert, P.D. Delineating species with DNA barcodes: A case of taxon dependent method performance in moths. PLoS ONE 2015, 10, e0122481. [Google Scholar] [CrossRef] [PubMed]
- Hanisch, P.E.; Lavinia, P.D.; Suarez, A.V.; Lijtmaer, D.A.; Leponce, M.; Paris, C.I.; Tubaro, P.L. Mind the gap! Integrating taxonomic approaches to assess ant diversity at the southern extreme of the atlantic forest. Ecol. Evol. 2017, 7, 10451–10466. [Google Scholar] [CrossRef] [PubMed]
- Pepper, M.; Doughty, P.; Hutchinson, M.N.; Keogh, J.S. Ancient drainages divide cryptic species in Australia’s arid zone: Morphological and multi-gene evidence for four new species of beaked geckos (rhynchoedura). Mol. Phylogenet. Evol. 2011, 61, 810–822. [Google Scholar] [CrossRef] [PubMed]
- Oliver, P.M.; Smith, K.L.; Laver, R.J.; Doughty, P.; Adams, M. Contrasting patterns of persistence and diversification in vicars of a widespread Australian lizard lineage (the oedura marmorata complex). J. Biogeogr. 2014, 41, 2068–2079. [Google Scholar] [CrossRef]
- Doughty, P.; Palmer, R.; Sistrom, M.J.; Bauer, A.M.; Donnellan, S.C. Two new species of gehyra (squamata: Gekkonidae) geckos from the north-west kimberley region of western Australia. Rec. West. Aust. Mus. 2012, 27, 117–134. [Google Scholar] [CrossRef]
- Ješovnik, A.; Sosa-Calvo, J.; Lloyd, M.W.; Branstetter, M.G.; Fernandez, F.; Schultz, T.R. Phylogenomic species delimitation and host-symbiont coevolution in the fungus-farming ant genus sericomyrmex mayr (hymenoptera: Formicidae): Ultraconserved elements (uces) resolve a recent radiation. Syst. Entomol. 2017, 42, 523–542. [Google Scholar] [CrossRef]
- Zou, S.; Fei, C.; Song, J.; Bao, Y.; He, M.; Wang, C. Combining and comparing coalescent, distance and character-based approaches for barcoding microalgaes: A test with chlorella-like species (chlorophyta). PLoS ONE 2016, 11, e0153833. [Google Scholar] [CrossRef] [PubMed]
- Leavitt, S.D.; Divakar, P.K.; Ohmura, Y.; Wang, L.-S.; Esslinger, T.L.; Lumbsch, H.T. Who’s getting around? Assessing species diversity and phylogeography in the widely distributed lichen-forming fungal genus montanelia (parmeliaceae, ascomycota). Mol. Phylogenet. Evol. 2015, 90, 85–96. [Google Scholar] [CrossRef] [PubMed]
- Lin, X.; Stur, E.; Ekrem, T. Exploring genetic divergence in a species-rich insect genus using 2790 DNA barcodes. PLoS ONE 2015, 10, e0138993. [Google Scholar] [CrossRef] [PubMed] [Green Version]
Figure 1.
Map of Australia showing the Australian monsoonal tropics (AMT) region shaded in grey and the states and territories. WA = Western Australia, NT = Northern Territory, SA = South Australia, Qld = Queensland, NSW = New South Wales, Vic = Victoria, Tas = Tasmania. The AMT region is defined by its highly seasonal rainfall driven by the summer monsoon, and the dominant vegetation is tropical savanna.

Figure 2.
Species of Papyrius considered in this study. (A) Papyrius sp. 1, TEA 350 Nhulunbuy NT; (B) Papyrius sp. 2, TEA 377 south-eastern Qld; (C) Papyrius sp. 3, TEA 375 Dutchman Stern SA.
Figure 2.
Species of Papyrius considered in this study. (A) Papyrius sp. 1, TEA 350 Nhulunbuy NT; (B) Papyrius sp. 2, TEA 377 south-eastern Qld; (C) Papyrius sp. 3, TEA 375 Dutchman Stern SA.
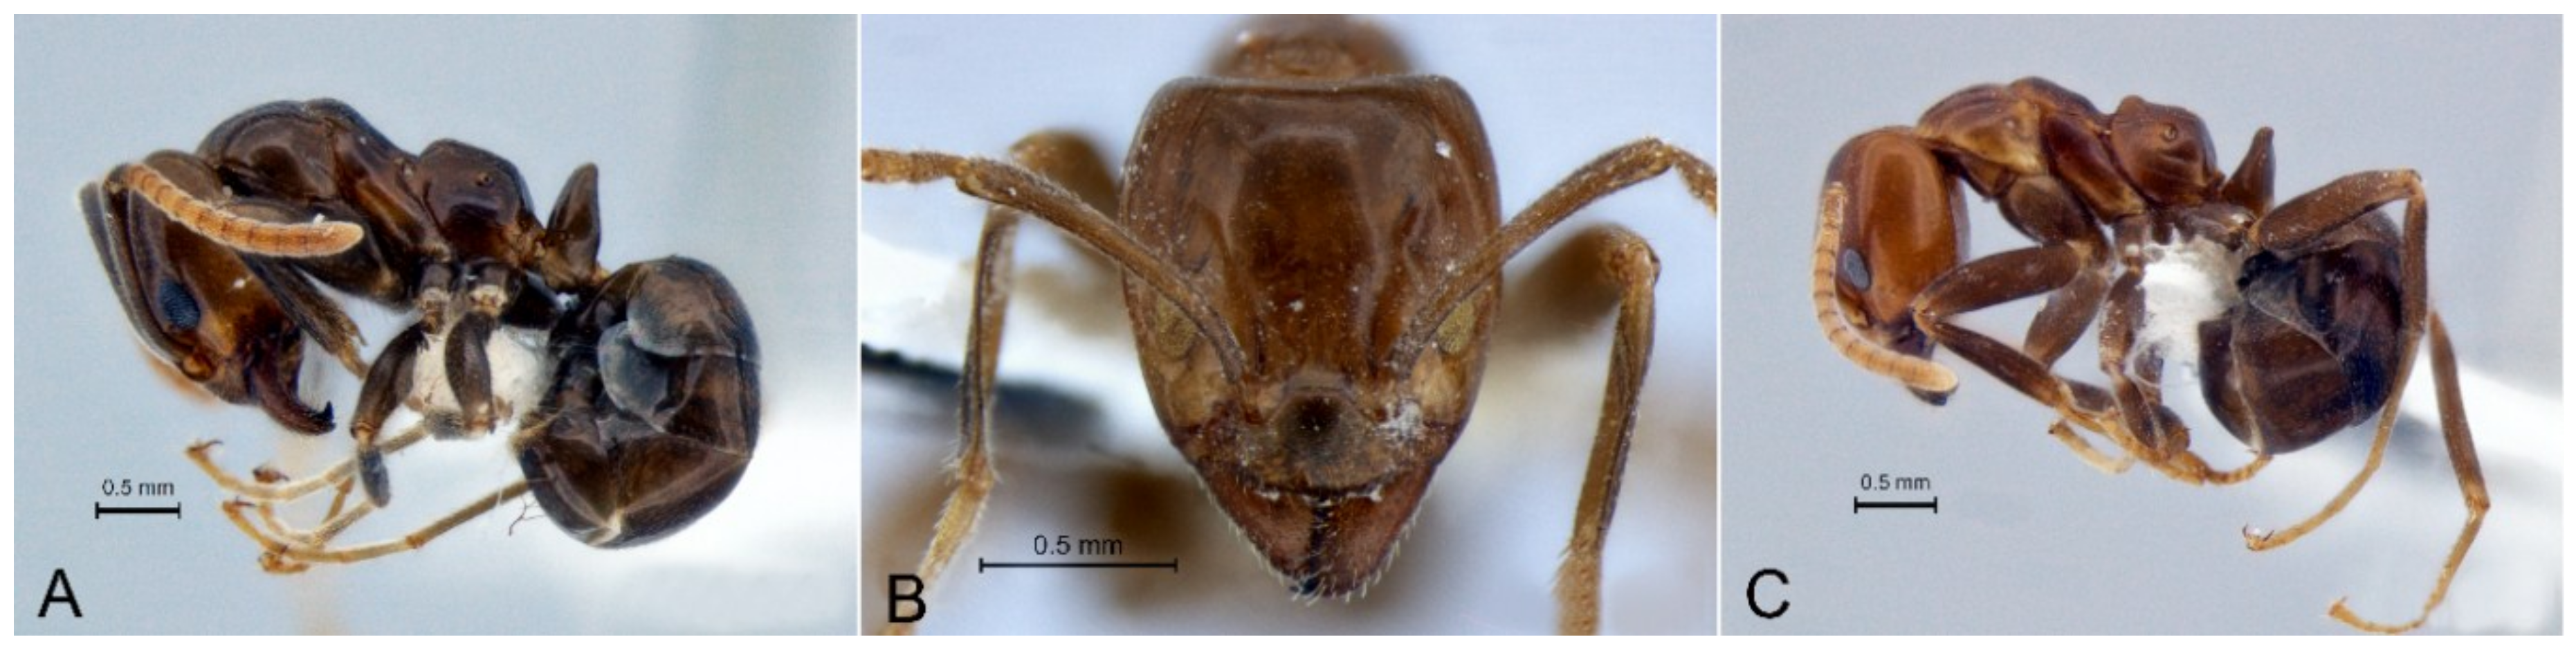
Figure 3.
Species of the Cardiocondyla nuda group considered in this study. (A–B) Car. ‘nuda’, TEA 120 Eurardy WA; (C) Car. ‘atalanta’, TEA 107 south-eastern Qld.
Figure 3.
Species of the Cardiocondyla nuda group considered in this study. (A–B) Car. ‘nuda’, TEA 120 Eurardy WA; (C) Car. ‘atalanta’, TEA 107 south-eastern Qld.

Figure 4.
Iridomyrmex ‘pallidus’. (A–C) AMT 037 Nhulunbuy NT; (D–F) IRIDO 332 Iron Range Qld.

Figure 5.
Species of the Camponotus novaehollandiae group considered in this study. (A) Cam. ‘novaehollandiae’, CAMPO 015 South Daly Waters NT; (B) Cam. ‘crozieri’, CAMPO 005 Gove Peninsula NT; (C) Cam. sp. 9, CAMPO 028 north-eastern Qld.
Figure 5.
Species of the Camponotus novaehollandiae group considered in this study. (A) Cam. ‘novaehollandiae’, CAMPO 015 South Daly Waters NT; (B) Cam. ‘crozieri’, CAMPO 005 Gove Peninsula NT; (C) Cam. sp. 9, CAMPO 028 north-eastern Qld.

Figure 6.
CO1 tree of the 31 sequenced specimens of Papyrius. Maximum-Likelihood phylogeny inferred using IQ-TREE; support values of nodes are given with ultrafast bootstrap; nodes with ≥90 and ≥70 Bayesian posterior probabilities are indicated by black and red circles, respectively. WA = Western Australia, NT = Northern Territory, Qld = Queensland. AMT region indicated in grey on map.

Figure 7.
Representatives of Papyrius sp. 1, frontal head full face. (A) sp. 1A, TEA 350 Nhulunbuy NT; (B) sp. 1B, TEA 094 Kimberley WA; (C) sp. 1C, TEA 346 Kakadu NT.
Figure 7.
Representatives of Papyrius sp. 1, frontal head full face. (A) sp. 1A, TEA 350 Nhulunbuy NT; (B) sp. 1B, TEA 094 Kimberley WA; (C) sp. 1C, TEA 346 Kakadu NT.

Figure 8.
CO1 tree of the 34 sequenced specimens of Iridomyrmex ‘pallidus’. Maximum-likelihood phylogeny inferred using IQ-TREE; support values of nodes are given with ultrafast bootstrap; nodes with ≥90 and ≥70 Bayesian posterior probabilities are indicated by black and red circles, respectively. WA = Western Australia, NT = Northern Territory, Qld = Queensland. AMT region indicated in grey on map.

Figure 9.
Representatives of Iridomyrmex ‘pallidus’, frontal head full face. (A) AMT 050 Newcastle Waters NT; (B) AMT 043 Kakadu NT; (C) AMT 056 Boydong Island Qld; (D) AMT 039 Nitmiluk NT.
Figure 9.
Representatives of Iridomyrmex ‘pallidus’, frontal head full face. (A) AMT 050 Newcastle Waters NT; (B) AMT 043 Kakadu NT; (C) AMT 056 Boydong Island Qld; (D) AMT 039 Nitmiluk NT.

Figure 10.
CO1 tree of the 24 sequenced specimens of the Cardiocondyla nuda group. Cardiocondyla species A1-6 represent C. ‘atalanta’ and species N1-4 represent C. ‘nuda’. Maximum-Likelihood phylogeny inferred using IQ-TREE; support values of nodes are given with ultrafast bootstrap; nodes with ≥90 and ≥70 Bayesian posterior probabilities are indicated by black and red circles, respectively. WA = Western Australia, NT = Northern Territory, Qld = Queensland, NSW = New South Wales. AMT region indicated in grey on maps; species N4 is located on Lord Howe Island off the east coast of Australia.

Figure 11.
Representatives of Cardiocondyla nuda group, showing lateral view (A) and variation in gastric pubescence (B–D). (A) TEA 114 Kakadu NT; (B) TEA 121 Eurardy WA; (C) TEA 118 Lord Howe Island NSW; (D) TEA 113 Weddell NT. Cardiocondyla species A = ‘atalanta’ and species N = ‘nuda’.
Figure 11.
Representatives of Cardiocondyla nuda group, showing lateral view (A) and variation in gastric pubescence (B–D). (A) TEA 114 Kakadu NT; (B) TEA 121 Eurardy WA; (C) TEA 118 Lord Howe Island NSW; (D) TEA 113 Weddell NT. Cardiocondyla species A = ‘atalanta’ and species N = ‘nuda’.

Figure 12.
CO1 tree of the 67 sequenced specimens of the Camponotus novahoellandiae group. Camponotus species N1–9 represent uniformly yellowish forms (Cam. ‘novahoellandiae’) and species C1–6 represent bi-coloured forms (Cam. ‘crozieri’). Maximum-likelihood phylogeny inferred using IQ-TREE; support values of nodes are given with ultrafast bootstrap; nodes with ≥90 and ≥70 Bayesian posterior probabilities are indicated by black and red circles, respectively. WA = Western Australia, NT = Northern Territory, Qld = Queensland. AMT region indicated in grey on maps.

Figure 13.
Representatives of Camponotus novahoellandiae group. (A–C) Cam. ‘novahoellandiae’; (A) CAMPO 016 Newcastle Waters NT; (B) CAMPO 012 south Edith Falls NT; (C) CAMPO 019 Mt. Isa Qld; (D–H) Cam. ‘crozieri’; (D) CAMPO 023 Brisbane Qld; (E) CAMPO 040 Mt. Isa Qld; (F) CAMPO 037 Prince Regent WA; (G) CAMPO 042 Lawn Hill Qld; (H) CAMPO 030 Nhulunbuy NT. Camponotus species N1–9 = ‘novahoellandiae’ and species C1–6 = ‘crozieri’.

© 2018 by the authors. Licensee MDPI, Basel, Switzerland. This article is an open access article distributed under the terms and conditions of the Creative Commons Attribution (CC BY) license (http://creativecommons.org/licenses/by/4.0/).
Share and Cite
MDPI and ACS Style
Oberprieler, S.K.; Andersen, A.N.; Moritz, C.C. Ants in Australia’s Monsoonal Tropics: CO1 Barcoding Reveals Extensive Unrecognised Diversity. Diversity 2018, 10, 36. https://doi.org/10.3390/d10020036
AMA Style
Oberprieler SK, Andersen AN, Moritz CC. Ants in Australia’s Monsoonal Tropics: CO1 Barcoding Reveals Extensive Unrecognised Diversity. Diversity. 2018; 10(2):36. https://doi.org/10.3390/d10020036
Chicago/Turabian StyleOberprieler, Stefanie K., Alan N. Andersen, and Craig C. Moritz. 2018. "Ants in Australia’s Monsoonal Tropics: CO1 Barcoding Reveals Extensive Unrecognised Diversity" Diversity 10, no. 2: 36. https://doi.org/10.3390/d10020036
Note that from the first issue of 2016, this journal uses article numbers instead of page numbers. See further details here.