Distributional Patterns and Ecological Determinants of Bat Occurrence Inside Caves: A Broad Scale Meta-Analysis


1
School of Biological and Chemical Sciences, Queen Mary University of London, Mile End Road, London EI 4NS, UK
2
Laboratório de Genética e Biodiversidade, Instituto de Ciências Biológicas, Universidade Federal de Goiás (UFG) Campus II, Goiânia, MO 74001970, Brazil
3
Faculdade de Ciências da Educação e Saúde, Centro Universitário de Brasília, Brasília, DF 70790-075, Brazil
*
Author to whom correspondence should be addressed.
Diversity 2018, 10(3), 49; https://doi.org/10.3390/d10030049
Submission received: 16 March 2018
/
Revised: 13 June 2018
/
Accepted: 16 June 2018
/
Published: 21 June 2018
(This article belongs to the Special Issue Diversity and Conservation of Bats)
Abstract
:Caves are important bat roosts worldwide that are used as shelters, maternity roosts, and to help in thermoregulation. Bat abundances, species richness, and association patterns inside caves can be affected by large-scale environmental variation. However, few studies have analyzed the effect of latitudinal and altitudinal variations on these patterns. Here, we conducted a large literature review about cave occupation by bats in Brazil. We investigated the effects of elevation and latitude on bat richness and abundance, the effect of Brazilian biomes on bats’ abundance and richness, the dependence between feeding guilds and biomes, and the effects of the number of studies conducted and the number of caves per region on bat species richness. A total of 72 studies with 9666 bats from 72 species were registered in 247 caves. We found that species richness increases toward the equator and reaches its limit at low and intermediate altitudes. Reported richness was influenced by the number of studies conducted in each region. Both latitude and elevation explained the variation in abundance and were significantly affected by biome type. The latitudinal and elevational gradient for species’ richness and abundance may be explained by the creation of stable thermal conditions in roosts at high elevations and low latitudes.
1. Introduction
Understanding why diversity varies across the globe has attracted the interest of ecologists for centuries [1,2]. Different hypotheses have been proposed to explain the variation in the number of species, community structure, and life history traits on a global scale [3]. Variation in species’ richness and abundance has been shown to be affected by both broad and local-scale determinants [3,4,5]. From a broad-scale perspective, the latitudinal gradient is one of the most widely accepted patterns in ecology [2,6,7,8].
Despite some exceptions [9,10,11], the phenomenon of biodiversity increasing toward the equator has been demonstrated for different taxonomic groups such as birds, mammals, fishes, invertebrates, and plants [12,13,14,15]. Similarly, an elevational trend has also been reported, with areas of higher altitude presenting greater species richness and endemism for different taxa [16,17]. The mean altitude where diversity reaches its peak has been shown to vary across taxonomic groups, being higher in non-flying mammals and intermediate in bats [18], but at least 50% of the studies conducted in high altitude mountains (above 2000 m) show support for the hypothesis of a highest species richness at mid-elevational altitudes [19,20].
On the other hand, local-scale characteristics such as climate, vegetation structure, and composition may also influence animal community characteristics [21,22,23,24]. Recent studies using different taxonomic groups reinforced the role of local environmental parameters such as climate and habitat heterogeneity on species richness and community composition [25,26].
Bats (Mammalia: Chiroptera) compose a highly diverse and specialized group with more than 1300 species worldwide [27]. Some of them are particularly important for the Neotropics because of the ecological services they provide [28,29,30]. Both latitudinal and elevational trends have been reported for bat species [20,31,32,33,34]. Habitat characteristics have also been demonstrated to affect assemblage composition, feeding guilds, species richness, and abundance [35], making Chiroptera an excellent group to investigate ecological patterns from a broader perspective.
Several studies have investigated different aspects of cave usage by bats of many species [36,37,38,39]. Cave availability affects bat species richness, abundance, and assemblage composition and may have had an important role in shaping the evolution of different aspects of the group, such as life history traits, movement dynamics, activity patterns, and foraging behavior. Caves serve as roosts, especially because they present stable climate conditions and protection against predators [40,41]. Latitude presents a potential effect on cave roosting by bats. As latitude increases, temperature decreases, seasonal variations increase [42], and there is a decrease in plant species richness [43]. Brazilian biomes, for example, tend to have lower habitat complexity in higher latitudes, such as wetlands, savannas, and grasslands, in comparison with low latitude biomes such as the Amazon forest. These factors should have a strong effect on roost preferences for caves by bats, with more bat species and individuals expected to be found within caves at higher latitudes due to the low number of other shelter options in the landscape, such as tree hollows and foliage roosting under the canopy, and the decrease in temperatures, which should further increase the importance of caves because of their stable climatic conditions.
Bat species from different feeding guilds present important variations in their metabolism and thermoregulatory capacities [44], which also affect their roost choice and use [45]. Heterothermic and non-insectivorous species tend to use colder caves with a wide range of temperatures, while homeothermic and insectivorous species roost in warmer caves [44,45]. Although many bat species in the Neotropics do not show a specific temperature requirement for cave selection [44], cave temperature is the most important variable for roost selection in temperate bats [45,46,47] and possibly an important factor for subtropical and tropical species as well [48,49]. Thus, an increase in latitude is expected to differently affect the preferences for caves from each bat feeding guild and change the distribution of bat species richness and abundance of each feeding guild inside caves.
In this paper, we review the association between bats and caves within broad latitudinal and elevational scales. The main objective of the present study was to assess the effect of latitude, elevation, and biome type on the richness, abundance, and assemblage composition of cave-dwelling bats. Given the well-established patterns of latitudinal and elevational trends we hypothesize that (1) caves closer to the equator hold higher levels of bat richness and abundance, and (2) considering the evidence regarding the mid-elevational peak in diversity [50], richness and abundance is expected to be higher at mid-elevations. We also expect to find (3) a higher similarity in assemblage composition and feeding guilds between spatially closer and structurally similar biomes. Additionally, we evaluated the possibility of a deficit of knowledge about cave-dwelling bats by critically analyzing the number of caves registered for Brazil against the number of caves where studies have been conducted.
2. Methods
2.1. Study Area
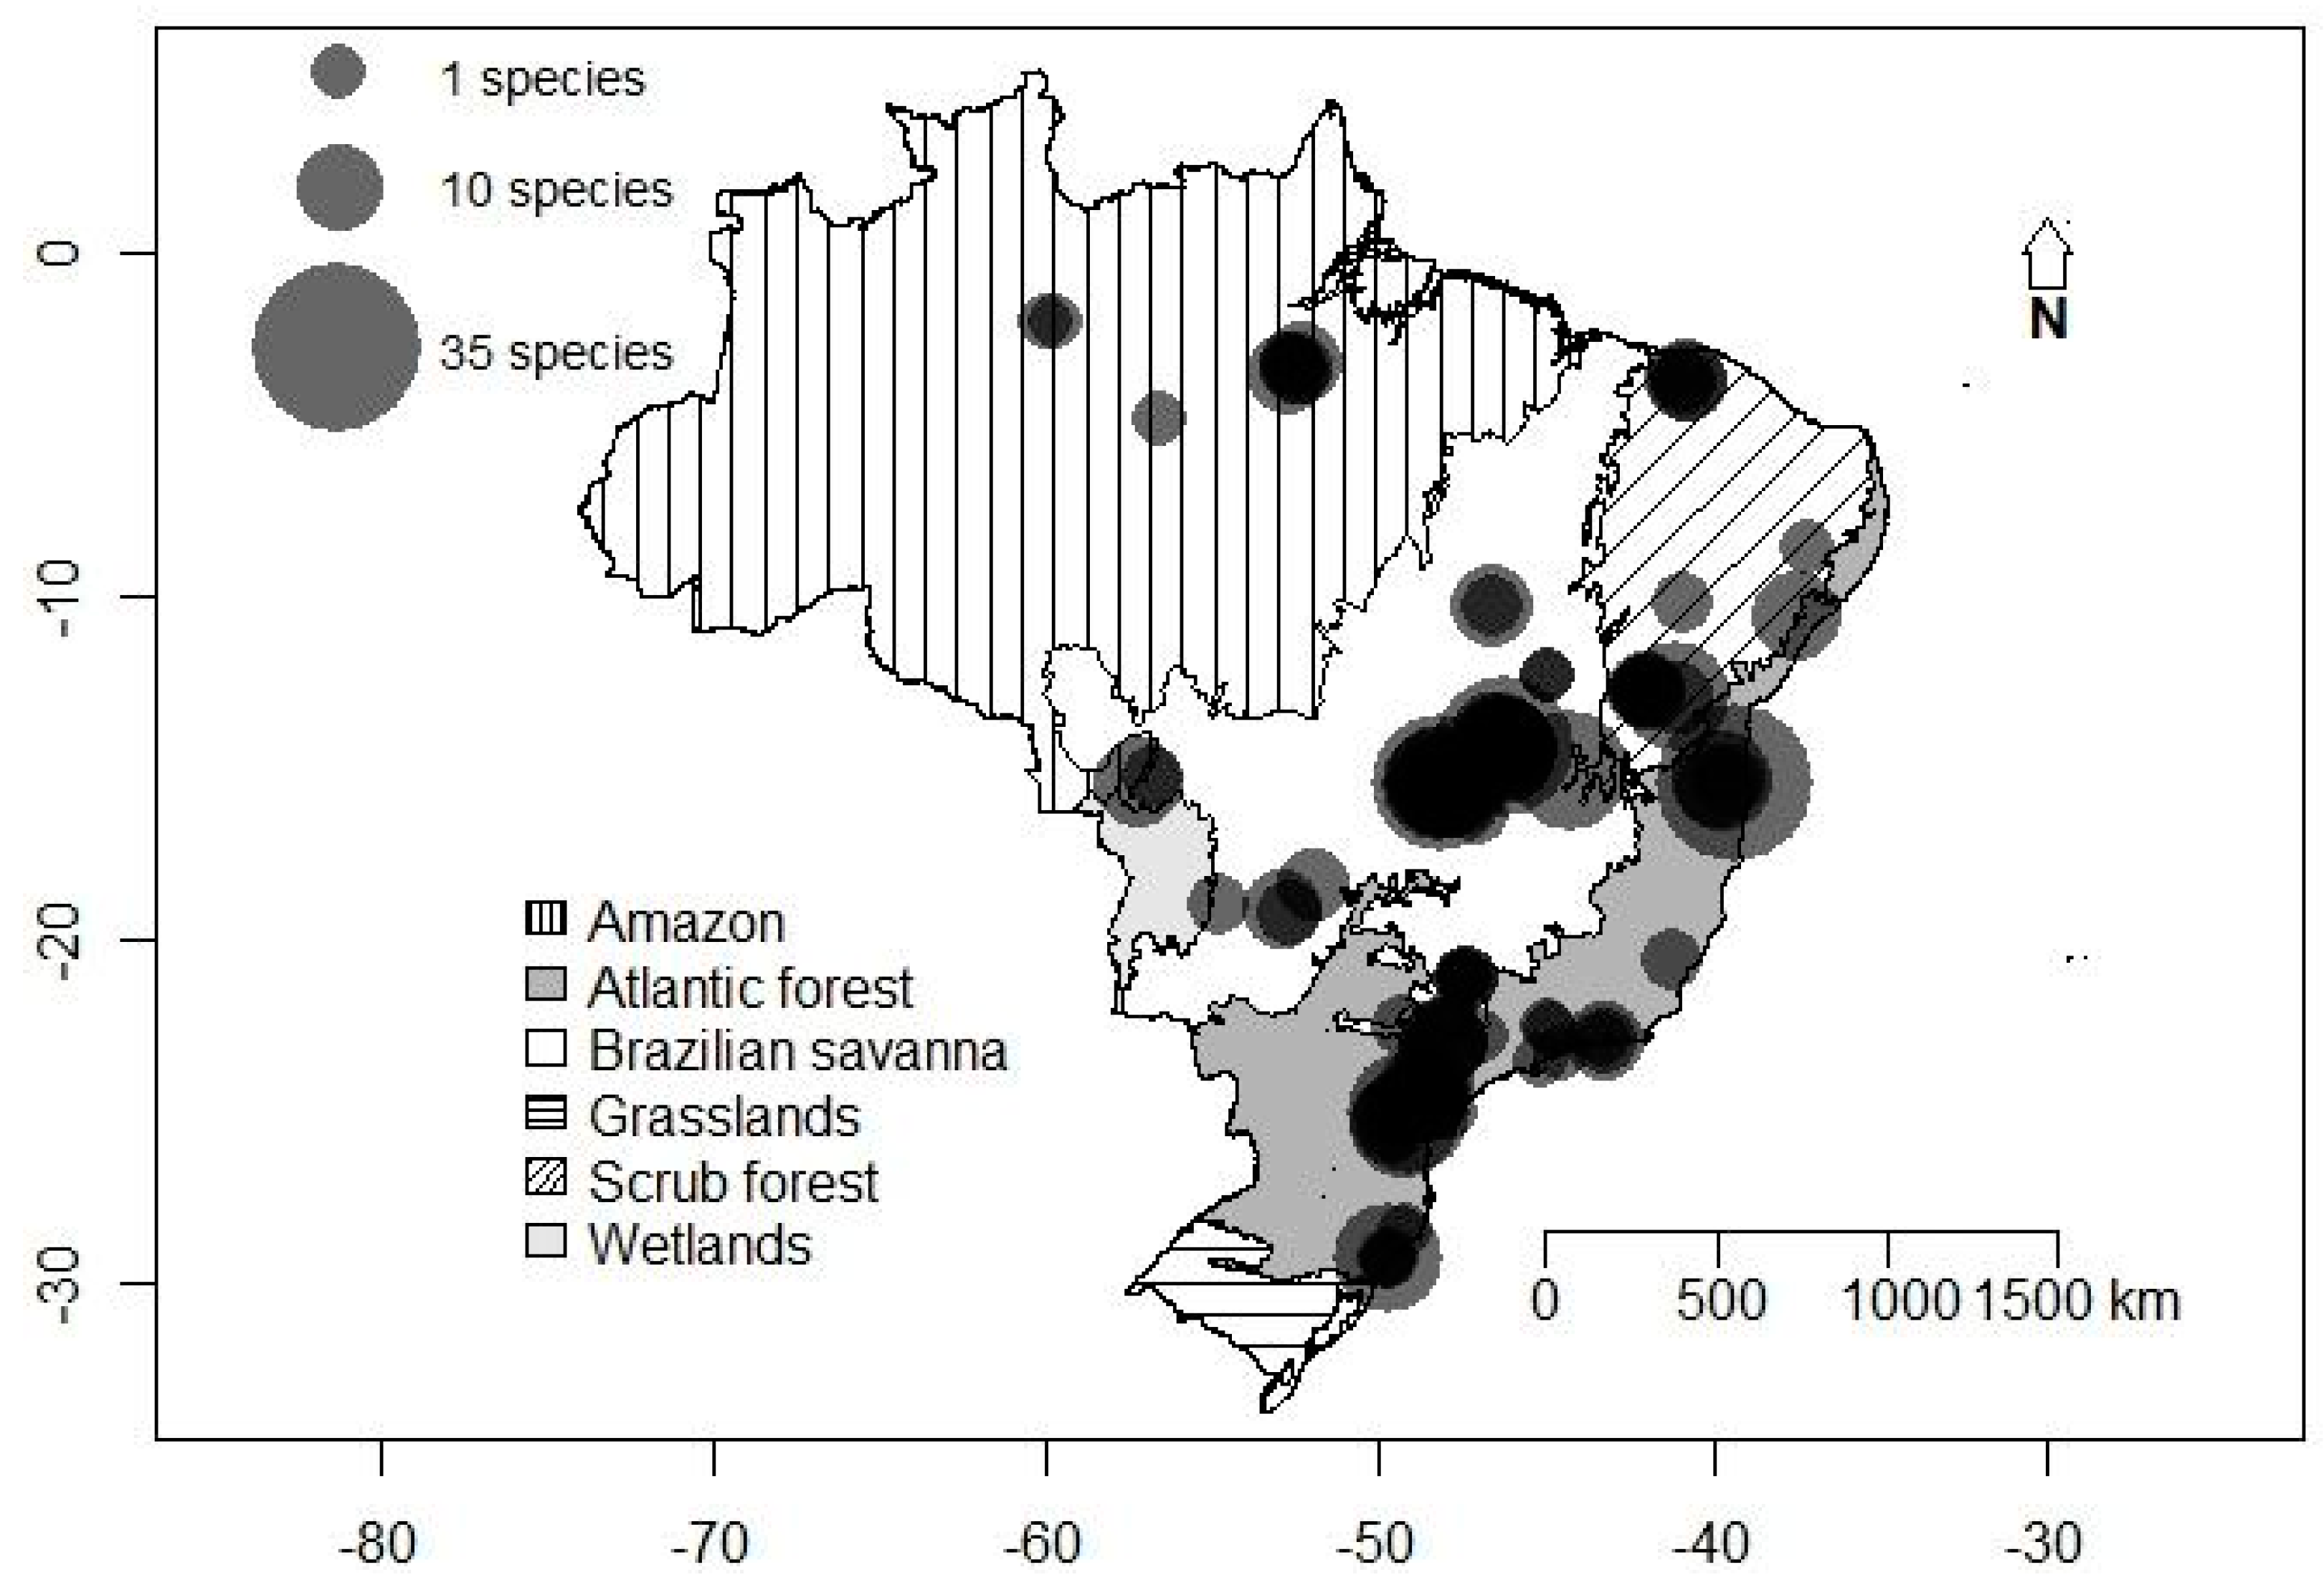
Brazil is a country with more than 8,000,000 km2 distributed across almost 40° of variation in latitude (05° N to 33° S) (Figure 1). Brazil also presents a wide variation in altitude, starting from the sea level up to ~3000 m elevation. The main terrestrial biomes found within the country are Amazon forest, Brazilian savanna (cerrado), wetlands, scrub forest, Atlantic forest, and grasslands [51]. Around 5% of Brazil’s territory consists of carbonate caves [52] totaling more than 10,000 caves of different lithology types [53]. The country holds one of the world’s richest bat faunas, with approximately 178 species belonging to nine families, representing more than 13.69% of global bat biodiversity [54,55].
2.2. Literature Review
The search for bat occurrence in Brazilian natural caves was carried out through an extensive literature review of articles, dissertations, and theses in different databases (Web of Knowledge, Scirus, and Google Scholar, Supplementary Materials). The search was based on the keywords bat, Chiroptera, and cave. We also used Brazilian Portuguese words that are synonyms for caves (e.g., gruta, furna, and lapa) and bats (morcegos) in the search. The following information was compiled for each cave: cavity name, geographic coordinates, elevation, species richness and abundance, assemblage composition, biome where the cavity is located, and state and region of Brazil. The information about bat assemblages (species richness, composition, and abundance) in each was reported according to the information found in the results section of each article. For some analyses, we excluded studies lacking precise information regarding assemblage composition and species abundance. We also excluded studies that were unsure about species identification or that used family as the lowest classification level. The Brazilian database from the National Centre for Research and Conservation of Caves (CECAV) was used to assess the number, distribution, and location of the caves [52]. Bat species were classified in feeding guilds according to most prominent resource used, following Simmons and Voss [56], and their adaptations for their feeding habits. To calculate the bat biomass of each feeding guild, we used the average body weight presented in Reis et al. and Emmons and Feer [57,58] or in its records of the Mammalian Species when it was not present in any of these. For each species, we multiplied the total abundance of that species by the average biomass found in the literature and summed all the results for all the species in each feeding guild.
2.3. Statistical Analysis
The analyses were conducted using the software R [59]. We used generalized additive models (GAMs) from the Poisson family (package mgcv) to investigate the effects of elevation and latitude on bat richness and abundance. Given the fact that some studies did not provide information about cave elevation, data was obtained using the function elevation (package rgbif). GAMs are a nonparametric extension of generalized linear models (GLMs) that are particularly useful to model non-linear responses of biological variables [60]. We used the cubic spline smoother (s) to model the elevational effect on the response variables. We used GLMs to evaluate the effect of Brazilian biomes on the abundance and richness of cave-dwelling bats, also using the Poisson family. To avoid losing sample size due to the indetermination of the biome to which the cave belongs, we assigned caves located in biome transitions to the biome to which the cave was closer. Due to low sample size and a large amount of studies not reporting the abundance, we did not include the Amazon forest for this analysis. For the GLMs, we decided to pool the data from wetlands and Brazilian savanna given the similarities between the biomes and due to the low sample size obtained for the wetlands. We used a log-linear model to evaluate the dependence between feeding guilds and biomes (package MASS). Additionally, we investigated the effects of the number of studies conducted and the number of caves per Brazilian states on bat richness. We hypothesized that states with a higher number of studies conducted would report higher bat richness as well as states with a higher number of caves. We evaluated overdispersion in our data by estimating the ratio of residual deviance to residual degrees of freedom [61,62]. Differences in model fit were estimated through likelihood ratio tests (LRTs), using the difference in deviance as a Chi-squared approximation and keeping the simpler model whenever the removal of the variable caused no significant decrease in model fit [61,63]. We used the Tukey post-hoc test (glht in the R package “multcomp”) to evaluate differences between levels of dummy variables. We inspected the normal probability plots of the residuals to verify if the assumptions of normality and homogeneity of variance were met and by plotting residuals against the explanatory variables we checked for nonlinearity [64]. Finally, we performed a cluster analysis in the R package vegan [65] using a Bray-Curtis dissimilarity index with binary data on species occurrence relative to the Brazilian biomes.
3. Results
3.1. General Patterns of Cave Use
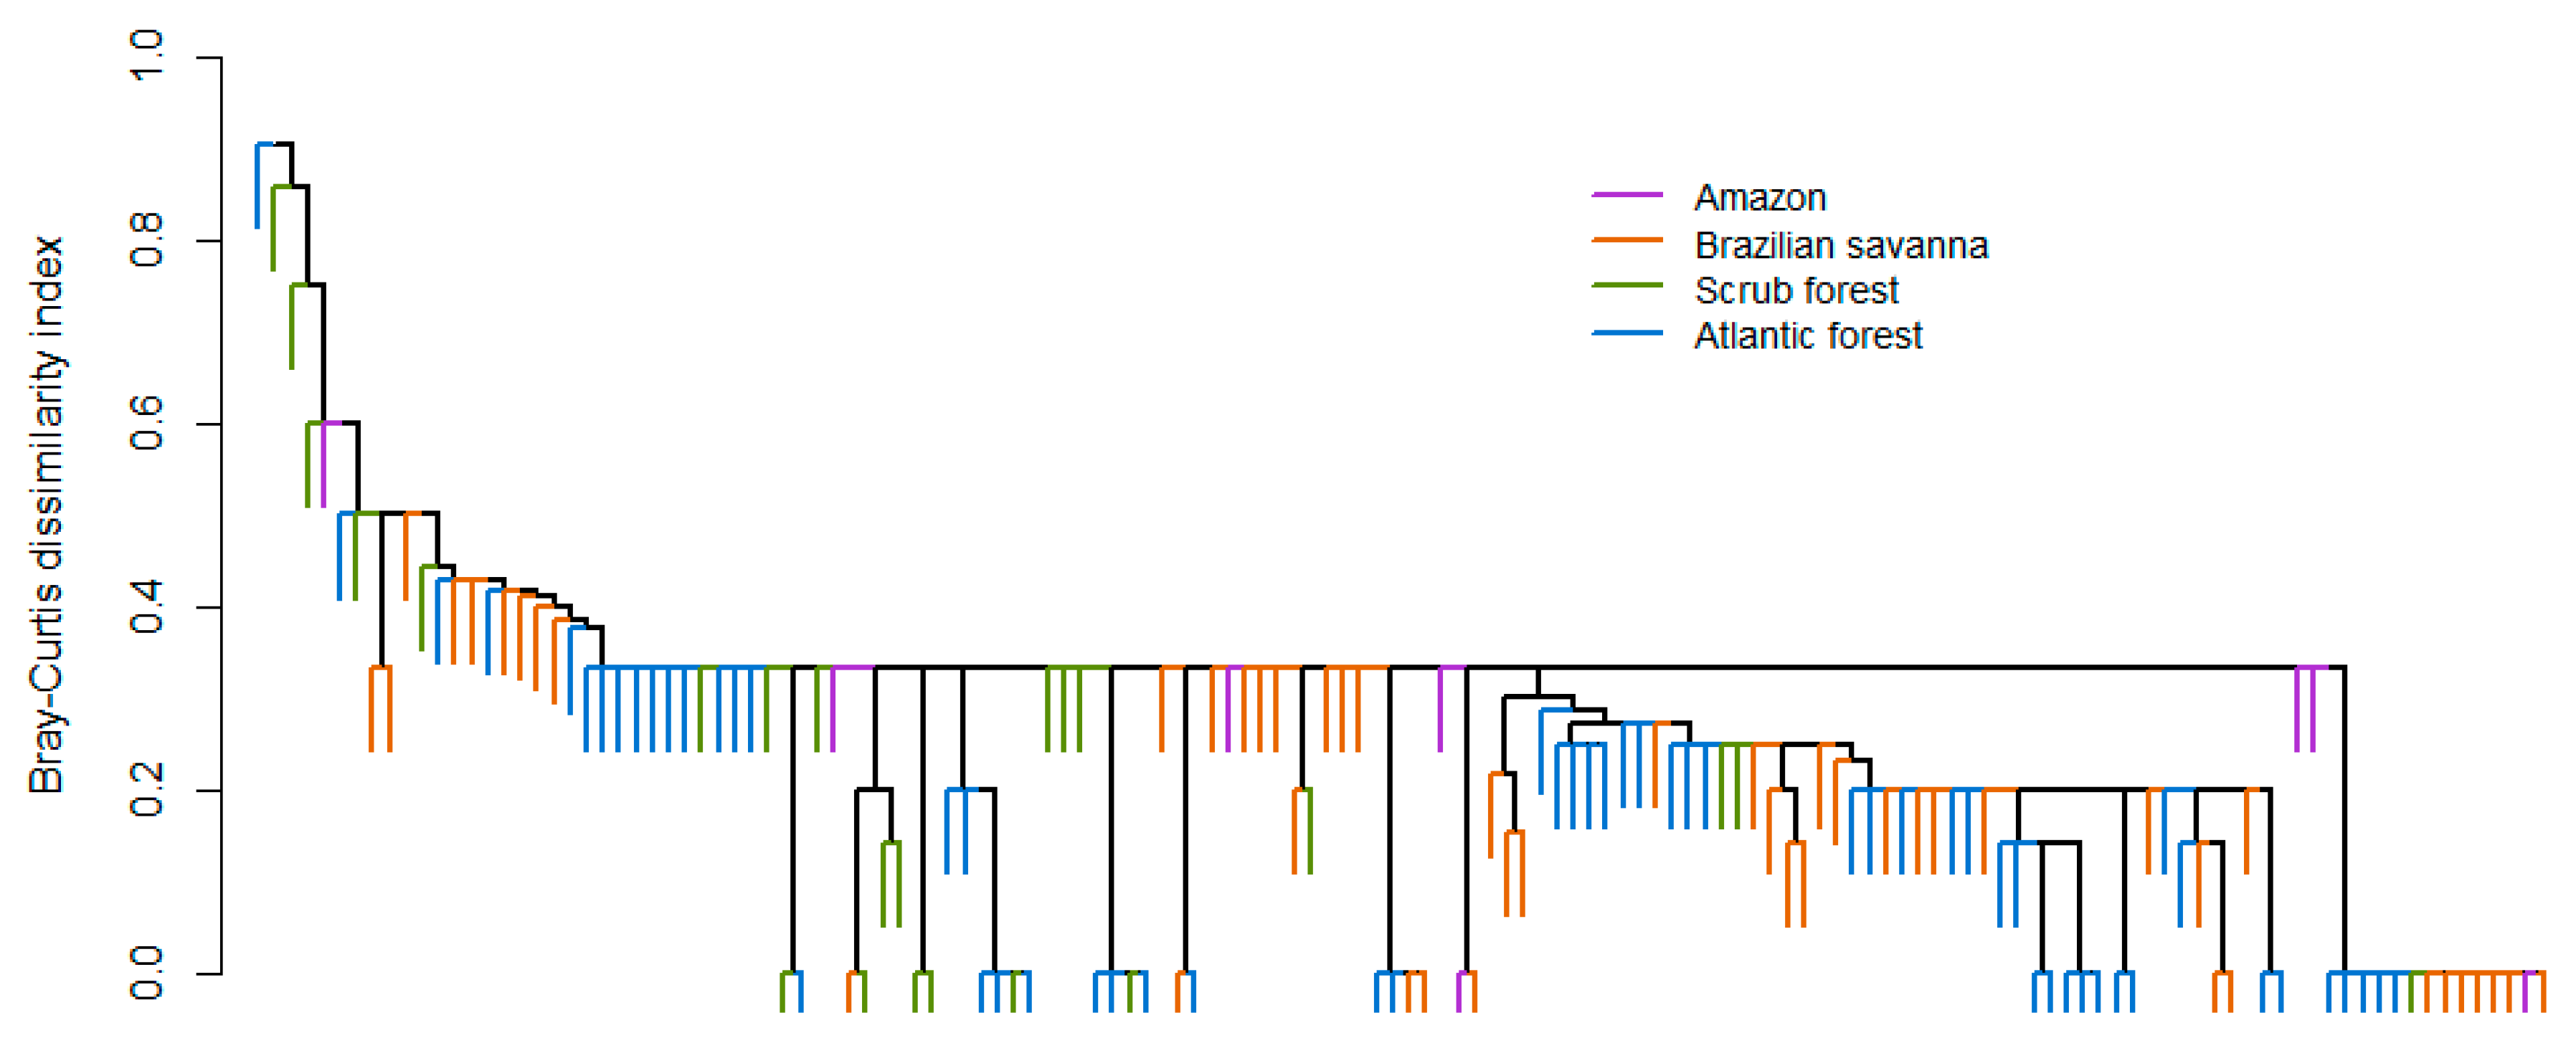
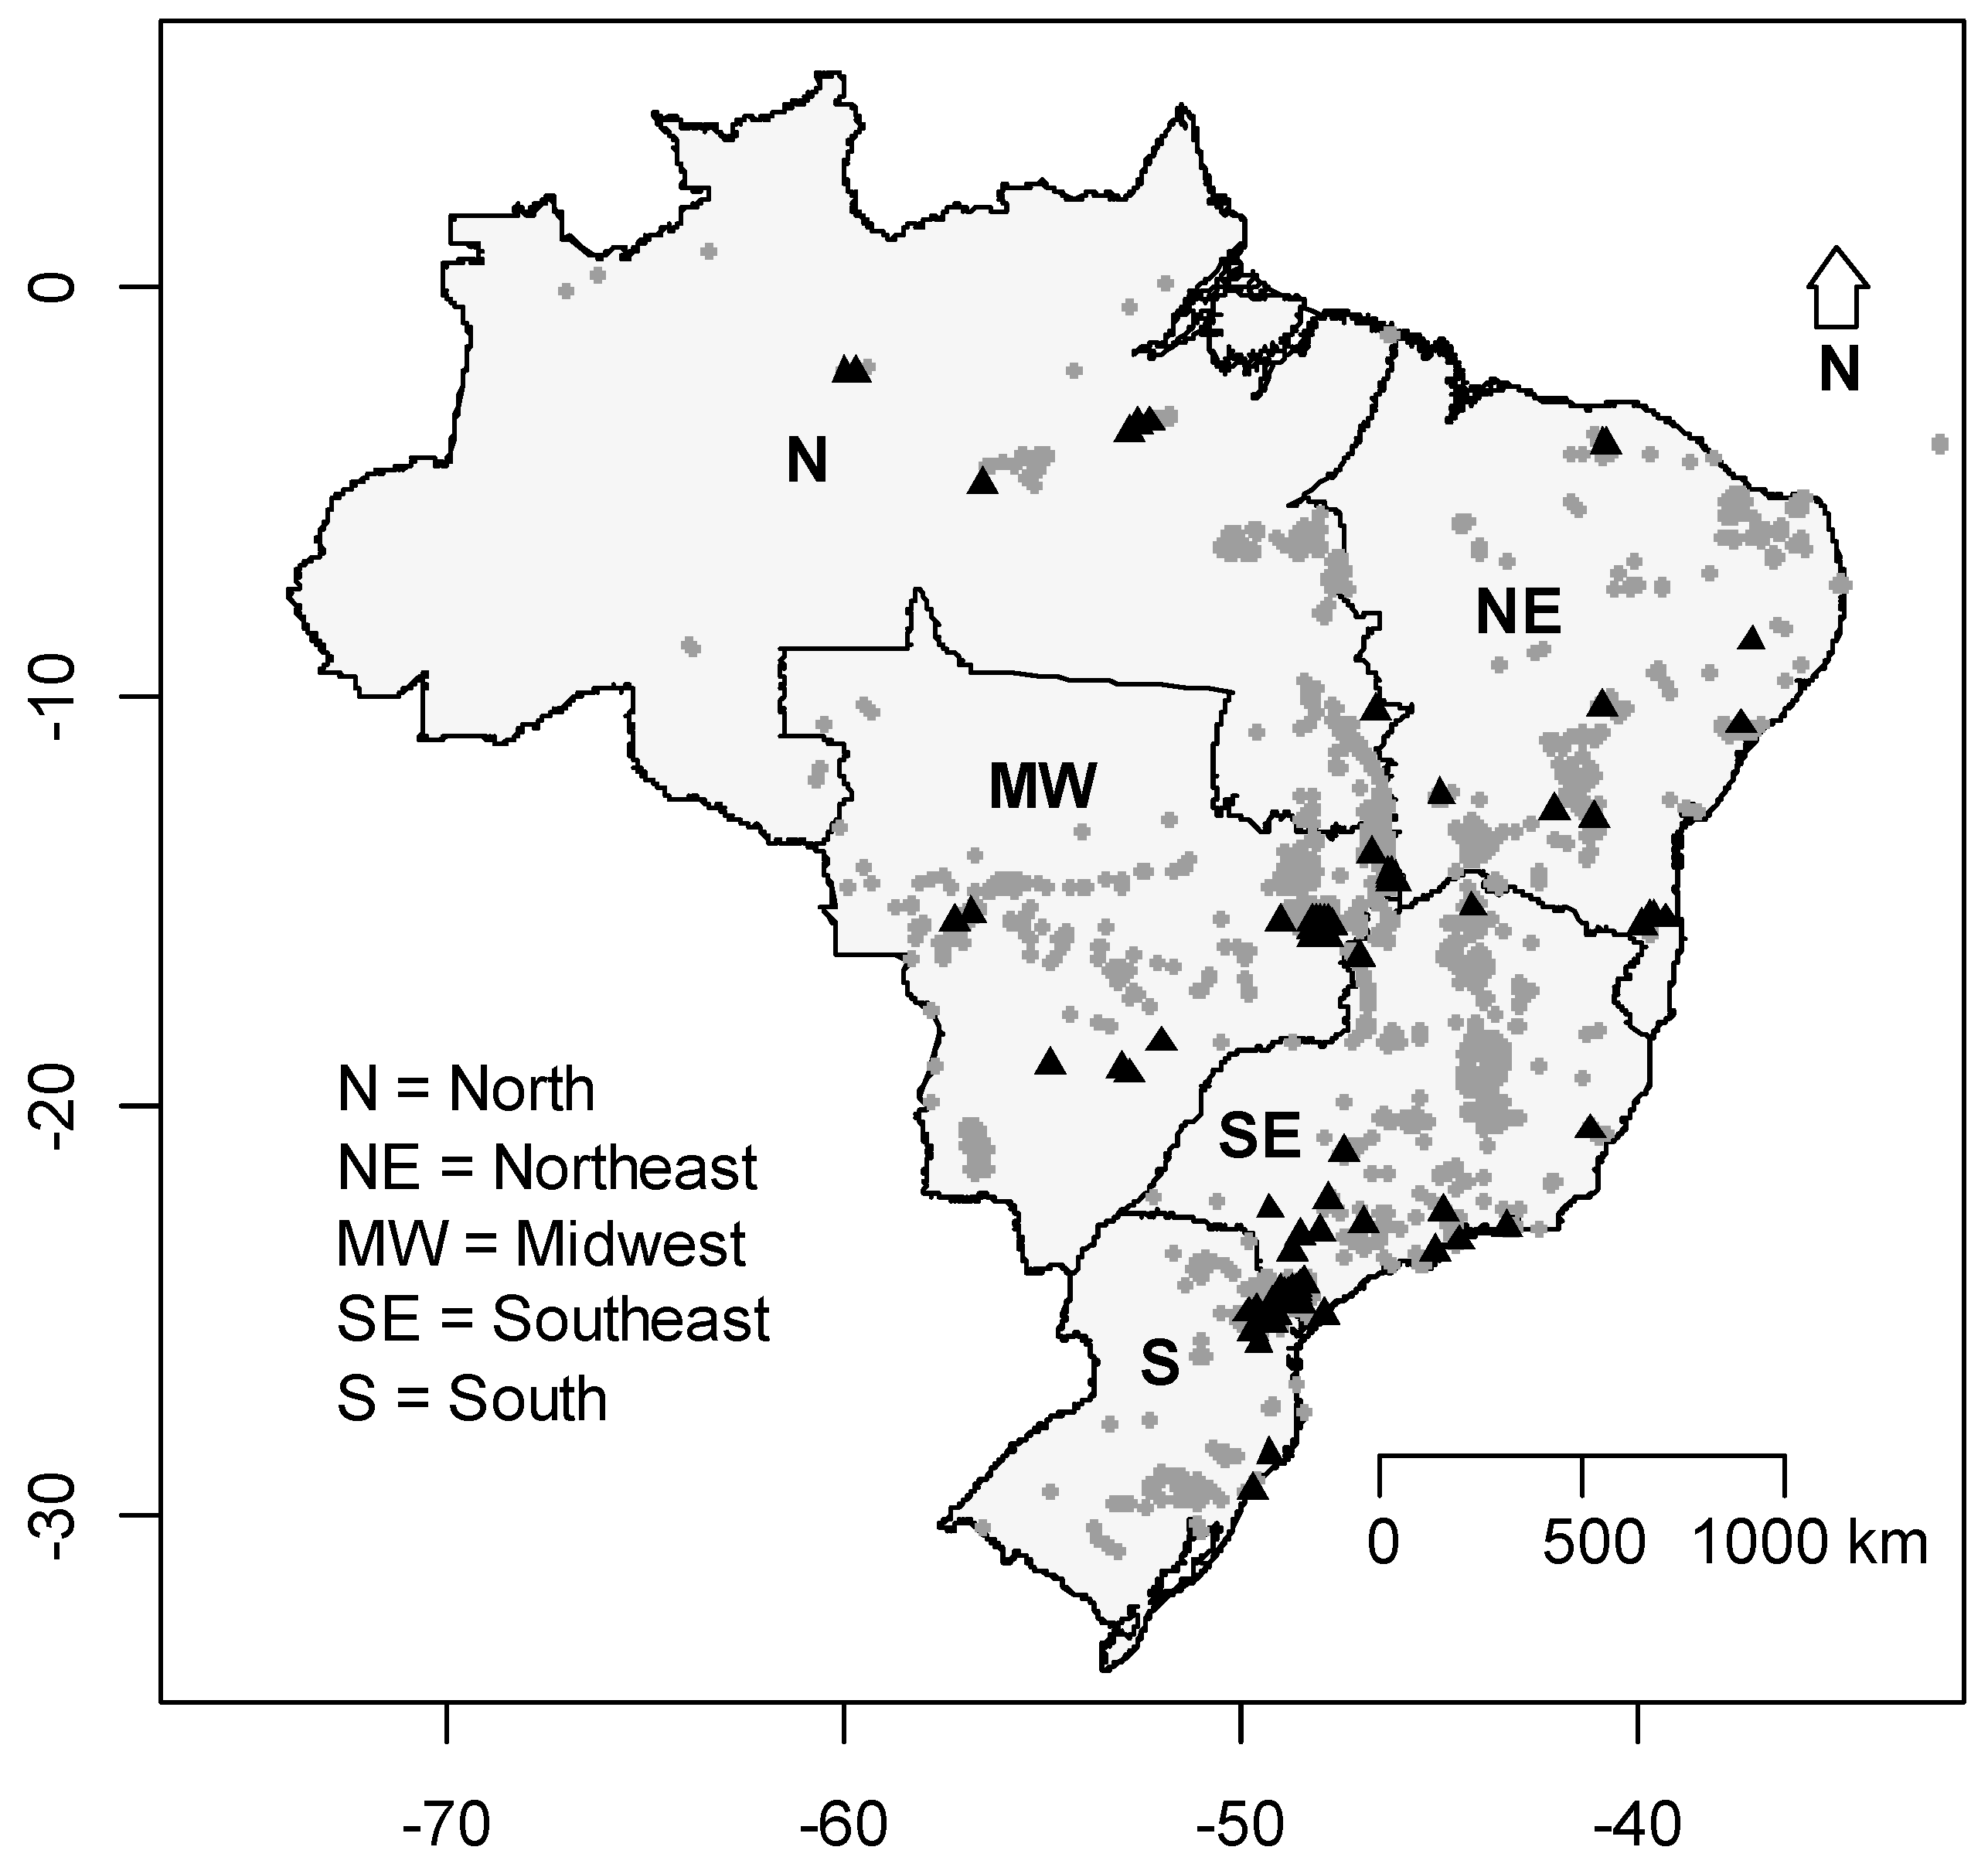
A total of 72 species from nine families were registered in 247 caves from the 72 evaluated studies evaluated. Phyllostomidae was the most speciose and abundant family, with 39 species and almost 89.93% of the abundance. The least represented families were Furipteridae, Natalidae, Noctilionidae, and Thyropteridae, with only one species each and a variable abundance (Table 1). The central part of Brazil was characterized by an elevated richness of cave-dwelling bats, especially in the Brazilian savanna (Figure 1). The species most often found in caves was Desmodus rotundus, being found in 133 caves (53.8% of the total), followed by Carollia perspicillata in 92 caves (37.2%). When evaluating the abundance of the species, D. rotundus was again the most common species registered, with 3671 individuals (37.9%), followed by Carollia perspicillata with 878 individuals (9.1%). The cluster analysis revealed that assemblage composition was more similar in the middle-western part of Brazil and that the Brazilian savanna presented a mix of species present in all other Brazilian biomes. The most variable assemblage composition was found for the Amazon caves (Figure 2). Notwithstanding the biome, the dominance of D. rotundus has a strong influence on assemblage composition.
3.2. Latitudinal and Elevational Trends and Biome Effects on Assemblage Parameters
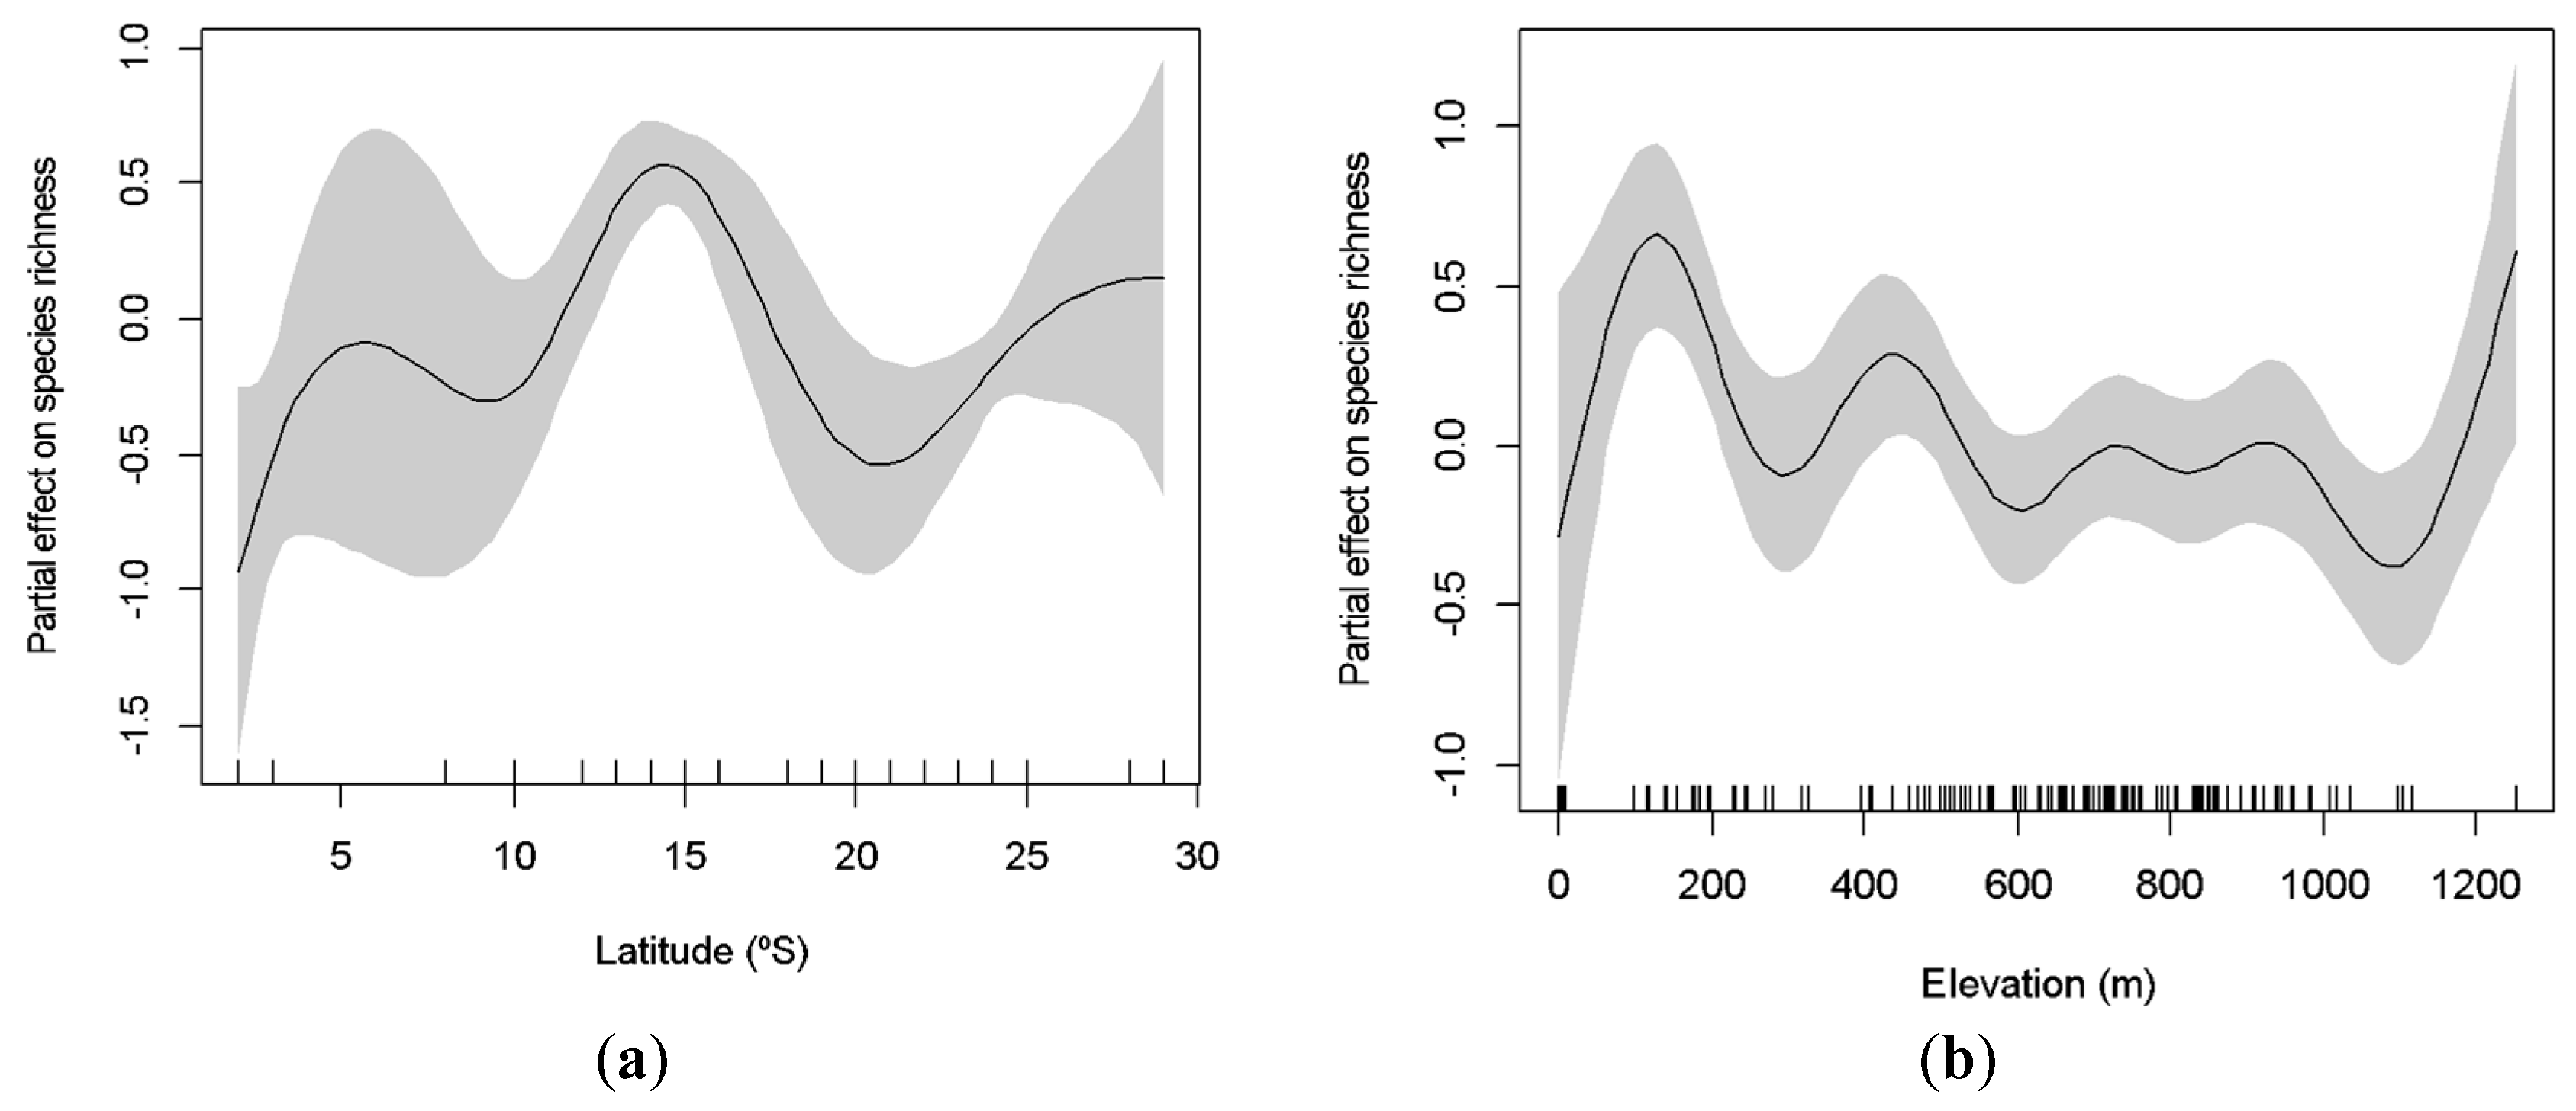
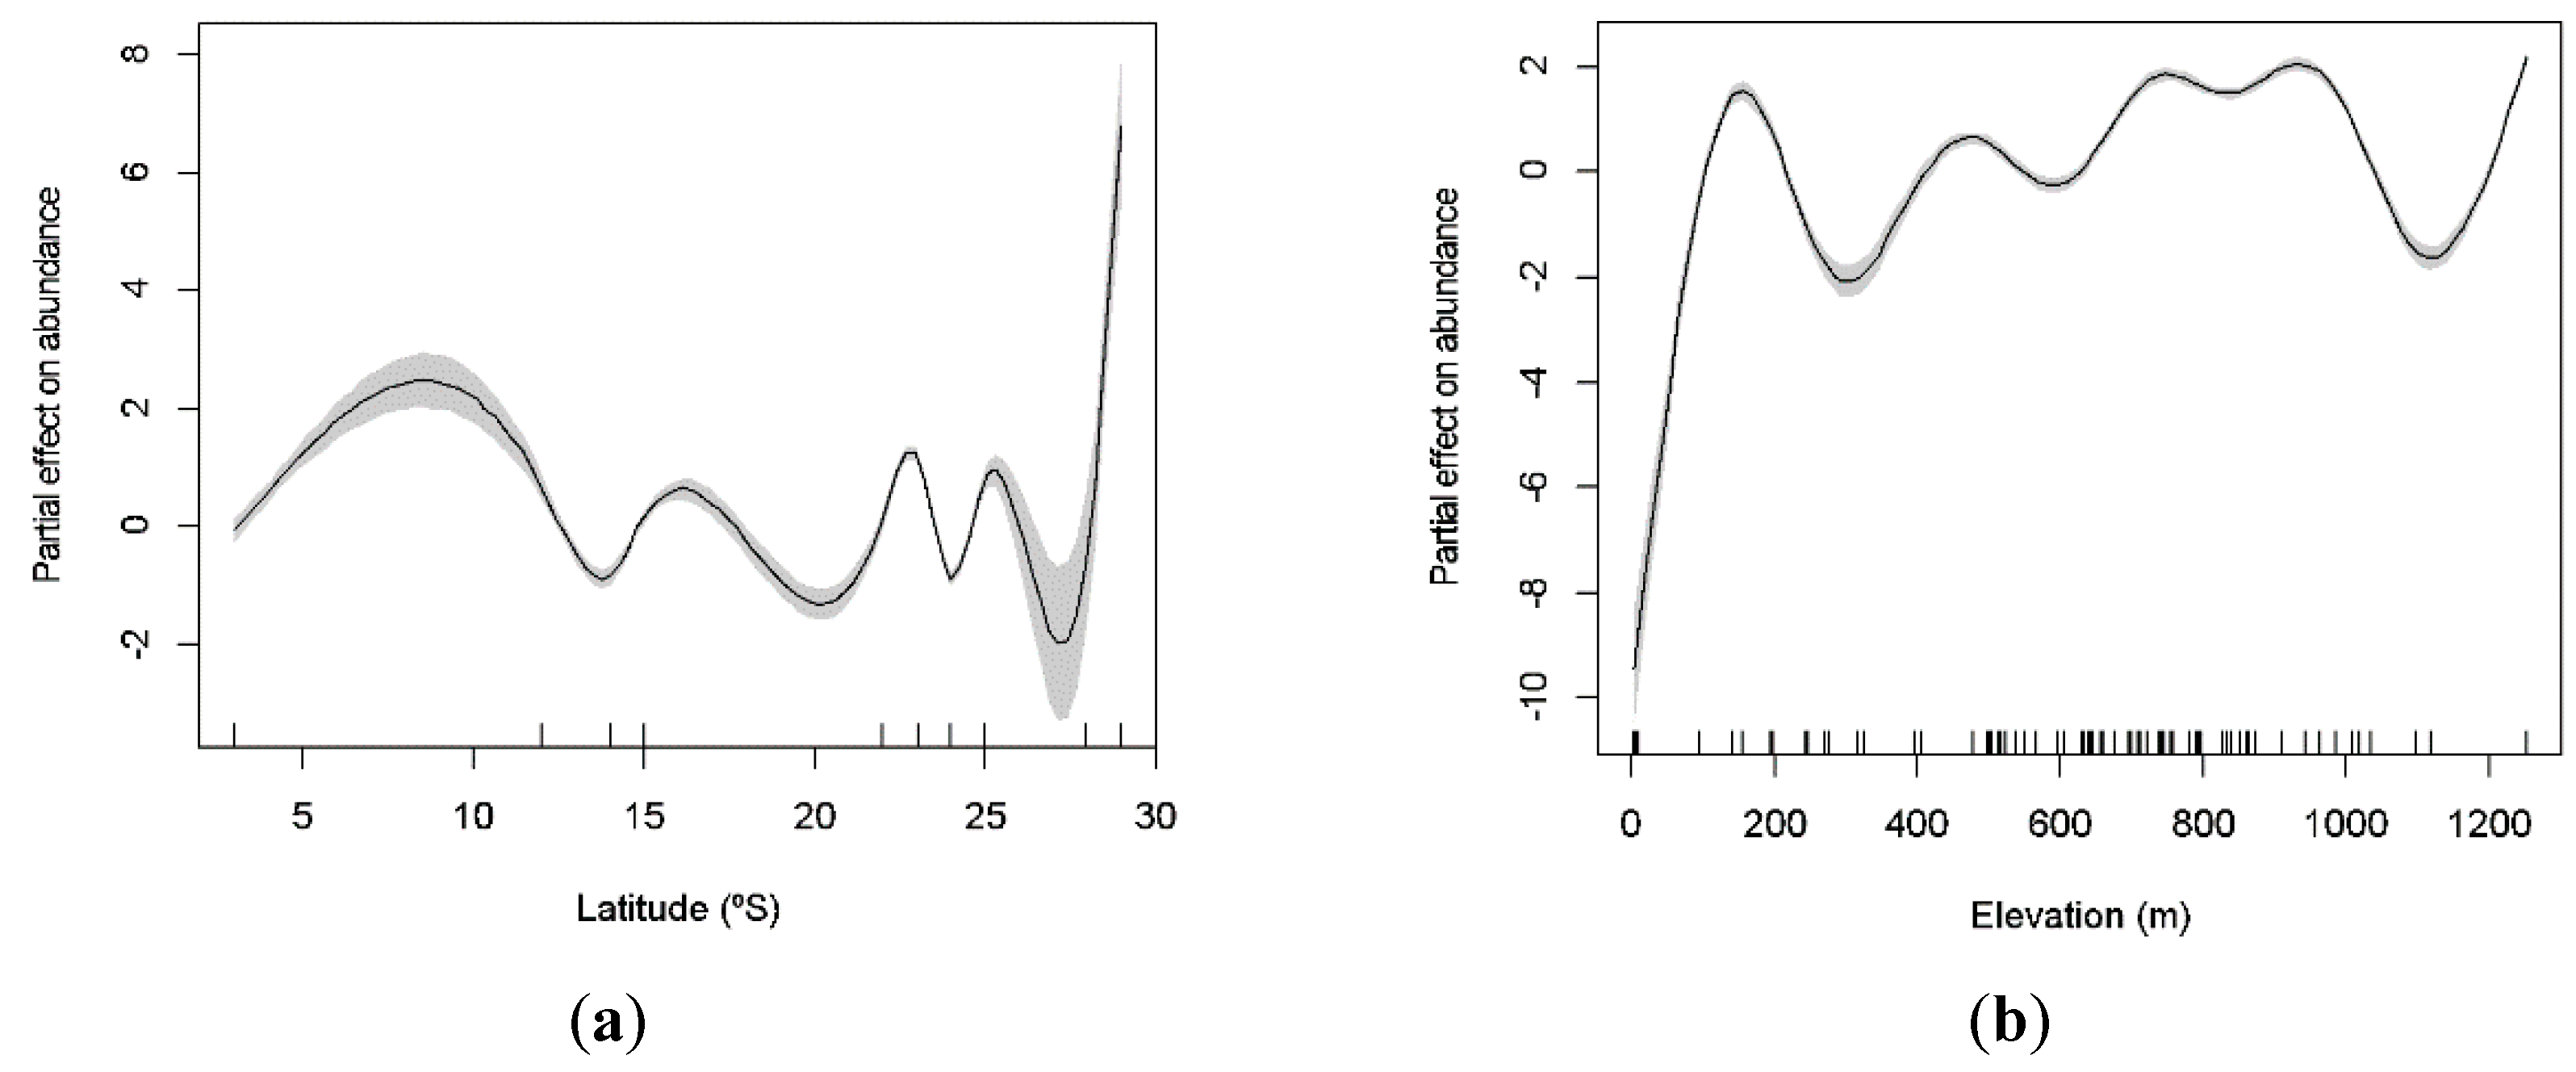
Data were collected across a wide range of latitude and elevation parameters, from very low (03°) to high latitudes (29°), and with caves as low as 62 m to as high as 1253 m. The richness of species significantly increases at intermediate latitudes (GAM: χ2 = 77.25; p < 0.001; Figure 3a), being lower toward the equator and at higher latitudes. We also observed two peaks of richness in relation to elevation, at low and high altitudes (100 m and 1200 m, respectively; Figure 3b). Elevation significantly explained variation in species richness (GAM: χ2 = 33.48; p < 0.001). Similarly, both latitude and elevation explained the variation of the abundance of cave-dwelling bats. We observed a higher abundance at lower and higher latitudes (around 10° and 29°; GAM: χ2 = 1523.00; p < 0.001; Figure 4a) and at low elevations (less than 100 m; GAM: χ2 = 1181.00; p < 0.001; Figure 4b).
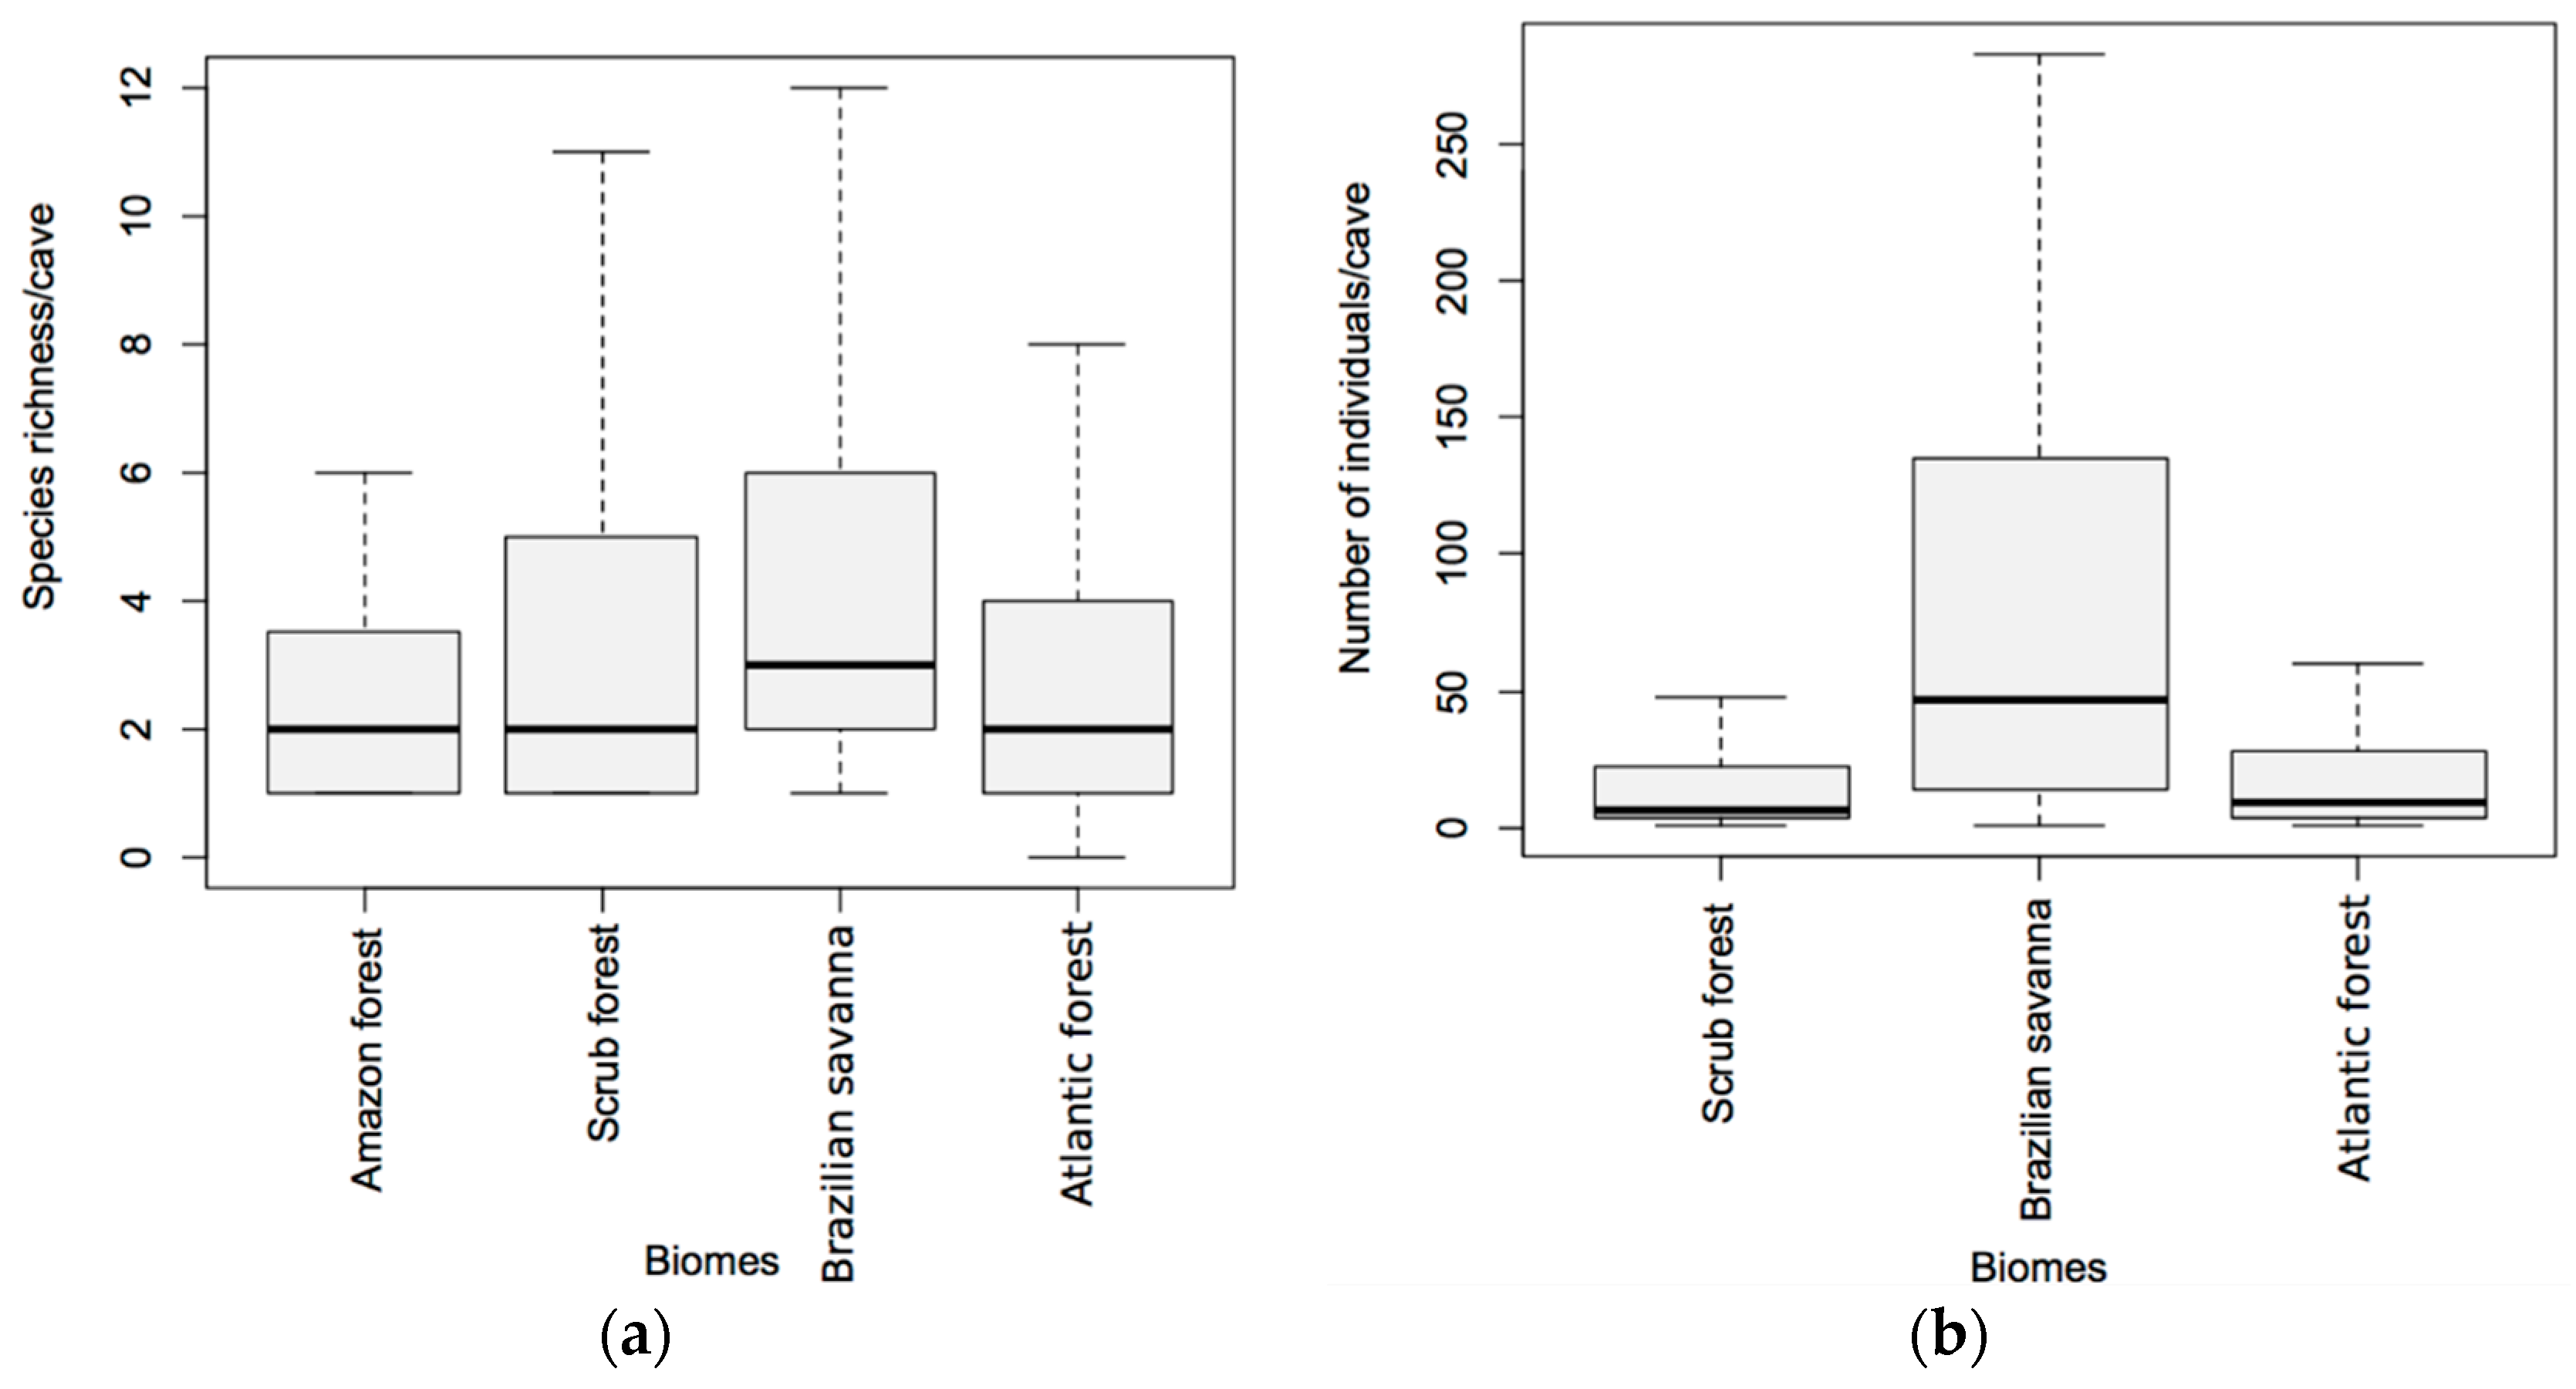
Both richness (GLM; χ2 = 15.18; p = 0.001; Figure 5a) and abundance (GLM; χ2 = 2359.40; p < 0.001; Figure 5b) were significantly affected by biome type. The Brazilian savanna presented higher richness when compared to the Amazon (Tukey post hoc test; Z = 2.89; p = 0.017) and Atlantic forests (Tukey post hoc test; Z = 3.09; p = 0.009) (Figure 5a). The average species richness of bats per cave in the Brazilian savanna was (4.56 ± 3.68; mean ± SD), followed by the scrub forest (3.90 ± 4.08), Atlantic forest (3.58 ± 4.93), and the Amazon forest (2.66 ± 1.82). Similarly, we observed that the Brazilian savanna presented a higher number of individuals per cave in comparison to Atlantic forest (Tukey post hoc test; Z = 42.67; p < 0.001) and scrub forest, (Tukey post hoc test; Z = 30.58; p < 0.001; Figure 5b).
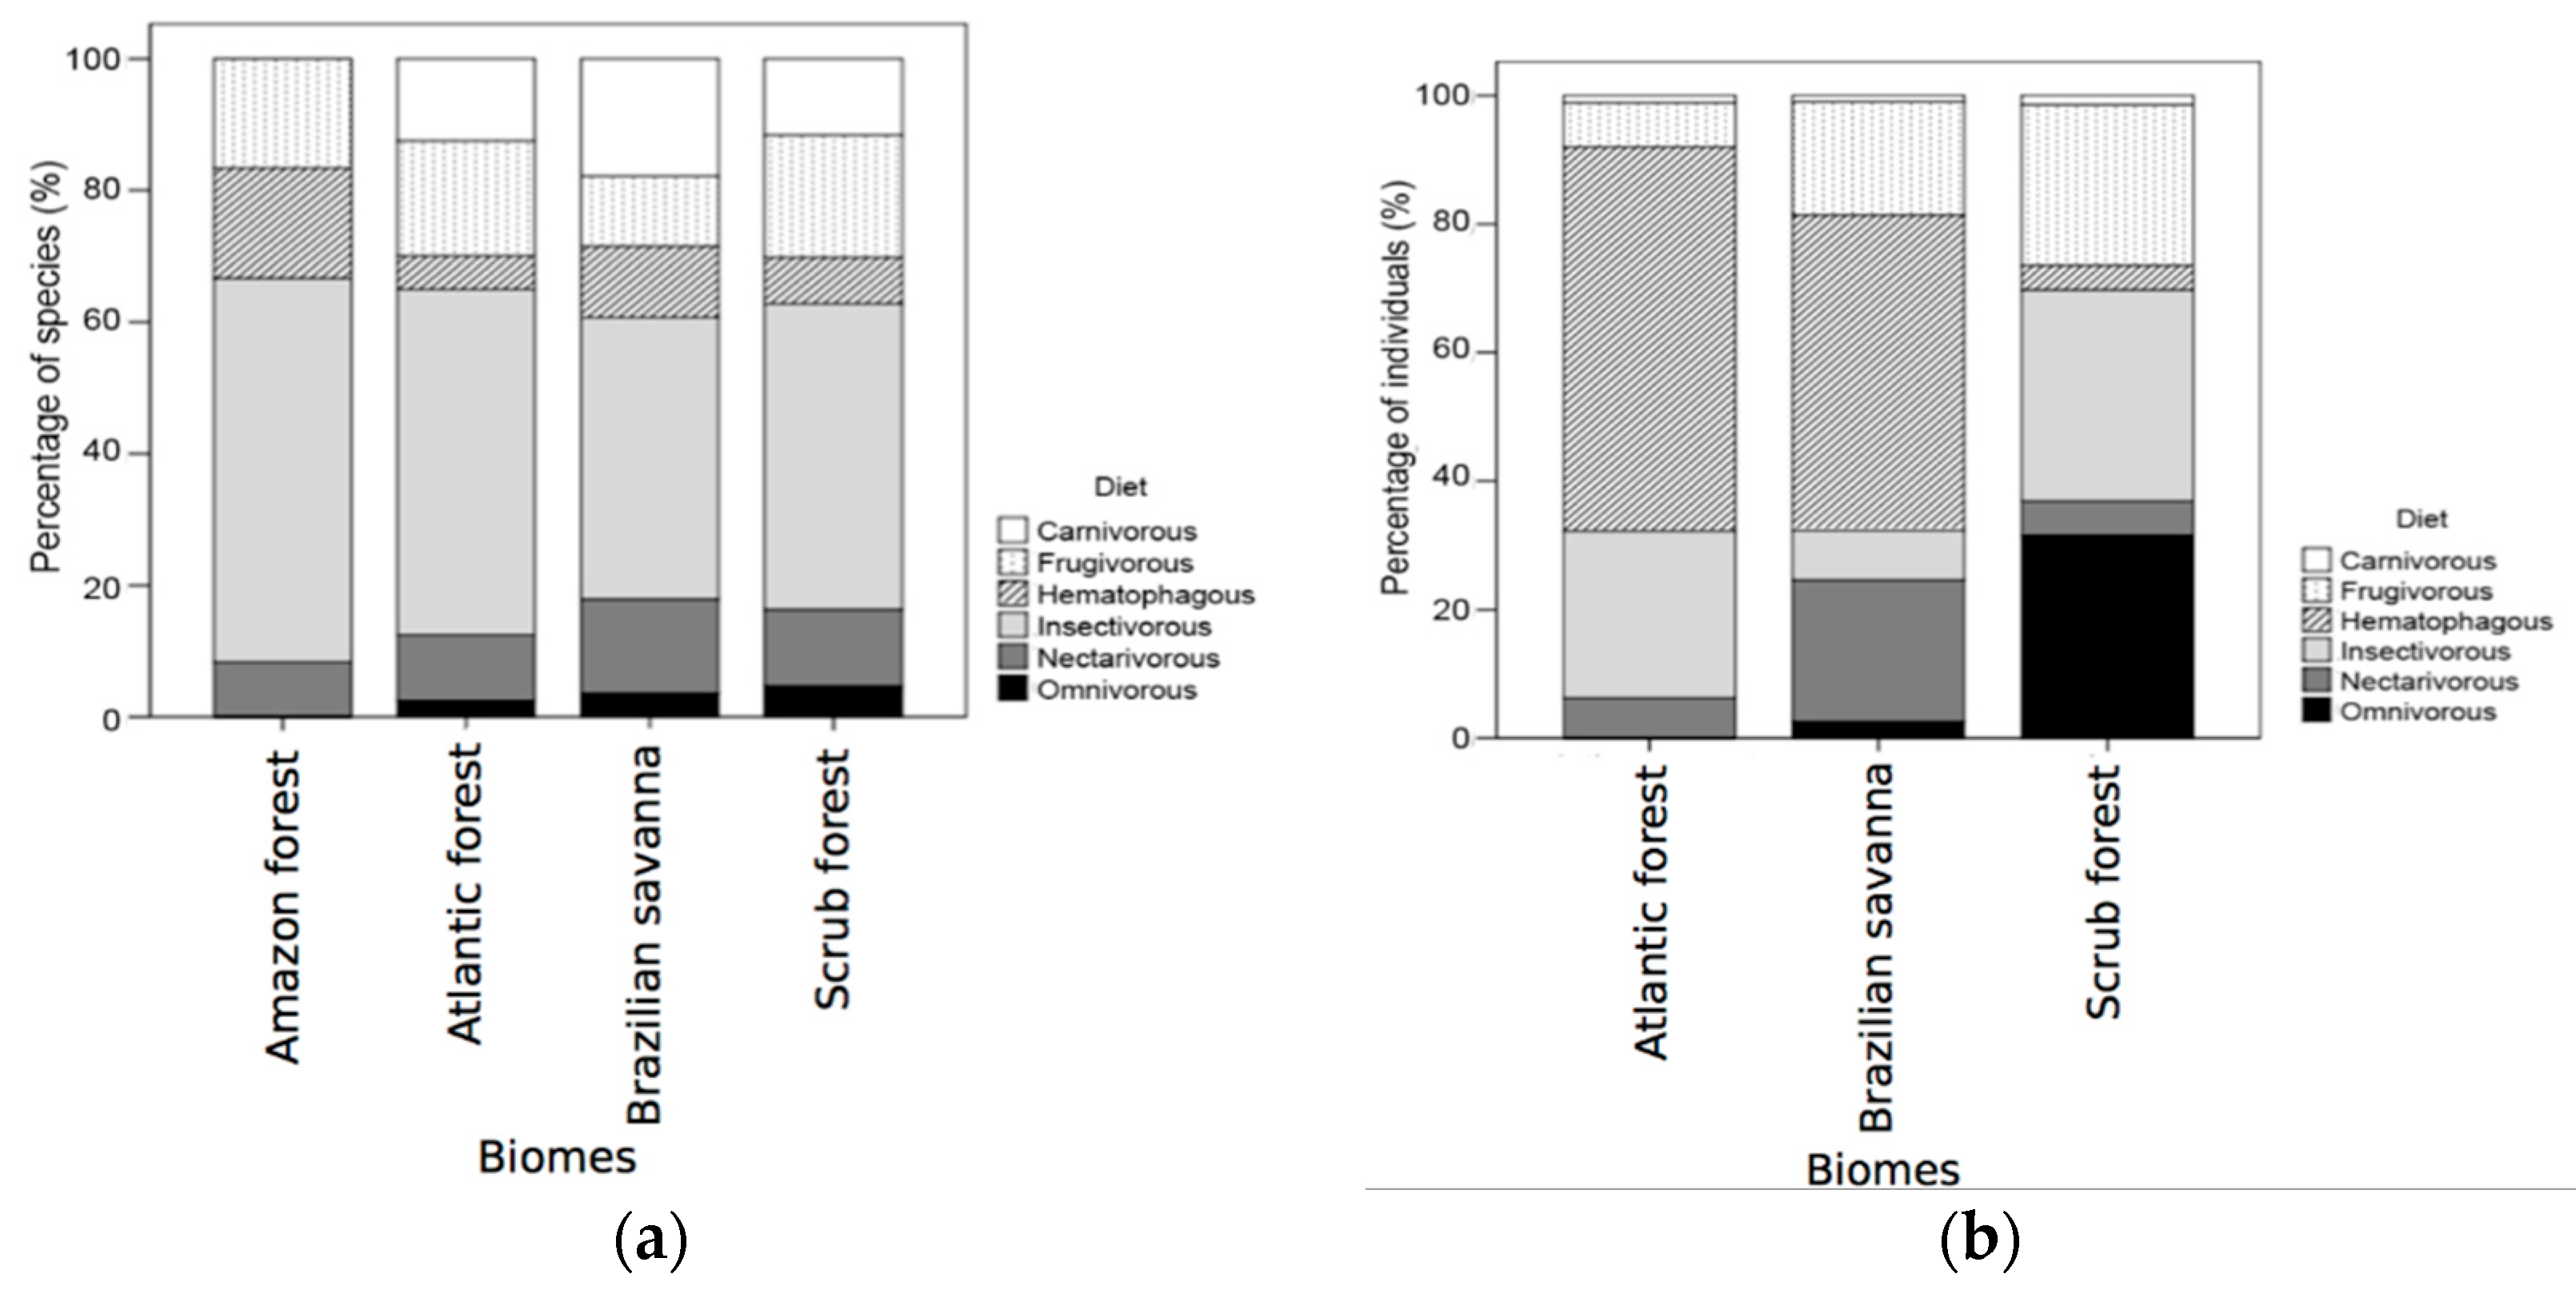
The most abundant class of the feeding guilds was the hematophagous bats, due to the high prevalence of D. rotundus, followed by nectarivorous and insectivorous bats (Table 2). We had also observed that insectivorous bats presented a much higher richness (41) in comparison to the other foraging classes. These patterns change when we look only at the total biomass of each feeding guild, with the omnivorous guild being the second most representative one. The log-linear model used to investigate the dependence between biome and diet guild revealed no interaction between them (χ2 = 8.07; p = 0.920), despite the insectivorous guild apparently presenting higher values of richness (Table 2), especially for the scrub and Atlantic forests (Figure 6a,b).
3.3. The Deficit of Knowledge and Sampling Bias
The list provided by the CECAV presents around 10,124 caves in Brazil. Most of the caves are located in the central part of the country, especially between latitudes 14° to 20°. The number of studies on cave-dwelling bats in Brazil was very low in comparison to the number of caves registered. All the studies evaluated were conducted in 247 caves, less than 3% of the registered caves. The least studied region in terms of proportion of investigated caves was the Southeast, since only 0.6% of the cavities were studied in terms of bat presence and assemblage composition (Figure 7). We also found that species richness in Brazilian states was positively associated with the number of studies conducted in each state (GLM: χ2 = 58.30; p < 0.001) but not the number of cavities present in each state (χ2 = 1.36; p = 0.243).
4. Discussion
Ecological gradients of species richness and abundance are well documented for many taxa [2], but little is known about how much cave-dwelling bats follow these patterns. Caves usually present stable climatic conditions and are safe places for bats to roost and thermoregulate during harsh weather conditions, gestation, or to avoid higher predation risk [40,41]. These aspects may strengthen the expectations that cave-roosting bats may be less affected by ecological gradients than other species. However, as demonstrated here, cave-dwelling bats seem to be influenced by both latitudinal and elevational gradients in a similar manner to other groups.
We observed that both richness and abundance of cave-dwelling bats increased towards the equator. Several hypotheses have been proposed to explain the increase in species richness in lower latitudes, including the high productivity of tropical ecosystems and evolutionary metrics, such as the raised speciation time and diversification rate of the region [66,67]. The weak but significant association between richness and abundance of cave-dwelling bat species with latitude may be a consequence of long-term historical and evolutionary processes that similarly affected different taxa. However, the association between bats and caves may also have been shaped by more recent events of adaptation caused by variations in the physical environment, predation, and other intra- and interspecific interactions.
Species that use caves as shelters are less influenced by external environmental conditions than other species, since constant microhabitat parameters may differently affect bats’ metabolism [49,68]. Bats are expected to use caves more regularly in higher elevations as a mechanism to avoid losing heat, due to colder temperatures found in these areas. Different studies have suggested that species richness may decrease with elevation [69,70], others demonstrated a peak of diversity in intermediate altitudes, the so called mid-elevation diversity peak [50]. Our results reinforce the evidence in favor of the mid-elevation diversity peak for cave-dwelling bats. We observed two peaks for both richness and abundance around 200 m and 800 m of elevation. Caves seem to be very important in higher elevations, as they provide internal microhabitats and micro-climates that are generally stable, especially in regions where temperature and humidity vary dramatically throughout the day.
Variation in habitat structure, floristic composition, and food availability are other factors affecting the maintenance of species at a given site [35,71,72], which may also influence the use of caves as roosts [44,73]. We observed that the biome with the highest number of species and individuals registered inside c-aves was the Brazilian savanna, which is surprising, as the Amazon forest is the biome with the highest richness of bats [74]. Previous studies in Neotropical savannas have indicated that roost site availability is a limiting factor shaping bat communities [73]. Brazilian savanna is a biome with a high richness of bat species (101) [74] and is formed by patches of generally open vegetation with a less complex structure. For this reason, the availability of roosts for bats may be lower [73], driving them to select caves as roosts. This may explain why we can find some bat species using caves in some biomes, but not in others. Assemblage composition was more similar in the middle-western side of Brazil. The explanation for this pattern may be that the biomes in this region (especially the scrub forest and Brazilian savanna) are structurally more similar among them in comparison to Amazon and grasslands. The fact that the Brazilian savanna shares many species with other biomes may be related to its location in the middle of the country and its connection with all the other biomes. On the other side, the lower richness and higher species turnover of cave-dwelling bats in the Amazon is probably because of vegetation structural complexity and greater availability of roosts (e.g., inside holes of trees or under their leaves).
Thermoregulatory abilities rely on aspects such as body size, metabolic rate, and food habits [75,76,77,78]. Notwithstanding the higher prevalence of some specific feeding guilds, such as the hematophagous and insectivorous bats, we did not observe any dependence between feeding guild of cave-dwelling bats and biome. However, we found that caves represent a very important roost for bats, chiefly for the Phyllostomidae family. They seem to prevail in more cluttered, lowered latitude and altitude habitats. The higher richness of insectivorous species in caves is probably related to their highest diversity in general. Of the 178 species that occur in Brazil, at least 85 species are exclusively insectivorous [55,74].
While there was no consistent variation in the number of species of each feeding guild in relation to the biomes, there was a significant variation in terms of bat abundance. Caves in the scrub forest seem to be very important for omnivorous species, while caves located in the Brazilian savanna seem to be relevant for nectarivorous species. The difference could be associated with the fact that nectarivorous species can roost in very cold caves [44] and Brazilian savanna occupies higher latitudes with colder average temperatures than the scrub forests, making caves more suitable for nectar feeding bats than for other feeding guilds.
Hematophagous bats are found in great numbers in both Atlantic forest and Brazilian savanna caves. For example, D. rotundus was extremely abundant, being the most common species found in caves. Different hypotheses may explain the dominance of hematophagous species in several caves. Firstly, the number of cattle-raising farms in these biomes creates suitable areas for vampire bats. Secondly, the interest in the study and monitoring of rabies cases may bias the sampling of hematophagous bats in many studies.
Although we have found a considerable amount of data regarding cave-dwelling bats in Brazil, the number of caves that have been investigated (less than 3%) is still very low in comparison to the number of registered caves. Another limitation of our study was that we included in our analysis all the studies that we found in the literature regardless of differences in sampling effort realized between caves, which might have led to biases in our results. Studies with a higher sampling effort are likely to be more accurate and generate higher estimates of bat abundance and species richness inside the caves. Thus, it is unclear whether the altitudinal and latitudinal patterns would remain the same if all caves had been sampled with more similar and larger sampling efforts. Despite these limitations, caves seem to represent a very important roost for Brazilian bats, as 72 species of the total 178 registered for the Brazilian territory have already been found in caves (40.4%). This amount represents a percentage close to that found in Mexico (60 species and 44.8%; [35]). This number is probably even higher, since regions such as the Amazon that hold 146 species of bats [74] and 2457 registered caves [51] had only very few caves sampled for bats (14). Another aspect that deserves attention was the positive association between species richness and the number of studies conducted. It suggests that the number of species using caves is likely to be even higher. The Brazilian act 6.640 (2008), which changed the conservation status of most Brazilian caves from totally protected to allowing exploitation, together with the lack of knowledge of bat distribution and occurrence inside Brazilian caves, poses a big threat to bat conservation. Thus, more surveilling studies describing bat fauna inside caves in different biomes of Brazil are still urgently needed in order to improve the understanding of Brazilian biodiversity.
Cave-dwelling bats appears to follow the same latitudinal and elevational gradients observed for other taxonomic groups. However, much more information is needed to explain how local-based parameters such as cave characteristics (e.g., entrance size, internal dimensions, microclimate), species interactions, and resource availability may be shaping the association between bats and caves. Cave-dwelling species are particularly vulnerable to human disturbance [79,80], but visitation impact has been neglected in Brazil, since there is an information gap regarding its influences on the use, behavior, and reproduction of bat species. Moreover, environmental policies should amplify the importance of caves for the creation of new protected areas in Brazil, allowing the conservation of bat species through the maintenance and protection of ecological processes such as migration, dispersion dynamics, and gene flow between roosts and helping to maintain the valuable environmental services that they provide as pollinators, seed dispersers, and pest controllers.
Supplementary Materials
The following are available online at https://www.mdpi.com/1424-2818/10/3/49/s1, Table S1: Distribution and abundance of cave-dwelling bat species in Brazilian biomes.
Author Contributions
H.F.M.O., M.O., and R.I.D. conceived and designed the study. H.F.M.O. and R.I.D. analyzed the data and wrote the manuscript with inputs from M.O.
Funding
This research received no external funding.
Acknowledgments
We would like to thank the University of Brasília and Coordenação de Aperfeiçoamento de Pessoal de Nível Superior (CAPES) for providing the access to the bibliographic information used in this study.
Conflicts of Interest
The authors declare no conflicts of interest.
References
- Darwin, C. On the Origin of Species by Means of Natural Selection, or the Preservation of Favoured Races in the Struggle for Life, 1st ed.; John Murray: London, UK, 1859; p. 559. [Google Scholar]
- Gaston, K.J. Global patterns in biodiversity. Nature 2000, 405, 220–227. [Google Scholar] [CrossRef] [PubMed]
- Ricklefs, R.E. A comprehensive framework for global patterns in biodiversity. Ecol. Lett. 2004, 7, 1–15. [Google Scholar] [CrossRef]
- Shurin, J.B.; Allen, E.G. Effects of Competition, Predation, and Dispersal on Species Richness at Local and Regional Scales. Am. Nat. 2001, 158, 625–637. [Google Scholar] [CrossRef] [PubMed]
- Whittaker, R.J.; Willis, K.J.; Field, R. Scale and species richness: Towards a general, hierarchical theory of species diversity. J. Biogeogr. 2001, 28, 453–470. [Google Scholar] [CrossRef]
- Pianka, E.R. Latitudinal gradients in species diversity: A review of concepts. Am. Nat. 1966, 100, 33–46. [Google Scholar] [CrossRef]
- Stevens, G.C. The latitudinal gradient in geographical range: How so many species co-exist in the tropics. Am. Nat. 1989, 133, 240–256. [Google Scholar] [CrossRef]
- Willig, M.R.; Kaufman, D.M.; Stevens, R.D. Latitudinal gradients of biodiversity: pattern, process, scale, and synthesis. Ann. Rev. Ecol. Syst. 2003, 34, 273–309. [Google Scholar] [CrossRef]
- Santelices, B. Phytogeographic characterization of the temperate coast of Pacific South America. Phycologia 1980, 19, 1–12. [Google Scholar] [CrossRef]
- Kouki, J.; Niemelä, P.; Viitasaari, M. Reversed latitudinal gradient in species richness of sawflies (Hymenoptera, Symphyta). Ann. Zool. Fenn. 1994, 31, 83–88. [Google Scholar] [CrossRef]
- Buckley, H.L.; Miller, T.E.; Ellison, A.M.; Gotelli, N.J. Reverse latitudinal trends in species richness of pitcher-plant food webs. Ecol. Lett. 2003, 6, 825–829. [Google Scholar] [CrossRef]
- Rosenzweig, M.L. Species diversity gradients: We know more and less than we thought. J. Mammal. 1992, 73, 715–730. [Google Scholar] [CrossRef]
- Qian, H. Large-scale biogeographic patterns of vascular plant richness in North America: An analysis at the generic level. J. Biogeogr. 1998, 25, 829–836. [Google Scholar] [CrossRef]
- Hillebrand, H. On the generality of the latitudinal diversity gradient. Am. Nat. 2004, 163, 192–211. [Google Scholar] [CrossRef] [PubMed] [Green Version]
- Ceballos, G.; Ehrlich, P.R. Global mammal distributions, biodiversity hotspots, and conservation. Proc. Natl. Acad. Sci. USA 2006, 103, 19374–19379. [Google Scholar] [CrossRef] [PubMed] [Green Version]
- Myers, N.; Mittermeier, R.A.; Mittermeier, C.G.; da Fonseca, G.A.B.; Kent, J. Biodiversity hotspots for conservation priorities. Nature 2000, 403, 853–858. [Google Scholar] [CrossRef] [PubMed]
- Orme, C.D.L.; Davies, R.G.; Burgess, M.; Eigenbrod, F.; Pickup, N.; Olson, V.A.; Webster, A.J.; Ding, T.; Rasmussen, P.C.; Ridgely, R.S.; et al. Global hotspots of species richness are not congruent with endemism or threat. Nature 2005, 436, 1016–1019. [Google Scholar] [CrossRef] [PubMed]
- Guo, Q.; Kelt, D.A.; Sun, Z.; Liu, H.; Hu, L.; Ren, H.; Wen, J. Global variation in elevational diversity. Nature 2013, 3, 3007. [Google Scholar] [CrossRef]
- McCain, C.M. Elevational gradients in diversity of small mammals. Ecology 2005, 86, 366–372. [Google Scholar] [CrossRef]
- McCain, C.M. Could temperature and water availability drive elevational species richness patterns? A global case study for bats. Glob. Ecol. Biogeogr. 2007, 16, 1–13. [Google Scholar] [CrossRef]
- Soares, C.; Brito, J.C. Environmental correlates for species richness among amphibians and reptiles in a climate transition area. Biodivers. Conserv. 2007, 16, 1087–1102. [Google Scholar] [CrossRef]
- Price, B.; Kutt, A.S.; McAlpine, C.A. The importance of fine-scale savanna heterogeneity for reptiles and small mammals. Biol. Conserv. 2010, 143, 2504–2513. [Google Scholar] [CrossRef]
- Al-Shami, S.A.; Rawi, C.S.M.; Ahmad, A.; Madrus, M.R.; Mutairi, K.A. Importance of regional diversity and environmental conditions on local species richness of aquatic macro-invertebrates in tropical forested streams. J. Trop. Ecol. 2014, 30, 335–346. [Google Scholar] [CrossRef]
- Ferger, S.W.; Schleuning, M.; Hemp, A.; Howell, K.M.; Bohning-Gaese, K. Food resources and vegetation structure mediate climatic effects on species richness of birds. Glob. Ecol. Biogeogr. 2014, 23, 541–549. [Google Scholar] [CrossRef]
- Kent, R.; Bar-Massada, A.; Carmel, Y. Bird and mammal species composition in distinct geographic regions and their relationships with environmental factors across multiple spatial scales. Ecol. Evol. 2014, 4, 1963–1971. [Google Scholar] [CrossRef] [PubMed] [Green Version]
- Xu, C.; Huang, Z.Y.X.; Chen, B.J.W.; Zhang, M.; Liu, M. Can local landscape attributes explain species richness patterns at macroecological scales? Glob. Ecol. Biogeogr. 2014, 23, 436–445. [Google Scholar] [CrossRef]
- Fenton, M.B.; Simmons, N.B. Bats: A world of science and mystery. University of Chicago PressMuscarella, R.; Fleming, T.H. The role of frugivorous bats in tropical forest succession. Biol. Rev. 2007, 82, 573–590. [Google Scholar] [CrossRef]
- Kalka, M.B.; Smith, A.R.; Kalko, E.K.V. Bats limit arthropods and herbivory in a tropical forest. Science 2008, 320, 71. [Google Scholar] [CrossRef] [PubMed]
- Fleming, T.H.; Geiselman, C.; Kress, W.J. The evolution of bat pollination: A phylogenetic perspective. Ann. Bot. 2009, 104, 1017–1043. [Google Scholar] [CrossRef] [PubMed]
- Kaufman, D.M. Diversity of New World mammals: universality of the latitudinal gradients of species and bauplans. J. Mammal. 1995, 76, 322–334. [Google Scholar] [CrossRef]
- Stevens, R.D.; Willig, M.R.; Strauss, R.E. Latitudinal gradients in the phenetic diversity of New World bat communities. Oikos 2006, 112, 41–50. [Google Scholar] [CrossRef] [Green Version]
- Curran, M.; Kopp, M.; Beck, J.; Fahr, J. Species diversity of bats along an altitudinal gradient on Mount Mulanje, southern Malawi. J. Trop. Ecol. 2012, 28, 243–253. [Google Scholar] [CrossRef] [Green Version]
- Sánchez, M.S.; Giannini, N.P. Altitudinal patterns in two syntopic species of Sturnira (Mammalia: Chiroptera: Phyllostomidae) in the montane rain forests of Argentina. Biotropica 2014, 46, 1–5. [Google Scholar] [CrossRef]
- Avila-Cabadilla, L.D.; Stoner, K.E.; Nassar, J.M.; Espírito-Santo, M.M.; Alvarez-Añorve, M.Y.; Aranguren, C.I.; Henry, M.; González-Carcacía, J.A.; Falcão, L.A.D.; Sanchez-Azofeifa, G.A. Phyllostomid bat occurrence in successional stages of Neotropical dry forests. PLoS ONE 2014, 9, e84572. [Google Scholar] [CrossRef] [PubMed]
- Arita, H.T. Conservation biology of the cave bats of Mexico. J. Mammal. 1993, 74, 693–702. [Google Scholar] [CrossRef]
- Furman, A.; Özgül, A. Distribution of cave-dwelling bats and conservation status of underground habitats in the Istanbul area. Ecol. Res. 2002, 17, 69–77. [Google Scholar] [CrossRef]
- Niu, H.; Wang, N.; Liu, J. Distribution and underground habitats of cave-dwelling bats in China. Anim. Conservat. 2007, 10, 470–477. [Google Scholar] [CrossRef]
- Glover, A.M.; Altringham, J.D. Cave selection and use by swarming bat species. Biol. Conservat. 2008, 141, 1493–1504. [Google Scholar] [CrossRef]
- Rydell, J.; Entwistle, A.; Racey, R. Timing of foraging flights of three species of bats in relation to insect activity and predation risk. Oikos 1996, 76, 243–252. [Google Scholar] [CrossRef]
- Sedgeley, J.A.; O’Donnell, C.F.J. Factors influencing the selection of roost cavities by a temperate rainforest bat (Vespertilionidae: Chalinobolus tuberculatus) in New Zealand. J. Zool. 1999, 249, 437–446. [Google Scholar] [CrossRef]
- Soriano, P.J.; Ruiz, A.; Arends, A. Physiological responses to ambient temperature manipulation by three species of bats from Andean cloud forests. J. Mammal. 2002, 83, 445–457. [Google Scholar] [CrossRef]
- Vasseur, D.A.; DeLong, J.P.; Gilbert, B.; Greig, H.S.; Harley, C.D.; McCann, K.S.; Savage, V.; Tunney, T.D.; O’Connor, M.I. Increased temperature variation poses a greater risk to species than climate warming. Proc. R. Soc. Lond. B Biol. Sci. 2014, 281, 20132612. [Google Scholar] [CrossRef] [PubMed]
- Ohlemüller, R.; Wilson, J.B. Vascular plant species richness along latitudinal and altitudinal gradients: A contribution from New Zealand temperate rainforests. Ecol. Lett. 2000, 3, 262–266. [Google Scholar] [CrossRef]
- Hamilton, I.M.; Barclay, R.M. Patterns of daily torpor and day-roost selection by male and female big brown bats (Eptesicus fuscus). Can. J. Zool. 1994, 72, 744–749. [Google Scholar] [CrossRef]
- Vonhof, M.J.; Barclay, R.M. Roost-site selection and roosting ecology of forest-dwelling bats in southern British Columbia. Can. J. Zool. 1996, 74, 1797–1805. [Google Scholar] [CrossRef]
- Callahan, E.V.; Drobney, R.D.; Clawson, R.L. Selection of summer roosting sites by Indiana bats (Myotis sodalis) in Missouri. J. Mammal. 1997, 78, 818–825. [Google Scholar] [CrossRef]
- Arita, H.T.; Vargas, J.A. Natural history, interspecific association, and incidence of the cave bats of Yucatan, Mexico. Southwest. Nat. 1995, 40, 29–37. [Google Scholar]
- Grytnes, J.A.; McCain, C.M. Elevational trends in biodiversity. In Encyclopedia of Biodiversity, 1st ed.; Levin, S.A., Ed.; Elsevier: Amsterdam, The Netherlands, 2007; Volume 1, pp. 1–8. ISBN 9780122268656. [Google Scholar]
- MMA—Ministério do Meio Ambiente. Available online: http://mma.gov.br/ (accessed on 5 June 2016).
- Auler, A.; Farrant, A.R. A brief introduction to karst and caves in Brazil. Proc. Univ. Bristol Speleol. Soc. 1996, 20, 187–200. [Google Scholar]
- CECAV—Database of Caves of Brazil. Available online: http://www.icmbio.gov.br/cecav/downloads/mapas.html (accessed on 15 July 2014).
- Simmons, N.B. Chiroptera. In Mammal Species of the World–A Taxonomic and Geographic Reference, 3rd ed.; Wilson, D.E., Reeder, D.M., Eds.; Hopkins University Press: Baltimore, MD, USA, 2005; Volume 1, pp. 312–529. ISBN 978-0801882210. [Google Scholar]
- Nogueira, M.R.; de Lima, I.P.; Moratelli, R.; da Cunha Tavares, V.; Gregorin, R.; Peracchi, A.L. Checklist of Brazilian bats, with comments on original records. Check List 2014, 10, 808–821. [Google Scholar] [CrossRef] [Green Version]
- Simmons, N.B.; Voss, R.S. The mammals of Paracou, French Guiana, a Neotropical lowland rainforest fauna. Part 1, Bats. Bull. Am. Mus. Nat. Hist. 1998, 237, 1–218. [Google Scholar]
- Reis, N.R.; Peracchi, A.L.; Pedro, W.A.; Lima, I.P. Morcegos do Brasil, 1st ed.; Univesidade Estadual de Londrina: Londrina, Basil, 2007; ISBN 978-85-906395-1-0. [Google Scholar]
- Emmons, L.H.; Feer, F. Neotropical Rainforest Mammals: A Field Guide, 2nd ed.; The University of Chicago Press: Chicago, IL, USA, 1997; ISBN 978-0226207216. [Google Scholar]
- R Development Core Team. R: A Language and Environment for Statistical Computing; R Foundation for Statistical Computing: Vienna, Austria, 2016; Available online: www.R-project.org (accessed on 4 April 2018).
- Wood, S. Generalized Additive Models—An Introduction with R; Chapman & Hall: London, UK, 2006; ISBN 978-1584884743. [Google Scholar]
- Crawley, M.J. The R Book; John Wiley & Sons Ltd.: Hoboken, NJ, USA, 2007. [Google Scholar]
- O’Hara, R.B.; Kotze, D.J. Do not log-transform count data. Methods Ecol. Evol. 2010, 1, 118–122. [Google Scholar] [CrossRef] [Green Version]
- Quinn, G.P.; Keough, M.J. Experimental Design and Data Analysis for Biologists; Cambridge University Press: Cambridge, UK, 2002; ISBN 978-0521009768. [Google Scholar]
- Pinheiro, J.C.; Bates, D.M. Fitting linear mixed-effects models. In Mixed-Effects Models in S and S-PLUS; Springer: New York, NY, USA, 2000; pp. 133–199. [Google Scholar]
- Oksanen, J.; Blanchet, F.G.; Kindt, R.; Legendre, P.; Minchin, P.R.; O’hara, R.B.; Solymos, P.; Stevens, M.H.H.; Wagner, H. Package ‘Vegan’—Community Ecology Package. R package version 1.15-1. Available online: http://vegan.r-forge.r-project.org/ (accessed on 4 January 2013).
- Currie, D.J.; Mittelbach, G.G.; Cornell, H.V.; Field, R.; Guegan, J.F.; Hawkins, B.A.; Kaufman, D.M.; Kerr, J.T.; Oberdorff, T.; O’ Brien, E.; et al. Predictions and tests of climate-based hypotheses of broad-scale variation in taxonomic richness. Ecol. Lett. 2004, 7, 1121–1134. [Google Scholar] [CrossRef]
- Mittelbach, G.G.; Schemske, D.W.; Cornell, H.V.; Allen, A.P.; Brown, J.M.; Bush, M.B.; Harrison, S.P.; Hurlbert, A.H.; Knowlton, N.; Lessios, H.A.; et al. Evolution and the latitudinal diversity gradient: speciation, extinction and biogeography. Ecol. Lett. 2007, 10, 315–331. [Google Scholar] [CrossRef] [PubMed] [Green Version]
- Rodríguez-Durán, A. Metabolic rates and thermal conductance in 4 species of Neotropical bats roosting in hot caves. Comp. Biochem. Physiol. A 1995, 110, 347–355. [Google Scholar] [CrossRef]
- Baudinette, R.V.; Churchill, S.K.; Christian, K.A.; Nelson, J.E.; Hudson, P.J. Energy, water balance and the roost microenvironment in three Australian cave-dwelling bats (Microchiroptera). J. Comp. Physiol. B 2000, 170, 439–446. [Google Scholar] [CrossRef] [PubMed]
- Graham, G.L. Bats vs. birds: Comparisons among Peruvian volant vertebrate faunas along an elevational gradient. J. Biogeogr. 1990, 17, 657–668. [Google Scholar] [CrossRef]
- Cisneros, L.M.; Burgio, K.R.; Dreiss, L.M.; Klingbeil, B.T.; Patterson, B.D.; Presley, S.J.; Willig, M.R. Multiple dimensions of bat biodiversity along an extensive tropical elevational gradient. J. Anim. Ecol. 2014, 83, 1124–1136. [Google Scholar] [CrossRef] [PubMed]
- Adams, M.D.; Law, B.S.; French, K.O. Vegetation structure influences the vertical stratification of open- and edge-space aerial-foraging bats in harvested forests. For. Ecol. Manag. 2009, 258, 2090–2100. [Google Scholar] [CrossRef]
- Bolívar-Cimé, B.; Laborde, J.; MacSwiney, M.C.; Muñoz-Robles, C.; Tun-Garrido, J. Response of phytophagous bats to patch quality and landscape attributes in fragmented tropical semi-deciduous forest. Acta Chiropterol. 2013, 15, 399–409. [Google Scholar] [CrossRef]
- Aguirre, L.F.; Lens, L.; Matthysen, E. Patterns f roost use by bats in a Neotropical savanna: implications for conservation. Biol. Conserv. 2013, 111, 435–443. [Google Scholar] [CrossRef]
- Avila-Flores, R.; Medellín, R. Ecological, taxonomic, and physiological correlates of cave use by Mexican bats. J. Mammal. 2004, 85, 675–687. [Google Scholar] [CrossRef]
- Paglia, A.P.; Fonseca, G.A.B.; Rylands, A.B.; Herrmann, G.; Aguiar, L.M.S.; Chiarello, A.G.; Leite, Y.L.R.; Costa, L.P.; Siciliano, S.; Kierulff, M.C.M.; et al. Annotated Checklist of Brazilian Mammals, 2nd ed.; Conservação Internacional do Brasil: Belo Horizonte, Brazil, 2012; ISBN 978-1-934151-49-5. [Google Scholar]
- Kunz, T.H. Roosting ecology of bats. In Ecology of Bats, 1st ed.; Kunz, T.H., Ed.; Plenum Press: New York, NY, USA, 1982; Volume 1, pp. 1–55. ISBN 9780306409509. [Google Scholar]
- Elgar, M.A.; Harvey, H. Basal metabolic rates in mammals: allometry, phylogeny and ecology. Funct. Ecol. 1987, 1, 25–36. [Google Scholar] [CrossRef]
- Lyman, C.P. Thermoregulation and metabolism in bats. In Biology of Bats, 1st ed.; Wimsatt, W.A., Ed.; Academic Press: New York, NY, USA, 2012; Volume 1, pp. 301–330. ISBN 978-0124313187. [Google Scholar]
- McNab, B.K. The influence of food habits on the energetics of eutherian mammals. Ecol. Monogr. 1986, 56, 1–19. [Google Scholar] [CrossRef]
- Speakman, J.R.; Webb, P.I.; Racey, P.A. Effects of disturbance on the energy expenditure of hibernating bats. J. Appl. Ecol. 1991, 28, 1087–1104. [Google Scholar] [CrossRef]
- Mann, S.L.; Steidl, R.J.; Dalton, V.M. Effects of cave tours on breeding Myotis velifer. J. Wildl. Manag. 2002, 66, 618–624. [Google Scholar] [CrossRef]
Figure 1.
Richness of cave-dwelling bats in the Brazilian biomes. Vertical lines: Amazon; White: Brazilian savanna; Diagonal lines: scrub forest; Light gray: wetlands; Dark gray: Atlantic forest; Horizontal lines: grasslands.
Figure 1.
Richness of cave-dwelling bats in the Brazilian biomes. Vertical lines: Amazon; White: Brazilian savanna; Diagonal lines: scrub forest; Light gray: wetlands; Dark gray: Atlantic forest; Horizontal lines: grasslands.

Figure 2.
Assemblage composition of cave-dwelling bats according to Brazilian biomes.

Figure 3.
Generalized additive model (GAM)-derived effect of latitude (a) and elevation (b) on species richness of cave-dwelling bats. The value of 0 on the y-axis is the mean of richness. The approximate 95% confidence envelopes are indicated (grey shading). Tick marks on the x-axis are sampled data points.

Figure 4.
GAM-derived effect of latitude (a) and elevation (b) on species abundance of cave-dwelling bats. The value of 0 on the y-axis is the mean of abundance. The approximate 95% confidence envelopes are indicated (grey shading). Tick marks on the x-axis are sampled data points.
Figure 4.
GAM-derived effect of latitude (a) and elevation (b) on species abundance of cave-dwelling bats. The value of 0 on the y-axis is the mean of abundance. The approximate 95% confidence envelopes are indicated (grey shading). Tick marks on the x-axis are sampled data points.

Figure 5.
Richness (a) and abundance (b) of cave-dwelling bats by biome.

Figure 6.
Percentage of the number of species (a) and individuals (b) of cave-dwelling bats from different feeding guilds between Brazilian biomes.
Figure 6.
Percentage of the number of species (a) and individuals (b) of cave-dwelling bats from different feeding guilds between Brazilian biomes.

Figure 7.
Distribution of Brazilian caves. Black triangles represent the caves that had already been sampled for bats and the grey circles represent the caves registered for Brazil, including one cave in the island of Fernando de Noronha.
Figure 7.
Distribution of Brazilian caves. Black triangles represent the caves that had already been sampled for bats and the grey circles represent the caves registered for Brazil, including one cave in the island of Fernando de Noronha.


Table 1.
Species richness and ranking of abundance of families of Brazilian cave bats.
| Family | Abundance (% of Individuals Belonging to the Families) | Richness of Species that Had Their Abundance Registered | Total Richness Registered | Richness of Species Registered in Brazil (% of Species of the Family that Use Caves as a Roost) |
|---|---|---|---|---|
| Phyllostomidae | 8693 (89.9) | 35 | 39 | 92 (42.4) |
| Furipteridae | 490 (5.1) | 1 | 1 | 1 (100.0) |
| Vespertilionidae | 170 (1.7) | 5 | 10 | 28 (35.7) |
| Mormoopidae | 129 (1.3) | 2 | 5 | 3 (100.0) |
| Emballonuridae | 92 (0.9) | 3 | 4 | 17 (23.5) |
| Natalidae | 79 (0.8) | 1 | 1 | 1 (100.0) |
| Noctilionidae | 10 (0.0) | 1 | 1 | 2 (50.0) |
| Molossidae | 2 (0.0) | 1 | 10 | 29 (34.5) |
| Thyropteridae | 1 (0.0) | 1 | 1 | 5 (20.0) |
| Total | 9666 (100.0) | 50 | 72 | 178 (40.4) |
Table 2.
Richness, abundance, and biomass of the feeding guilds of Brazilian cave bats.
| Feeding Guild | Total Richness | Richness with the Abundance Registered | Individuals | Biomass (g) |
|---|---|---|---|---|
| Hematophagous | 4 | 3 | 4011 | 130,703.5 |
| Omnivorous | 2 | 2 | 546 | 48,840.0 |
| Frugivorous | 12 | 11 | 1182 | 29,694.5 |
| Nectarivorous | 7 | 7 | 1907 | 24,793.4 |
| Insectivorous | 41 | 21 | 1823 | 16,796.8 |
| Carnivorous | 6 | 6 | 179 | 8193.5 |
© 2018 by the authors. Licensee MDPI, Basel, Switzerland. This article is an open access article distributed under the terms and conditions of the Creative Commons Attribution (CC BY) license (http://creativecommons.org/licenses/by/4.0/).
Share and Cite
MDPI and ACS Style
De Oliveira, H.F.M.; Oprea, M.; Dias, R.I. Distributional Patterns and Ecological Determinants of Bat Occurrence Inside Caves: A Broad Scale Meta-Analysis. Diversity 2018, 10, 49. https://doi.org/10.3390/d10030049
AMA Style
De Oliveira HFM, Oprea M, Dias RI. Distributional Patterns and Ecological Determinants of Bat Occurrence Inside Caves: A Broad Scale Meta-Analysis. Diversity. 2018; 10(3):49. https://doi.org/10.3390/d10030049
Chicago/Turabian StyleDe Oliveira, Hernani Fernandes Magalhães, Monik Oprea, and Raphael Igor Dias. 2018. "Distributional Patterns and Ecological Determinants of Bat Occurrence Inside Caves: A Broad Scale Meta-Analysis" Diversity 10, no. 3: 49. https://doi.org/10.3390/d10030049
Note that from the first issue of 2016, this journal uses article numbers instead of page numbers. See further details here.