Article

Mitochondrial Genomes from New Zealand’s Extinct Adzebills (Aves: Aptornithidae: Aptornis) Support a Sister-Taxon Relationship with the Afro-Madagascan Sarothruridae

1
Australian Centre for Ancient DNA (ACAD), University of Adelaide, Adelaide, SA 5005, Australia
2
School of Biological Sciences, University of Adelaide, Adelaide, SA 5005, Australia
3
School of Environment, The University of Auckland, Auckland 1142, New Zealand
4
Landcare Research, Lincoln 7608, New Zealand
5
Medical, Molecular and Forensic Sciences, Murdoch University, Perth, WA 6150, Australia
6
Archaeological Studies Program, University of the Philippines Diliman, Quezon City 1101, Philippines
7
College of Science and Engineering, Flinders University, GPO 2100, Adelaide, SA 5001, Australia
8
Canterbury Museum, Christchurch 8013, New Zealand
9
Museum of New Zealand Te Papa Tongarewa, P.O. Box 467, Wellington 6140, New Zealand
10
Department of Biology, New Mexico State University, Las Cruces, NM 88003, USA
11
Trace and Environmental DNA (TrEnD) Laboratory, School of Molecular and Life Sciences, Curtin University, Perth, WA 6102, Australia
*
Authors to whom correspondence should be addressed.
Diversity 2019, 11(2), 24; https://doi.org/10.3390/d11020024
Submission received: 4 December 2018 / Revised: 25 January 2019 / Accepted: 28 January 2019 / Published: 15 February 2019
(This article belongs to the Special Issue Genomic Analyses of Avian Evolution)

Abstract

:
The recently extinct New Zealand adzebills (Aptornithidae, Aptornis spp.) were an enigmatic group of large flightless birds that have long eluded precise taxonomic assignment as they do not closely resemble any extant birds. Adzebills were nearly wingless, weighed approximately 16–19 kg, and possessed massive adze-like reinforced bills whose function remains unknown. Using hybridisation enrichment and high-throughput sequencing of DNA extracted from subfossil bone and eggshell, near-complete mitochondrial genomes were successfully assembled from the two Quaternary adzebill species: the North Island Adzebill (Aptornis otidiformis) and South Island Adzebill (A. defossor). Molecular phylogenetic analyses confirm that adzebills are members of the Ralloidea (rails and allies) and are sister-taxon to the Sarothruridae, which our results suggest comprises the Madagascan wood rails (Mentocrex, two likely sp.) in addition to the tiny (<50 gram) rail-like Afro-Madagascan flufftails (Sarothrura, 9 spp.). Node age estimates indicate that the split between adzebills and Sarothruridae occurred ~39.6 Ma, suggesting that the ancestors of the adzebills arrived in New Zealand by long-distance dispersal rather than continental vicariance. This newly identified biogeographic link between physically distant New Zealand and Afro-Madagascar, echoed by the relationship between the New Zealand kiwi (Apterygiformes) and Madagascan elephant-birds (Aepyornithiformes), suggests that the adzebill’s near relatives were formerly more widespread. In addition, our estimate for the divergence time between the two Quaternary adzebill species (0.2–2.3 Ma) coincides with the emergence of a land-bridge between the North and South islands of New Zealand (ca. 1.5–2 Ma). This relatively recent divergence suggests that North Island adzebills are the result of a relatively recent dispersal from the South Island, from which the earliest (Miocene) adzebill fossil has been described.

1. Introduction

The islands of New Zealand (NZ) are exceptional for their long oceanic isolation from the supercontinent Gondwana (>52 Ma) [1], large size (>260,000 km²), and absence of mammals (except bats) among the recent native land-fauna. NZ’s native biodiversity is rich in phylogenetically distinct lineages, and extraordinary examples of gigantism and flightlessness among the avifauna. Important examples include the nine species of megaherbivore ratite moa, weighing up to 250 kg (Dinornithiformes) [2,3], four of the world’s five known flightless songbirds [4], the world’s heaviest parrot (also flightless) [5], and the largest-known eagle (Aquila moorei) [6]. However, widespread extinction (>40% of endemic bird species) [3,7] following human settlement in NZ around 1270 AD [8] means that phylogenetic studies on many NZ taxa have been dependent on advances in ancient DNA (aDNA) research [9]. As a result, the evolutionary histories of many of NZ’s unique animal taxa, including the adzebill (Aptornis: Aptornithidae), remain unresolved or inconclusive.
Adzebills were large, specialised, flightless birds endemic to NZ, which have been a taxonomic and ecological enigma since they were first described by Richard Owen in 1844 [10,11,12,13]. The genus Aptornis includes two recently extinct species: the North Island Adzebill (A. otidiformis), typically reaching around 16 kg; and the larger South Island Adzebill (A. defossor), typically reaching around 19 kg (though a maximum size of 25 kg has been suggested) [2]. In addition, fragments of a fossil adzebill (A. proasciarostratus), strikingly similar to recent adzebills, have also been described from the Early Miocene (16–19 Ma) deposits near St Bathans in the southern South Island, suggesting a long history of the group in NZ [14]. Both recent species were nearly wingless and had a robust and specialised morphology. The massive beak and skull, as well as the neck vertebrae, were heavily reinforced and likely supported powerful muscles. Adzebills also had robust legs and feet, which may have been used with the massive bill to excavate or immobilize food or prey. Stable isotopes from adzebill bone specimens confirm that adzebills had a high trophic niche and were likely predators or scavengers, although their exact feeding strategy remains unknown [2,15]. Archaeological deposits confirm that adzebills were hunted by early Maori [16,17,18], who also rapidly cleared the dry, lowland podocarp forests in eastern NZ [19] which were the birds’ main habitat during the Holocene [2,15]. Both activities led to the extinction of the recent adzebill species around the same time as the moa, circa 1500 CE [2,20].
The highly derived morphology of adzebills has long complicated their classification, though they have usually been placed in Gruiformes along with several other bird families found in former fragments of Gondwana (especially New Caledonia, Madagascar, and South America). It has often been proposed that the ancestor of these “gruiform” bird families, including adzebills, inhabited Gondwana prior to its break up and that their present biogeography reflects continental vicariance [21]. Specifically, morphological analyses have suggested adzebills are most closely related to the New Caledonian Kagu (Rhynochetos jubatus) [21,22,23,24], consistent with the possible existence of emergent land connecting New Zealand and New Caledonia during the Paleogene [25,26]. However, recent phylogenetic studies have found that most traditional gruiforms do not form a monophyletic group, except for two superfamilies (each comprising three extant families): the Gruoidea (cranes and allies) and Ralloidea (rails and allies) [27,28,29]. For example, the Kagu and the South American Sunbittern Eurypyga helias (together comprising Eurypygiformes) appear to form the sister-taxon to tropicbirds (Phaethontiformes) [24,29,30]. Previous analyses of a 673 bp fragment of the mitochondrial 12S rRNA gene from the South Island Adzebill suggested that adzebills were members of the Ralloidea in the Gruiformes and unrelated to kagu [31], although insufficient data and limited taxon sampling prevented confident identification of the adzebills’ precise phylogenetic affinities. These alternative and incompatible hypotheses for the classification of adzebills—as members of either Eurypygiformes or Gruiformes—have widely disparate implications for their biogeographic and temporal origins.
If adzebills are ralloids, and not eurypygiforms, then the question becomes: “to what living ralloids are they most closely related?” Any attempts to answer this question require a robust phylogenetic framework for Ralloidea, which historically contains an uncertain number of families (with varying taxonomic contents). For example, the flufftails (Sarothrura spp.) were previously considered members of the ralloid family Rallidae (the rails) but are now recognised as comprising their own family (Sarothruridae) [32] more closely related to the finfoots (Heliornithidae) [24,28]. Similarly, the Madagascan wood rails (Mentocrex kioloides sspp.), which are presently classified as Rallidae [32], were recently suggested to be closer relatives of Sarothruridae [33].
In this study, we present the first near-complete mitochondrial genome sequences from both recent species of adzebill. We also present new genetic data from several key gruiform lineages of uncertain affinity, including members of the Rallidae. We analyse these new sequences alongside all available mitochondrial data for ralloids, as well as the kagu, to confidently resolve the phylogenetic position of the adzebills and estimate the timeline for their evolution.

2. Methods

2.1. Samples

We sampled femora from one North Island (NI) Adzebill (A. otidiformis) and one South Island (SI) Adzebill (A. defossor), both held in the collections of the Museum of New Zealand Te Papa Tongarewa (NMNZ). The North Island specimen (NMNZ DM8046) was collected from a cavern near Coonoor, Wairarapa, south-eastern North Island (40.4° S, 176.1° E). Worthy [34] inferred that the deposits in this cavern had a maximum age of “a few thousands of years at most”. The SI specimen (NMNZ S23033) was collected from the Honeycomb Hill Cave System, north-western South Island (41.1° S, 172.2° E). Adzebills were most common in Pleistocene deposits in the north-western South Island (including Honeycomb Hill system) [2,15,35,36], so S23033 may be of Pleistocene age (i.e., >12 ka).
In addition to the two bone samples, we also analysed three putative adzebill eggshell fragments collected from a rockshelter near Hukanui, central North Island (39.3° S, 176.5° E), held in the collections of the Canterbury Museum. The collection (CMC AV18536) consists of about 40 shards of eggshell, 20 of which were identified as having the same curvature and pore structure as the fragments confirmed as Aptornis (see below). These Aptornis-like fragments varied between 3 and 8 mM in diameter and averaged between 610 and 650 μM in thickness. The fragments were off-white in colour and displayed a low density of round pores on the surface. Bone and sediment samples from this rockshelter [37] have been shown using AMS (Accelerator Mass Spectrometry) and OSL (Optically-Stimulated Luminescence) dating to post-date the Taupo Ignimbrite (c. 1850 yr BP).
The DNA extraction and library preparation for the subfossil bone and eggshell samples were performed in purpose-built, physically isolated, ancient DNA laboratories. The bone samples were processed at the Australian Centre for Ancient DNA (ACAD), University of Adelaide, while the eggshell fragments were processed at the Ancient DNA Laboratory, Murdoch University.
We also sampled a number of extant gruiforms to serve as outgroups in our phylogenetic analyses (Table S1). Muscle of the extant Gray-winged Trumpeter, Psophia crepitans (Gruoidea: Psophiidae), was sampled from a deceased individual from the National Zoological Park, USA (species assignment was confirmed by comparison to the available P. crepitans CytB sequence, GenBank accession D8Q4900, which yielded a 99.96% pairwise match). In addition, we also sourced skin samples from museum specimens of the Limpkin Aramus guarauna (Gruoidea: Aramidae), the Red-chested Flufftail Sarothrura rufa (Ralloidea: Sarothruridae), and the Grey-throated Rail Canirallus oculeus (Ralloidea: Rallidae) (Table S1). Although no genetic data from C. oculeus has previously been analysed, it is often considered congeneric with Mentocrex, and may therefore be a close relative of Sarothruridae. Samples from extant species were processed in a clean-room at the University of Adelaide or the South Australian Regional Facility for Molecular Ecology and Evolution (SARFMEE) molecular biology labs.

2.2. DNA Extraction

2.2.1. Bone Samples

To control for contaminants, the exterior surfaces (~1 mm) of both adzebill bone samples were removed using a Dremel tool. Bone samples were powdered using a mikro-dismembrator (Sartorius). Around 0.2–0.3 g of bone powder from each sample was digested by rotational incubation at 37 °C overnight in 4 mL of 0.5M EDTA pH 8.0 followed by a second round of incubation at 55 °C with 60 µL of proteinase-K. The resulting solution was bound to silica, washed, and eluted using the silica-based method of Brotherton et al. [38].

2.2.2. Tissue Samples

DNA was isolated from samples of extant species using a DNeasy Blood & Tissue kit (for skin) (QIAGEN, Hilden, Germany) or a modified salting-down extraction (for muscle), where ~0.3 g tissue was mixed with 300 µL cell lysis solution, 3 µL proteinase K and incubated at 55 °C [39]. The high molecular weight DNA extracted from the grey-winged trumpeter sample was sheared to ~300 bp using a focused-ultrasonicator (Covaris). DNA extracted from the other extant species was not sheared, as the specimens were museum skins and the DNA was consequently already fragmented.

2.2.3. Eggshell Samples

Exposed surfaces of the eggshell fragments were abraded with a Dremel tool at low speed and the resulting powder was discarded to minimise contamination. The cleaned eggshell fragments (each 50–100 mm2 in size) were then further abraded with the Dremel to produce additional powder, which was extracted using the digestion and silica-binding method of Oskam et al. [40].

2.3. Library Preparation and DNA Sequencing

2.3.1. Bone and Tissue Samples

Extracts were blunt-end repaired, and custom adapters ligated, using the library preparation protocol of Meyer and Kircher [34]. Each adapter (5’ and 3’) contained a unique 7 mer index, allowing both for identification of amplified DNA and downstream removal of contaminant sequencing reads. Following library preparation, each sample was amplified using PCR in eight separate reactions to reduce amplification bias. Each reaction contained 1 × PCR buffer, 2.5 mM MgCl2, 1 mM dNTPs, 0.5 mM primer, 1.25 U AmpliTaq Gold, 2 μL DNA extract. Reactions were subjected to the following thermocycling regime: 94 °C 12 min; 13 of 94 °C for 30 s, 60 °C for 30 s, 72 °C for 40 s (plus an additional 2 s per cycle); and a final extension of 72 °C for 10 min. Individual PCR products for each library were pooled following amplification, and purified using AMPure magnetic beads (Agencourt).
All libraries were enriched for host mitochondrial DNA using commercially synthesised biotinylated 80 mer RNA baits (Arbor Biosciences, Ann Arbor, MI, USA). Baits were designed using a wide range of published whole mitochondrial genome sequences (not including control region/D-loop) of a variety of avian taxa, including palaeognaths, galloanseres, and neoavians [41,42,43,44]. DNA-RNA hybridisation enrichment was performed using 200 ng of library following the manufacturer’s recommended protocol (myBaits v1), with the exception that the incubation was extended to 44 h (3 h at 60 °C, 12 h at 55 °C, 12 h at 50 °C, 17 h at 55 °C). Following incubation, baits were immobilised on magnetic MyOne Streptavidin Beads (Life Technologies, Christchurch, New Zealand). The baits were washed once with 1 × SCC and 0.1% SDS (15 min at room temperature), and twice with 0.1 × SCC and 0.1% SDS (10 min at 50 °C), then resuspended in 0.1 M NaOH pH 13.0. The resulting enriched library was purified using a Minelute spin-column (QIAGEN), and subjected to a further round of PCR (12 cycles, eight reactions, using above recipe). Enriched libraries were subjected to a final round of PCR (seven cycles, five reactions, using above recipe), using fusion primers to add full-length Illumina sequencing adapters for sequencing [45]. Libraries were diluted to 2 nM (quantified using KAPA qPCR) and sequenced on an Illumina MiSeq using 2 × 150 (300 cycle, paired-end) sequencing chemistry.

2.3.2. Eggshell Samples

A fragment of the mitochondrial 12S rRNA gene was amplified and sequenced from the eggshell DNA extractions using the primers 12Sa and 12Sh [46], which confirmed the identity of two samples as A. otidiformis. The third eggshell DNA extract was identified as Little Bush Moa (Anomalopteryx didiformis) and was excluded from further analyses. The eggshell libraries were prepared for sequencing using a Roche 454 GS Junior platform. Roche RL017 adapters were ligated to pooled DNA from the two eggshell extracts that were positively identified as A. otidiformis using the New England Biosciences Next Quick DNA sample prep reagent set 2 (Protocol 1). Unligated adapter oligos were removed by undertaking the small fragment removal (E6116) twice.
RNA baits (Arbor Biosciences) were produced in 100 mer lengths with 50 bp tiling density based on published mitochondrial genomes from 10 avian taxa (Table S2), excluding the control region/D-loop. A second set of RNA baits were produced based on nuclear genes from six gruiform species published by Hackett et al [28]. An equimolar mixture of these two baits sets was made and used to enrich our library, following the manufacturer’s protocol (myBaits v1) with the exception that the library was eluted from the MyOne beads using a Tris-based buffer rather than NaOH. Small fragments were removed from the resulting captured library by performing two sequential rounds of clean-up with Agencourt AMPure XP beads, before eluting a final volume of 40 µL.
Ion Torrent (ThermoFisher, Waltham, MA, USA) A and B adapters were ligated to the enriched library during a 25-cycle amplification by incorporating Ion Torrent adapters into the 454 primers. As a result, the post amplification library contained sequences for both Ion Torrent and 454 adapters with an Ion Torrent keypass between the two. Sequencing was performed on an Ion Torrent Personal Genome Machine (PGM) with 316 chip array in accordance with the manufacturer’s protocol.

2.4. Data Processing

2.4.1. Bone and Tissue Samples

Reads belonging to each library were demultiplexed according to their unique combination of 5’ and 3’ barcode sequences using Sabre v1.0 (https://github.com/najoshi/sabre) (default parameters; no mismatches allowed). Adapter sequences were removed and paired-end reads were collapsed (where the forward and reverse reads overlapped) using AdapterRemoval v2.1.2 [47]. Low quality bases were trimmed (<Phred20 --minquality 4) and collapsed reads shorter than 25 bp were discarded (--minlength 25). Read quality was visualised using fastQC v0.10.1 (http://www.bioinformatics.bbsrc.ac.uk/projects/fastqc) before and after trimming to make sure the trimming of adapters was efficient. Only the collapsed reads from the bone and tissue samples were used in downstream analyses.

2.4.2. Eggshell Samples

Ion Torrent PGM post-run analysis identified and removed the Ion Torrent keypass and adapter sequences. We then used Geneious v8.1.9 to remove the 454 adapter sequences by breaking the 3.2 million reads into 500,000 read batches (due to memory limitations) and searching for a 25 bp motif corresponding to the 454 adapter sequence. In addition, we trimmed the last 35 bp of all reads to ensure that any residual adapter was removed from the opposite end of the molecule.

2.5. Genome Assembly

To create consensus sequences for outgroup species and our highest-quality adzebill specimen (DM8046), we iteratively mapped collapsed reads from each species to the published NZ Weka (Gallirallus australis) mitochondrial genome (KF701060) using the Geneious Read Mapper in Geneious v9.1.6 [48,49] with the following parameter values: maximum mismatches per read = 15%, minimum mapping quality = Phred 30, maximum gaps per read = 10% read length, maximum gap length = 10 bp, minimum overlap = 25 bp, word size = 8. We continued mapping iteratively using these parameter values until no additional reads were obtained and then created a majority-rule consensus sequence after checking the alignment by eye. We then used BWA [50] (aln -l 1024, -o 2) to perform a more stringent round of mapping for each species using the majority-rule consensuses as reference sequences. Mapping stringency in BWA was relaxed slightly for adzebills versus the extant outgroups (−n 0.01 versus −n 0.04) to account for the presence of miscoding lesions in our aDNA data. Final 75% majority consensus sequences were then generated in Geneious after removing duplicate reads using ‘FilterUniqueSAMCons.py’ [51]. We only called bases for sites covered by ≥3 reads (appropriate IUPAC degenerate bases were called instead where coverage was insufficient or no >75% majority base was observed). To generate consensus sequences for our other two adzebill specimens (S23033 and AV18536), we mapped the collapsed reads from S23033 and all reads from the eggshell library to the majority-rule consensus for DM8046 using BWA (aln -l 1024, -o 2, -n 0.01). Final consensus sequences were generated for these two specimens as above, with the exception that “MarkDuplicates.py” was used to deduplicate the reads from the eggshell library, as the Ion Torrent PGM data was single-end only (so reads derived from the same template molecule may be of different lengths). Details of all final consensus sequences are provided in Table S1. We used MapDamage v2.0.6 [52] to ensure that damage patterns in the adzebill data were consistent with authentic ancient DNA (Figures S1–S3).

2.6. Taxon Sampling and Sequence Alignment

We made three sequence alignments with varying taxon-sampling and levels of data “completeness” (see Table S3 and description below for sample accession numbers and genes selected). All alignments were of identical length (15,140 bp) and differed only in respect to taxa included. In these alignments, we used only the most complete sequence from our two North Island Adzebill samples (DM8046), as the two sequences were nearly identical for alignment columns where both were unambiguously called. For other taxa where the same locus had been sequenced for multiple individuals we created and used a 90% majority rule consensus. Exceptions were made for several taxa, such as the New Guinea Flightless Rail (Megacrex inepta), where pairwise comparison revealed high levels of divergence between sequences supposedly from individuals belonging to the same species (in these cases sequences from different specimens/studies were considered independently). Alignments were performed using MAFFT v7.017 [53,54] (default settings) as implemented in Geneious, and sequences were partitioned into protein-coding genes, tRNAs, and rRNAs. We checked the alignments by eye and removed poorly aligning regions around large insertions/deletions. Only one taxon in our alignments, the Black-browed Albatross Thalassarche melanophris (Procellariiformes), had an observable gene duplication (two adjacent copies of the region comprising ND6, control region and nearby tRNAs): a pattern widespread in the genus Thalassarche [55]. In the case of T. melanophris, only the duplicated gene region next to Cytochrome B was retained in our alignments.
Our first alignment (alignment A), comprised 12 complete mitochondrial genome sequences: the North Island adzebill; the Kagu (Rhynochetos jubatus); one member of each gruiform family, including the Eurasian Coot Fulica atra (Ralloidea: Rallidae), Red-chested Flufftail Sarothrura rufa (Ralloidea: Sarothruridae), Sungrebe Heliornis fulica (Ralloidea: Heliornithidae), Gray-winged Trumpeter Psophia crepitans (Gruoidea: Psophiidae), Common Crane Grus grus (Gruoidea: Gruidae), and Limpkin Aramus guarauna (Gruoidea: Aramidae); and four outgroups comprising Southern Rockhopper Penguin Eudyptes chrysocome (Sphenisciformes), Black-browed Albatross Thalassarche melanophris (Procellariiformes), Chicken Gallus gallus (Galliformes), and Southern Brown Kiwi Apteryx australis (Apterygiformes).
Our second alignment (alignment B) was focused on Gruiformes and comprised mostly complete mitochondrial genome sequences (excluding the control region), together representing all the major gruiform clades identified by previous phylogenetic studies [27,33,56] (Table S3). We also included the Southern Rockhopper Penguin and Black-browed Albatross as outgroups. As Krajewski et al. [57] have already comprehensively resolved the mitochondrial phylogeny of Gruidae, in our study we elected to include only the Black-crowned Crane (Balearica pavonina) to represent the Balearicinae and the Common Crane and Siberian Crane (Leucogeranus leucogeranus, the basal gruine species) to represent the Gruinae. Although not represented by complete mitochondrial genomes, we included all available data from the African Finfoot and Masked Finfoot (Podica senegalensis and Heliopais personatus, respectively) of the Heliornithidae and the Madagascan wood rails (Mentocrex sspp.) of the Rallidae, so that all ralloid families were represented.
Our final alignment (alignment C) comprised the exact same taxa and data from alignment B but with the addition of more taxa for which only one or several mitochondrial genes sequences were available. Thus, of our three alignments, alignment C had the most complete taxon sampling but also the most missing data. Overall, alignment C covered all gruiform families, including both Gruidae subfamilies (Gruinae, 2/3 genera, 2/3 species; Balearicinae, 1/1 genera, 1/2 species), Psophiidae (1/1 genera, 1/3 species), Aramidae (1/1 genera, 1/1 species), Heliornithidae (3/3 genera, 3/3 species) and Sarothruridae (1/1 genera, 2/9 species). The taxonomy of the speciose family Rallidae is in continual flux and so, for reference, in the present study we follow the classification of Dickinson and Remsen [32], which recognises 146 species in 40 genera (extant and recently extinct). Of the taxa recognised by Dickinson and Remsen [32], alignment C includes representatives from 98 species and 32 genera.

2.7. Molecular Phylogenetic Analyses

To test for saturation of 3rd codon positions of protein coding genes, we used DAMBE v7.0.28 [58,59]. Using alignment B, but omitting Mentocrex, Heliopais, and Podica (which lacked complete mitochondrial genomes), we partitioned our dataset into 1st, 2nd, and 3rd codon positions of protein-coding genes, and into RNA-coding sequences. The saturation test by Xia et al. [60] found that 3rd codon positions were significantly more saturated than all other partitions (and were the only positions for which significant saturation was detected), although they still contained phylogenetic information (p < 0.01, Table S4). Saturation plots of transitions/transversions versus divergence of all partitions were generated using an F84 substitution model (Figure S4). 1st codon, 2nd codon, and RNA-coding sequences revealed linear plots for both transitions and transversions typical of unsaturated sites [60]. However, the saturation plot of 3rd codon positions demonstrated a linear model for transversions only, whereas transitions quickly became saturated with increasing divergence. As a result, all 3rd codon position nucleotides in our alignments were converted into the IUPAC ambiguity codes R (purines) and Y (pyrimidines), thus removing transitions at 3rd codon positions from all subsequent analyses.
To identify appropriate partition schemes and substitution models for each of our three alignments we used PartitionFinder v2.1.1 [61,62]. We provided PartitionFinder with 51 putative partitions, comprising 1st and 2nd codon positions of individual protein-coding genes, plus the individual rRNA tRNAs coding genes. 3rd codon positions (RY-coded) were combined into a single partition. We used the greedy algorithm and chose the best-supported scheme according to the Bayesian Information Criterion (Table S5).
Phylogenetic trees were estimated using Bayesian estimates as implemented through MrBayes v3.2.6 [63,64], using the partition schemes and substitution models suggested by PartitionFinder. These used a total of 1 × 10⁶ (alignment A and B) and 5 × 10⁶ generations (alignment C). A total of eight separate chains were used, and convergence between all chains was assessed and confirmed using the standard convergence diagnostic (standard deviation of split frequencies). The first 25% of sampled trees were discarded as a burn-in to estimate tree topology.
In addition, we performed a maximum likelihood phylogenetic analysis using RAxML v8.2.0 [65] on alignment A only (the reduced taxon set which included the Kagu Rhynochetos jubatus). Our RAxML analysis comprised a maximum likelihood search for the best scoring tree from 1000 bootstrap replicates (-f a). Subsequently, we used RAxML to perform a Shimodaira–Hasegawa test [66,67] to compare our best tree topology to several alternative topologies (-f h): (1) a tree where Aptornis otidiformis was sister taxon to R. jubatus; (2) a tree where A. otidiformis was sister-taxon to Psophia crepitans; (3) a tree where A. otidiformis was sister-taxon to a clade comprising P. crepitans, Grus grus, and Aramus guarauna; and (4) a tree where Aptornis was sister-taxon to Fulica atra.

2.8. Morphological Phylogenetic Analyses

In addition to our molecular analyses, we also reanalysed previously published morphological character matrices [22,23]. Livezey and Zusi’s [23] results suggested a sister-relationship between Aptornis and Rhynochetos, which conflicted with the results of our molecular analyses (which supported Aptornis as a member of Gruiformes; see Results section). Consequently, we sought to identify any morphological characters that supported our molecular results. We reduced Livezey and Zusi’s dataset of 2954 characters from 188 taxa down to 456 parsimony informative characters for 10 taxa: Diomedea (Procellariiformes), Spheniscus (Sphenisciformes), Eurypyga (Eurypygidae), Rhynochetos, Psophia, Aramus, Grus, Porphyrio (Rallidae), Heliornis, and Aptornis. Using accelerated transformation in PAUP 4.0a [68] we mapped the characters onto constraint trees (following [29,30]) in which Aptornis was placed as sister taxon to its nearest sampled relative, Heliornis (as identified by our molecular analysis).
We attempted to identify any additional unrecognised morphological apomorphies diagnosing the phylogenetic position of the adzebills (as revealed by our molecular analyses) by reanalysing Livezey’s [22] morphological character matrix. Livezey [22] compiled an extensive dataset comprising 225 taxa sampled for 381 primarily osteological characters and 189 integument characters. Our reanalysis was performed using PAUP 4.0a [68], and comprised parsimony searches employing 100 random additions, the default heuristic search settings, and 1000 bootstrap replicates. The morphological dataset was analysed using the “backbone constraints” command, constraining the relationships among the 15 taxa represented in our molecular dataset to be consistent with the topology of the trees in Figure 1, Figure 2 and Figure 3. Other taxa were left unconstrained and their phylogenetic positions were inferred from the morphological data. The “describe trees/apolist” command in PAUP was used to find ambiguous and unambiguous apomorphies defining the clade containing Aptornithidae and its nearest relatives in the bootstrap tree.

2.9. Fossil Calibrations and Molecular Clock Analyses

Molecular dating analyses were performed on alignment B using the BEAST software package v1.8.4 (which includes the complementary programs BEAST, LogCombiner, and TreeAnnotater) [69]. The analysis was run four times independently with BEAST v1.8.4 using a birth-death tree prior and a single relaxed lognormal clock model. Each chain was run for 2 × 10⁸ generations, sampling every 2 × 10⁴ generations, with the first 10% of samples discarded as burn-in. The four BEAST runs used different starting trees, each of which had the same topology as the consensus tree obtained from the MrBayes analysis (but had varying branch lengths). We used the partitions and substitution models suggested by PartitionFinder (Table S4). The trees from each run were combined using LogCombiner v1.8.4 and summarised in TreeAnnotater v1.8.4 to create a maximum clade credibility tree.
We calibrated our molecular dating analyses by constraining the age of four nodes in accordance with the fossil record:
1. We followed Claramunt and Cracraft [24] in constraining the split between the Sphenisciformes and Procellariiformes according to an exponential distribution with a mean of 11 Ma and offset of 61 Ma. The offset (minimum bound) was determined by the age of the oldest unequivocal member of the clade, the fossil penguin Waimanu manneringi [70] from the New Zealand Waipara Greensand. Claramunt and Cracraft [24] determined the mean value of the exponential distribution (11 Ma) empirically using the ages of the oldest fossil representatives of the clade (n = 6) from each continent (assuming these fossils were drawn from a uniform temporal distribution).
2. We also followed Claramunt and Cracraft [24] in constraining the split between Gruoidea and Ralloidea according to an exponential distribution with a mean of 8.5 Ma and offset of 52 Ma. Here the offset was determined by Messelornis nearctica [71], the oldest unequivocal member of the Ralloidea. As above, Claramunt and Cracraft [24] determined the value of the mean (8.5 Ma) based on the temporal distribution of the oldest members of the clade (n = 7) from each continent.
3. The well-preserved fossil crane Balearica exigua (Balearicinae) dated to >11.93 Ma [72], as well as similarly-aged subfossil cranes assigned to the genus Palaeogrus (Gruinae) [73], provide a conservative minimum age for the crane subfamilies Balearicinae and Gruinae. Consequently, we constrained the divergence between Balearicinae and Gruinae according to a uniform distribution with a minimum of 12 Ma and a maximum of 65.5 Ma. The maximum bound for this node assumes that all neoavian families and subfamilies diverged during the Tertiary, supported by the lack of crown members of neoavian families prior to the Paleocene and consistent with the results of most recent molecular studies.
4. The fossil adzebill Aptornis proasciarostratus from the New Zealand St Bathans Fauna (16–19 Ma) provides a robust minimum bound for the divergence between the Aptornis lineage and its nearest living relatives [14]. As for constraint 3 above, the beginning of the Tertiary provides a conservative upper bound for family level divergences within Neoaves. Consequently, we constrained the stem-age of Aptornis according to a uniform distribution with a minimum of 16 Ma and a maximum of 65.5 Ma.

3. Results

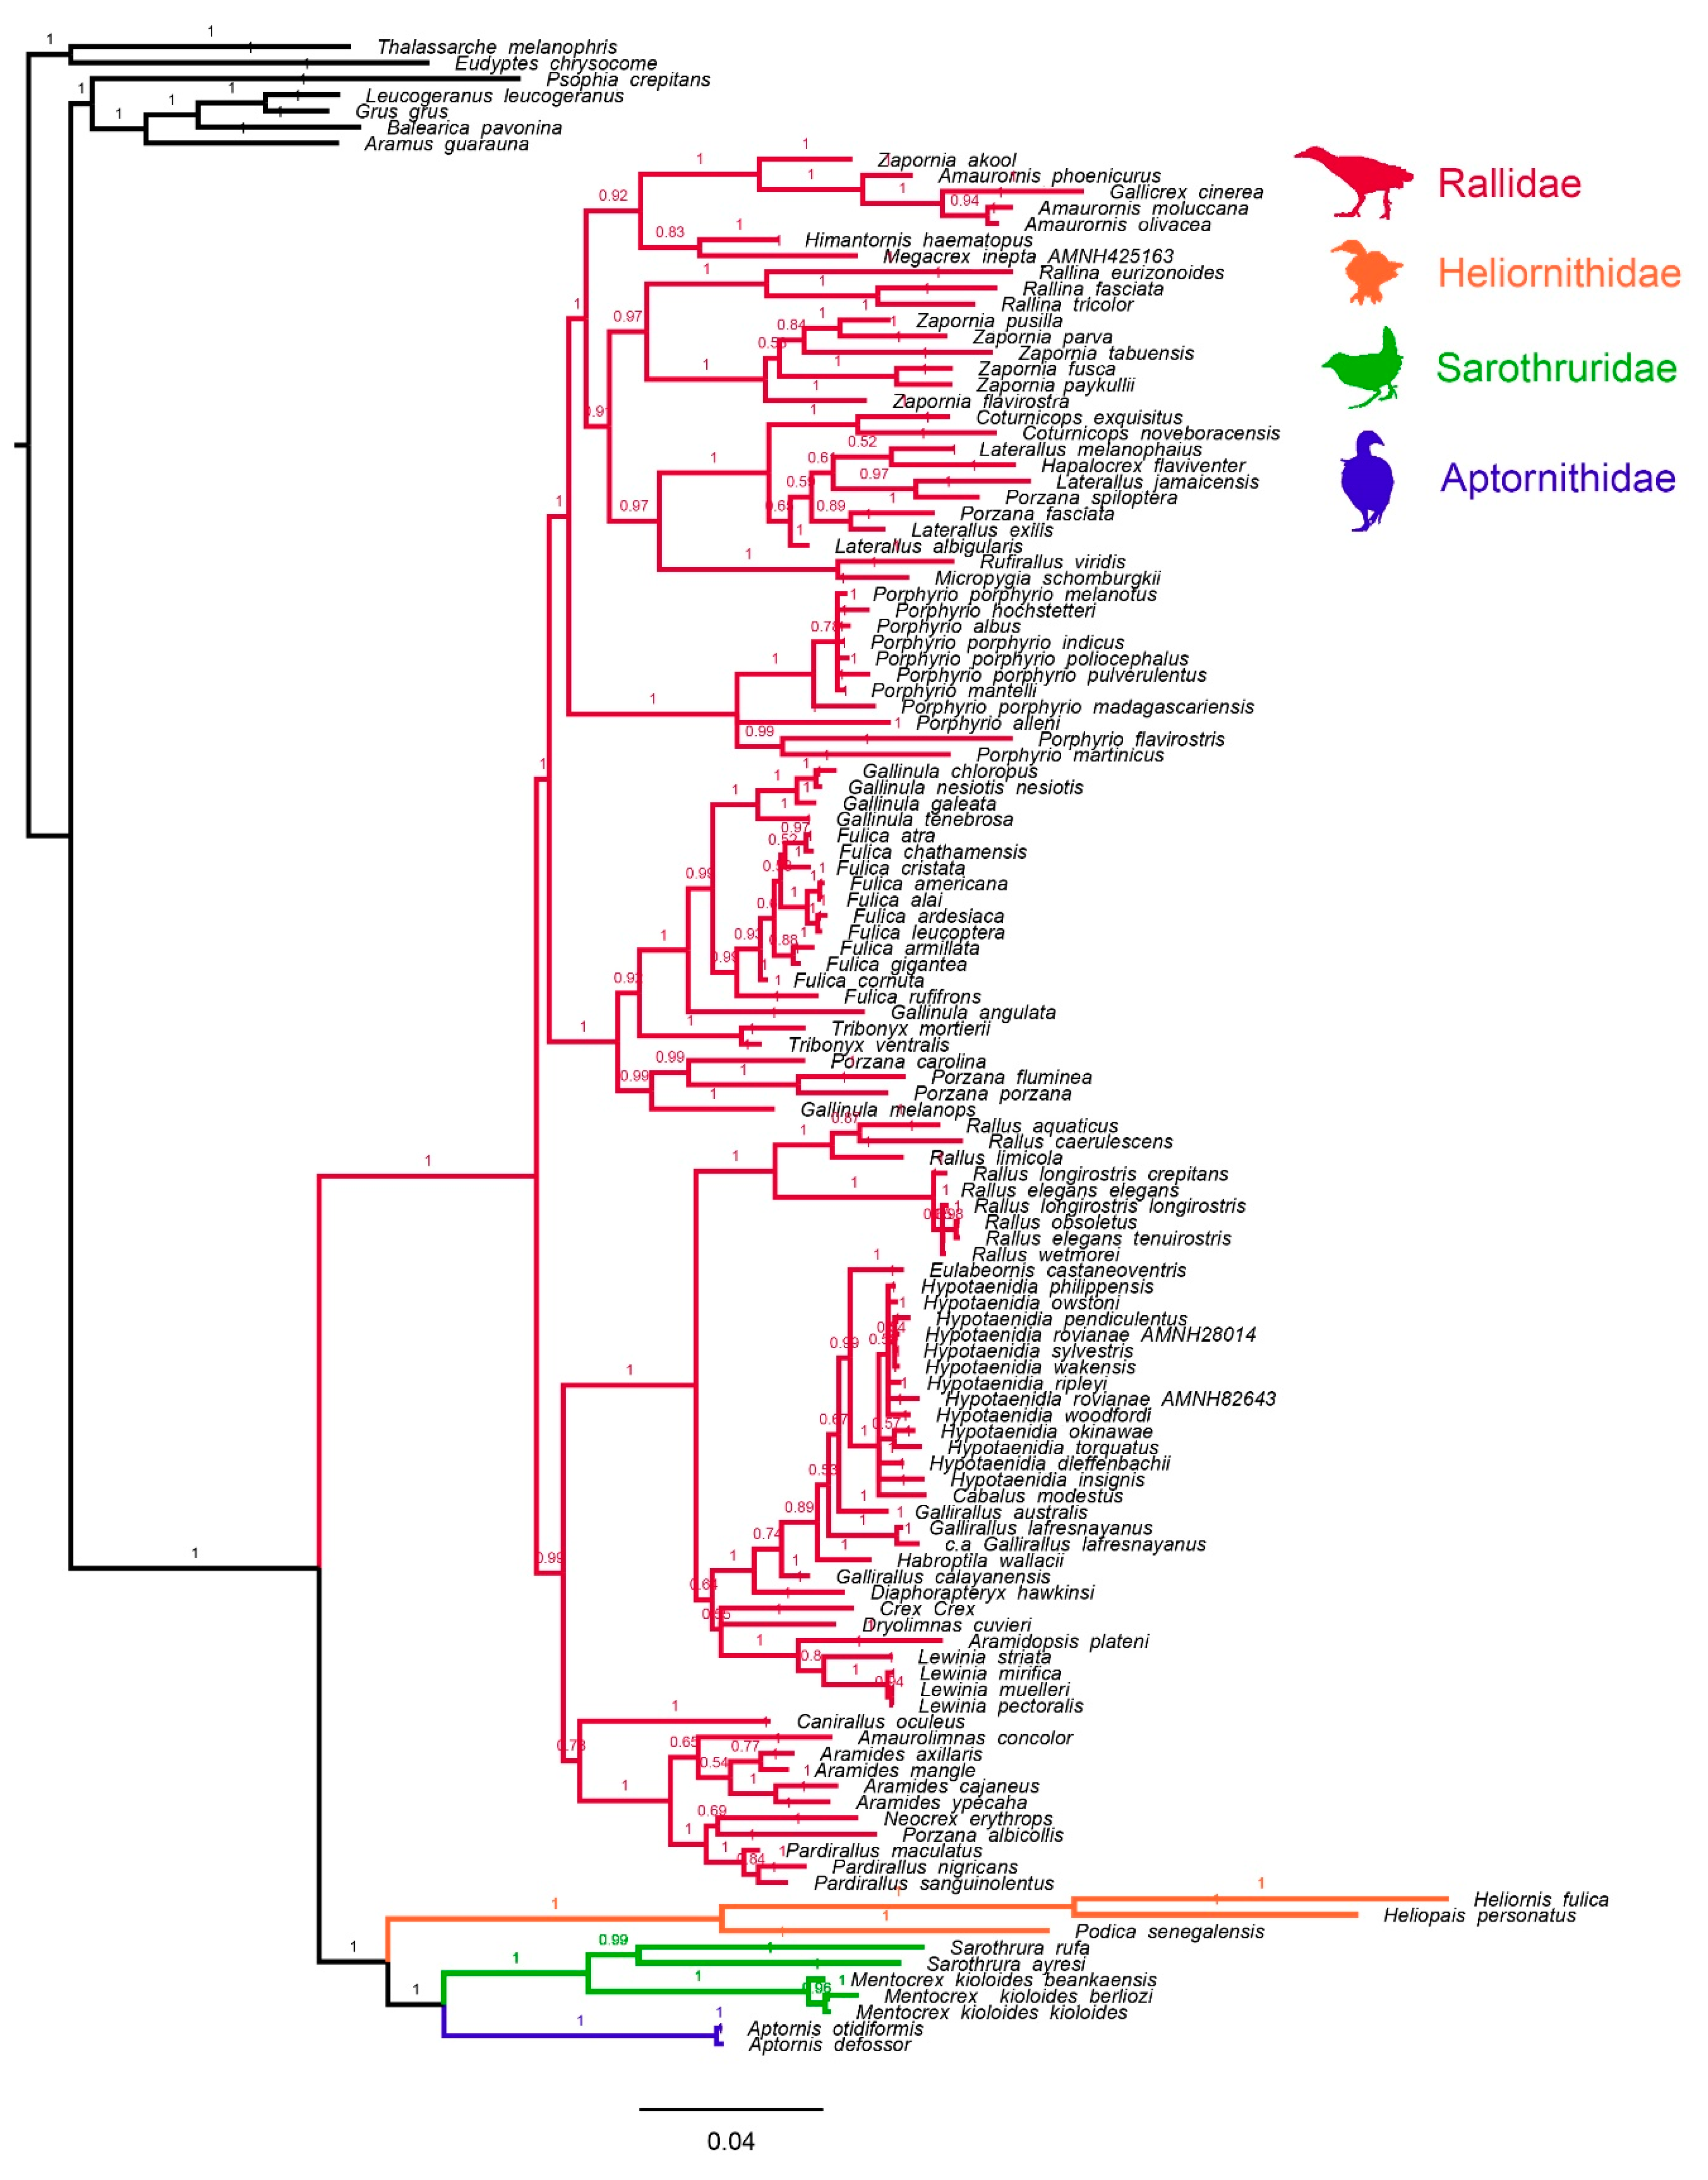
3.1. Mitochondrial Tree Topology

Our Bayesian phylogenetic analyses of alignments A and B, which included predominantly complete mitochondrial genome sequences, resulted in extremely well resolved trees (Figure 1 and Figure 2; all nodes with Bayesian posterior probability of 1.0 unless stated otherwise). We confirmed that adzebills (Aptornithidae) were crown gruiforms, and more-specifically found that Aptornis was sister-taxon to a clade comprising Mentocrex and Sarothrura. Alternative phylogenetic positions for the adzebill, including a tree in which Aptornis and the kagu (Rhynochetos jubatus) were sister-taxa, could be rejected at p < 0.01 by a Shimodaira–Hasegawa test applied to alignment A (Figure 1). Our analyses further suggested that Aptornis, Mentocrex, and Sarothrura formed a clade that was sister to Heliornithidae. For brevity, we hereafter refer to members of the Aptornis-Mentocrex-Sarothrura-Heliornithidae clade (the sister clade to Rallidae) as “heliornithoids” since Heliornis has nomenclatural priority.
Placement of Mentocrex among the heliornithoids, as previously suggested by García-R et al. [33], is incompatible with its Rallidae classification, and we therefore recommend Mentocrex be transferred to the Sarothruridae. A previous study of morphological data suggested a close relationship (even congeneric status) between Mentocrex and Canirallus [22], suggesting that Canirallus may also not be in the Rallidae. However, our new data from the African Grey-throated Rail Canirallus oculeus allow us to refute this relationship. We reveal that Canirallus is an early-diverging member of Rallidae (Figure 2 and Figure 3) and thus should remain classified as a rallid. Otherwise, the results of our phylogenetic analyses based on alignments A and B generally recapitulate previous studies [27,28,33,55,74,75]. In particular, our new mitochondrial genomes from Psophia and Aramus provided improved resolution for relationships among gruoids, which we confirmed to be monophyletic and sister-taxon to Ralloidea. Our phylogenetic analyses further confirmed that the basal gruoid family is Psophiidae (Bayesian posterior probability = 0.95), with Gruidae and Aramidae as sister-taxa, in agreement with the results of other molecular studies [27,28,74].
Phylogenetic analyses of alignment C, which included more taxa but more missing data than alignments A and B, confirmed with high support that all sequenced Rallidae (sensu Dickinson and Remsen [32], except Mentocrex) comprised a monophyletic group that was sister taxon to the heliornithoid clade. However, missing data meant that the phylogenetic position of many species was poorly resolved (Figure 3). For example, the Chestnut-headed Crake Rufirallus castaneiceps was represented only by a short and relatively conserved fragment of 12S rRNA not covered by its most likely close relatives (i.e., R. viridis or Micropygia schomburgkii), which prevented us from confidently resolving the phylogenetic position of this species within Rallidae (as a result, we omitted R. castaneiceps from our final analysis). In addition, our analyses of alignment B and C resulted in conflicting—but individually strongly supported—relationships among Porphyrio, Fulica, Gallinula, Gallicrex, Amaurornis, Zapornia, Rallina, and Coturnicops (Figure 2 and Figure 3). These conflicting results highlight the need for more complete molecular datasets in order to fully resolve the species-level phylogeny of rails.
Overall, the tree we obtained from our analyses of alignment C closely resembled the results of other phylogenetic studies [27,33,55,76,77,78,79], although we did identify some important differences. Firstly, while other phylogenetic studies suggested a sister relationship between the clades comprising Amaurolimnas-Aramides-Neocrex-Pardirallus (neotropical wood rails and allies) and Fulica-Gallinula-Porzana-Tribonyx [33,75], we found the Amaurolimnas group to be more closely related to Canirallus (Figure 3). Secondly, we failed to recapitulate two close relationships previously identified by García-R et al. [33]—between Diaphorapteryx hawkinsi (Hawkins’s Rail) and Habroptila wallacii (Drummer Rail), and Cabalus modestus (Chatham Islands Rail) and Gallirallus lafresnayanus (New Caledonian Rail)—among the well-studied Pacific rail complex (Gallirallus, Hypotaenidia, and relatives). Thirdly, the results of our analyses strongly supported G. australis (Weka) as sister-taxon to a clade comprising Eulabeornis-Hypotaenidia (Chestnut Rail, and Buff-banded Rail and allies) (Figure 2 and Figure 3), in agreement with some previous studies [55,79], but not with others [33]. Finally, we also found no support for a monophyletic relationship between G. lafresnayanus, G. calayanensis (Calayan Rail), and G. australis (the Gallirallus type-species), a result in agreement with Garcia-R et al. [33] but in conflict with Kirchman [78], and we consequently recommend that G. lafresnayanus and G. calayanensis should be reclassified. The differences between our results and those of previous studies possibly reflect the relative completeness and increased taxon sampling of our alignments (including our new Canirallus sequence) versus previous datasets.
In addition to conflicting topological results, we also observed instances where specimens sequenced in past studies may have been incorrectly identified. For example, two studies have presented mitochondrial data from the south Asian Brown Crake Zapornia akool [77,78]. Our results using Gong et al.’s [77] data supported a close relationship between Zapornia akool, Amaurornis (bush-hens and allies), and Gallicrex cinerea (Watercock), but contradicted previous results based on Ruan et al.’s [78] data, which suggested Z. akool was nested within Zapornia [33]. Morphological data strongly support the former result, and consequently the Z. akool sequences of Ruan et al. are likely to be spurious. As a result, we recommend reinstating the original classification of Z. akool as Amaurornis akool (see Dickinson et al. [80]). Similarly, sequences of Megacrex inepta from the studies of Trewick [81] and those of Kirchman [79] alternatively form incompatible sister-taxon relationships with either G. lafresnayanus (a very close relationship, 98–99% pairwise identity) or the Nkulengu Rail Himantornis haematopus (a relatively distant relationship), respectively (Figure 3). Morphometric data better support a relationship between H. haematopus and M. inepta [22], suggesting that the sequences from Trewick [81] may originate from G. lafresnayanus. Finally, we also observed that the two Hypotaenidia rovianae sequences included in our analysis were not each other’s closest relatives. However, this result may more likely reflect hybridisation, incomplete lineage sorting, or a need for taxonomic revision rather than specimen misidentification (Figure 3).

3.2. Morphological Character Evolution

Our reanalysis of Livezey and Zusi’s (2007) morphological character matrix (456 characters) revealed three unique (CI = 1.0) and 34 additional non-unique (CI < 1.0) osteological apomorphies uniting Aptornis with Gruiformes. Twelve unique and 22 additional non-unique osteological apomorphies united Aptornis with Heliornis (the only other heliornithoid in the dataset). Our reanalysis of Livezey’s [22] morphological character matrix (470 characters) revealed that Aptornithidae was differentiated from Sarothrura-Mentocrex by 36 unambiguous apomorphies. However, there were only 11 apomorphies uniting Aptornis and Sarothrura-Mentocrex, all of which were ambiguous. De Pietri and Mayr [82] found that the Miocene ralloid Paraortygometra porzanoides bears a resemblance to Sarothrura in the morphology of the humerus and tarsometatarsus and suggested a sister relationship between the Heliornithidae and Sarothruridae. We therefore suggest that the characters of the humerus and tarsometatarsus identified by De Pietri and Mayr [81] could be investigated in adzebills as potential unambiguous apomorphies of this newly recognised clade, though as adzebill humeri were vestigial the latter may be more informative.

3.3. Node Age Estimates

Node age estimates from our molecular dating analysis are summarised in Table S6. In general, our estimates were similar to or slightly younger than those found by other studies focusing on gruiform birds [27,33,55,56]. However, our mean divergence date estimates between orders and families were slightly older than those found by several recent large-scale phylogenetic studies of birds using genomic data [24,29,30]. These differences likely reflect choice of fossil calibrations, such as use of the Late Cretaceous fossil Vegavis iaai to constrain the divergences of Galloanseres [24,29] or limited use of internal gruiform calibrations [30]. Our older dates may also reflect our exclusive use of mitochondrial loci, which may produce older dates for deeper nodes than genomic data [83]. Nonetheless, our Highest Posterior Densities (HPDs) overlapped considerably with those of Claramunt and Cracraft [24], whose empirically determined priors we used to constrain the age of crown Gruiformes and the split between Procellariiformes and Sphenisciformes.
The age of the split between Aptornis and Sarothrura-Mentocrex was estimated to have occurred 39.6 Ma (25.5–53.8 Ma 95% HPD), during the Middle Eocene. The clade comprising Aptornis and Sarothrura in turn appears to have diverged from the Heliornithidae around 47.8 Ma (34.35–62.2 Ma 95% HPD), during the Middle Eocene. Compared to the heliornithoid clade, extant Rallidae appeared to have a slightly younger crown age of 40.5 Ma (28.4–53.9 Ma 95% HPD). The most recent common ancestor of all Ralloidea (Rallidae and heliornithoids) was estimated to have occurred 54.7 Ma (41.3–70 Ma 95% HPD), which means many fossil Ralloidea (such as messelornithids) [84,85,86], may be young enough to fall within crown Ralloidea. The crown age estimates for extant Gruiformes at 65.3 Ma (49.9–80.4 Ma 95% HPD) and Gruoidea at 59.1 Ma (43.6–76.9 Ma 95% HPD) occurred during the Paleocene to Early Eocene. Finally, within Gruidae we estimated that the divergence between Balearicinae and Gruinae occurred around 24.8 Ma (11.9–39.8 Ma 95% HPD), during the Late Oligocene, and the divergence between Grus and Leucogeranus was estimated at 10.6 Ma (3.3–20.1 Ma 95% HPD), during the Late Miocene.
The North Island Adzebill (A. otidiformis) and South Island Adzebill (A. defossor) were closely related (99.1% pairwise match of sequences) but appear to have diverged during the Pleistocene, around 1.1 Ma (0.2–2.3 Ma 95% HPD), supporting their recognition as separate species. In contrast, Sarothrura ayresi and S. rufa diverged at 20.2 Ma (9–32.2 Ma 95% HPD), either suggesting accelerated rates of molecular evolution or highly conserved morphology within Sarothrura, perhaps warranting taxonomic re-examination. The related Heliornithidae are confirmed as an old family, with the basal Podica splitting at 32.4 Ma (19.9–36.4 95% HPD), and Heliopais-Heliornis splitting at 17.4 Ma (7.8–27.9 95% HPD). Finally, the 3.4 Ma (0.87–6.6 Ma 95% HPD) divergence between the Tsingy Wood Rail M. kioloides beankaensis and the Madagascan Wood Rail M. k. kioloides suggests that the Tsingy Wood Rail should be elevated to full species status (i.e., M. beankaensis), as recommended by Goodman et al. [87].

4. Discussion

Our phylogenetic analyses unambiguously demonstrated that adzebills (Aptornis; Aptornithidae) are crown gruiforms (Figure 1, Figure 2 and Figure 3), and we reject the hypothesis that adzebills are close relatives of the Kagu (Rhynochetos jubatus; Eurypygiformes) [21,22,23,24]. Instead, adzebills were found to form an early branch (~39.6 Ma) within Ralloidea as sister-taxon to the Sarothruridae, which we suggest comprises both the flufftails (Sarothrura) and the Madagascan wood rails (Mentocrex). The Aptornithidae-Sarothruridae clade was suggested by our analysis to form a clade with the finfoots (Heliornithidae), comprising the sister-group of the “true” rails (Rallidae) (Figure 1, Figure 2 and Figure 3). This unexpectedly close relationship between some of the largest and smallest ralloids—adzebills and flufftails, respectively—is not the only instance of discordance between morphological and molecular based phylogenies of Ralloidea [22,33,55,75,88]. For example, Sarothrura was long considered a member of Rallidae, and Sarothrura ayresi was originally described in the Rallidae genus Coturnicops [22,88,89]. In contrast, our analyses confirm previous suggestions that the African Grey-throated Rail (Canirallus oculeus) and the Madagascan wood rails (Mentocrex kioloides sspp.) are not closely related [86,89,90], with the former in fact being a divergent member of Rallidae while the latter was closely related to Sarothrura. The presence of species with “rail-like” morphology in both Rallidae and among heliornithoids (the name we give to the Aptornithidae-Sarothruridae-Heliornithidae clade) suggests that this represents the ancestral state for ralloids, including the ancestors of adzebills.
If the ancestors of heliornithoids resembled archetypal rails, this makes the morphological evolution of adzebills and flufftails, as well as the related finfoots (which are highly-specialised for foot-propelled diving) [91], all the more remarkable. It is also notable that heliornithoids are arguably more morphologically and ecologically varied than the related Rallidae, despite a much lower species diversity [22,90]. All flufftails are diminutive, weighing only ~25–50 g [89], whereas Madagascan wood rails may weigh up to ~280 g [92], a more typical size for a rail. By comparison, the three species of finfoot range between 120–879 g [92]. In contrast, adult adzebills are estimated to have weighed 16–19 kg (depending on the species), perhaps reaching up to 25 kg [2,3]. The fossil adzebill A. proasciarostratus from the Miocene St Bathans deposits of New Zealand (16–19 Ma, the only major terrestrial Cenozoic fossil site in New Zealand outside of the Late Quaternary) was only slightly smaller than the two recent species [14]. Thus, if Madagascan wood rails are used as a proxy for the size of the ancestor of adzebills, this suggests that the mass of adzebills increased >50-fold in ~20–24 Ma (the time between their estimated common ancestor with Sarothruridae—39.6 Ma—and the age of the St Bathans Fauna). If flighted ancestors of adzebills only arrived in New Zealand following the marine inundation of New Zealand during the Oligocene (peaking during the Waitakian 22–25 Ma) [93] then the temporal window for their size increase would be even further compressed. Similarly rapid evolution appears to have resulted in the presence of flightless rails on numerous oceanic islands (especially taxa in the Gallirallus-Hypotaenidia complex, or in the genera Fulica, Gallinula, Gallirallus, and Porphyrio), many of which became quite large (e.g. the largest Quaternary Rallidae species—NZ’s extant Porphyrio hochstetteri and extinct P. mantelli—exceed or exceeded 3–4 kg) [76,81,94,95]. However, none of these rails rival the adzebills for size suggesting either that the adzebill ancestors may have exploited some unique circumstances or that insufficient time has elapsed for extant flightless taxa to reach comparable size (as many extant flightless lineages originated only during the Pliocene or Pleistocene) [76,81,94,95].
We had difficulty identifying morphological features that reliably distinguished heliornithoids from ‘true’ rails, which is perhaps unsurprising if the more derived lineages—such as the enormous adzebills and the aquatic finfoots—evolved independently from rail-like ancestors. Further, using morphological data to establish the sister taxon of adzebills is problematic due to the antiquity of their flightlessness and their unique feeding specialization, resulting in an “extreme autapomorphy” [22]. By enforcing the Aptornis-Mentocrex-Sarothrura clade in our reanalysis of Livezey’s [22] morphological dataset, we showed that no extant rails were recovered as likely “heliornithoids” (including Canirallus). However, it is plausible that other “rail” taxa may yet be revealed as heliornithoids rather than rallids. Genera currently lacking molecular data include Gymnocrex (East Indonesia and New Guinea) and Rougetius (East Africa), both of which have been considered early-diverging members of the Rallidae based on phylogenetic analyses of morphological data [22,88,90]. In addition, Rallicula from New Guinea, which also lacks molecular data, has been simultaneously considered a close relative of Sarothrura and Rallina (incompatible with molecular phylogenies that suggest Sarothrura and Rallina are only distantly related). All other unsequenced extant or recently extinct rail genera are island forms which are likely to have recent dispersal origins (e.g. Aphanapteryx, Cyanolimnas, Mundia, and Pareudiastes) [32]. Our results suggest that substantial work remains to refine the phylogeny of ralloids and that the automatic assignment of species to Rallidae based on “rail-like” morphology is questionable. The latter unfortunately means it may be impossible to correctly discern fossil rails from fossil heliornithoids, which complicates efforts to determine the early biogeography of Ralloidea and especially the geographical source of the adzebill lineage.
Our study reveals a major discordance between the phylogeny and biogeography of the adzebills and their relatives. Unless unrecognised representatives of Sarothruridae occur among extant “rails”, the closest living relatives of adzebills are exclusively Afro-Madagascan. Interestingly, this disjunct relationship echoes the sister-taxon relationship observed between the kiwi (Apterygiformes) and Madagascan elephant birds (Aepyornithiformes) [41] and also between the Madagascan Teal (Anas bernieri) and the New Zealand teals (A. aucklandica, A. chlorotis, A. nesiotis, and A. chathamica) [42]. Like these examples, the relationship between the adzebills and Sarothruridae is unlikely to result from continental vicariance, since both the age of the divergence between Aptornithidae and Sarothruridae and the divergence between their common ancestor and Heliornithidae are much too recent (25.5–53.8 and 34.35–62.2 Ma, respectively), versus the separation of Africa and Madagascar from Gondwana >100 Ma [96]. Instead, adzebills likely descended from an ancestral heliornithoid that dispersed to New Zealand overwater from another Gondwanan landmass. It is possible that this ancient dispersal occurred via Antarctica, as geological and palaeontological evidence suggest that at least some coastal regions of Antarctica (and nearby offshore islands) were unglaciated and experienced a temperate climate that supported southern beech (Nothofagaceae) forests until the end of the Eocene (reviewed by Askin and Spicer [95]) or perhaps even the Early Oligocene (see Cantrill [97]). The ancestors of kiwi and moa may also have arrived in New Zealand via Antarctica, as molecular dating results suggest they diverged from their respective nearest living relatives during the Eocene (e.g. Mitchell et al. [41]). In any case, it is likely that “heliornithoids” were formerly more widespread and have subsequently become extinct across much of their former range (with the possible exception of the finfoot lineage, which presently has a pantropical distribution). For example, the Miocene ralloid Paraortygometra porzanoides from France was suggested to have close affinities to Sarothrura [82]. It is possible that the highly derived morphology (and concomitant specialised evolutionary niche) of the adzebills may have contributed to its long persistence, preserving it from whatever environmental conditions promoted the high turnover of more “typical” ralloid lineages observed in the NZ fossil record [98].
We estimated that the North Island and South Island adzebills only diverged relatively recently (0.2–2.3 Ma, with a mean estimate of 1.1 Ma). As the geological precursors of New Zealand’s North and South Islands were separated by the Manawatu Strait between ~30 Ma and ~2 Ma [99], the age of the North and South Island adzebill lineages is incompatible with long-term endemism on both islands. Conversely, the divergence between the two recent adzebill species coincides closely with the formation of an isthmus (1.5–2 Ma) across the Manawatu Strait, which persisted until the modern Cook Strait formed around ~0.45 Ma [99,100]. Thus, it is likely that adzebills survived in the larger South Island of New Zealand—from which the fossil adzebill A. proasciarostratus has been described (16–19 Ma)—and only dispersed into the North Island after the Manawatu land-bridge formed. A similar model has been suggested for several moa species, with the Pleistocene opening and closing of land connection between the North and South Island driving the divergence (1.45 ± 0.8 Ma) between North Island Giant Moa and South Island Giant Moa (Dinornis novaezealandiae and D. robustus, respectively), and between the North Island Mantell’s Moa and South Island Heavy-footed Moa (Pachyornis geranoides and P. elephantopus, respectively). As for moa, it is possible that any adzebill lineages endemic to the North Island during the Oligocene subsequently became extinct during the marine transgression (peaking around 23 Ma) that heavily reduced the land area of what would eventually become the North Island [99]. South Island adzebills were slightly larger on average than North Island adzebills, a pattern common in other New Zealand birds with North/South Island sister-species (such as geese in Cnemiornis or moa in Pachyornis) and is consistent with Bergmann’s rule [22]. Otherwise, both species were physically near-identical. It is therefore likely that adzebills occupied the same niche in the North Island as they did in the South Island, and apart from a slight change in mass, little to no macroevolution occurred since the species diverged.
In conclusion, our molecular data revealed adzebills to be crown ralloids, contrary to a long-standing hypothesis that they were close relatives of the New Caledonian kagu. The resolution of this centuries-old taxonomic issue implies that adzebills were not of Gondwanan vicariant origin, but instead descended from a rail-like bird that arrived in New Zealand by long-distance overwater dispersal during the latest Eocene. Consequently, the ancestors of the adzebill almost certainly became flightless after their arrival in New Zealand. Our new results—confidently placing the giant adzebills within ralloids—further reinforce Ralloidea as an ideal clade for studying the genomic drivers and consequences of flightlessness. The independent loss of flight in adzebills over 16 million years ago stands in stark contrast to the more recent (Pliocene/Pleistocene) losses of flight in extant island rail species.

Data Availability

Mitochondrial genome consensus sequences are available on GenBank (MK434259-MK434265). Unmapped sequencing reads and phylogenetic analysis files associated with this study are available on figshare (DOI: https://doi.org/10.25909/5c5293c2ef984).

Supplementary Materials

The following are available online at https://www.mdpi.com/1424-2818/11/2/24/s1, Figure S1: MapDamage report for the final round of mapping reads from DM8046 against the DM8046 majority-rule consensus. The top panels show the characteristic high frequency of purines (A and G) immediately before the reads. The two lower panels show the accumulation of 5’ C-to-T (red) and 3’ G-to-A (blue) misincorporations characteristic of ancient DNA; Figure S2: MapDamage report for the final round of mapping reads from S23033 against the DM8046 majority-rule consensus. The top panels show the characteristic high frequency of purines (A and G) immediately before the reads. The two lower panels show the accumulation of 5’ C-to-T (red) and 3’ G-to-A (blue) misincorporations characteristic of ancient DNA. Figure S3: MapDamage report for the final round of mapping reads from CM AV18536 against the DM8046 majority-rule consensus. The top panels show the characteristic high frequency of purines (A and G) immediately before the reads. The two lower panels show the accumulation of 5’ C-to-T (red) and 3’ G-to-A (blue) misincorporations characteristic of ancient DNA; Figure S4: Saturation plots of the primary alignment (predominantly complete mitochondrial genomes) generated using DAMBE. Blue points represent transitions (s), green points represent transversions (v).; Table S1: Details of new mitochondrial genome sequences; Table S2: Mitochondrial genome sequences used for bait design for enrichment of the CM AV18536 eggshell library; Table S3: List of all sequences used in this study with GenBank accession numbers; Table S4: Saturation test statistics as generated in the test by Xia et al. (complete mitochondrion genome sequences only); Table S5: Partitioning schemes used for all phylogenetic and molecular clock analyses; Table S6: Age estimates for key nodes from our BEAST analyses.

Author Contributions

A.C., M.B., and P.H. conceived of the project; A.J.D.T., T.H.W., A.C., and R.P.S. identified and procured samples for study; A.P.B., B.C., M.B.H., and K.J.M. performed the laboratory work; A.P.B., B.C., and K.J.M. processed the genetic data and performed the molecular phylogenetic analyses; R.P.S. and P.H. performed the morphological phylogenetic analyses; all authors advised on the interpretation of results and contributed to the writing of the manuscript.

Funding

This research was funded by the Australian Research Council (ARC) grants FL140100260 (awarded to A.C.) and FT0991741 (awarded to M.B.).

Acknowledgments

We would like to thank the Smithsonian Institution (Helen James and Brian Schmidt), Canterbury Museum, and National Museum of New Zealand Te Papa Tongarewa for access to specimens. In addition, we are grateful to Bastien Llamas for help with troubleshooting bioinformatics issues and to Nicole White and Alicia Grealy for support with the laboratory work. Computer infrastructure for phylogenetic analyses was provided by the Cyberinfrastructure for Phylogenetic Research (CIPRES) project via the CIPRES Science Gateway.

Conflicts of Interest

The authors declare no conflict of interest.

References

  1. Schellart, W.P.; Lister, G.S.; Toy, V.G. A Late Cretaceous and Cenozoic reconstruction of the Southwest Pacific region: Tectonics controlled by subduction and slab rollback processes. Earth-Sci. Rev. 2006, 76, 191–233. [Google Scholar] [CrossRef]
  2. Worthy, T.H.; Holdaway, R.N. The Lost World of the MOA: Prehistoric Life of New Zealand; Indiana University Press: Bloomington, IN, USA, 2002; ISBN 0-253-34034-9. [Google Scholar]
  3. Tennyson, A.J.D.; Martinson, P. Extinct Birds of New Zealand; Te Papa Press: Wellington, New Zealand, 2006; ISBN 0-909010-21-8.
  4. Ericson, P.G.; Christidis, L.; Cooper, A.; Irestedt, M.; Jackson, J.; Johansson, U.S.; Norman, J.A. A Gondwanan origin of passerine birds supported by DNA sequences of the endemic New Zealand wrens. Proc. R. Soc. Lond. B Biol. Sci. 2002, 269, 235–241. [Google Scholar] [CrossRef] [PubMed] [Green Version]
  5. Wright, T.F.; Schirtzinger, E.E.; Matsumoto, T.; Eberhard, J.R.; Graves, G.R.; Sanchez, J.J.; Capelli, S.; Müller, H.; Scharpegge, J.; Chambers, G.K. A multilocus molecular phylogeny of the parrots (Psittaciformes): Support for a Gondwanan origin during the Cretaceous. Mol. Biol. Evol. 2008, 25, 2141–2156. [Google Scholar] [CrossRef] [PubMed]
  6. Bunce, M.; Szulkin, M.; Lerner, H.R.; Barnes, I.; Shapiro, B.; Cooper, A.; Holdaway, R.N. Ancient DNA provides new insights into the evolutionary history of New Zealand’s extinct giant eagle. PLoS Biol. 2005, 3, e9. [Google Scholar] [CrossRef] [PubMed]
  7. Holdaway, R.N.; Worthy, T.H.; Tennyson, A.J. A working list of breeding bird species of the New Zealand region at first human contact. N. Z. J. Zool. 2001, 28, 119–187. [Google Scholar] [CrossRef] [Green Version]
  8. Wilmshurst, J.M.; Anderson, A.J.; Higham, T.F.G.; Worthy, T.H. Dating the late prehistoric dispersal of Polynesians to New Zealand using the commensal Pacific rat. Proc. Natl. Acad. Sci. USA 2008, 105, 7676–7680. [Google Scholar] [CrossRef] [PubMed] [Green Version]
  9. Cole, T.L.; Wood, J.R. The ancient DNA revolution: The latest era in unearthing New Zealand’s faunal history. N. Z. J. Zool. 2018, 45, 91–120. [Google Scholar] [CrossRef]
  10. Owen, R. On Dinornis, an Extinct Genus of Tridactyle Struthious Birds, with Descriptions of Portions of the Skeleton of Five Species which Formerly Existed in New Zealand (Part I). Trans. Zool. Soc. Lond. 1844, 3, 235–275, pls 18–30. [Google Scholar]
  11. Owen, R. On Dinornis (part III): Containing a description of the skull and beak of that genus, and of the same characteristic parts of Palapteryx, and of two other genera of birds, Notornis and Nestor; forming part of an extensive series of ornithic remains discovered by Mr Walter Mantell at Waingongoro, North Island of New Zealand. Trans. Zool. Soc. Lond. 1848, 3, 345–378. [Google Scholar]
  12. Owen, R. On Dinornis (part XV): Containing a description of the skull, femur, tibia, fibula, and metatarsus of Aptornis defossor, Owen, from near Oamaru, Middle Island, New Zealand; with additional observations on Aptornis otidiformis, on Notornis mantelli, and on Dinornis curtus. Trans. Zool. Soc. Lond. 1871, 7, 353–380. [Google Scholar]
  13. Mantell, G.A. On the fossil remains of birds collected in various parts of New Zealand by Mr. Walter Mantell, of Wellington. Q. J. Geol. Soc. 1848, 4, 225–238. [Google Scholar] [CrossRef]
  14. Worthy, T.H.; Tennyson, A.J.; Scofield, R.P. Fossils reveal an early Miocene presence of the aberrant gruiform Aves: Aptornithidae in New Zealand. J. Ornithol. 2011, 152, 669–680. [Google Scholar] [CrossRef]
  15. Wood, J.R.; Scofield, R.P.; Hamel, J.; Lalas, C.; Wilmshurst, J.M. Bone stable isotopes indicate a high trophic position for New Zealand’s extinct South Island adzebill (Aptornis defossor)(Gruiformes: Aptornithidae). N. Z. J. Ecol. 2017, 41, 240–244. [Google Scholar] [CrossRef]
  16. Trotter, M.M. Archaeological investigations in the Aviemore area, South Island. Rec. Canterb. Mus. 1970, 8, 439–453. [Google Scholar]
  17. Scofield, P.; Worthy, T.; Schlumpf, H. What birds were New Zealand’s first people eating? Wairau Bar’s avian remains re-examined. Rec. Canterb. Mus. 2003, 17, 17–35. [Google Scholar]
  18. Seersholm, F.V.; Cole, T.L.; Grealy, A.; Rawlence, N.J.; Greig, K.; Knapp, M.; Stat, M.; Hansen, A.J.; Easton, L.J.; Shepherd, L. Subsistence practices, past biodiversity, and anthropogenic impacts revealed by New Zealand-wide ancient DNA survey. Proc. Natl. Acad. Sci. USA 2018, 115, 7771–7776. [Google Scholar] [CrossRef] [PubMed]
  19. McWethy, D.B.; Whitlock, C.; Wilmshurst, J.M.; McGlone, M.S.; Fromont, M.; Li, X.; Dieffenbacher-Krall, A.; Hobbs, W.O.; Fritz, S.C.; Cook, E.R. Rapid landscape transformation in South Island, New Zealand, following initial Polynesian settlement. Proc. Natl. Acad. Sci. USA 2010, 107, 21343–21348. [Google Scholar] [CrossRef] [Green Version]
  20. Perry, G.L.W.; Wheeler, A.B.; Wood, J.R.; Wilmshurst, J.M. A high-precision chronology for the rapid extinction of New Zealand moa (Aves, Dinornithiformes). Quat. Sci. Rev. 2014, 105, 126–135. [Google Scholar] [CrossRef]
  21. Cracraft, J. Phylogenetic relationships and transantarctic biogeography of some gruiform birds. Geobios 1982, 15, 393–402. [Google Scholar] [CrossRef]
  22. Livezey, B.C. A phylogenetic analysis of the Gruiformes (Aves) based on morphological characters, with an emphasis on the rails (Rallidae). Philos. Trans. R. Soc. Lond. B Biol. Sci. 1998, 353, 2077–2151. [Google Scholar] [CrossRef] [Green Version]
  23. Livezey, B.C.; Zusi, R.L. Higher-order phylogeny of modern birds (Theropoda, Aves: Neornithes) based on comparative anatomy. II. Analysis and discussion. Zool. J. Linn. Soc. 2007, 149, 1–95. [Google Scholar] [CrossRef] [PubMed]
  24. Claramunt, S.; Cracraft, J. A new time tree reveals Earth history’s imprint on the evolution of modern birds. Sci. Adv. 2015, 1, e1501005. [Google Scholar] [CrossRef] [Green Version]
  25. Campbell, H.; Hutching, G. In Search of Ancient New Zealand; Penguin Books NZ: Auckland, New Zealand, 2007. [Google Scholar]
  26. Mortimer, N.; Campbell, H.J.; Tulloch, A.J.; King, P.R.; Stagpoole, V.M.; Wood, R.A.; Rattenbury, M.S.; Sutherland, R.; Adams, C.J.; Collot, J. Zealandia: Earth’s hidden continent. GSA Today 2017, 27, 27–35. [Google Scholar] [CrossRef]
  27. Fain, M.G.; Krajewski, C.; Houde, P. Phylogeny of “core Gruiformes” (Aves: Grues) and resolution of the Limpkin–Sungrebe problem. Mol. Phylogenet. Evol. 2007, 43, 515–529. [Google Scholar] [CrossRef] [PubMed]
  28. Hackett, S.J.; Kimball, R.T.; Reddy, S.; Bowie, R.C.; Braun, E.L.; Braun, M.J.; Chojnowski, J.L.; Cox, W.A.; Han, K.-L.; Harshman, J. A phylogenomic study of birds reveals their evolutionary history. Science 2008, 320, 1763–1768. [Google Scholar] [CrossRef] [PubMed]
  29. Jarvis, E.D.; Mirarab, S.; Aberer, A.J.; Li, B.; Houde, P.; Li, C.; Ho, S.Y.; Faircloth, B.C.; Nabholz, B.; Howard, J.T. Whole-genome analyses resolve early branches in the tree of life of modern birds. Science 2014, 346, 1320–1331. [Google Scholar] [CrossRef] [PubMed] [Green Version]
  30. Prum, R.O.; Berv, J.S.; Dornburg, A.; Field, D.J.; Townsend, J.P.; Lemmon, E.M.; Lemmon, A.R. A comprehensive phylogeny of birds (Aves) using targeted next-generation DNA sequencing. Nature 2015, 526, 569–573. [Google Scholar] [CrossRef]
  31. Houde, P.; Cooper, A.; Leslie, E.; Strand, A.; Montano, G. Phylogeny and evolution of 12S rDNA in Gruiformes (Aves). Avian Mol. Evol. Syst. 1997, 121–158. [Google Scholar]
  32. Dickinson, E.C.; Remsen, J.V.J. The Howard and Moore Complete Checklist of the Birds of the World, 4th ed.; Volume 1 Non-Passerines; Aves Press: Eastbourne, UK, 2013. [Google Scholar]
  33. García-R, J.C.; Gibb, G.C.; Trewick, S.A. Deep global evolutionary radiation in birds: Diversification and trait evolution in the cosmopolitan bird family Rallidae. Mol. Phylogenet. Evol. 2014, 81, 96–108. [Google Scholar] [CrossRef]
  34. Worthy, T.H. Fossil Distribution of Brown Teal (Anas chlorotis) in New Zealand; DoC Science Internal Series 81; Department of Conservation: Wellington, UK, 2002; ISBN 0-478-22315-3.
  35. Worthy, T.; Holdaway, R.N. Quaternary fossil faunas from caves in Takaka Valley and on Takaka Hill, northwest Nelson, South Island, New Zealand. J. R. Soc. N. Z. 1994, 24, 297–391. [Google Scholar] [CrossRef] [Green Version]
  36. Worthy, T.H. Fossils of Honeycomb Hill; Museum of New Zealand: Wellington, New Zealand, 1993; ISBN 0-908953-04-6.
  37. Holdaway, R.N.; Roberts, R.G.; Beavan-Athfield, N.R.; Olley, J.M.; Worthy, T.H. Optical dating of quartz sediments and accelerator mass spectrometry 14C dating of bone gelatin and moa eggshell: A comparison of age estimates for non-archaeological deposits in New Zealand. J. R. Soc. N. Z. 2002, 32, 463–505. [Google Scholar] [CrossRef]
  38. Brotherton, P.; Haak, W.; Templeton, J.; Brandt, G.; Soubrier, J.; Adler, C.J.; Richards, S.M.; Der Sarkissian, C.; Ganslmeier, R.; Friederich, S. Neolithic mitochondrial haplogroup H genomes and the genetic origins of Europeans. Nat. Commun. 2013, 4, 1764. [Google Scholar] [CrossRef] [PubMed] [Green Version]
  39. Miller, S.; Dykes, D.; Polesky, H. A simple salting out procedure for extracting DNA from human nucleated cells. Nucleic Acids Res. 1988, 16, 1215. [Google Scholar] [CrossRef] [PubMed]
  40. Oskam, C.L.; Haile, J.; McLay, E.; Rigby, P.; Allentoft, M.E.; Olsen, M.E.; Bengtsson, C.; Miller, G.H.; Schwenninger, J.-L.; Jacomb, C. Fossil avian eggshell preserves ancient DNA. Proc. R. Soc. B Biol. Sci. 2010, rspb20092019. [Google Scholar] [CrossRef] [PubMed]
  41. Mitchell, K.J.; Llamas, B.; Soubrier, J.; Rawlence, N.J.; Worthy, T.H.; Wood, J.; Lee, M.S.; Cooper, A. Ancient DNA reveals elephant birds and kiwi are sister taxa and clarifies ratite bird evolution. Science 2014, 344, 898–900. [Google Scholar] [CrossRef] [PubMed] [Green Version]
  42. Mitchell, K.J.; Wood, J.R.; Scofield, R.P.; Llamas, B.; Cooper, A. Ancient mitochondrial genome reveals unsuspected taxonomic affinity of the extinct Chatham duck (Pachyanas chathamica) and resolves divergence times for New Zealand and sub-Antarctic brown teals. Mol. Phylogenet. Evol. 2014, 70, 420–428. [Google Scholar] [CrossRef] [PubMed]
  43. Wood, J.R.; Mitchell, K.J.; Scofield, R.P.; Tennyson, A.; Fidler, A.E.; Wilmshurst, J.M.; Llamas, B.; Cooper, A. An extinct nestorid parrot (Aves, Psittaciformes, Nestoridae) from the Chatham Islands, New Zealand. Zool. J. Linn. Soc. 2014, 172, 185–199. [Google Scholar] [CrossRef]
  44. Mitchell, K.J.; Wood, J.R.; Llamas, B.; McLenachan, P.A.; Kardailsky, O.; Scofield, R.P.; Worthy, T.H.; Cooper, A. Ancient mitochondrial genomes clarify the evolutionary history of New Zealand’s enigmatic acanthisittid wrens. Mol. Phylogenet. Evol. 2016, 102, 295–304. [Google Scholar] [CrossRef] [PubMed]
  45. Meyer, M.; Kircher, M. Illumina sequencing library preparation for highly multiplexed target capture and sequencing. Cold Spring Harb. Protoc. 2010, 2010, pdb.prot5448. [Google Scholar] [CrossRef] [PubMed]
  46. Cooper, A. DNA from museum specimens. In Ancient DNA; Springer: New York, NY, USA, 1994; pp. 149–165. [Google Scholar]
  47. Schubert, M.; Lindgreen, S.; Orlando, L. AdapterRemoval v2: rapid adapter trimming, identification, and read merging. BMC Res. Notes 2016, 9, 88. [Google Scholar] [CrossRef] [PubMed]
  48. Kearse, M.; Sturrock, S.; Meintjes, P. The Geneious 6.0. 3 Read Mapper; Biomatters Ltd.: Auckland, New Zealand, 2012. [Google Scholar]
  49. Kearse, M.; Moir, R.; Wilson, A.; Stones-Havas, S.; Cheung, M.; Sturrock, S.; Buxton, S.; Cooper, A.; Markowitz, S.; Duran, C. Geneious Basic: An integrated and extendable desktop software platform for the organization and analysis of sequence data. Bioinformatics 2012, 28, 1647–1649. [Google Scholar] [CrossRef] [PubMed] [Green Version]
  50. Li, H.; Durbin, R. Fast and accurate short read alignment with Burrows–Wheeler transform. Bioinformatics 2009, 25, 1754–1760. [Google Scholar] [CrossRef] [PubMed]
  51. Kircher, M. Analysis of high-throughput ancient DNA sequencing data. In Ancient DNA; Springer: New York, NY, USA, 2012; pp. 197–228. [Google Scholar]
  52. Jónsson, H.; Ginolhac, A.; Schubert, M.; Johnson, P.L.; Orlando, L. mapDamage2.0: Fast approximate Bayesian estimates of ancient DNA damage parameters. Bioinformatics 2013, 29, 1682–1684. [Google Scholar] [CrossRef] [PubMed]
  53. Katoh, K.; Standley, D.M. MAFFT multiple sequence alignment software version 7: Improvements in performance and usability. Mol. Biol. Evol. 2013, 30, 772–780. [Google Scholar] [CrossRef] [PubMed]
  54. Katoh, K.; Misawa, K.; Kuma, K.; Miyata, T. MAFFT: A novel method for rapid multiple sequence alignment based on fast Fourier transform. Nucleic Acids Res. 2002, 30, 3059–3066. [Google Scholar] [CrossRef] [PubMed]
  55. Abbott, C.L.; Double, M.C.; Trueman, J.W.; Robinson, A.; Cockburn, A. An unusual source of apparent mitochondrial heteroplasmy: Duplicate mitochondrial control regions in Thalassarche albatrosses. Mol. Ecol. 2005, 14, 3605–3613. [Google Scholar] [CrossRef] [PubMed]
  56. García-R, J.C.; Gibb, G.C.; Trewick, S.A. Eocene diversification of crown group rails (Aves: Gruiformes: Rallidae). PLoS ONE 2014, 9, e109635. [Google Scholar] [CrossRef] [PubMed]
  57. Krajewski, C.; Sipiorski, J.T.; Anderson, F.E. Complete mitochondrial genome sequences and the phylogeny of cranes (Gruiformes: Gruidae). The Auk 2010, 127, 440–452. [Google Scholar] [CrossRef]
  58. Xia, X. DAMBE6: New tools for microbial genomics, phylogenetics, and molecular evolution. J. Hered. 2017, 108, 431–437. [Google Scholar] [CrossRef] [PubMed]
  59. Xia, X.; Xie, Z. DAMBE: Software package for data analysis in molecular biology and evolution. J. Hered. 2001, 92, 371–373. [Google Scholar] [CrossRef] [PubMed]
  60. Xia, X.; Xie, Z.; Salemi, M.; Chen, L.; Wang, Y. An index of substitution saturation and its application. Mol. Phylogenet. Evol. 2003, 26, 1–7. [Google Scholar] [CrossRef]
  61. Lanfear, R.; Calcott, B.; Ho, S.Y.; Guindon, S. PartitionFinder: Combined selection of partitioning schemes and substitution models for phylogenetic analyses. Mol. Biol. Evol. 2012, 29, 1695–1701. [Google Scholar] [CrossRef] [PubMed]
  62. Lanfear, R.; Frandsen, P.B.; Wright, A.M.; Senfeld, T.; Calcott, B. PartitionFinder 2: New methods for selecting partitioned models of evolution for molecular and morphological phylogenetic analyses. Mol. Biol. Evol. 2016, 34, 772–773. [Google Scholar] [CrossRef] [PubMed]
  63. Huelsenbeck, J.P.; Ronquist, F. MRBAYES: Bayesian inference of phylogenetic trees. Bioinformatics 2001, 17, 754–755. [Google Scholar] [CrossRef] [PubMed] [Green Version]
  64. Ronquist, F.; Huelsenbeck, J.P. MrBayes 3: Bayesian phylogenetic inference under mixed models. Bioinformatics 2003, 19, 1572–1574. [Google Scholar] [CrossRef] [PubMed] [Green Version]
  65. Stamatakis, A. RAxML version 8: A tool for phylogenetic analysis and post-analysis of large phylogenies. Bioinformatics 2014, 30, 1312–1313. [Google Scholar] [CrossRef]
  66. Shimodaira, H. An application of multiple comparison techniques to model selection. Ann. Inst. Stat. Math. 1998, 50, 1–13. [Google Scholar] [CrossRef]
  67. Shimodaira, H.; Hasegawa, M. Multiple comparisons of log-likelihoods with applications to phylogenetic inference. Mol. Biol. Evol. 1999, 16, 1114. [Google Scholar] [CrossRef]
  68. Swofford, D.L. PAUP*: Phylogenetic Analysis Using Parsimony (and Other Methods), Version 4; Sinauer Associates: Sunderland, MA, USA, 2001.
  69. Drummond, A.J.; Rambaut, A. BEAST: Bayesian evolutionary analysis by sampling trees. BMC Evol. Biol. 2007, 7, 214. [Google Scholar] [CrossRef] [PubMed]
  70. Slack, K.E.; Jones, C.M.; Ando, T.; Harrison, G.A.; Fordyce, R.E.; Arnason, U.; Penny, D. Early penguin fossils, plus mitochondrial genomes, calibrate avian evolution. Mol. Biol. Evol. 2006, 23, 1144–1155. [Google Scholar] [CrossRef] [PubMed]
  71. Weidig, I. New birds from the lower Eocene Green River Formation, North America. Rec. Aust. Mus. 2010, 62, 29–44. [Google Scholar] [CrossRef]
  72. Feduccia, A.; Voorhies, M.R. Crowned cranes (Gruidae: Balearica) in the Miocene of Nebraska. Nat. Hist. Mus. Los Angel. Cty. Sci. Ser. 1992, 36, 239–248. [Google Scholar]
  73. Göhlich, U.B. A new crane (Aves: Gruidae) from the Miocene of Germany. J. Vertebr. Paleontol. 2003, 23, 387–393. [Google Scholar] [CrossRef] [Green Version]
  74. Reddy, S.; Kimball, R.T.; Pandey, A.; Hosner, P.A.; Braun, M.J.; Hackett, S.J.; Han, K.-L.; Harshman, J.; Huddleston, C.J.; Kingston, S.; et al. Why Do Phylogenomic Data Sets Yield Conflicting Trees? Data Type Influences the Avian Tree of Life more than Taxon Sampling. Syst. Biol. 2017, 66, 857–879. [Google Scholar] [CrossRef] [PubMed]
  75. Stervander, M.; Ryan, P.G.; Melo, M.; Hansson, B. The origin of the world’s smallest flightless bird, the Inaccessible Island Rail Atlantisia rogersi (Aves: Rallidae). Mol. Phylogenet. Evol. 2018, 130, 92–98. [Google Scholar] [CrossRef] [PubMed]
  76. Slikas, B.; Olson, S.L.; Fleischer, R.C. Rapid, independent evolution of flightlessness in four species of Pacific Island rails (Rallidae): An analysis based on mitochondrial sequence data. J. Avian Biol. 2002, 33, 5–14. [Google Scholar] [CrossRef]
  77. Gong, J.; Zhao, R.; Huang, Q.; Sun, X.; Huang, L.; Jing, M. Two mitogenomes in Gruiformes (Amaurornis akool/A. phoenicurus) and the phylogenetic placement of Rallidae. Genes Genomics 2017, 39, 987–995. [Google Scholar] [CrossRef]
  78. Ruan, L.; Wang, Y.; Hu, J.; Ouyang, Y. Polyphyletic origin of the genus Amaurornis inferred from molecular phylogenetic analysis of rails. Biochem. Genet. 2012, 50, 959–966. [Google Scholar] [CrossRef]
  79. Kirchman, J.J. Speciation of flightless rails on islands: A DNA-based phylogeny of the typical rails of the Pacific—Especiación de Rálidos no Voladores en Islas: Filogenia Basada en ADN de las Formas Típicas del Pacífico. Auk 2012, 129, 56–69. [Google Scholar] [CrossRef]
  80. Dickinson, E.C.; Bahr, N.; Dowsett, R.; Pearson, D.; Remsen, V.; Roselaar, C.S.; Schodde, D. The Howard and Moore Complete Checklist of Birds of the World, 3rd ed.; A & C Black: London, UK, 2004. [Google Scholar]
  81. Trewick, S. Flightlessness and phylogeny amongst endemic rails (Aves: Rallidae) of the New Zealand region. Philos. Trans. R. Soc. B Biol. Sci. 1997, 352, 429–446. [Google Scholar] [CrossRef] [Green Version]
  82. De Pietri, V.L.; Mayr, G. Reappraisal of early Miocene rails (Aves, Rallidae) from central France: Diversity and character evolution. J. Zool. Syst. Evol. Res. 2014, 52, 312–322. [Google Scholar] [CrossRef]
  83. Ksepka, D.T.; Ware, J.L.; Lamm, K.S. Flying rocks and flying clocks: Disparity in fossil and molecular dates for birds. Philos. Trans. R. Soc. B Biol. Sci. 2014, 281, 2014067. [Google Scholar] [CrossRef] [PubMed]
  84. Mayr, G. Phylogenetic relationships of the early Tertiary Messel rails (Aves, Messelornithidae). Senckenberg. Lethaea 2004, 84, 317–322. [Google Scholar] [CrossRef]
  85. Bertelli, S.; Chiappe, L.M.; Mayr, G. A new Messel rail from the Early Eocene Fur Formation of Denmark (Aves, Messelornithidae). J. Syst. Palaeontol. 2011, 9, 551–562. [Google Scholar] [CrossRef]
  86. Mayr, G. Paleogene Fossil Birds; Springer: Frankfurt, Germany, 2009; ISBN 3-540-89628-7. [Google Scholar]
  87. Goodman, S.M.; Raherilalao, M.J.; Block, N.L. Patterns of morphological and genetic variation in the Mentocrex kioloides complex (Aves: Gruiformes: Rallidae) from Madagascar, with the description of a new species. Zootaxa 2011, 2776, 49–60. [Google Scholar] [CrossRef]
  88. Stang, A.T.; McRae, S.B. Why some rails have white tails: The evolution of white undertail plumage and anti-predator signaling. Evol. Ecol. 2009, 23, 943–961. [Google Scholar] [CrossRef]
  89. Keith, S.; Benson, C.W.; Irwin, M.P.S. The Genus Sarothrura (Aves, Rallidae). Bulletin of the AMNH; v. 143, Article 1; American Museum of Natural History: New York, NY, USA, 1970. [Google Scholar]
  90. Olson, S.L. Classification of Rallidae. Wilson Bull. 1973, 85, 381–416. [Google Scholar]
  91. Safford, R.; Hawkins, F. The Birds of Africa: Volume VIII: The Malagasy Region: Madagascar, Seychelles, Comoros, Mascarenes; A & C Black: London, UK, 2013; Volume 8, ISBN 0-7136-6532-7. [Google Scholar]
  92. Taylor, B. Rails: A Guide to Rails, Crakes, Gallinules and Coots of the World; Christopher Helm Publishers: London, UK, 2010; ISBN 1-4081-3538-8. [Google Scholar]
  93. Landis, C.; Campbell, H.; Begg, J.; Mildenhall, D.; Paterson, A.M.; Trewick, S. The Waipounamu Erosion Surface: Questioning the antiquity of the New Zealand land surface and terrestrial fauna and flora. Geol. Mag. 2008, 145, 173–197. [Google Scholar] [CrossRef]
  94. Trewick, S.A. Sympatric flightless rails Gallirallus dieffenbachii and G. modestus on the Chatham Islands, New Zealand; morphometrics and alternative evolutionary scenarios. J. R. Soc. N. Z. 1997, 27, 451–464. [Google Scholar] [CrossRef]
  95. Trewick, S. Morphology and evolution of two takahe: Flightless rails of New Zealand. J. Zool. 1996, 238, 221–237. [Google Scholar] [CrossRef]
  96. Askin, R.A.; Spicer, R.A. The Late Cretaceous and Cenozoic history of vegetation and climate at northern and southern high latitudes: A comparison. In Effects of Past Global Change on Life; The National Academies Press: Washington, DC, USA, 1995; pp. 156–173. [Google Scholar]
  97. Cantrill, D. Early Oligocene Nothofagus from CRP-3, Antarctica: Implications for the vegetation history. Terra Antart. 2001, 8, 401–406. [Google Scholar]
  98. Mather, E.K.; Tennyson, A.J.; Scofield, R.P.; De Pietri, V.L.; Hand, S.J.; Archer, M.; Handley, W.D.; Worthy, T.H. Flightless rails (Aves: Rallidae) from the early Miocene St Bathans Fauna, Otago, New Zealand. J. Syst. Palaeontol. 2018, 1–27. [Google Scholar] [CrossRef]
  99. Bunce, M.; Worthy, T.H.; Phillips, M.J.; Holdaway, R.N.; Willerslev, E.; Haile, J.; Shapiro, B.; Scofield, R.P.; Drummond, A.; Kamp, P.J.J.; et al. The evolutionary history of the extinct ratite moa and New Zealand Neogene paleogeography. Proc. Natl. Acad. Sci. USA 2009, 106, 20646–20651. [Google Scholar] [CrossRef] [PubMed] [Green Version]
  100. Lewis, K.B.; Carter, L.; Davey, F.J. The opening of Cook Strait: Interglacial tidal scour and aligning basins at a subduction to transform plate edge. Mar. Geol. 1994, 116, 293–312. [Google Scholar] [CrossRef]
Figure 1. Maximum likelihood phylogeny from RAxML analysis of select mitochondrial sequences representing key higher-taxa. Branch lengths are scaled according to the number of substitutions. Values associated with branches are support values from our RAxML bootstrap analysis and posterior probabilities from a MrBayes analysis of the same dataset. Red dotted lines show alternative positions of Aptornis otidiformis that we tested with the Shimodaira–Hasegawa test (as implemented in RAxML) and were able to reject at p < 0.01. Node values correspond to maximum likelihood bootstrap (%)/Bayesian posterior probability.
Diversity 11 00024 g001
Figure 2. BEAST maximum clade credibility consensus tree of alignment B (predominantly complete or near-complete mitochondrial genomes). Scale represents time in millions of years (Ma) before present. Families/subfamilies and superfamilies designated on right. Error bars represent 95% Highest Posterior Densities (HPDs) for node age estimates. Node numbers represent Bayesian posterior probabilities. Calibrated nodes are numbered accordingly (see Methods section for full details).
Diversity 11 00024 g002
Figure 3. MrBayes maximum clade credibility consensus tree of alignment C. Node numbers represent Bayesian posterior support values.
Diversity 11 00024 g003

