Article

Discovery and Potential of SNP Markers in Characterization of Tunisian Olive Germplasm

1
Institut de l'Olivier, P.O. Box 1087, 3018 Sfax, Tunisia
2
Centre de Biotechnologie de Sfax, P.O. Box 1177, 3038 Sfax, Tunisia
*
Author to whom correspondence should be addressed.
Diversity 2010, 2(1), 17-27; https://doi.org/10.3390/d2010017
Submission received: 10 November 2009 / Accepted: 22 December 2009 / Published: 30 December 2009

Abstract

:
Single Nucelotide Polymorphisms (SNPs) have become the most widely used markers in many current genetic applications. Here we report the discovery of nine new SNPs in olives by direct partial sequencing of two genes (OEX and OEW) in sixteen Tunisian cultivars. The SNP markers were then used to genotype 24 olive cultivars and assess the level of genetic diversity. Power of discrimination of SNP markers was then compared to that of microsatellites (SSRs). A combination of SSR and SNP markers was finally proposed that can be used for cultivars identification in juvenile step or for oil traceability.

1. Introduction

The olive tree (Olea europaea L.) is a subtropical species typical of the Mediterranean basin where it represents the most important oil-producing crop. It is a diploid (2n = 46) and outcrossing produces species with a very wide genetic diversity. Since the beginning of its domestication, olive has been propagated vegetatively to exploit the best combination of genes which arose by random crosses or mutations. As a result, a large number of varieties are currently cultivated in olive oil producing countries, raising several problems for germplasm management and preservation. Evaluation and characterization of olive genetic resources is therefore crucial, particularly because identification of olive cultivars is complicated by the large number of varietal synonyms and homonyms, by the intensive exchange of plant material, by the presence of varietal clones and by problems of varietal certification in nurseries [1,2,3].
DNA markers are valid tools for the evaluation of biological materials, both for genetic diversity studies and for the discrimination of samples [4,5,6,7]. It is, therefore, a natural extension for this molecular approach to be applied to the agrifood industry for identifying the varieties or even species of bacteria, plants and animals used to make processed foods [8,9,10]. In the olive industry, DNA markers are being developed to identify and characterize olive cultivars and to determine the varietal composition, origin and authenticity of olive oils.
In olive tree the assessment of genetic variability has been carried out with morphology-based markers [4] and DNA-based markers [11,12,13,14,15]. Among these, AFLP markers [4,13,16] and microsatellites, also named Simple Sequences Repeats (SSR) [5,15] have been widely used in genetic characterization of cultivated olives and also the study of relationships among cultivars, wild forms and related species. Recently, single nucleotide polymorphism (SNP) derived markers, identified in coding sequences of different genes, have been developed to discriminate very similar cultivars [17,18] and for olive oil traceability and authenticity.
Technological improvements make the use of SNP attractive for high throughput use in marker-assisted breeding, for population studies [19] and to develop high-density linkage maps for map-based gene discovery. Moreover, SNPs are usefully applied in Real-Time PCR to obtain a quantitative analysis for disease association studies in humans and for food adulteration discovery [19]. Five SNPs were detected on two candidates genes involved in fatty acid biosynthesis pathways and screened on 74 European and 5 non-European olive varieties in a genetic diversity study [19].
In order to increase the number of available SNP in olives, direct sequencing of known genes remains the most straightforward approach. In this study we report the discovery of nine new SNP markers within two genes involved in the biosynthesis of terpenoids (sterol precursors). These SNPs were then characterized in a set of Tunisian olive varieties to assess their potential in cultivar identification and to compare their performance with SSR [15].
The aim of this work was to discover new SNPs within the lupeol synthase (OEW) and Cycloartenol synthase (OEX) genes in olive cultivars and assess their potential in olive cultivar discrimination. These two genes were chosen because they are key contributors in the oleanolic acid synthesis and their cDNA sequences have been previously identified in olive [20].

2. Results and Discussion

2.1. Targeted Sampling

The total length of high quality sequences analysed obtained for the two genes OEX et OEW was 1,375 bp. Comparison of this sequences to the cDNA original sequences from which the primers were designed by BLAST2seq [21] showed that only 96 bp were homologous to cDNA (correspond to exons) while the remaining 1,279 bp correspond to intronic sequences.
SNP discovery was validated by genotyping a set of 24 cultivars using direct sequencing of PCR products and comparative analysis of sequences of the different cultivars (Figure 1).
Nine SNPs were finally identified within the intronic sequences of the genes. Four of them were transversions and the other five were transitions (Table 1). This high density of single nucleotide polymorphism in two olive genes suggests that further SNP identification can be effectively performed using a smaller number of olive cultivars.
Table 1. Position and types of the nine SNPs discovered.
GeneSNP position*Type
OEW28C/T
31C/G
36C/T
159C/T
250C/G
289G/T
OEX1G/T
33C/T
155C/T
* Relative to the first nucleotide of the primersequence used for PCR (see text for details).
Figure 1. Example of sequence comparison using the program BioEdit.
Diversity 02 00017 g001

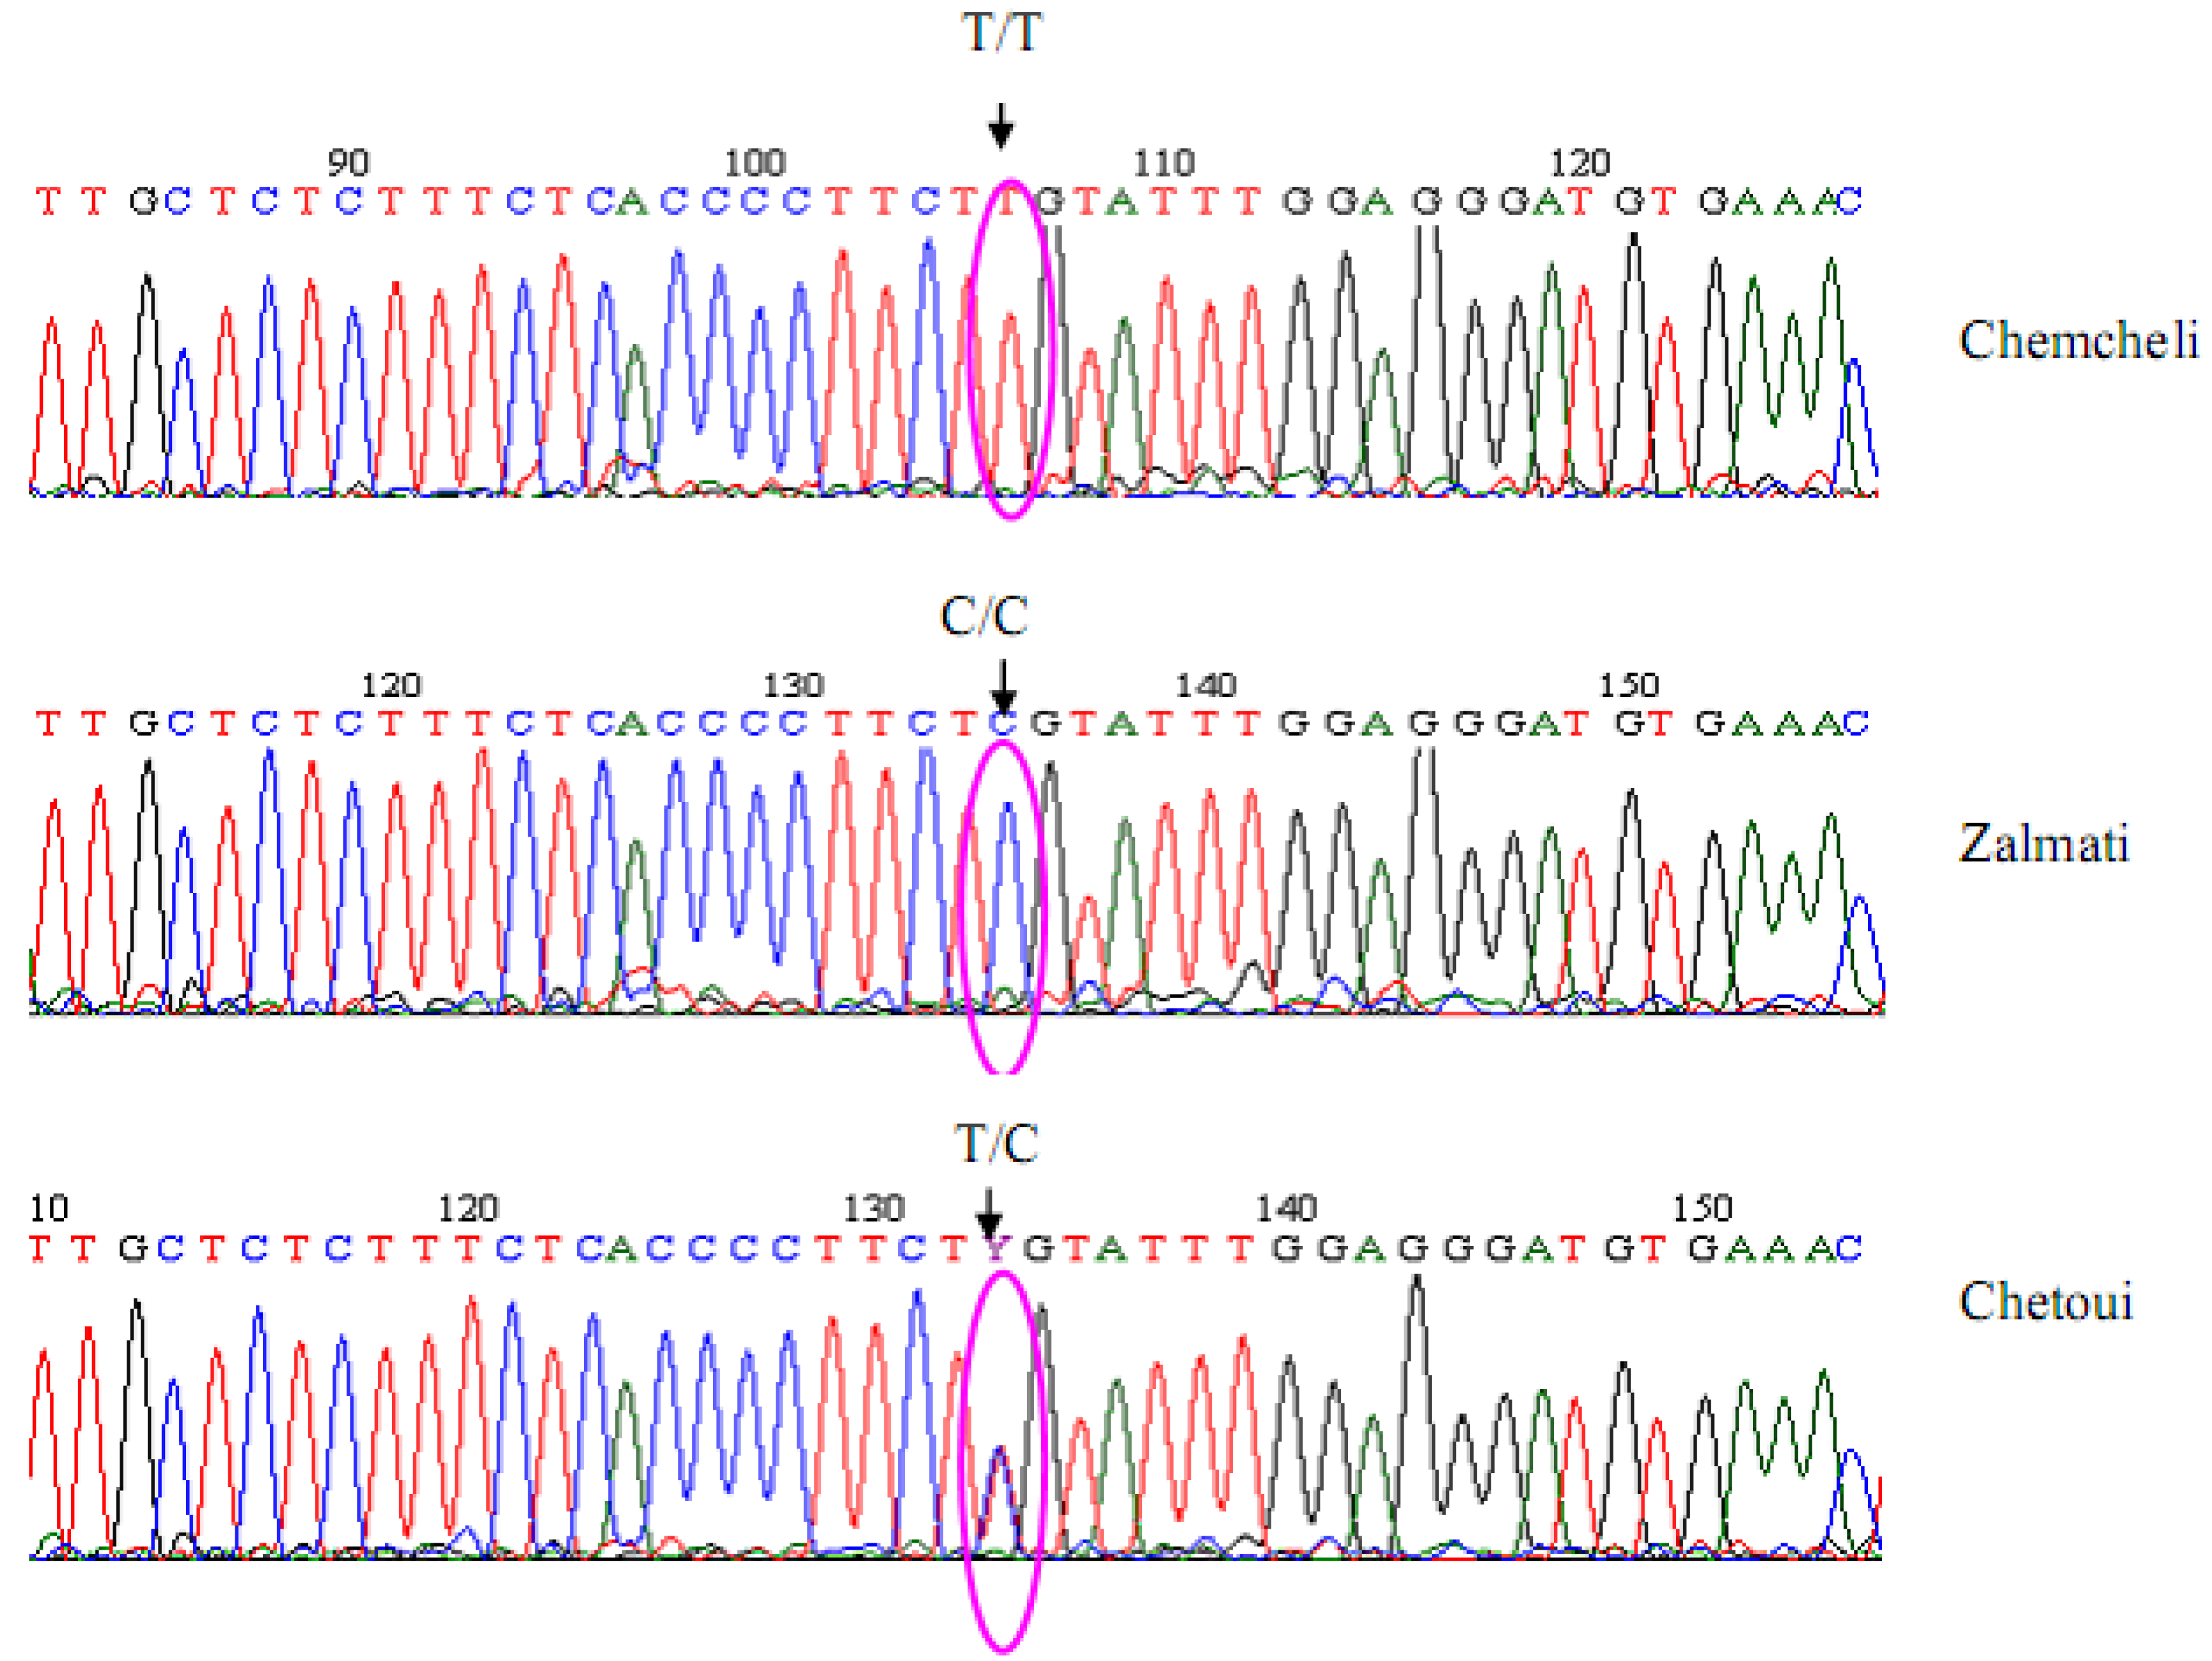
2.2. Marker Characteristics

Table 2 shows the genotypic and allelic frequencies of the nine SNPs and their power of discrimination (PD) which varies from 0.43 for the marker oew36 to 0.63 for the marker oew31 with an average value of 0.53. Similar values of power of discrimination were found by [18]. The combined power of discrimination for the nine SNPs was 0.9956274976 which means that the probability of finding two cultivars with the same combination of genotypes for the nine markers is less than 5 in one thousand. This relatively ‘poor’ value is expected since SNP markers are biallelic. It is however interesting to note the high heterozygosity of markers oew36 and oex33.
Table 2. Feature and frequencies of the new SNPs.
GenesSNP Observed heterozygosity
(%)
Power of discrimination (PD) (%)Genotypic frequencies
(%)
Allele frequencies
(%)
OEWoew2829.25954.2 T/T16.6 C/C29.2C/T68.7:T 31.3:C
oew3145.86337.5 G/G12.5 C/C45.8 C/G60.4:G39.6:C
oew3670.8434.2 T/T25.0 C/C70.8 C/T60.4:C 39.6:T
oew15933.36150.0 T/T16.7 C/C33.3 C/T66.0:T34.0:C
oew25037.55158.3G/G4.16 C/C37.5 G/C77.1:G 22.9:C
oew28937.55912.5 T/T50.0G/G37.5 G/T68.7:G31.3:T
OEXoex145.86041.7 T/T12.5 G/G45.8 T/G64.6:T35.4:G
oex3358.34841.7 T/T0 C/C58.3 C/T70.8:T29.2:C
oex15529.26425.0 T/T45.8 C/C29.2 C/T60.4:C39.6:T

2.3. Genetic Diversity Levels

The nine SNP markers were genotyped in a set of 24 olive cultivars in order to assess their potential in studying the genetic diversity. The lowest coefficient of similarity (GS = 0.17) was observed between varieties Tounsi and Lguim. The same results were found with SSR (GS = 0.15) [15]. These two varieties differ considerably in their final use, as well as in several agro-morphological and chemical characteristics [3]. The highest similarity (GS = 1) occurred several times between individuals of the same variety which is expected knowing the clonal propagation of olive cultivars. Our data also highlight the high genetic similarity between cultivars Chemlali Sfax and Zalmati (GS = 0.93). In fact, previous investigations reported the high similarity of these two cultivars based on pomological, chemical and SSR characteristics (GS = 0.95) [15].

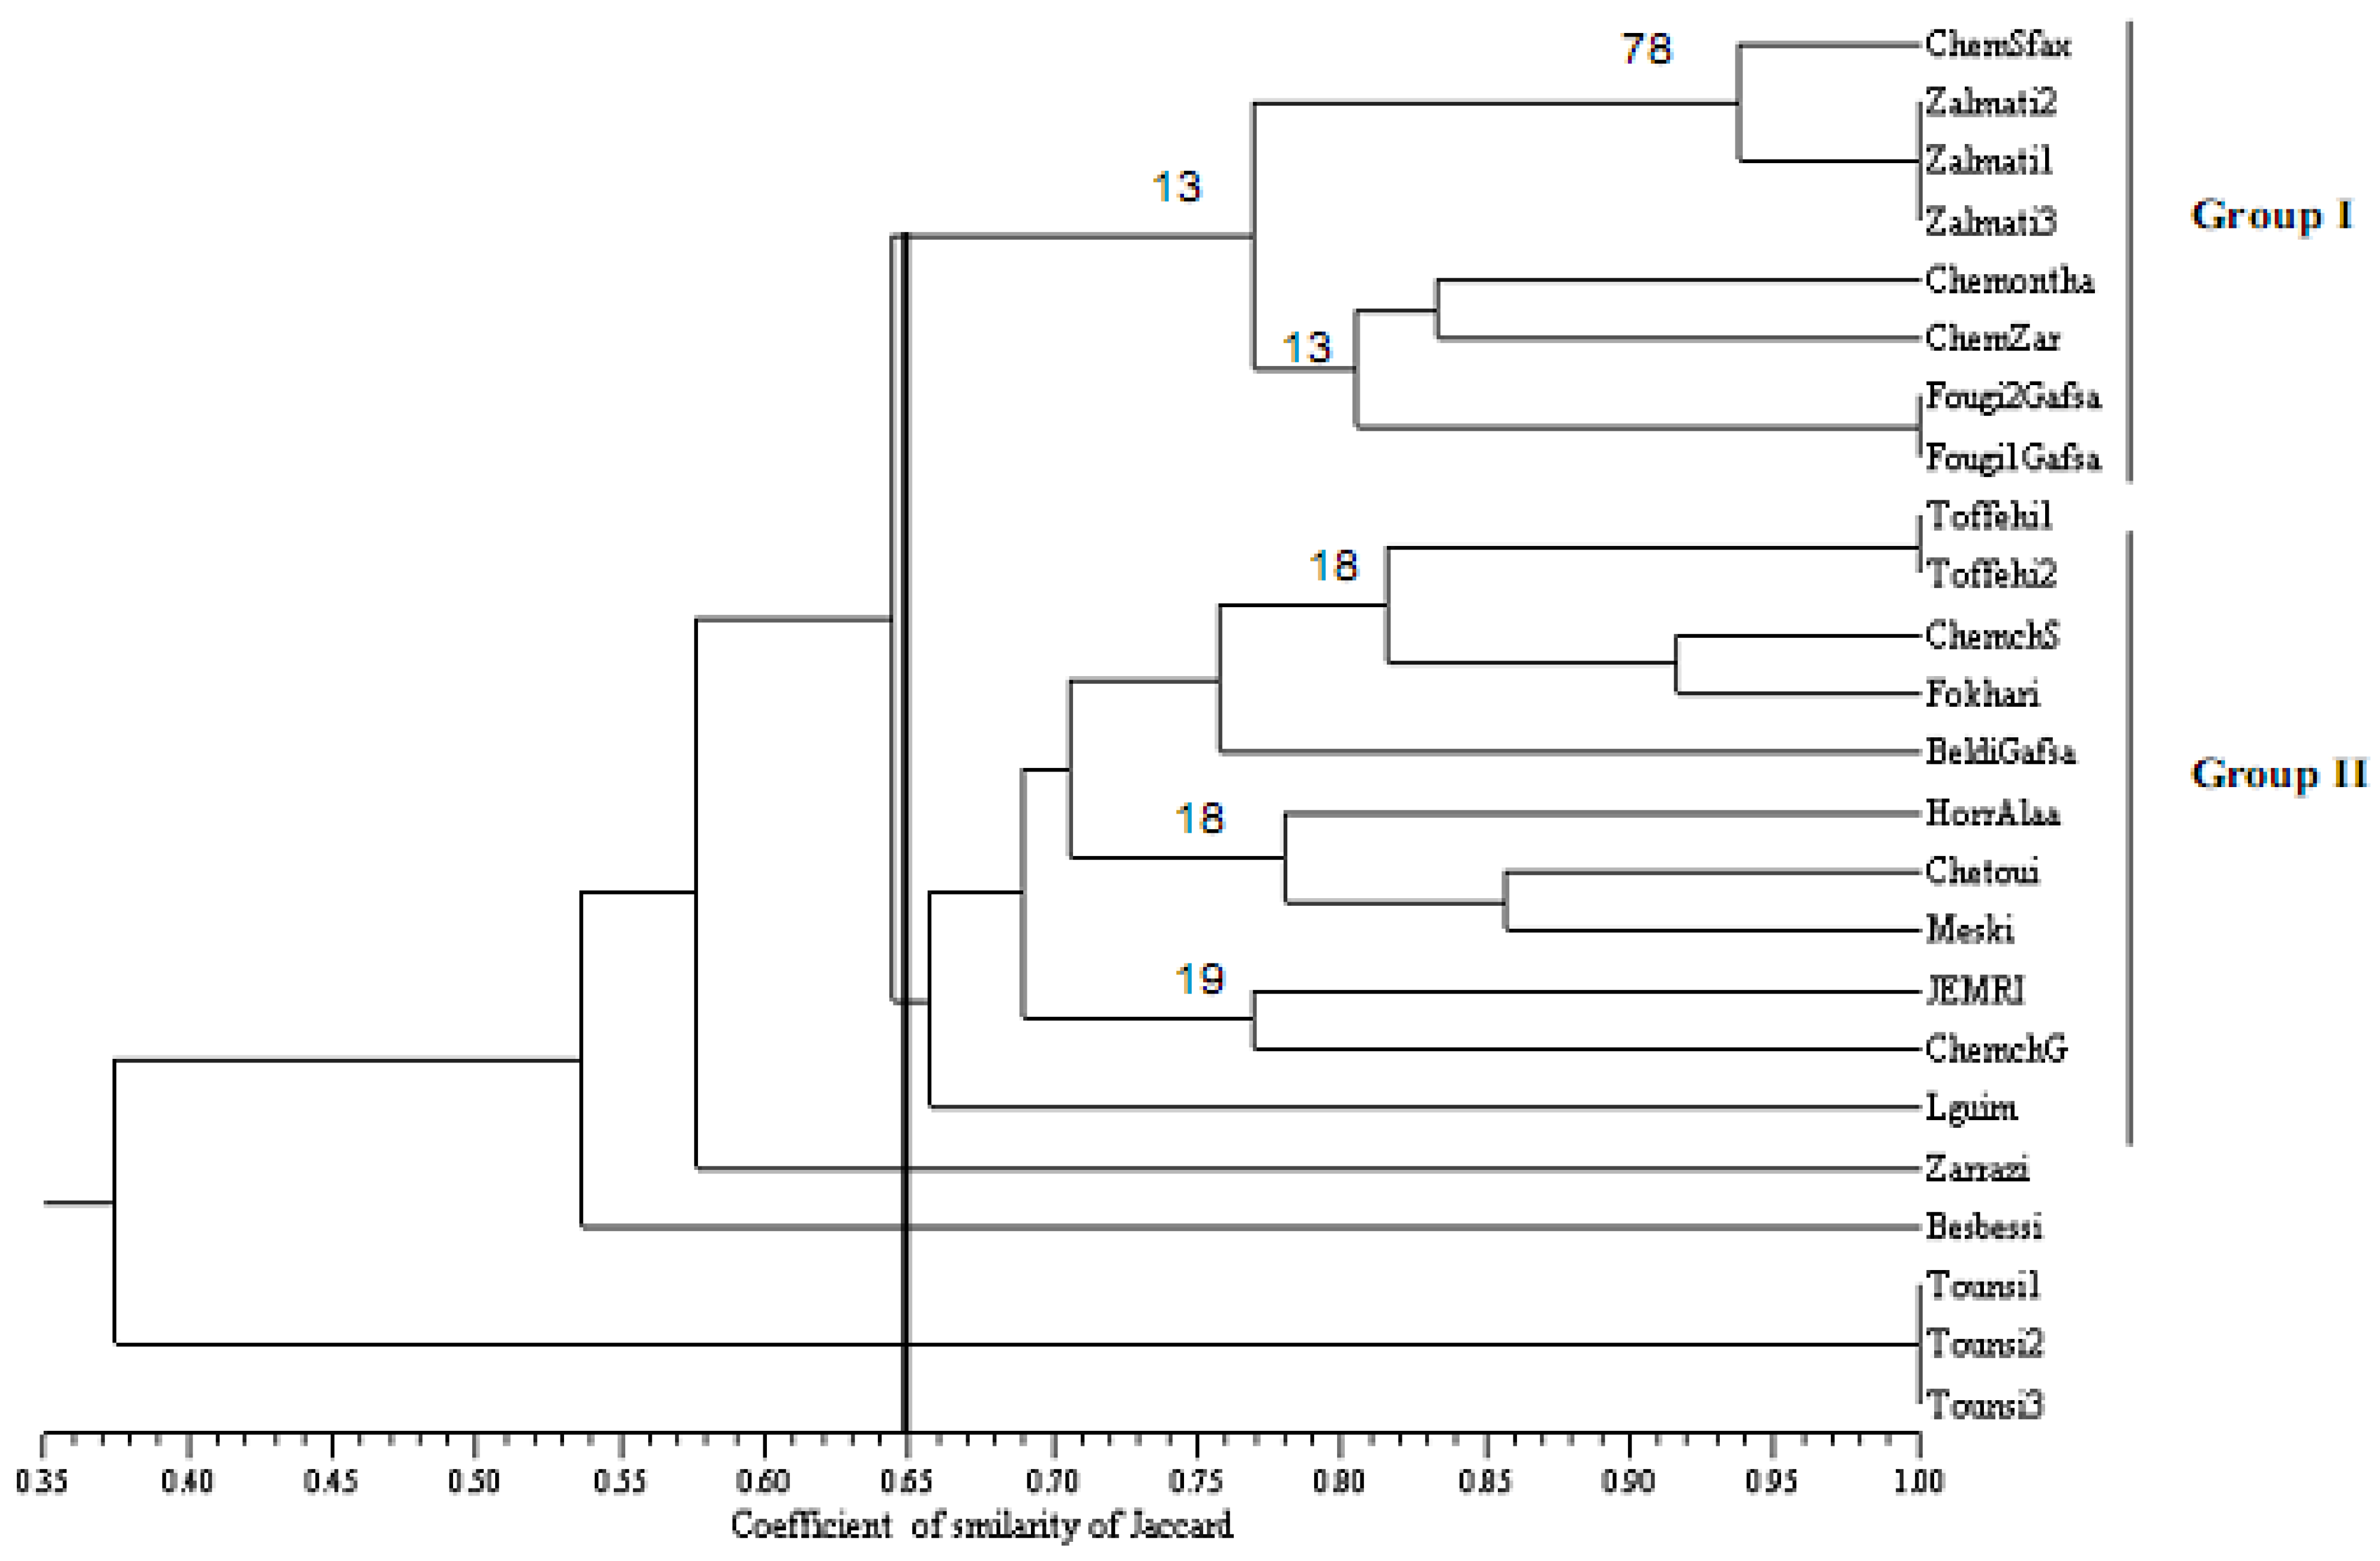
2.4. Patterns of Genetic Diversity

The dendrogram based on SNP data shows that two groups of cultivars may be defined by cutting the tree at a similarity level 0.65 (Figure 2). Group 1 is composed by five cultivars: Chemlali_Sfax, Zalmati, Chemlali_ontha, Chemlali_Zarzis and Fougi while group 2 comprises the others. Based on bootstrap values, all subgroups of two or three cultivars are highly consistent but groups have week robustness (Figure 2). This could be explained by the low informativness of SNP markers and their week ability to discriminate between groups of cultivars due to their biallelic nature.
In addition, a close analysis of the dendrogram shows that there is no relationship between structuring of genetic variability and geographic origin of cultivars.
Figure 2. Dendrogram of 24 olive cultivars generated by cluster analysis using Jaccard similarity coefficients from single nucleotide polymorphism markers and UPGMA method. Number are bootstrap values estimated over 100 replicates using PHYLIP package.
Diversity 02 00017 g002

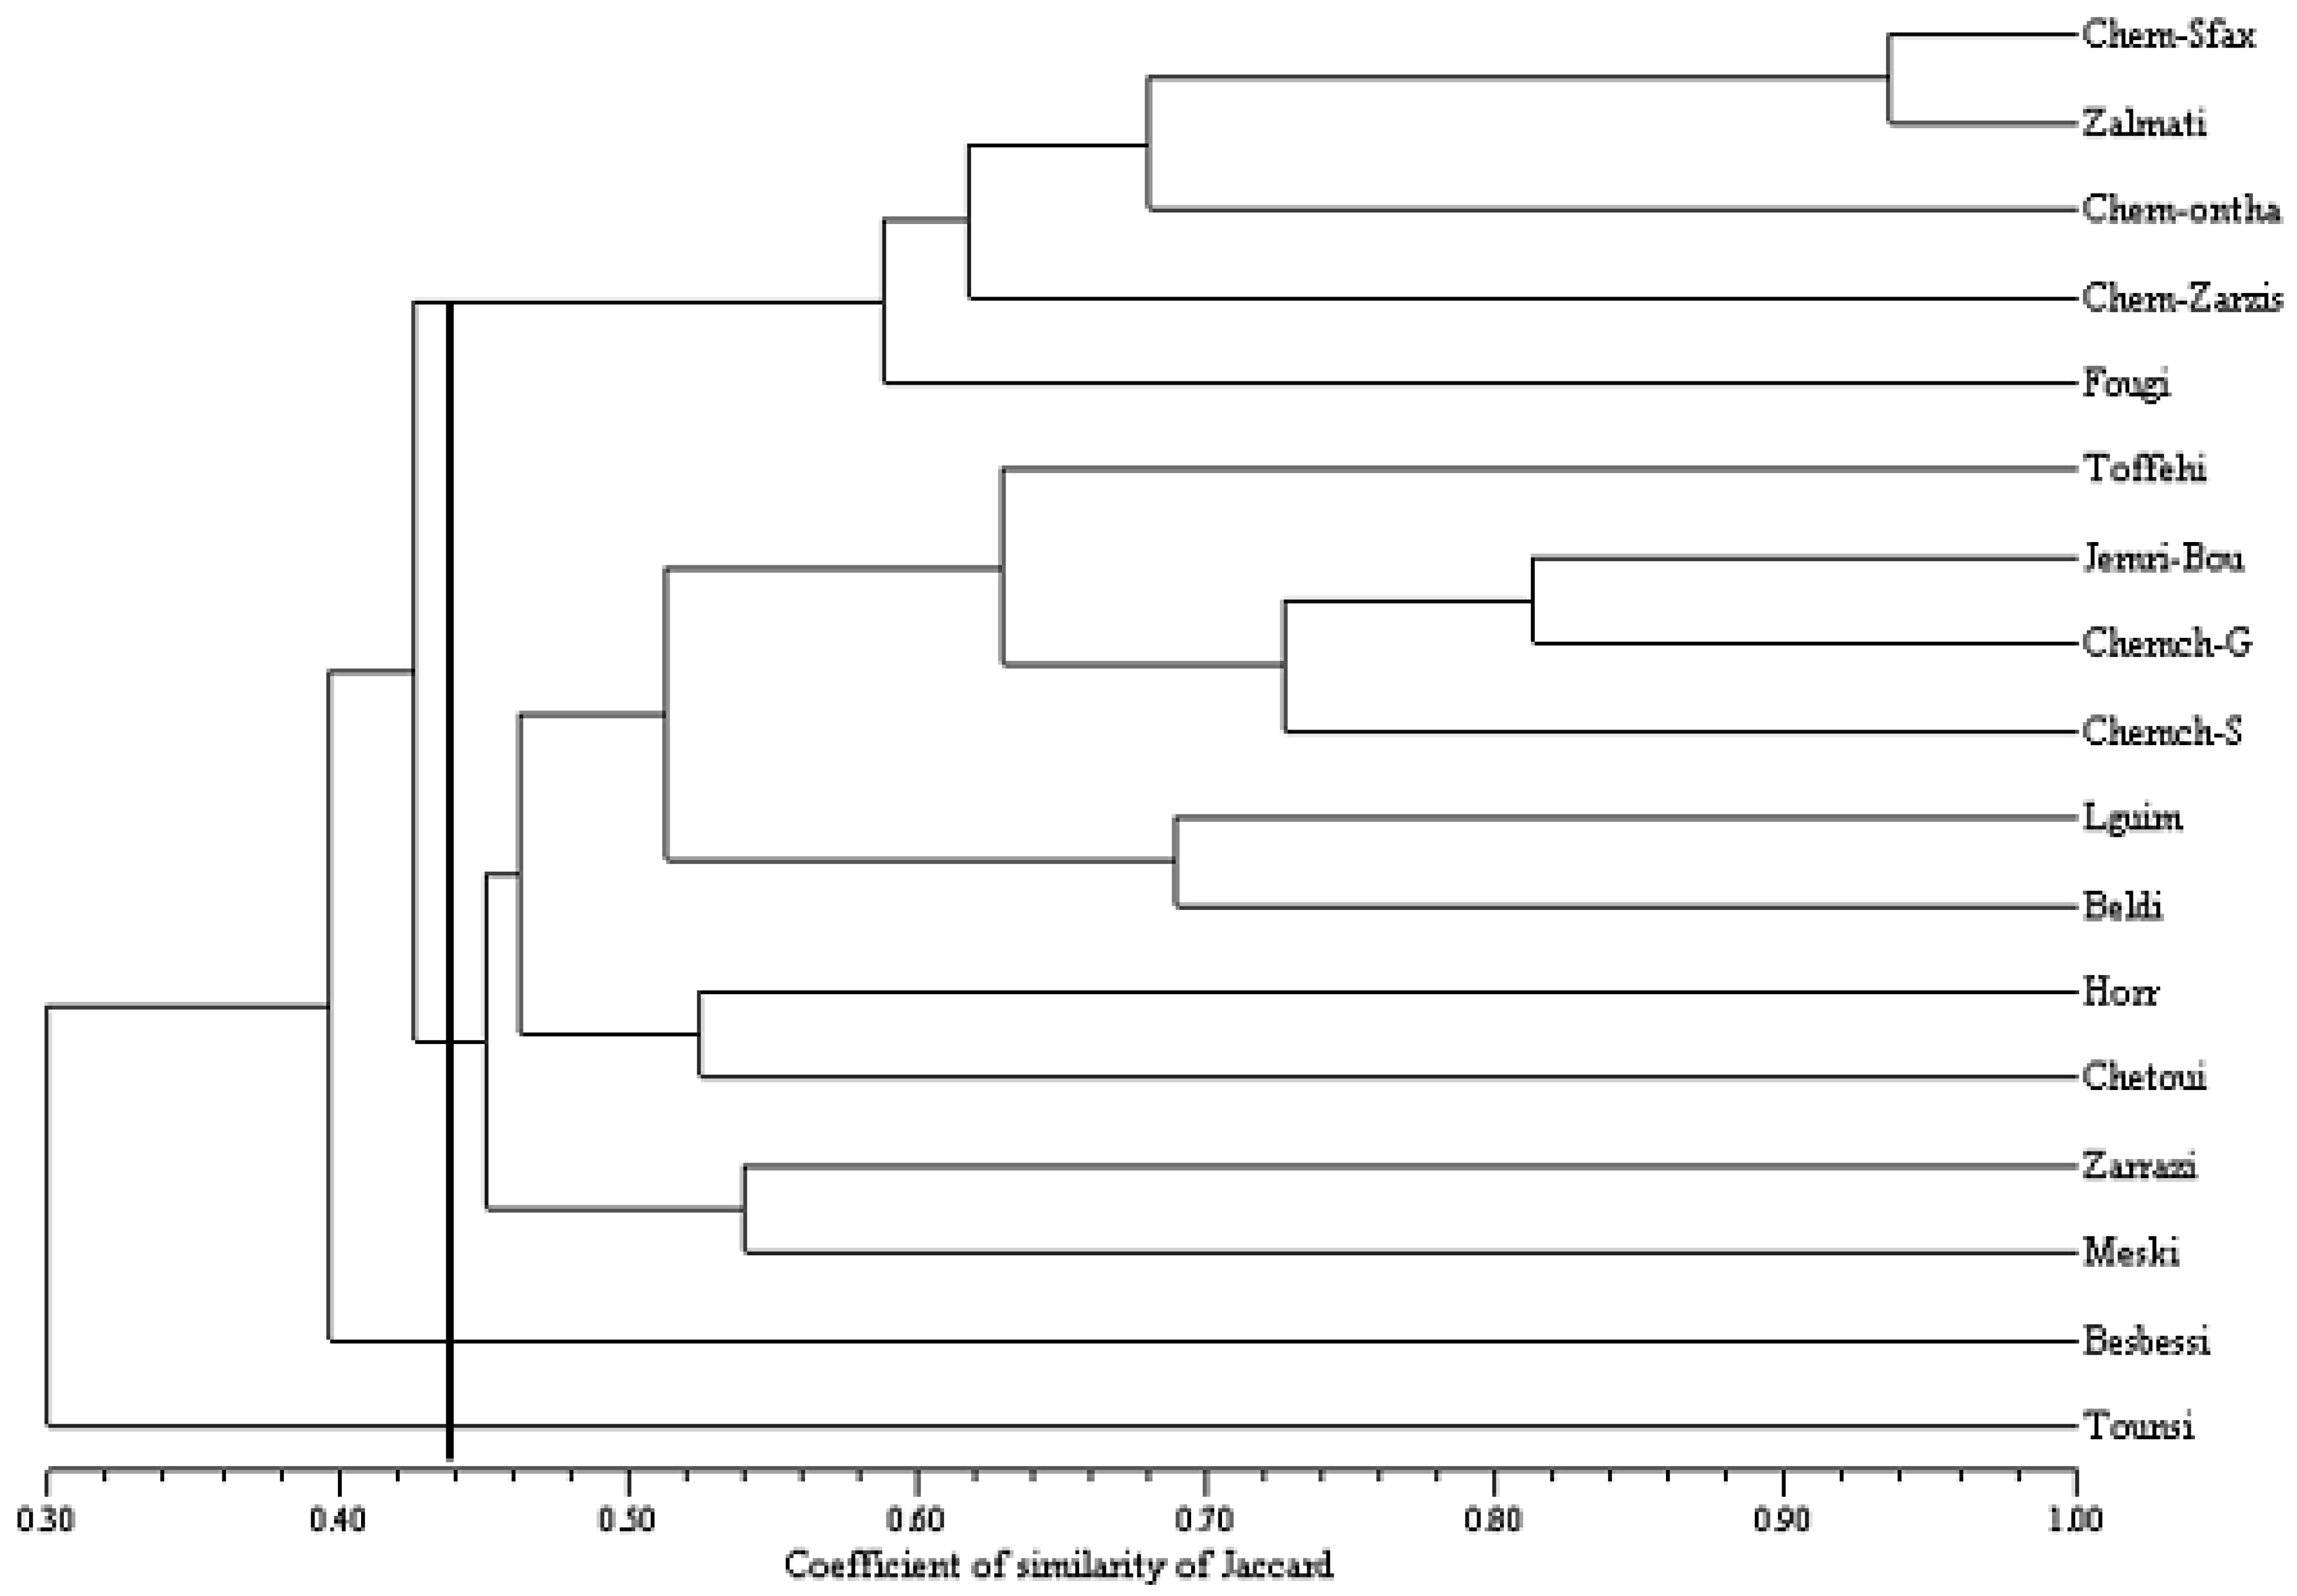
2.5. Concensus Dendrogram Based for SSR and SNP Markers

GS matrices with SSR and SNP markers were used to draw a consensus dendrogram. Two groups were obtained by cutting the dendrogram at a similarity equal to 0.44 (Figure 3).
Group 1 comprises the varieties Chemlali Sfax, Zalmati, Chemlali ontha, Fougi and Chemlali Zarzis. This group is common to all three dendrograms based on SSRs, SNPs and both markers. The proximity of Lguim and Beldi as well as Toffehi and Chemcheli in group II was also consistent in all studied dendrograms. This group includes the varieties of group II and III of the SSR dendrogram.
We noted that this dendrogram allows separation of all the varieties studied and shows that combining the two types of markers can provide a more precise characterization of the cultivars.
Figure 3. Consensus Dendrogram of 16 olive cultivars based on both SSR and SNP markers.
Diversity 02 00017 g003

2.6. Selecting a Subset of Highly Discriminative Markers

In this section we tried to select a subset of SSR and SNP markers that provide a power of discrimination between the cultivars similar to or better than that obtained by the set of ten SSR markers studied in [15]. Our objective was to replace as much SSR as possible by SNP (which can be genotyped at lower cost) to get at final a combination of markers that can be used for cultivar authentification.
We started with the ten SSR and eliminate sequentially the SSR markers with low power of discrimination [15] while adding the SNP markers having the highest power of discrimination (see Table 2). The best marker combination was found to be that containing SSR GAPU71A and six SNP markers (OEW28, 31,159,289 and OEX1, 155); its overall power of discrimination was equal to 0.999998005. This value is very close to that of the ten SSR markers reported in [15] (0.99999875). This marker combination requires less genotyping efforts than SSRs and might be useful for cultivar identification, particularly in juvenile stage or for oil authentification.

3. Experimental Section

3.1. Plant Material

Twenty-four accessions of olive originating from different growing areas in Tunisia were used in this study (Table 3). They derive from four collections maintained in experimental orchards at the Olive Institute stations in Sfax, Gafsa, Tunis, Zarzis and Kairouan.
Table 3. List of the olive accessions analyzed from the Tunisian olive germplasm collection.
Cultivar nameName in treeGrowing Regiona
‘Beldi’BeldiGafsaGafsa
‘Besbessi’BesbessiTunis
‘Chemcheli’Chemcheli-SSfax
‘Chemcheli’Chemcheli-GGafsa
‘Chemlali ontha’Chem-onthaZarzis
‘Chemlali’Chem-Sfax1Sfax (Sfax)
‘Chemlalizarzis’Chem-ZarZarzis
‘Chetoui’Chetoui1Borj el Amri
‘Chetoui’Chetoui2Mohsen el Imem
‘Fougi’FougiGafsaGafsa
‘Fougi’Fougi2GafsaGafsa
‘Horr’HorrKairouan
‘Lguim’LguimGafsa
‘Toffehi’ToffehiZarzis
‘Tounsi’TounsiGafsa
‘Tounsi’TounsiGafsa
‘Tounsi’TounsiGafsa
‘Zalmati’Zalmati1Zarzis
‘Zalmati’Zalmati2Zarzis
‘Zalmati’Zalmati3Zarzis
‘Zarrazi’ZarraziZarzis
a Department from which the cultivar tree was sampled (see maps in references [13] and [15]). B fruit size is classified according to average fruit weight: small: 0.8–2 g; Medium: 3–5 g; Large: >5 g.

3.2. DNA Extraction from Leaves

Genomic DNA was extracted from fresh leaves of the cultivars by using a CTAB method described in [22]. After extraction, the samples were treated with RNase A (Sigma chemical Co, St louis, USA) for 30 min at 37 °C and run in 1% agarose gel in TAE1X buffer in presence of ethidium bromide (1 µg/mL).

3.3. Primer Desing

PCR primers were designed using Primer3 program [23] and the sequence of partial or complete cDNA of OEW and OEX genes available from GenBank at NCBI website (http://www.ncbi.nlm.nih.gov) under accession numbers NC6456433 and NC6456464, respectively. The sequences were amplified by polymerase chain reaction (PCR). Sequences of the OEW and OEX genes were PCR amplified for the 24 selected olive cultivars using the following primers:
  • OEW F: 5’ TACTAATCTTGAAGGTAATCG 3’
  • OEW R: 5’ TCTTATAACATGGCACTTAC 3’
  • OEX F: 5’CTATTCAAGCATTGGGAGCA 3’
  • OEX R: 5’CCCAAACCATGTCCCATAAG 3’.
These Forward primers were located at 2,088 bp and 1,196 bp relative to the first nucleotide of the cDNA sequences of OEW and OEX available in Genebank, respectively.

3.4. PCR and Sequencing

PCR reaction mixes were prepared for each sample by mixing 5 μL of 10 × PCR Buffer, 2 μL 10 mM dNTPs, 5 µL of 10 mM MgC12, 1 μL of each primer (at 10 μM), 0.5 U of GoTaq DNA polymerase (Promega), 10 μL of diluted genomic DNA(25 ng/µL) and 25.5 μL of water. Cycling parameters were as follows: 94 °C for 5 min. followed by 40 cycles of 94 °C for 30 second, hybridizing step for 1 min of 58 °C of OEW and OEX primers, 72 °C for 1 min and a polishing step of 72 °C for 10 min. Products were separated by agarose gel electrophoresis to check for efficiency of amplification and to ensure that only a single product of the expected size was present. PCR products were then purified by passage through WizardR SVGel and PCR Clean-Up System purification columns and sequenced tree times from either end using the same forward primers as used in initial PCR amplification. The Big Dye terminator cycle sequencing kit version 3.1 (Applied Biosystems) was used according to manufacturer’s instructions.

3.5. Marker Discovery Strategies

The most direct approach to the discovery of DNA polymorphisms is direct sequencing of PCR products from a number of diverse individuals. Polymorphisms between the sequences were identified by sequence alignment using ClustalW [24]. Furthermore, the trace outputs from the sequencer were evaluated by eye to identify possible areas of heterozygous sequence (Figure 1). To minimize false positives due to sequencing artefacts, potential SNPs were resequenced.

3.6. Genetic Diversity and Data Analyses

For each SNP marker two alleles are generally present yielding three possible genotypes. Allelic and genotype frequencies for each marker were estimated by simple counting. Power of discrimination (PD) was calculated using the following formula [25]:
Diversity 02 00017 i001
where fi is the frequency of the ith genotype and the sum is over all genotypes.
The SNP genotypes were then recoded in a 0/1 data matrix where 1 indicates the presence of a given allele and 0 its absence. So each SNP was transformed into two columns with three possible states: 1/1 for heterozygote and 0/1 or 1/0 for the two homozygous genotypes.
Jaccard’s similarity coefficient was calculated to measure the genetic variability among the cultivars [26]. Based on the genetic similarity matrix, the cultivars were clustered by the unweighted pair group method with arithmetic averaging (UPGMA) using the program NTSYS-pc version 2.1 [27].

4. Conclusions

All these results indicate that SSR and SNP markers are extremely useful tools for addressing the issue of cultivar identification and particularly homonymy and synonymy problems in olive cultivars. The highest similarity was found for cultivars ‘Chemlali’ and ‘Zalmati’ (0.92). ‘Zalmati’ is closely related to ‘Chemlali’, both at the genetic level as seen here and in previous studies and at the phenotypic level. We show here that the combination of well selected SSR and SNP markers would help in reducing genotyping costs and provide a rapid and easy way to establish a fingerprint of each variety for use in cultivar identification and oil traceability.

Acknowledgements

This work was supported by the Ministry of Higher Education, Scientific Research and Technology and by the Ministry of Agriculture and Water Ressources, Tunisia.

References and Notes

  1. Barranco, D.; Rallo, L. Olive cultivars in Spain. Hortech 2000, 10, 107–110. [Google Scholar]
  2. Besnard, G.; Bervillé, A. Multiple origins for mediterranean olive (Olea europaea L. subsp. europaea) based upon mitochondrial DNA polymorphisms. CR Acad. Sci Ser. III 2000, 19, 81–100. [Google Scholar]
  3. Grati-Kamoun, N.; Ayadi, M.; Khlif, M.; Tridui, A.; Karray, B.; Rekik, H.; Rekik, B.; Hamdi, T.; Arous, M.N. Pomological and chemical characterization of Tunisia olive tree (Olea europaea L.). In Proceedings of the 4th International Olive Growing Symposium CIHEAM-IAM; Bari, Italy, September 25–30 2000. [Google Scholar]
  4. Angiolillo, A.; Mencuccini, M.; Baldoni, L. Olive genetic diversity assessed using amplified fragment length polymorphisms. Theoret. Appl. Genet. 1999, 10, 411–421. [Google Scholar] [CrossRef]
  5. Bandelj, D.; Jakse, J.; Javornik, B. DNA fingerprinting of olive varieties by microsatellite markers. Food Technol. Biotechnol. 2002, 5, 185–190. [Google Scholar]
  6. Garant, D.; Kruuk, L.E. How to use molecular marker data to measure evolutionary parameters in wild populations. Mol. Ecol. 2005, 15, 1843–1859. [Google Scholar] [CrossRef]
  7. Morgante, M.; Salamini, F. From plant genomics to breeding practice. Curr. Opin. Biotechnol. 2003, 5, 214–219. [Google Scholar] [CrossRef]
  8. Dalmasso, A.; Fontanella, E.; Piatti, P.; Civera, T.; Rosati, S.; Bottero, M.T. A multiplex PCR assay for the identification of animal species in feedstuffs. Mol. Cell. Probes 2004, 6, 81–87. [Google Scholar]
  9. Hernandez, M.; Esteve, T.; Pla, M. Real-time polymerase chain reaction based assays for quantitative detection of barley, rice, sunflower, and wheat. J. Agric. Food Chem. 2005, 6, 7003–7009. [Google Scholar] [CrossRef]
  10. Matsunagaa, T.; Chikuni, K.; Tanabeb, R.; Muroyab, S.; Shibata, K.; Yamadaa, J.; Shinmuraa, Y. A quick and simple method for the identification of meat species and meat products by PCR assay. Meat. Sci. 1999, 5, 143–148. [Google Scholar]
  11. Belaj, A.; Trujillo, I.; ee la Rosa, R.; Rallo, L. Polymorphism and discrimination capacity of randomly amplified polymorphic markers in an olive germplasm bank. J. Amer. Soc. Hort. Sci. 2001, 7, 64–71. [Google Scholar]
  12. Carriero, F.; Fontanazza, G.; Cellini, F.; Giorio, G. Identification of simple sequence repeats (SSRs) in olive (Olea europaea L.). Theor. Appl. Genet. 2002, 6, 301–307. [Google Scholar]
  13. Grati-Kamoun, N.; Mahmoud, F.L.; Rebai, A.; Gargouri, A.; Panaud, O.; Saar, A. Genetic diversity of Tunisian olive tree (Olea europaea L.) cultivars assessed by AFLP markers. Genet. Resour. Crop Ev. 2006, 10, 265–275. [Google Scholar]
  14. Pasqualone, A.; Caponio, F. Inter-simple sequence repeat DNA markers for identification of drupes from different Olea europaea L. cultivars. Eur. Food. Res. Technol. 2001, 3, 240–243. [Google Scholar] [CrossRef]
  15. Rekik, I.; Salimonti, A.; Grati-Kammoun, N.; Muzzaluppo, I.; Lepais, O.; Gerber, S.; Perri, E.; Rebai, A. Characterisation and identification of tunisian olive tree varieties by microsatellite markers. Hortscience 2008, 5, 1371–1376. [Google Scholar]
  16. Baldoni, L.; Pellegrini, M.; Mencuccini, M.; Mulas, M.; Angiolillo, A. Genetic relationships among cultivated and wild olives revealed by AFLP markers. Acta Hortic. 2000, 8, 275–283. [Google Scholar]
  17. Consolandi, C.; Palmieri, L.; Doveri, S.; Maestri, E.; Marmiroli, N.; Reale, S.; Lee, D.; Baldoni, L.; Tosti, N.; Severgnini, M.; de Bellis, G.; Castiglioni, B. Olive variety identification by ligation detection reaction in a universal array format. Afr. J. Biotechnol. 2007, 9, 565–574. [Google Scholar]
  18. Reale, S.; Doveri, S.; Díaz, A.; Angiolillo, A.; Lucentini, L.; Pilla, F.; Martín, A.; Donini, P.; Lee, D. SNP-based markers for discriminating olive (Olea europaea L.) cultivars. Genome 2006, 15, 1193–1209. [Google Scholar]
  19. Palmieri, L.; Vietina, M.; Bottura, C.; Donini, P.; Nelson, M. SNP development in olive and their application on varietal determination in olive oil. In Proceedings of the XLVIII Italian Society of Agricultural Genetics-SIFV-SIGA Joint Meeting; Lecce, Italy, September 15–18 2004. [Google Scholar]
  20. Shibuya, M.; Zhang, H.; Endo, A.; Shishikura, K.; Kushiro, T.; Ebizuka, Y. Two branches of the lupeol synthase gene in the molecular evolution of plant oxidosqualene cyclases. Eur. J. Biochem. 1999, 36, 266–302. [Google Scholar]
  21. Tatusova, T.A.; Madden, L.T. BLAST 2 sequences. A new tool for comparing protein and nucleotide sequences. FEMS Microbiol. Lett. 1999, 3, 247–250. [Google Scholar] [CrossRef]
  22. Fabbri, A.; Hormaza, J.I.; Polito, V.S. Random amplified polymorphic DNA analysis of olive (Olea europaea L) cultivars. J. Amer. Soc. Hort. Sci. 1995, 4, 538–542. [Google Scholar]
  23. Rozen, S.; Skaletsky, H. Primer3 on the WWW for general users and for biologist programmers. Methods Mol. Biol. 2000, 21, 365–386. [Google Scholar]
  24. Thompson, J.D.; Higgins, D.G.; Gibson, T.J. CLUSTAL W: improving the sensitivity of progressive multiple sequence alignment through sequence weighting, position-specific gap penalties and weight matrix choice. Nucleic Acids. Res. 1994, 22, 673–695. [Google Scholar]
  25. Kloosterman, A.D.; Budowle, B.; Daselaar, P. PCR-amplification and detection of the human D1S80 VNTR locus. Amplification conditions, population genetics and application in forensic analysis. Int. J. Legal Med. 1993, 7, 257–264. [Google Scholar] [CrossRef]
  26. Jaccard, P. Nouvelles recherches sur la distribution florale. Bull. Soc. Vaud. Sci. Nat. 1908, 44, 223–270. [Google Scholar]
  27. Rohlf, F.J. NTSYS-PC: Numerical Taxonomy and Multivariate Analysis System (version 2.1); Exeter Software: Setauket, NY, USA, 1999. [Google Scholar]

