Responses of Bats to Forest Fragmentation in the Mississippi River Alluvial Valley, Arkansas, USA

Abstract
:
1. Introduction
2. Methods
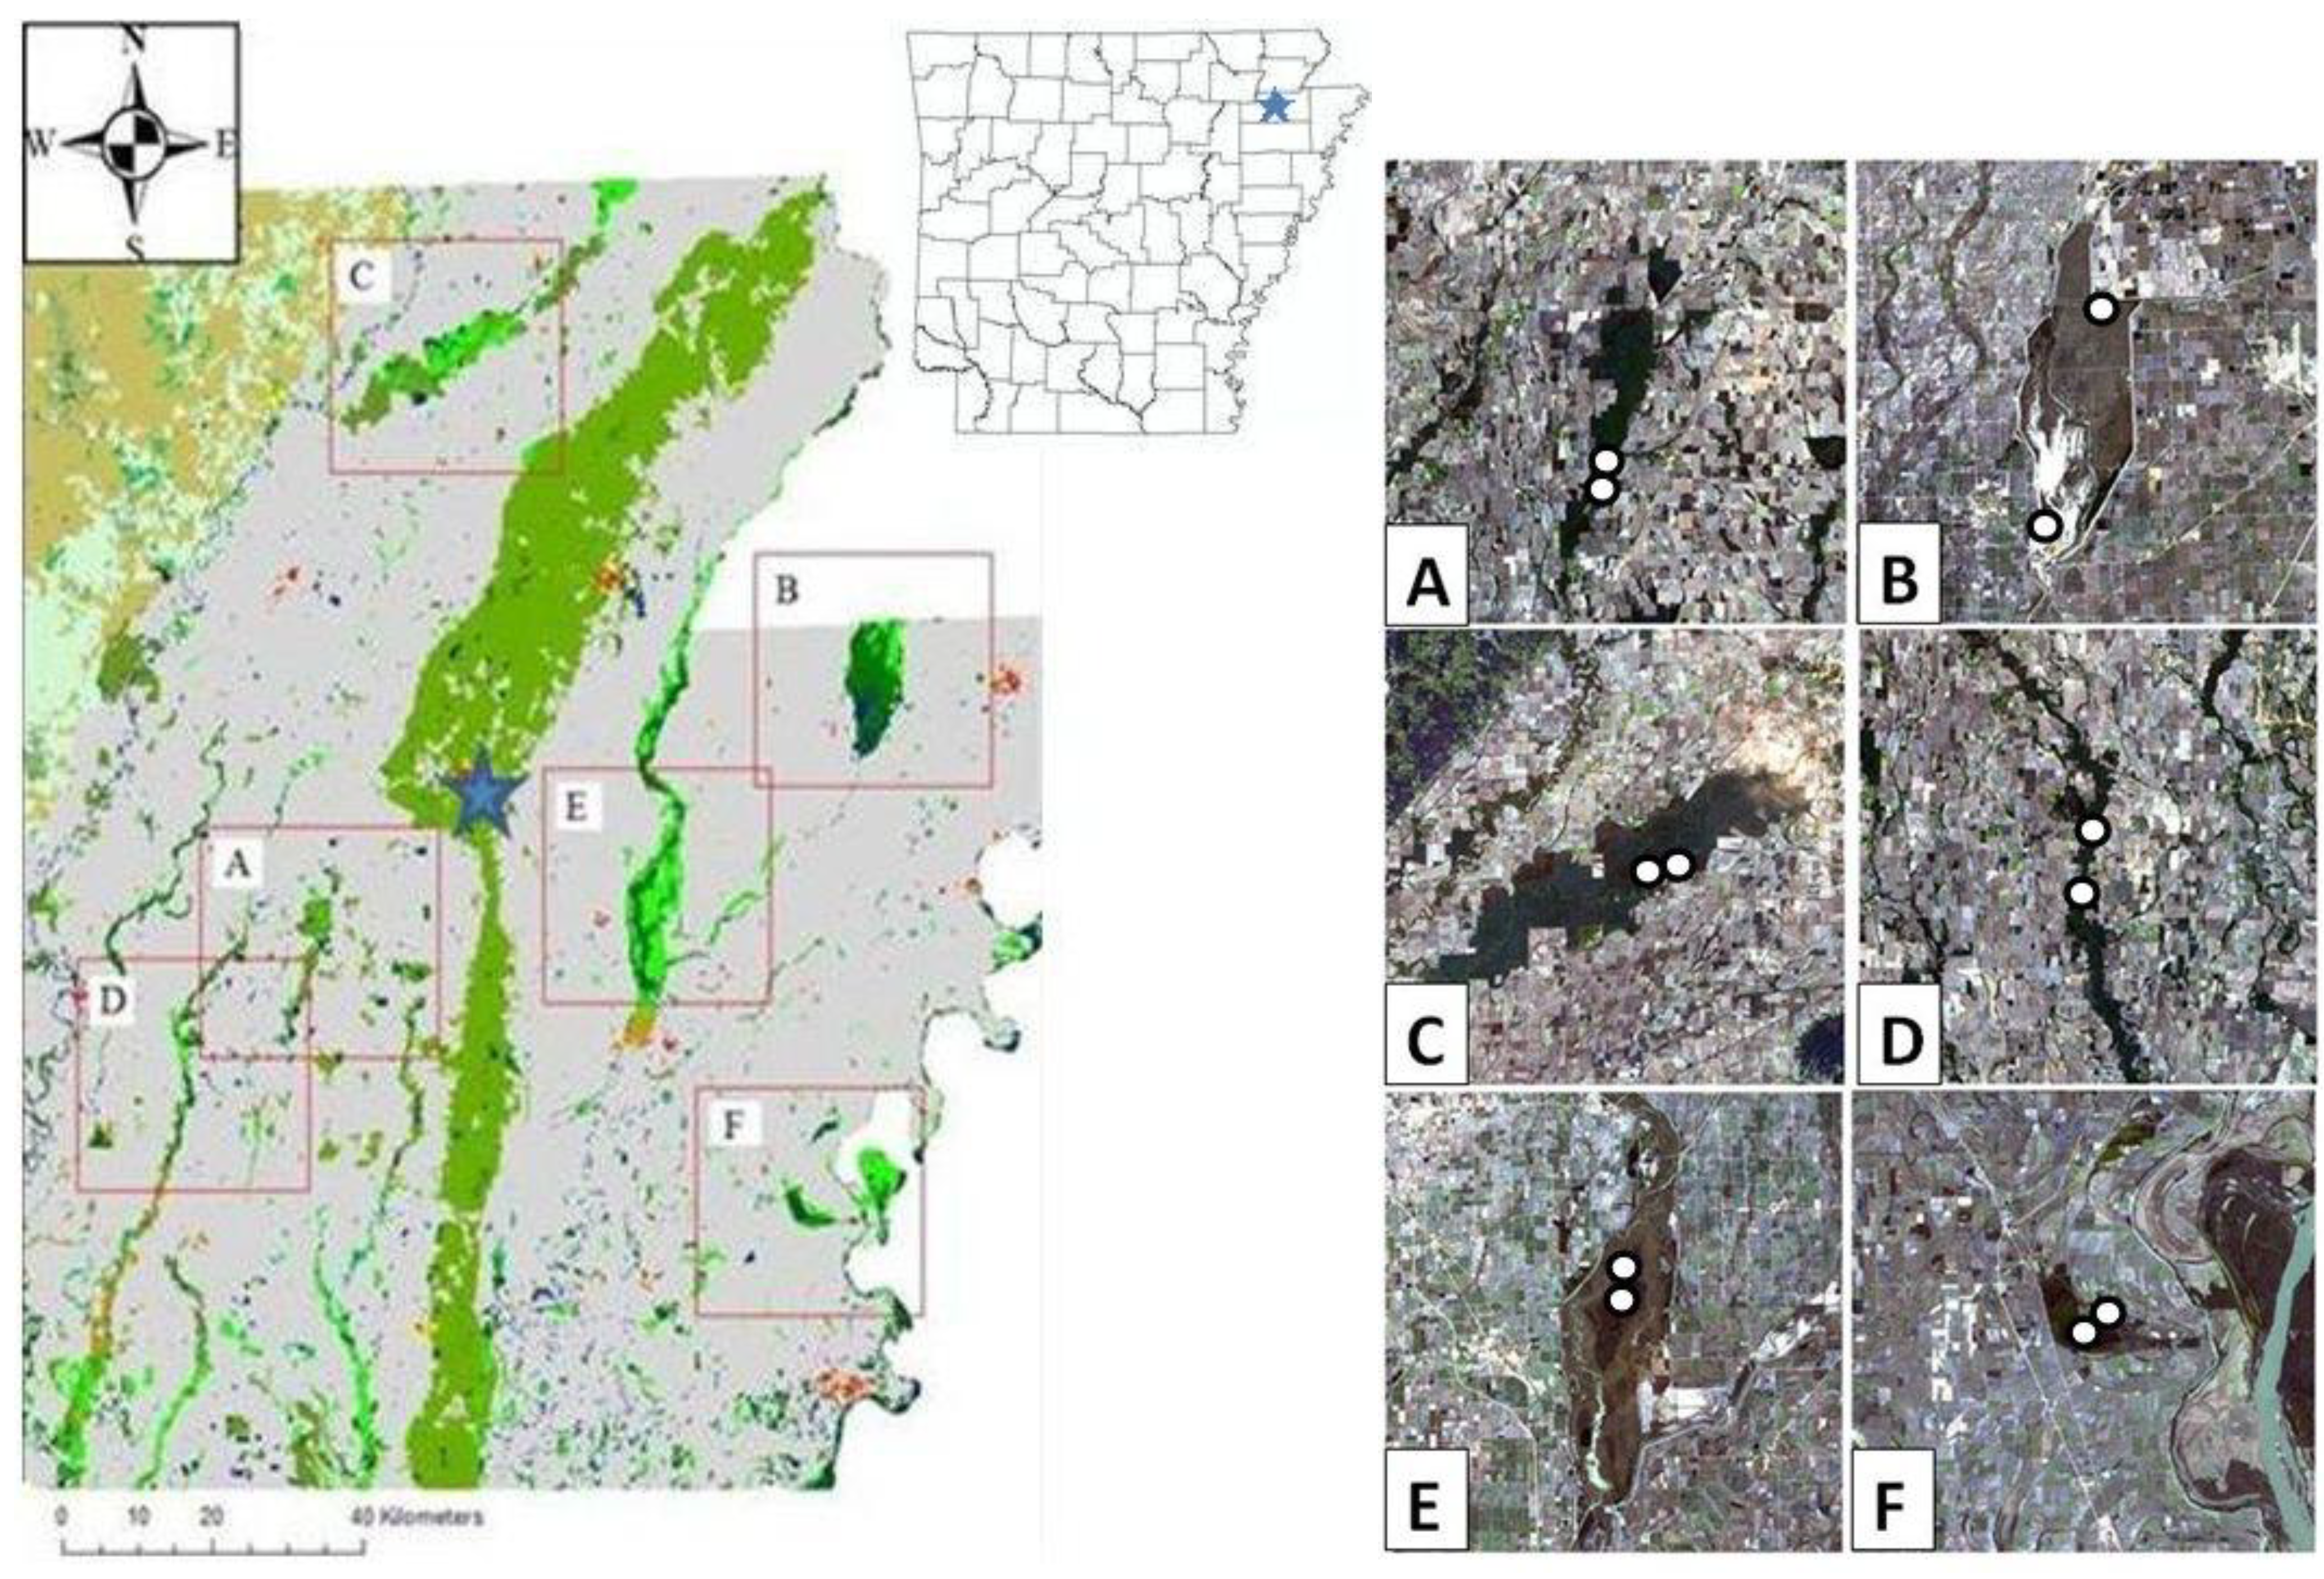
2.1. Study Area

2.2. Bat Capture Protocol
2.3. Habitat Classification
2.4. Fragmentation Analysis
2.5. Statistical Analysis
3. Results and Discussion
3.1. Results

| NP | PD (a) | LPI (a) | ED (a) | LSI | AREA_MN (a) | Shape_MN (a) | FRAC_MN | PARA_MN (a) | CONTIG_MN | TE (a) | |
|---|---|---|---|---|---|---|---|---|---|---|---|
| NP | 1 | --- | --- | --- | --- | --- | --- | --- | --- | --- | --- |
| PD (a) | 1.000†† | 1 | --- | --- | --- | --- | --- | --- | --- | --- | --- |
| LPI (a) | 0.199 | 0.203 | 1 | --- | --- | --- | --- | --- | --- | --- | --- |
| ED (a) | 0.851† | 0.855† | -0.159 | 1 | --- | --- | --- | --- | --- | --- | --- |
| LSI | 0.860† | 0.863† | -0.163 | 0.999†† | 1 | --- | --- | --- | --- | --- | --- |
| AREA_MN (a) | −0.956† | −0.954† | 0.044 | −0.914† | −0.926† | 1 | --- | --- | --- | --- | --- |
| Shape_MN (a) | −0.043 | −0.046 | −0.894† | −0.181 | 0.182 | −0.141 | 1 | --- | --- | --- | --- |
| FRAC_MN | 0.678 | 0.674 | 0.307 | 0.259 | 0.274 | −0.526 | 0.022 | 1 | --- | --- | --- |
| PARA_MN (a) | −0.67 | 0.668 | 0.731 | 0.282 | 0.294 | −0.543 | −0.564 | 0.595 | 1 | --- | --- |
| CONTIG_MN | 0.175 | 0.179 | 0.638 | 0.102 | 0.098 | −0.146 | −0.704 | −0.21 | 0.653 | 1 | --- |
| TE (a) | 0.857† | 0.861† | −0.162 | 1.000†† | 1.000†† | −0.922† | 0.182 | 0.269 | 0.29 | 0.099 | 1 |
| Species | Bayou De View | Big Lake | Black River | Cache River | St. Francis Sunken Lands | Wapanocca | ||||
|---|---|---|---|---|---|---|---|---|---|---|
| Corynorhinus rafinesquii | 42 | 0 | 6 | 4 | 14 | 1 | ||||
| Myotis austroriparius | 27 | 0 | 24 | 3 | 8 | 0 | ||||
| Lasiurus borealis | 10 | 6 | 6 | 10 | 4 | 5 | ||||
| Nyticius humeralis | 6 | 23 | 24 | 11 | 9 | 10 | ||||
| Perimyotis subflavus | 3 | 3 | 6 | 7 | 3 | 4 | ||||
| Myotis sodalis | 0 | 0 | 1 | 0 | 0 | 0 | ||||
| Myotis lucifugus | 0 | 0 | 7 | 4 | 2 | 0 | ||||
| Eptesicus fuscus | 0 | 0 | 1 | 0 | 10 | 0 | ||||
| Simpson’s Diversity | 0.67 | 0.45 | 0.78 | 0.67 | 0.83 | 0.68 | ||||
| Area (m²) | ||||||||||
| Bare (a) | 12,415.54 | 25,569.28 | 7,400.22 | 2,898.64 | 7,713.88 | 14,669.54 | ||||
| Crop (a) | 60,775.81 | 40,167.22 | 51,841.08 | 71,260.02 | 67,861.43 | 47,626.48 | ||||
| Forest (a) | 11,472.08 | 8,896.94 | 22,799.84 | 7,961.45 | 13,785.19 | 22,601.42 | ||||
| Water (a) | 3,100.31 | 10,195.62 | 4,385.13 | 3,990.9 | 3,177.31 | 7,298.73 | ||||
| Unidentified (a) | 2,255.83 | 4,719.88 | 3,379.8 | 0.00 | 935.12 | 187.2 | ||||
| Landscape Metric | ||||||||||
| TA (a) | 1.00000 | 0.99502 | 0.99788 | 1.00263 | 0.99502 | 1.02652 | ||||
| PD (a) | 122.85 | 43.48 | 90.57 | 27.72 | 29.53 | 32.86 | ||||
| LPI (a) | 66.06 | 26.37 | 46.42 | 79.74 | 38.64 | 46.68 | ||||
| TE (a) | 21,113,023 | 15,657,430 | 17,217,786 | 6,128,229 | 7,362,463 | 13,197,494 | ||||
| ED (a) | 234.65 | 173.11 | 190.90 | 68.27 | 81.40 | 150.53 | ||||
| LSI | 176.92 | 131.80 | 144.63 | 52.00 | 62.51 | 109.55 | ||||
| CONTIG_MN | 0.18 | 0.17 | 0.20 | 0.22 | 0.13 | 0.18 | ||||
| PARA_MN (a) | 2,224.21 | 1,062.98 | 2,223.00 | 2,108.16 | 1,155.09 | 1,054.11 | ||||
| Area_MN (a) | 0.814 | 2.277 | 1.099 | 3.626 | 3.352 | 3.207 | ||||
| Shape_MN (a) | 41,514.20 | 22,816.70 | 27,610.60 | 3,550.10 | 5,088.10 | 16,490.50 | ||||
| Patch size radius (m) | Number of Disjunct Core Areas | |||||||||
| 100 | 210 | 97 | 633 | 323 | 143 | 300 | ||||
| 200 | 48 | 34 | 93 | 50 | 84 | 84 | ||||
| 400 | 3 | 17 | * | 2 | 17 | 12 | ||||
| Dependant | Independent | n | df | R² | P | F | Regression Equation | Slope SE |
|---|---|---|---|---|---|---|---|---|
| LaBo | LPI (a) | 6 | 4 | 0.698 | 0.038 | 9.25 | Ŷ = 1.20 + 0.111 LPI (a) | 0.037 |
| LaBo | Shape_MN (a) | 6 | 4 | 0.822 | 0.013 | 18.5 | Ŷ = 117 − 86.6 SHAPE_MN (a) | 19.942 |
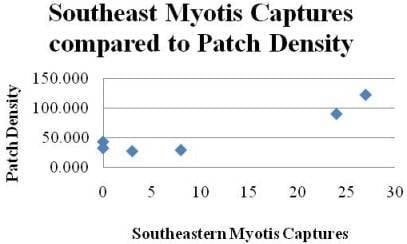
| MyAu | PD (a) | 6 | 4 | 0.856 | 0.008 | 23.8 | Ŷ = −6.08 + 0.284 PD (a) | 0.058 |
| MyAu | Area MN (a) | 6 | 4 | 0.727 | 0.032 | 10.65 | Ŷ = 30.9 – 8.58 AREA_MN (a) | 7.094 |
| TC | Area MN (a) | 6 | 4 | 0.662 | 0.049 | 7.83 | Ŷ = 30.9 – 8.58 AREA_MN (a) | 16.983 |
| TC | PD (a) | 6 | 4 | 0.801 | 0.016 | 16.1 | Ŷ = 16.5 + 0.591 PD (a) | 0.147 |
3.2. Discussion
4. Conclusions
Acknowledgements
References
- Gehrt, S.D.; Chelsvig, J.E. Bat activity in an urban landscape: patterns at the landscape and microhabitat scale. Ecol. Appl. 2003, 13, 939–950. [Google Scholar] [CrossRef]
- Montiel, S.; Estrada, A.; León, P. Bat assemblages in a naturally fragmented ecosystem in the Yucatan Peninsula, Mexico: species richness, diversity, and spatio- temporal dynamics. J. Trop. Ecol. 2006, 22, 267–276. [Google Scholar] [CrossRef]
- Cosson, J.F.; Pons, J.M.; Masson, D. Effects of forest fragmentation on frugivorous and nectarivorous bats in French Guiana. J. Trop. Ecol. 1999, 15, 515–534. [Google Scholar] [CrossRef]
- Gorresen, P.M.; Willig, M.R.; Stauss, R.E. Multivariate analysis of scale dependent associations between bats and landscape structure. Ecol. Appl. 2005, 15, 2126–2136. [Google Scholar] [CrossRef]
- Menzel, M.A.; Menzel, J.M.; Edwards, W.M.; Carter, T.C.; Churchill, J.B.; Kilgo, J.C. Home range and habitat use of male Rafinesque’s big-eared bats (Corynorhinus rafinesquii). Amer. Midland Naturalist 2001, 145, 402–408. [Google Scholar]
- Menzel, M.A.; Menzel, J.M.; Carter, T.C.; Ford, W.M.; Edwards, J.W. Review of the Forest Habitat Relationships of the Indiana bat (Myotis sodalis); General Technical Report NE-284; USDA, Forest Service: Washington, DC, USA, 2001; pp. 1–21. [Google Scholar]
- Cochran, S.M. Roosting and Habitat Use by Rafinesque’s Big-Eared Bat and Other Species in a Bottomland Hardwood Forest Ecosystem. Master Thesis, Arkansas State University, Jonesboro, AR, USA, 1999. [Google Scholar]
- Mirowsky, K.-M.; Horner, P.A.; Maxey, R.W.; Smith, S.A. Distributional records and roosts of southeastern myotis and Rafinesque's big-eared bats (Corynorhinus rafinesquii) in eastern Texas. Southwest. Naturalist 2004, 49, 294–298. [Google Scholar] [CrossRef]
- Wilf, L.M. The Species Composition and Habitat Use by Bat Populations in Delta National Forest, Mississippi. Master Thesis, Arkansas State University, Jonesboro, AR, USA, 2003; pp. 1–140. [Google Scholar]
- Clark, M.K. Roosting Ecology of the Eastern Big-Eared Bat, Plecotus rafinesquii, in North Carolina. Master of Science Thesis, North Carolina State University, Raleigh, NC, USA, 1990. [Google Scholar]
- Sealander, J.A.; Heidt, G.A. Arkansas Mammals: Their Natural History, Classification, and Distribution; The University of Arkansas Press: Fayetteville, NC, USA, 1990; pp. 1–308. [Google Scholar]
- Hefner, J.M.; Brown, J.D. Wetland trends in the southeastern United States. Wetlands 1985, 4, 1–11. [Google Scholar] [CrossRef]
- Tiner, R.W. Wetland Trends of the United States: Current Status and Recent Trends; US Fish and Wildlife Service: Washington, DC, USA, 1984; pp. 1–59. [Google Scholar]
- Twedt, D.J.; Loesch, C.R. Forest areas and distribution in the Mississippi alluvial valley: implications for breeding bird conservation. J. Biogeogr. 1999, 26, 1215–1224. [Google Scholar] [CrossRef]
- Medlin, R.E., Jr. Population and Distribution of the Rafinesque Big-Eared Bat and the Southeastern Myotis in the Bottomlands of Arkansas. Master Thesis, Arkansas State University, Jonesboro, AR, USA, 2007; pp. 1–145. [Google Scholar]
- Medlin, R.E., Jr.; Risch, T.S. Habitat associations of bottomland bats, with focus on Rafinesque’s big-eared bat and the southeastern myotis. Amer. Midland Naturalist 2008, 160, 400–412. [Google Scholar] [CrossRef]
- Fokidis, H.B.; Brandebura, S.C.; Risch, T.S. Distributions of bats in bottomland hardwood forests of the Arkansas delta region. J. Ark. Acad. Sci. 2005, 59, 51–56. [Google Scholar]
- Medlin, R.E., Jr.; Brandebura, S.C.; Fokidis, H.B.; Risch, T.S. Distribution of Arkansas’s bottomland bats. J. Ark. Acad. Sci. 2006, 60, 189–191. [Google Scholar]
- Duchamp, J.E.; Arnett, E.B.; Larson, M.A; Swihart, R.K. Ecological considerations for landscape-level management of bats. In Bats in Forests: Conservation and Management; Lacki, M.J., Hayes, J.P., Kurta, A., Eds.; The Johns Hopkins University Press: Baltimore, MD, USA, 2006; pp. 237–261. [Google Scholar]
- Fauth, P.T.; Gustafson, E.J.; Rabenold, K.N. Using landscape metrics to model source habitat for neotropical migrants in the midwestern U.S. Landscape Ecol. 2000, 15, 621–631. [Google Scholar] [CrossRef]
- Yates, M.D.; Muzika, R.M. Effect of forest structure and fragmentation on site occupancy of bat species in Missouri Ozark forests. J. Wildlife Manage. 2006, 70, 1238–1248. [Google Scholar] [CrossRef]
- Hecker, K.R.; Brigham, R.M. Does moonlight change vertical stratification of activity by forest-dwelling insectivorous bats? J. Mammal. 1999, 80, 1196–1201. [Google Scholar] [CrossRef]
- Pavri, F.; Aber, J.S.; Wallace, J.A.; Novak, M.C. Monitoring forest cover trends in northeastern Kansas through historical and multi-temporal satellite image analysis. Trans. Kans. Acad. Sci. 2003, 106, 2–10. [Google Scholar] [CrossRef]
- Everitt, J.H.; Yang, C.; Escobar, D.E.; Lonard, R.I. Reflectance characteristics and remote sensing of a riparian zone in South Texas. Southwest. Nat. 2002, 47, 433–439. [Google Scholar] [CrossRef]
- Fraisse, C.W.; Sudduth, K.A.; Kitchen, N.R. Delineation of site-specific management zones by unsupervised classification of topographic attributes and soil electrical conductivity. Transa. Amer Soc. Agric. Engineers 2001, 44, 155–166. [Google Scholar] [CrossRef]
- McGarigal, K.; Cushman, S.A.; Neel, M.C.; Ene, E. FRAGSTATS: Spatial Pattern Analysis Program for Categorical Maps; University of Massachusetts: Amherst, MA, USA, 2002; Available online: http://www.umass.edu/landeco/research/fragstats/fragstats.html (accessed on 29 September 2010).
- Brigham, R.M. Bats in forests: What we know and what we need to learn. In Bats in Forests; Lacki, M.J., Hayes, J.P., Kurta, A., Eds.; The Johns Hopkins University Press: Baltimore, MD, USA, 2007; pp. 1–15. [Google Scholar]
- Gaines, K.F.; Boring, C.S.; Porter, D.E. The development of a spatially explicit model to estimate radiocaesium body burdens in raccoons (Procyon lotor) for ecological risk assessment. Sci. Total Envir. 2005, 341, 15–31. [Google Scholar] [CrossRef]
- Brandebura, S.C.; Medlin, R.E., Jr.; Risch, T.S. New evidence for maternity colonies of the Indiana bat in the delta of Arkansas. J. Ark. Acad. Sci. 2006, 60, 169–170. [Google Scholar]
- Duchamp, J.E; Swihart, R.K. Shifts in bat community structure related to evolved traits and features of human-altered landscapes. Landscape Ecol. 2008, 23, 849–860. [Google Scholar] [CrossRef]
- Struebig, M.J.; Kingston, T.; Zubaid, A.; Mohd-Adnan, A.; Rossiter, S.J. Conservation value of forest fragments to Paleotropical bats. Biol. Conserv. 2008, 10, 1016. [Google Scholar]
- Krusic, R.A.; Yamasaki, M.; Neefus, C.D.; Pekins, P.J. Bat habitat use in White Mountain National Forest. J. Wildlife Manage. 1996, 60, 625–631. [Google Scholar] [CrossRef]
- Johnson, J.B.; Gates, J.E.; Ford, W.M. Distribution and activity of bats at local and landscape scales within a rural-urban gradient. Urban Ecosyst. 2008, 11, 227–242. [Google Scholar] [CrossRef]
- Jaenike, J.R. A steady state model of genetic polymorphism on islands. The Amer. Natur. 1973, 107, 793–795. [Google Scholar]
- Estrada, A.; Coates-Estrada, R.; Merritt, D., Jr. Bat species richness and abundance in tropical rain forest fragments and in agricultural habitats at Los Tuxtlas, Mexico. Ecography 1993, 16, 309–318. [Google Scholar] [CrossRef]
- Soberon, J.M.; Llorente, J.B. The use of species accumulation functions for the prediction of species richness. Conserv. Biol. 1993, 7, 480–488. [Google Scholar]
- Moreno, C.E; Halffter, G. Assessing the completeness of bat biodiversity inventories using species accumulation curves. J. Appl. Ecol. 2000, 37, 149–158. [Google Scholar] [CrossRef]
- Duchamp, J.E.; Swihart, R.K. Shifts in bat community structure related to evolved traits and features of human-altered landscapes. Landscape Ecol. 2008, 23, 849–860. [Google Scholar] [CrossRef]
- Gorresen, P.M.; Willig, M.R. Landscape responses of bats to habitat fragmentation in Atlantic forests of Paraguay. J. Mammal. 2004, 85, 688–697. [Google Scholar] [CrossRef]
Appendix A
| Acronym | Metric | Definition | Formula |
|---|---|---|---|
| TA | Total Area | Total amount of land in class (m²) | ∑(i = 1, n) A |
| TE | Total Edge | Total edge in a land class (m) | ∑(k = 1, m) eik |
| LSI | Landscape Shape Index | A measure of class aggregation | ei/min ei |
| ED | Edge Density | Edge length on a unit basis (m/ha) | (E/A)*10,000 |
| LPI | Length to Perimeter Index | Percentage landscape occupied by a class (m²) | (max aij/A)*(100) |
| Contig_MN | Mean Contagion Index | A measure of connectivity | |
 | |||
| Area_MN | Mean Patch Area | Sum of patch area divided by number of patches | 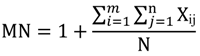 |
| Frac_MN | Mean Fractal Dimension Index | Shape complexity that relates perimeter to area | (2*(ln(0.25pij))) / ln(aij) |
| Para_MN | Mean Perimeter to Area RatioA measure of shape complexity | A measure of shape complexity | pij/aij |
| Shape_MN | Mean Shape | Increases without limit as shape becomes irregular | pij/min pij |
| PD | Patch Density | The number of patches in a landscape (N/100 ha) | (ni/A)*(10,000)(100) |
| NDCA | Number of Disjunct Core Areas | Number of core areas based upon edge depth | ∑(j = 1, n) Nijc |
© 2010 by the authors; licensee MDPI, Basel, Switzerland. This article is an open access article distributed under the terms and conditions of the Creative Commons Attribution license (http://creativecommons.org/licenses/by/3.0/).
Share and Cite
Medlin, R.E., Jr.; Connior, M.B.; Gaines, K.F.; Risch, T.S. Responses of Bats to Forest Fragmentation in the Mississippi River Alluvial Valley, Arkansas, USA. Diversity 2010, 2, 1146-1157. https://doi.org/10.3390/d2101146
Medlin RE Jr., Connior MB, Gaines KF, Risch TS. Responses of Bats to Forest Fragmentation in the Mississippi River Alluvial Valley, Arkansas, USA. Diversity. 2010; 2(10):1146-1157. https://doi.org/10.3390/d2101146
Chicago/Turabian StyleMedlin, Rex E., Jr., Matthew B. Connior, Karen F. Gaines, and Thomas S. Risch. 2010. "Responses of Bats to Forest Fragmentation in the Mississippi River Alluvial Valley, Arkansas, USA" Diversity 2, no. 10: 1146-1157. https://doi.org/10.3390/d2101146