Article

Distribution of the Genus Passiflora L. Diversity in Colombia and Its Potential as an Indicator for Biodiversity Management in the Coffee Growing Zone

by
John Ocampo
1,2,*,
Geo Coppens D’Eeckenbrugge
3 and
Andy Jarvis
1
1
International Center for Tropical Agriculture (CIAT), A.A. 6713, Cali, Colombia
2
Universidad Nacional de Colombia sede Palmira (UNAPAL), Kra. 32 Chapinero, vía Candelaria, Palmira, Valle del Cauca, Colombia
3
Centre de Coopération Internationale en Recherche Agronomique pour le Développement (CIRAD), UMR 5175 CEFE, 1919 Route de Mende, 34293 Montpellier, France
*
Author to whom correspondence should be addressed.
Diversity 2010, 2(11), 1158-1180; https://doi.org/10.3390/d2111158
Submission received: 25 September 2010 / Revised: 29 October 2010 / Accepted: 4 November 2010 / Published: 15 November 2010

Abstract

:
Analysis was made of 3,923 records of 162 wild Passiflora specimens to assess the distribution of their diversity in Colombia, identify collection gaps, and explore their potential as indicator species. Despite variable collecting density among and within biogeographic regions, the Andean region clearly presents a higher species richness, particularly in the central coffee growing zone and the departments of Antioquia, Cundinamarca and Valle del Cauca. The elevational distribution of diversity shows a small peak below 500 m, and two higher ones between 1,000–2,000 and 2,500–3,000 m. This pattern corresponds to divergent adaptive trends among infrageneric divisions. The analysis on 19 climatic variables showed that the two principal variance components, explaining 77 percent of the total, are respectively associated with temperature and precipitation, without influence of seasonality. Distribution parameters allow recognizing more than 36 narrow endemics. Prediction of species distribution showed nine areas with very high richness (predicted sympatry of 41 to 54 species) in the Andean region, three of which correspond to collection gaps. Endemics were not particularly frequent there, so a prioritization of protected areas based on species richness would not favor their conservation. The sites with high Passiflora diversity are poorly represented in the current system of protected areas. Instead, their striking correspondence with ecotopes of the coffee growing zone imposes a conservation strategy integrating agricultural and environmental management at the landscape level. Reciprocally, several traits of Passiflora species make them particularly suited as indicators for any effort of conservation or restoration in this region of importance for the country.

Graphical Abstract

1. Introduction

Colombia is divided into five main biogeographic regions [1]. The Andean region presents a highly diverse topography (100–5,400 m), with three mountain ranges, the Eastern, Central and Western Cordilleras, separating two main inter-Andean valleys from the other regions. The uplift of the Andes created new habitats and increased local isolation, favoring high speciation rates in many taxa [2]. The continuously humid climate of the Amazonian and Orinoquian lowlands and the extremely wet climate of the Pacific region contrasts with the drier and more seasonal climate of the Caribbean. As a result, the Colombian flora includes some of the world’s most diverse groups of vascular plants, with 51,220 documented species [3,4,5]. It is hoped that most of this floristic richness is located in the protected areas that cover 365,120 km2, approximately 32 percent of the territory [6], falling under different categories of protection, including Natural National Parks, Flora and Fauna Sanctuaries, Natural National Reserves, Unique Natural Areas, Park Ways and Indigenous Areas, among others. Smaller forest reserves have also been created to protect river basins for water supply. On the other hand, destruction of many natural habitats has drastically affected species, often reducing their historical ranges to a set of small, fragmented populations. Such alteration is predicted to lead to substantial extinction in the near future [6]. Within the field of conservation biology as a whole, and protected area management in particular, it is becoming increasingly urgent to develop spatial and temporal predictions of how significant environment changes, and, particularly, multiple anthropogenic threats, may affect the abundance and distribution of species [7,8]. Bioclimatic modeling can provide first-cut estimates of risk of biodiversity loss even where species distribution data are relatively poor [8].
Many conservation biologists have focused their attention on areas presenting high levels of endemism and diversity, and experiencing a high rate of loss of ecosystems. Such regions concentrating biodiversity under threat are defined as biodiversity hotspots, representing priorities for conservation actions [9]. The tropical Andes are considered one of these hotspots, as they support almost half of the Neotropical biodiversity [10]. However, the application of this concept in the case of Colombia implies the development of wide studies to investigate the distribution of biodiversity, at an operational resolution level across the country. Complete inventories are not realistic at that scale, so other approaches have been taken to exploit incomplete biodiversity data, combining remote sensing and field sampling/inventories of indicator taxa at different scales [11]. We proposed the use of climatic niche modeling and tested the potential of Passiflora as an indicator of biodiversity in Colombia, as Passifloraceae represent several interesting traits in terms of diversity, adaptation and evolution.
Indeed, Colombia is particularly rich in Passifloraceae, with 167 species from Ancistrothyrsus (2), Dilkea (4) and Passiflora (162) genera, mostly in the Andean region (123 species). The country has 57 endemic species, 95 percent of them Andean, implying a high extinction risk as this region is the most densely populated and disturbed, particularly the coffee growing zone [12]. According to the Von Humboldt Institute, the Universidad Nacional de Colombia [13], and Ocampo et al. [12], more than 100 Colombian Passifloraceae species are threatened to some degree, and three species are considered extinct.
Neotropical Passifloraceae include about 650 species from the genera Ancistrothyrsus, Dilkea, Mitostemma and Passiflora [14]. The largest one is Passiflora, with ca. 575 species distributed in a wide range of habitats, from humid rain forests to semi-arid subtropics. Most of them are herbaceous or woody vines, while a few are trees or shrubs. More than 80 species produce an edible fruit, the most interesting ones belonging to subgenera Passiflora and Tacsonia [15,16]. Among them, are the yellow and purple maracuja, P. edulis Sims, with a world production estimated at more than 805,000 tons [17], and more than 13 species/forms present on the national or local markets of Colombia [12]. Passiflora species also present ornamental and pharmaceutical interest [16]. Killip’s [18] classification divided Passiflora into 22 subgenera. It was amended by Escobar [19,20], who merged two subgenera and proposed a new one, and by MacDougal [21], who revised subgenus Plectostemma, restoring its ancient name Decaloba. In 2003, Feuillet and MacDougal [22] proposed a deeper revision, recognizing only four subgenera, Astrophea, Decaloba, Deidamioides and Passiflora. This proposal has been partially justified by molecular data [23,24,25,26], however further studies are still needed for understanding Passifloraceae diversity and evolution.
As vines, most Passiflora species have adapted to many different habitats, particularly for their support. They are medium-lived organisms depending on longer-lived trees and shrubs, which makes them responsive to both medium and long-term changes. They also show high levels of co-evolution with their herbivores, particularly Heliconius butterflies [27], and some species even exhibit elements of the carnivory syndrome [28]. They have developed mutualism with protector insects as nectar-feeding ants [29], and with a wide range of pollinators, including small and large insects, birds and bats [30,31]. Finally, given its economic importance, the genus Passiflora constitutes an important genetic resource, and the characterization of wild and cultivated populations is seen as a priority for Andean countries because of its potential for development and crop diversification [32]. Strategies for conservation and improvement are needed to optimize the use and conservation of this resource.
Biodiversity data have been traditionally produced through a variety of complementary approaches using field survey and sampling, museum records, botanical collections, and, in recent times, spatial analysis of data integrated within Geographical Information Systems (GIS). In each area, the combination of geological, edaphic, climatic, ecological, historical and anthropic factors produces a unique range of constraints defining patterns of diversity [33]. GIS allow building maps of species richness, potential distribution and endemism, prioritizing areas for conservation based on principles such as complementarity, and assessing the completeness of existing protected areas networks [34]. Several methods use climatic variables as the principal drivers of herbarium or collecting data, generating information for diversity studies and conservation actions [35,36]. Such modeling tools have been applied to problems of phytogeography [37,38], conservation [39,40], evolutionary ecology [41], invasive or endemic species management [42,43,44], potential areas for plant collection [45,46] and the effect of climate change on crop wild relatives [47]. In Passiflora, Segura et al. [48] mapped the potential distribution of five species of the subgenus Tacsonia and produced evidence of intra-specific variation in climatic adaptation along the Andes, from Colombia to Peru.
The present study was conducted through (1) assessing the geographic distribution of Colombian Passifloraceae; (2) analyzing it in terms of species richness across the territory; (3) inferring the potential distribution of each species with predictive distribution models; (4) summing these spatial predictions to produce a map of potential diversity; and (5) locating collecting gaps by detecting those areas where Passiflora species are likely to occur but have not yet been collected. Combining these results permits an analysis of the current status of in situ and ex situ conservation of Passiflora in Colombia. It also provides elements to evaluate the potential of this group as an indicator for the detection of biodiversity hotspots and monitoring of conservation/restoration efforts.

2. Material and Methods

2.1.Geography and Climate

Colombia is located in the north of South America, between 12°26’46” N and 4°13’30” S and between 66°50’54” W and 79°02’33” W, covering an area of 1,141,748 km2, with altitudes ranging from the sea level to 5,775 m [1]. It is divided in 32 departments (see Supplementary Figure 1: Colombia’s geopolitical division in 32 departments and biogeographic division in five regions.). Figure 1 shows their distribution among the five biogeographic regions of the country [1]. Colombian climates are tropical, with relatively uniform temperatures throughout the year. Precipitations vary greatly, with some of the wettest parts of the world in the Pacific lowlands (average annual rainfall reaching 10,000 mm) contrasting with extremely dry areas in the coast (<500 mm per year), and show a tendency to increase with altitude.

2.2. Species Distribution and Richness

The original plant dataset consists of the information gathered and georeferenced by Ocampo et al. [12] from 3,930 individuals of 167 Passifloraceae species, consisting of 3,330 herbarium specimens (AFP, CAUP, CDMB, CHOCO, COL, COAH, CUVC, FAUC, FMB, HUA, HUQ, JAUM, K, MA, MEDEL, MO, NY, P, PSO, SURCO, TOLI, VALLE and UIS), 555 field records, and 45 records from Killip [18,49], Uribe [50] and Escobar [19,20,51]. The few specimens from genera Ancistrothyrsus (three) and Dilkea (four) brought too limited information, as compared to Passiflora, so they were not taken into account in the analysis presented here.
Figure 1. Collection localities (blue dots) of Passiflora specimens used in this study among 32 Colombian departments and five biogeographic regions (see Supplementary Figure 1).
Diversity 02 01158 g001
Species distribution was plotted on dot-maps using the DIVA-GIS software and quantified by their maximum distance (MaxD) and circular area (CAr) according to Hijmans et al. [52]. For each species, MaxD is the longest distance between any pair of observations, and CA50 was calculated by assigning a circle of radius 50 km to each observation and calculating the area covered by all circles. As in a previous paper [12], we used the following threat criteria: a number of observations under six characterizes rare species, MaxD under 100 km and CA50 under 20,000 km2 characterize narrow endemics.
Species richness was calculated as the number of species within a defined area, superimposing species location maps, using the point-to-grid richness analysis tool in DIVA-GIS with a 0.1 × 0.1° grid (i.e., 12 × 12 km at the Equator). The circular neighborhood option was applied with a 2° radius [37] to eliminate border effects due to assignation of the grid origin.

2.3. Climatic Adaptation and Modeling

Climatic models were developed to predict species occurrence, with DIVA-GIS. This package uses WorldClim data [52], consisting of global climate surfaces with a 30” grid resolution (i.e., 1 × 1 km at the Equator), derived from a network of over 12,500 meteorological stations across Latin America, 1,479 of them in Colombia. For each collection site, 19 bioclimatic variables (derived from 12 monthly means for temperature, rainfall and diurnal temperature range according to Busby [53]) were extracted. Principal components analysis (PCA) was performed on the resulting dataset, applying a varimax normalized rotation. For readability, the centroid, i.e., the arithmetic average of the factor scores, was used to represent each species climatic preferences.
Potential species distributions were mapped by extrapolation, using the 19 bioclimatic variables and the DIVA-GIS BioClim method for the 80 species with more than 10 observations. BioClim was chosen because it is a robust methodology, requiring presence-only data [54]. Unfortunately, many of the omitted 85 native species, too poorly represented for reliable results, are endemic and/or rare species. Finally, an analysis of complementarity [55] was applied to identify the lowest number of protected areas needed for the conservation of native Passiflora species.

3. Results and Discussion

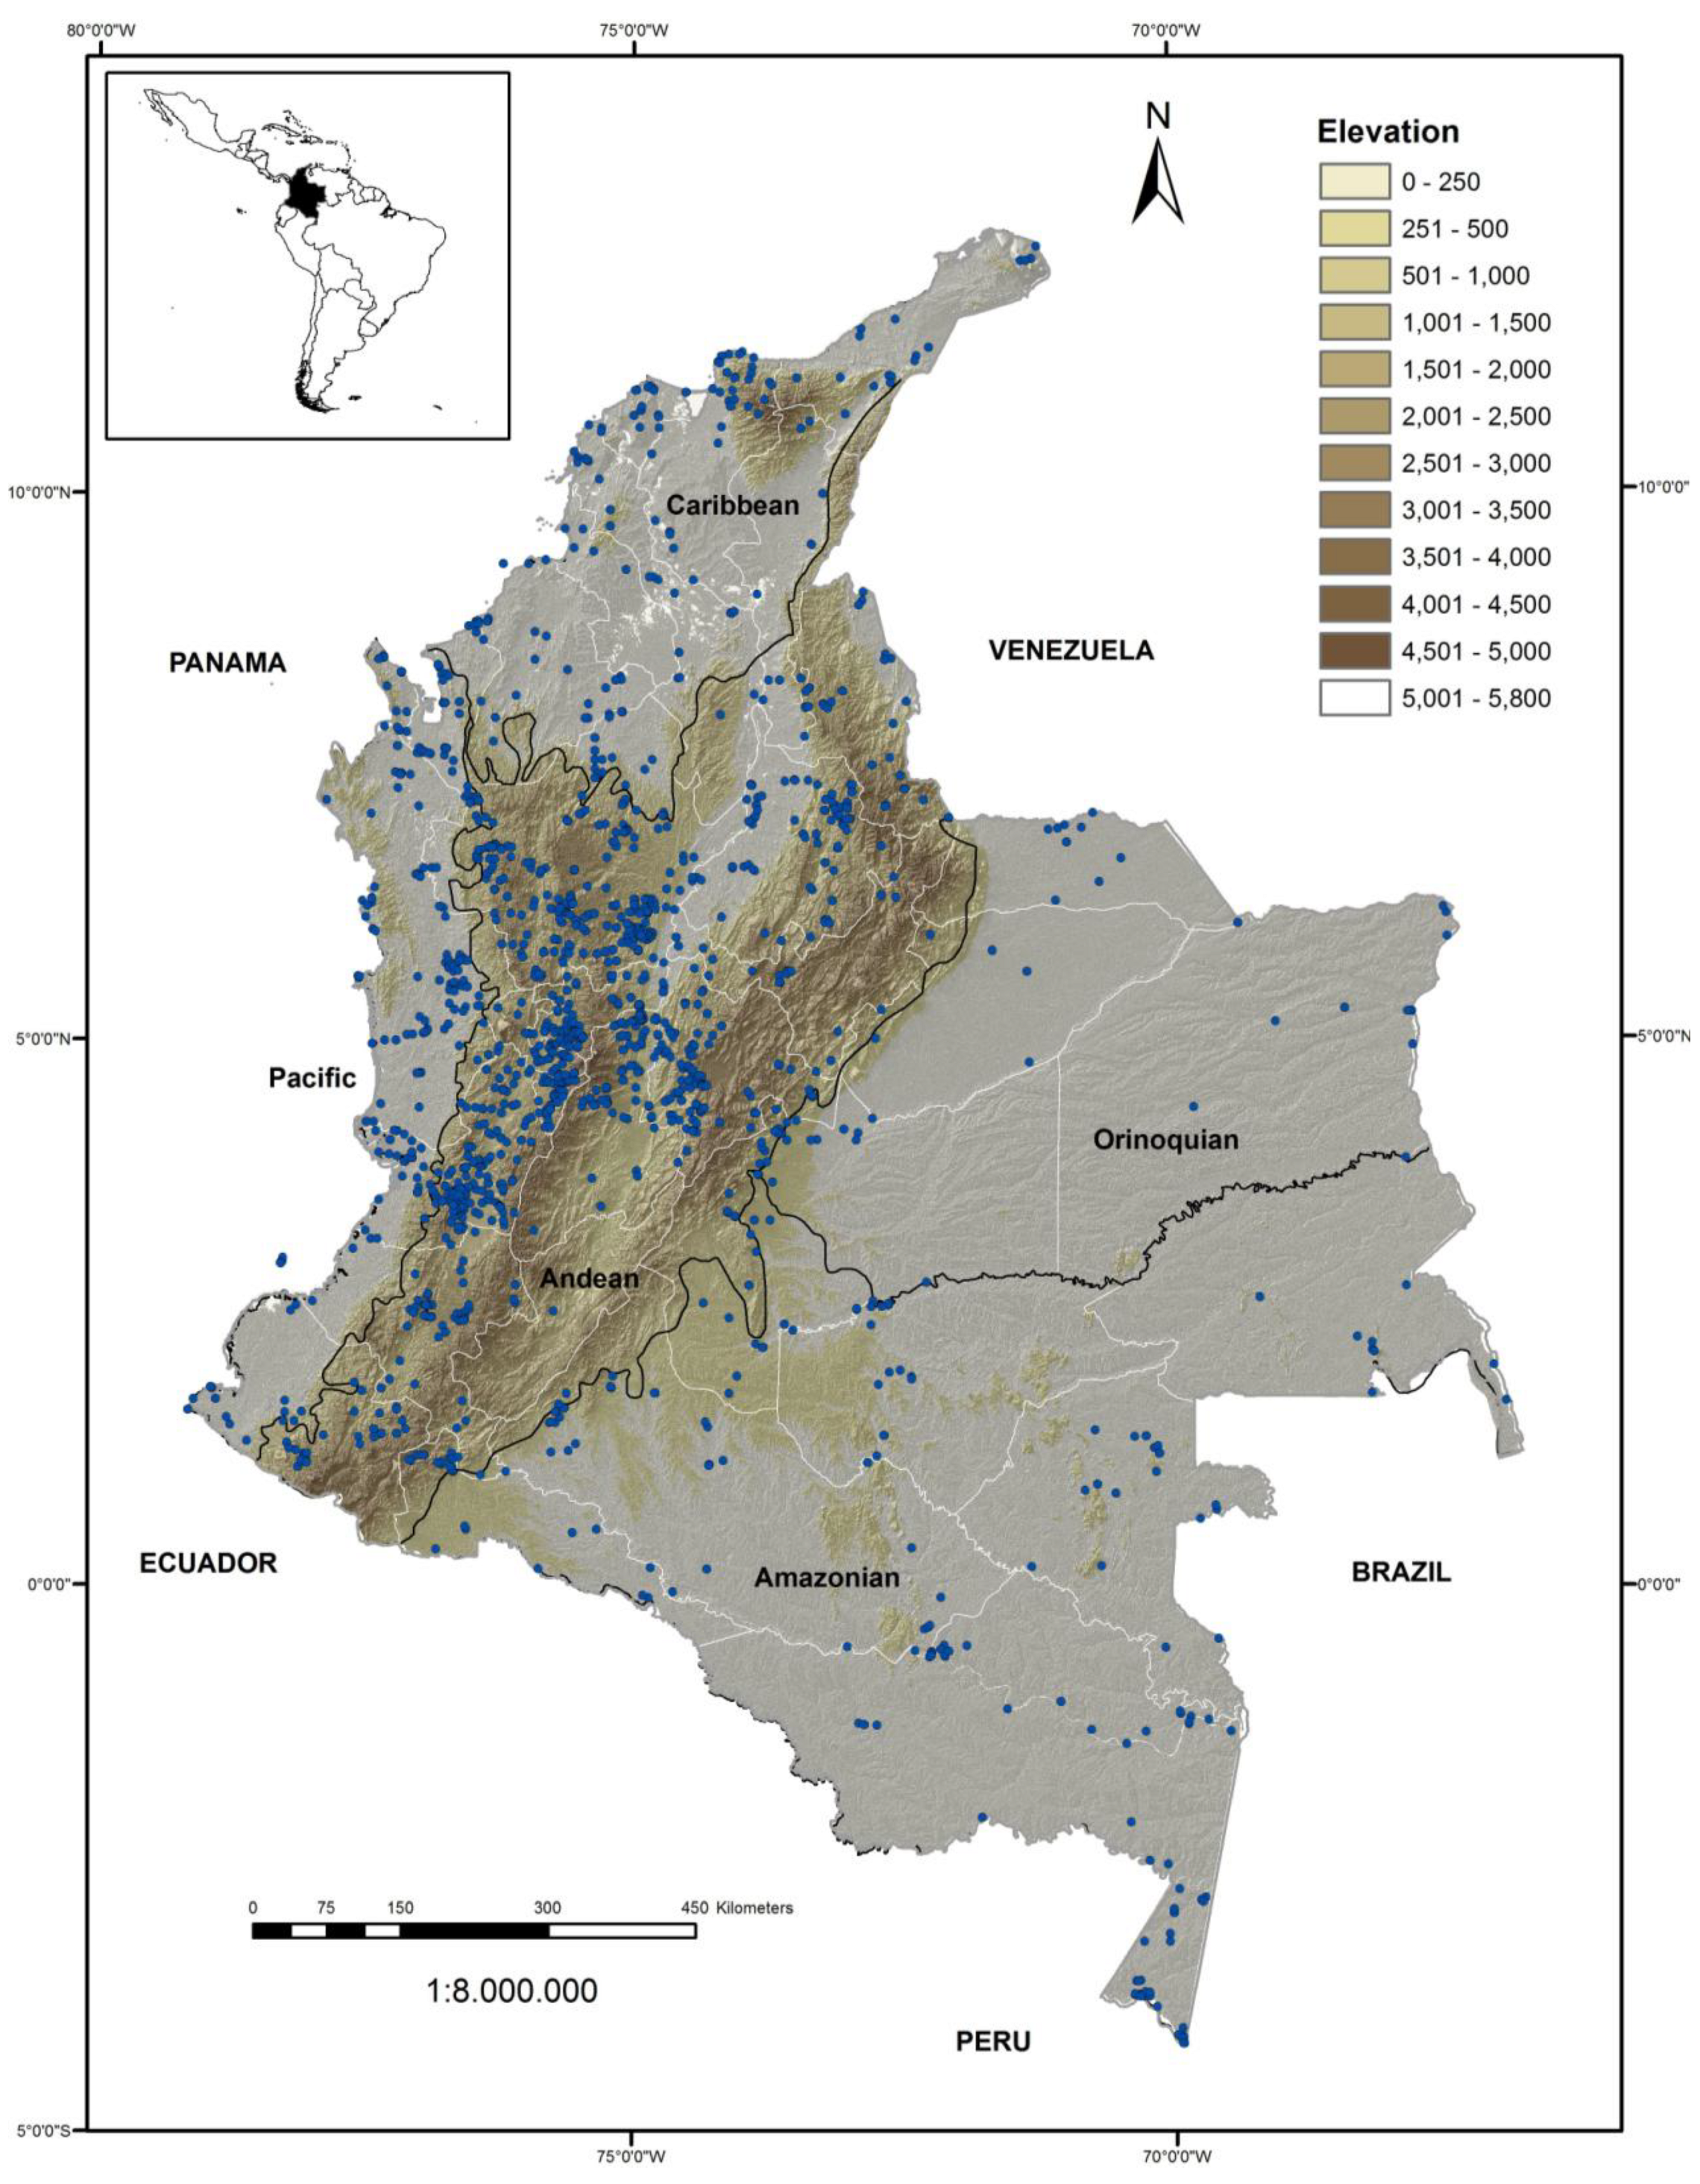
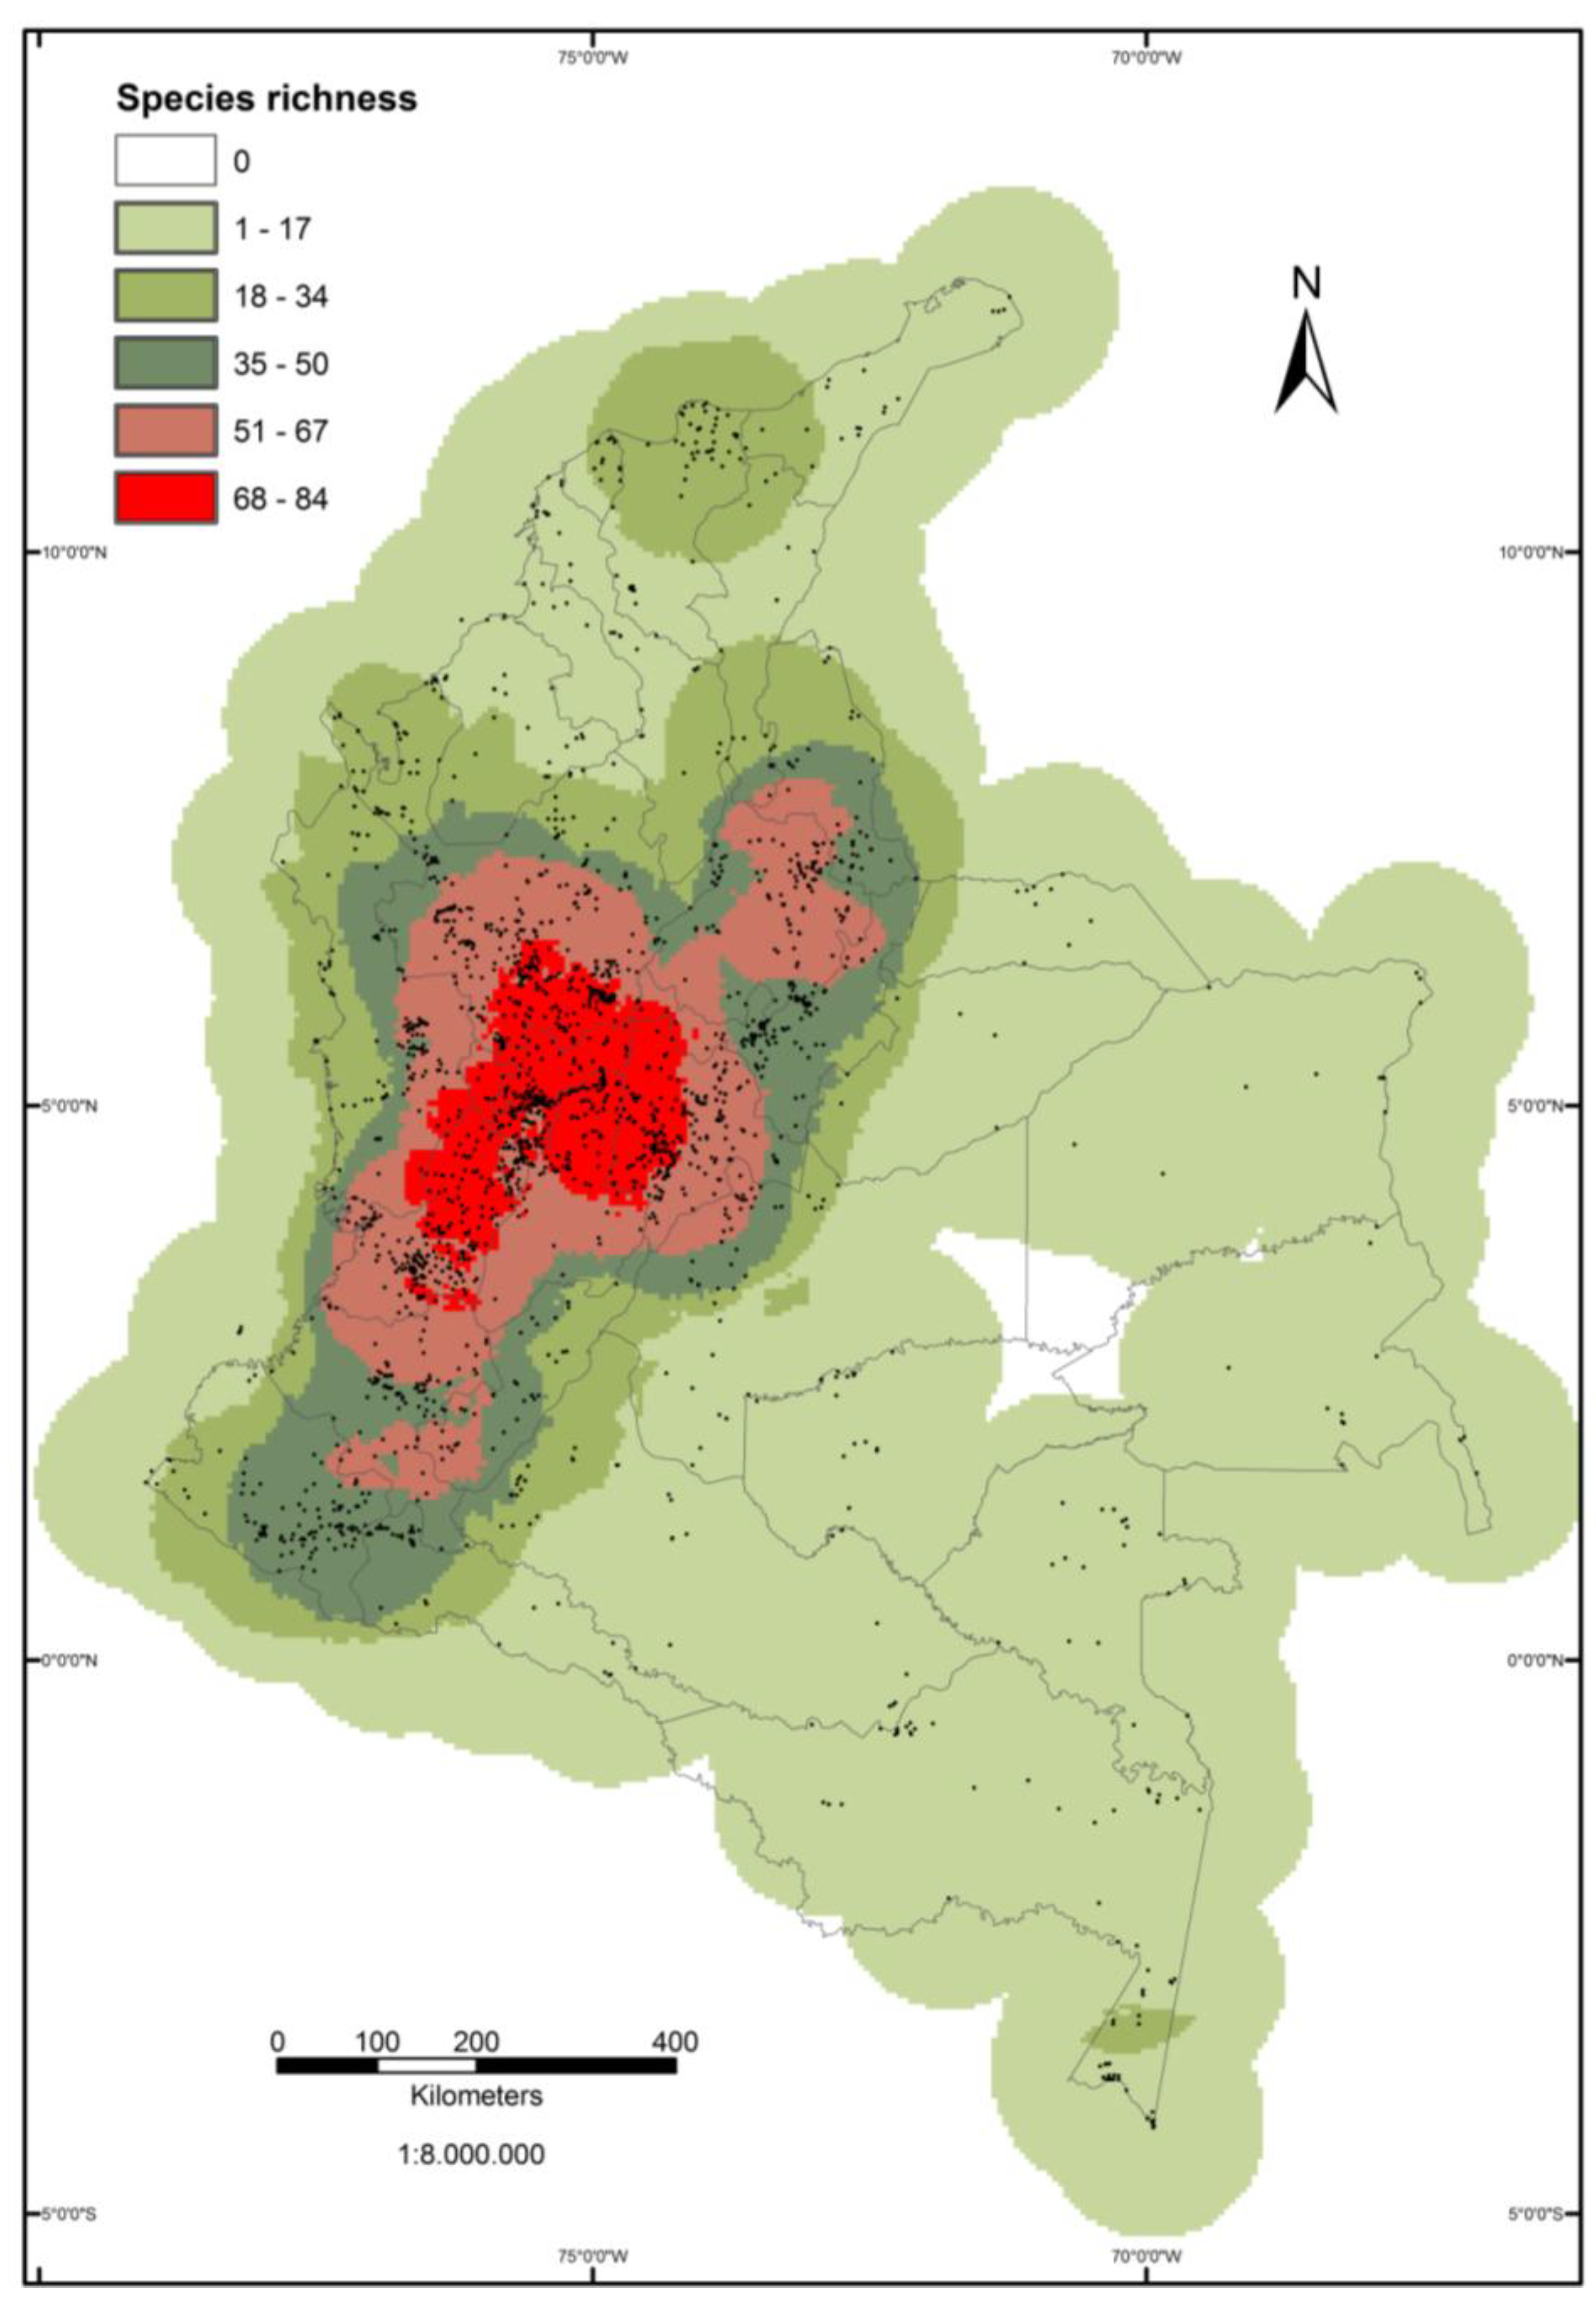
3.1. Distribution of Observations and Species Richness/Diversity

Figure 2 and Table 1 show the distribution of collection/observation points. The Andean region of Central Colombia is by far the most densely explored, particularly the central coffee growing zone (Quindío, Caldas and Risaralda; 18.93 to 77.20 observations/1,000 km²) and the three large departments of Antioquia, Valle del Cauca and Cundinamarca (12.45 to 19.82 observations/1,000 km²). By comparison, the northeastern Andes (Boyacá, Santander, and Norte de Santander) and the central department of Tolima appear less well explored (3.59 to 9.39 observations/1000 km²). The situation is more difficult to appreciate in the southern Andes, as the southern departments of Cauca and Nariño also belong in good part to the Pacific region. However, they show a collection density only slightly superior to that of Chocó, which indicates that they have also been less explored than the central Andes. The situation is heterogeneous in the Caribbean, with only two of its seven departments exhibiting more than three observations/1,000 km² (excluding the atypical case of the small San Andrés and Providencia islands). Finally, the Amazonian and the Orinoquian are by far the least explored biogeographic regions of the country, although they cover half of its area.
The mean number of observations per species also reflects variation in exploration among departments (Table 1), confirming the much denser exploration in the Andes of Antioquia, Cundinamarca and Valle del Cauca (more than seven observations/species) and in the Pacific region, while this ratio takes much lower values in the other regions. However, the relation between exploration density and this indicator is not simple, as the numerous observations in the central coffee growing zone are distributed among a very wide diversity of species, so the mean number of observations/species is not as high as could be expected for such densely explored areas.
Figure 2. Species richness observed for Passiflora in 0.1 × 0.1° grid cells in Colombia (162 species). Points on the map represent sites of collection.
Diversity 02 01158 g002
Table 1. Number of observations, species, rare and endemic Passiflora species by Colombian division (see Supplementary Figure 1).
Biogeographic region/departmentArea (km2)Nb. observ.Nb. observ./ 1,000 km2Total SpeciesTotal species/ 1,000 km2Total species/ Log. areaObserv./ speciesRare speciesEndemic species
Andean
Antioquia62.86978312.45681.0814.17111.51286
Boyacá23.0121456.30361.567.5024.03141
Caldas7.29124533.60364.947.5026.81141
Cundinamarca23.94241917.50532.2111.0457.91230
Huila18.331623.38221.204.5852.82180
Quindío1.94315077.203819.567.9193.95250
Norte de Santander22.007793.59361.647.5022.19250
Risaralda3.5926818.93246.685.0022.83200
Santander30.5372076.78481.5710.0034.31313
Tolima22.6722139.39431.908.9614.95274
Andean and Pacific
Cauca30.9851615.20421.368.7533.83241
Nariño32.0461705.30441.409.1703.79270
Valle del Cauca21.19542019.82562.6911.6707.38281
Pacific
Chocó46.5302104.51390.848.3565.38231
Caribbean3.319185.4272.111.4592.5750
Atlántico
Bolívar26.469331.25150.573.1262.2091
Cesar22.213130.59100.452.0841.3090
Córdoba25.020331.3290.361.8763.6760
La Guajira20.848211.01120.582.5011.7590
Magdalena22.742843.69311.366.4602.71191
S. Andrés y Providencia53475.47237.740.4172.0020
Sucre10.91760.5530.270.6252.0020
Orinoquian
Arauca23.393100.4360.261.2501.6730
Casanare44.42840.0940.090.8341.0040
Meta85.286851.00240.284.9303.56140
Vichada100.242160.1690.091.8761.7860
Amazonian
Amazonas109.665850.75160.153.1755.31140
Caquetá91.725460.50170.203.4252.71130
Guainía70.691160.23100.142.0841.6090
Guaviare55.391270.49140.255.4181.93110
Putumayo24.885562.25261.042.9182.15200
Vaupés54.135340.63190.364.0141.79100
This variation in exploration of the Colombian territory is partly due to difficulty of access and/or social conflict. Data are poor and misleading in lowland forests, collections being limited along rivers in the Orinoquian and Amazonian and rare roads in the Pacific. Social conflict is the prevalent cause in the less explored Andean departments (Tolima, Santander, Norte de Santander and part of Boyacá) and in the Caribbean. Conversely, populated areas, particularly around main cities and their universities (Bogotá, Medellin, Cali, central coffee growing zone), have been densely explored.
However, despite this sampling bias among departments, all observation parameters point to a concentration of Passiflora collecting in the central Andes and, within these departments, in the coffee growing zone, a situation explained by both easier access and higher species richness.
Indeed, departments of the Andean region present clearly higher species richness (Table 1). The only non-Andean department showing a comparable richness is Chocó. In the Andes, Antioquia has by far the highest number of species (68), followed by Valle del Cauca and Cundinamarca. Concerning rare species, Santander (northeast) occupies the first place, with 31 species, followed by Valle del Cauca and Antioquia (28), and Nariño and Tolima (27). Thus, there is little doubt that a more thorough exploration north of the Eastern Cordillera (Santander) and south of the Central Cordillera (Tolima) would discover more specimens per species and/or more species. This is even more obvious for the Amazonian, Orinoquian and Pacific departments, given their poor richness/surface and observation/species ratios.
When species richness is related to department size, the most diverse area corresponds to the central coffee growing zone, as this ratio appears to be several times higher in Caldas, Risaralda and Quindío than in the other Andean departments. A precise comparison with departments of other regions is only possible if the species are equally sampled, i.e., if the number of observations per species is equivalent. This is the case for Chocó, Amazonas, and Córdoba, all of them showing a much lower diversity. The map of observed Passiflora diversity, as produced by the GIS analysis (Figure 2), confirms the importance of the Andes and the special contribution of the central coffee growing zone.

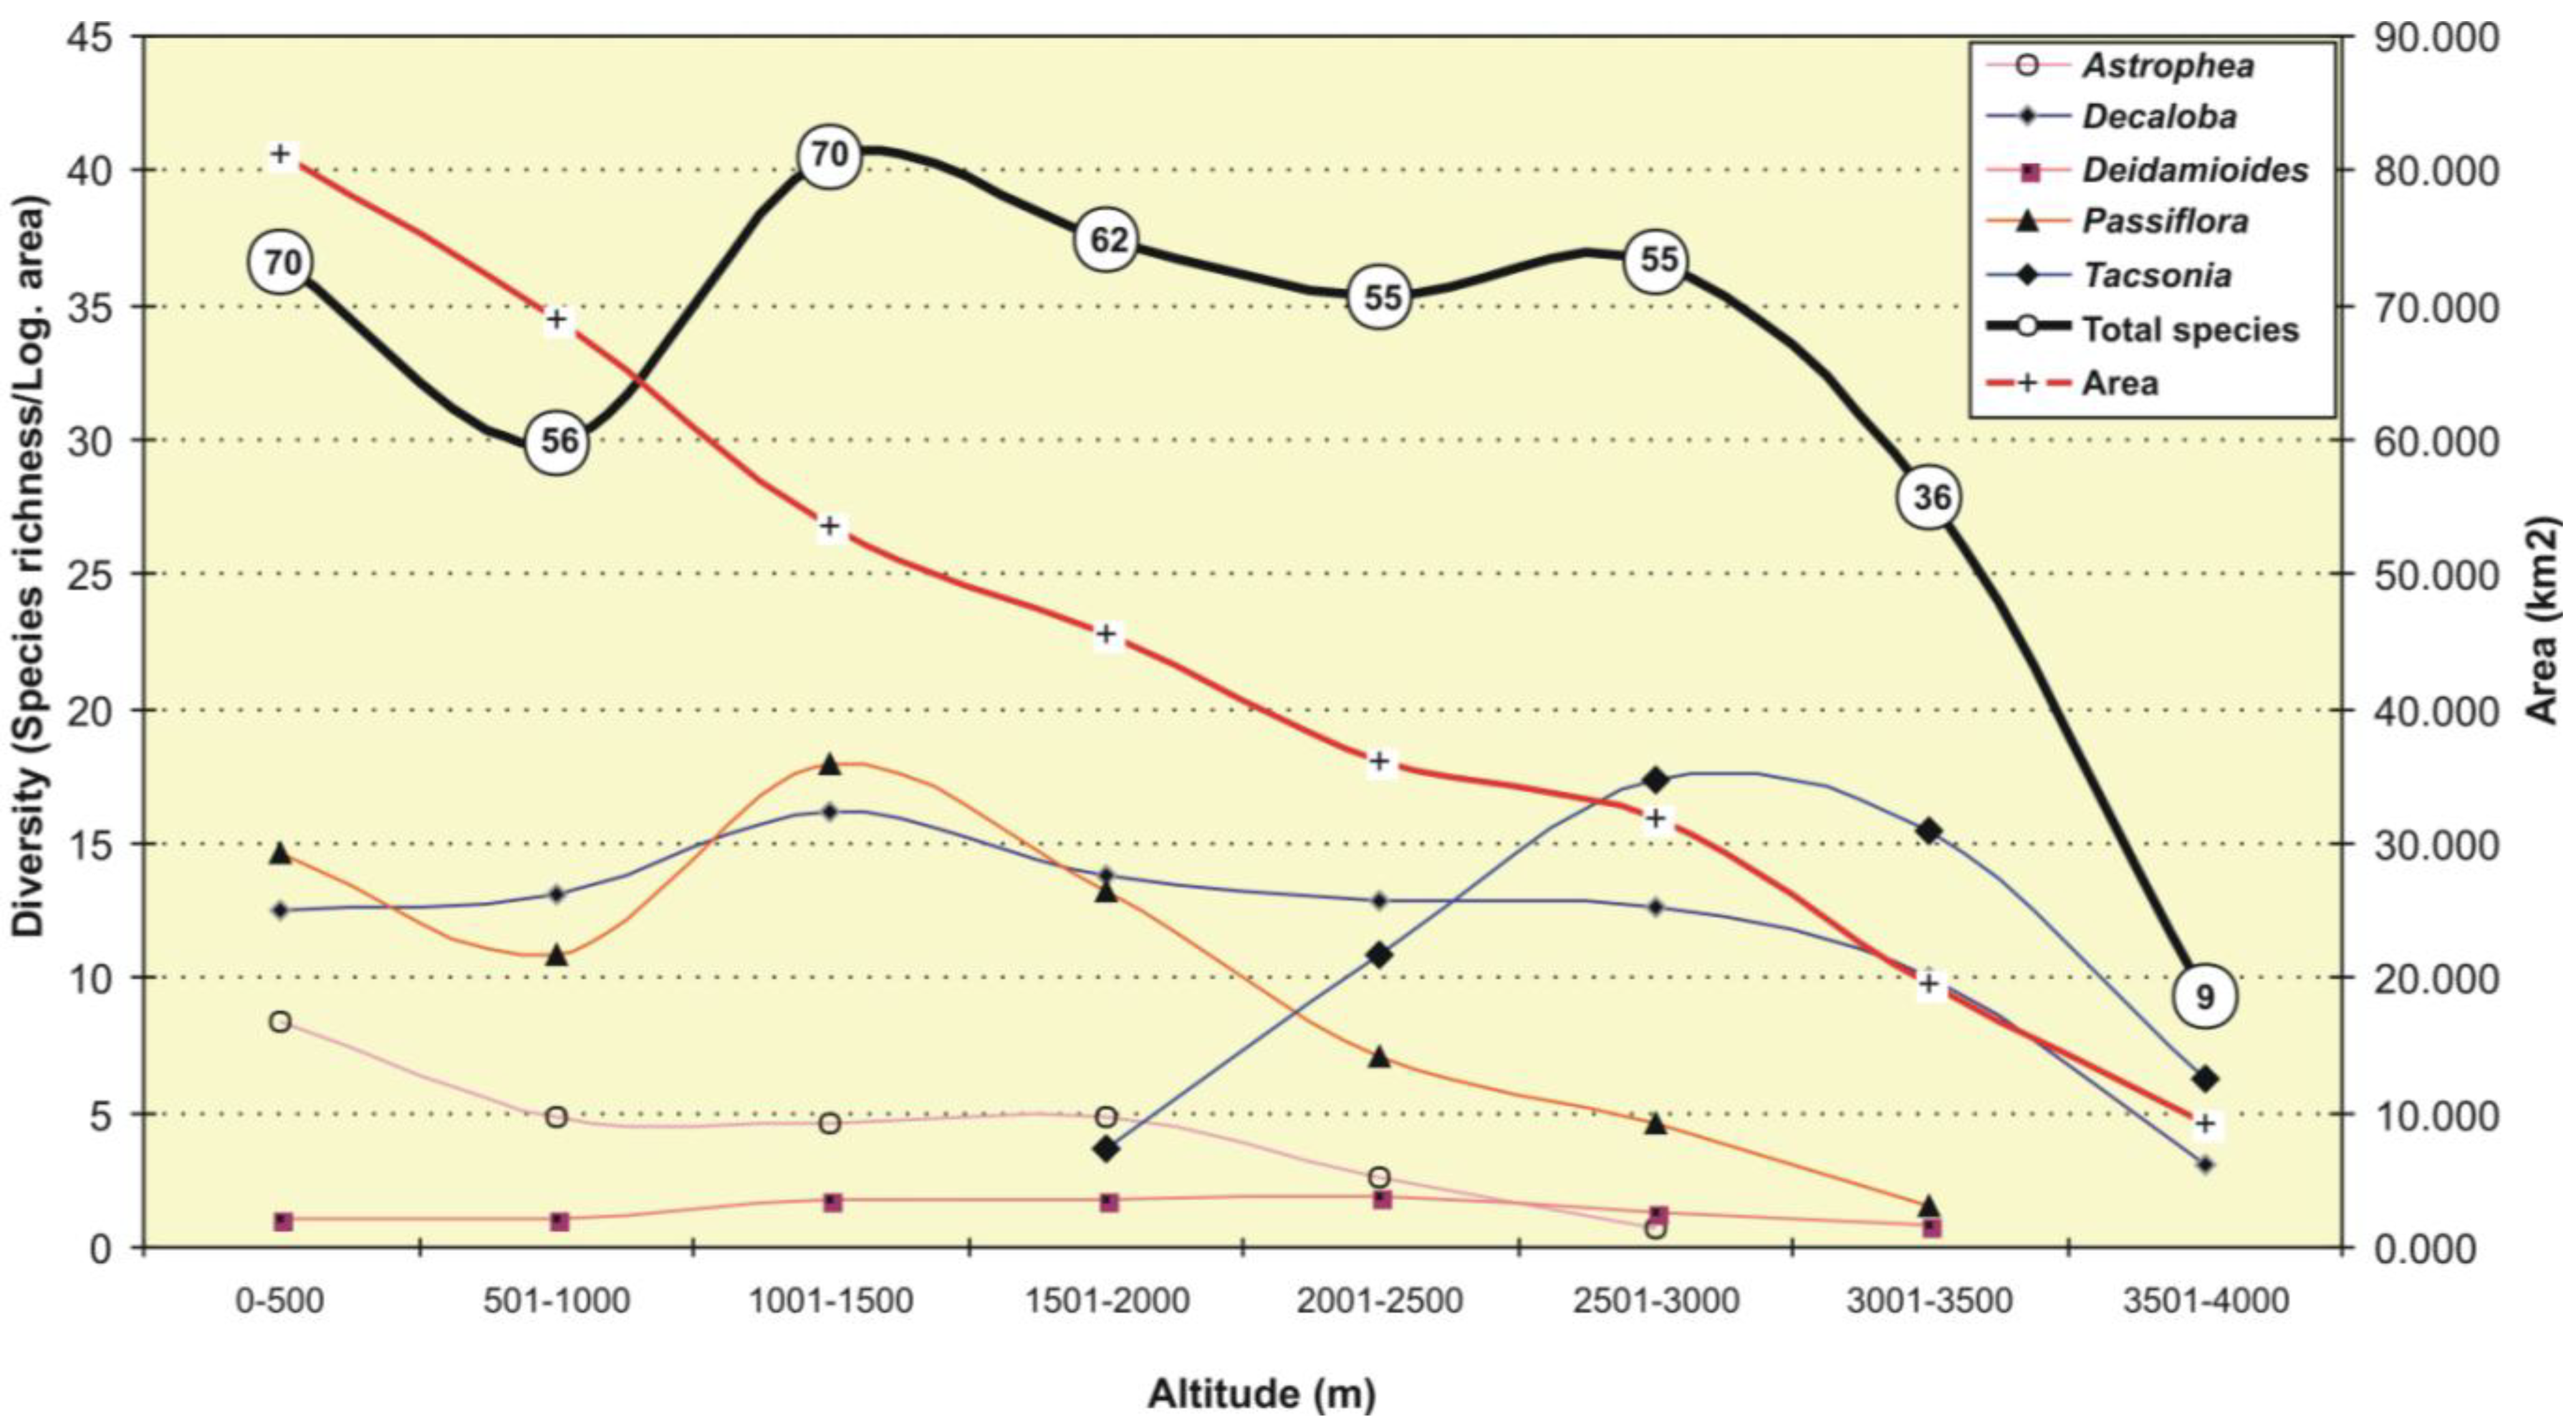
3.2. Altitudinal Distribution

Ancistrothyrsus and Dilkea reach altitudes of 800 m, mostly in the Amazon [12]. In contrast, Passiflora is distributed between sea level and 3,700 m. Figure 3 shows a trimodal relationship between elevation and species diversity for this genus, with maximal values below 500 m and in the ranges 1,000–1,500 and 2,500–3,000 m. The species number decreases sharply after 3,500 m until the limit of 4,000 m. To understand better this particular repartition, we have taken into account the complexity of Passiflora, gathering its Colombian species into five groups defined on morphological and molecular grounds, and resumed the analysis on these species subsets. This grouping is similar to the four subgenera proposed by Feuillet and MacDougal [22], except that Killip’s subgenera Rathea and Tacsonia are maintained as a distinct fifth group, because of their elongated, red or pink flowers and reduced crown, specifically adapted to pollination by the sword-hummingbird. The four others correspond to (1) subgenus Astrophea (trees and shrubs), (2) subgenus Decaloba sensu Feuillet and McDougal (Killip’s subgenera Apodogyne, Decaloba, Murucuja, Porphyropathanthus, Pseudomurucuja and Psilanthus; mostly species with laminar nectaries, small apetalous flowers, small fruits, and pollinated by bees and small insects, (3) subgenus Deidamioides sensu Feuillet and MacDougal (Killip’s subgenera Deidamioides and Tryphostemmatoides), and (4) a Passiflora-like group gathering Killip’s subgenera Calopathanthus, Distephana, Dysosmia, Dysosmioides, Passiflora, and Manicata, i.e., species with large flowers and fruits, pollinated by large bees or hummingbirds. The comparison between partial curves shows three distinct patterns in the adaptive potential of these groups. Astrophea and the Passiflora-like group present a bimodal distribution with a first cohort of species adapted to lowlands, below 500 m, with 16 and 28 species respectively, a second one adapted to medium elevations (1,000–2,000 m), and very few species at higher altitudes, with only one record of P. lindeniana near 2,700 m for subgenus Astrophea, and seven species for the Passiflora-like group. The opposite is true for the Tacsonia group, showing exclusive adaptation to cool highland climates, as it is typically concentrated above 2,500 m, with a peak at 2,500–3,000 m. Its fast radiation is clearly the cause of the third peak of the global curve. Another pattern is that of the Decaloba group, whose range of adaptation extends from 0 to more than 3,000 m, with no lowland peak and a slight peak around 1,000–1,500 m. The few species of the Deidamioides group also show a quite uniform distribution from 0 to 3,150 m, mostly in the Pacific and Andean regions. An interrogation remains concerning the first inflexion of the global curve and those of Astrophea and Passiflora-like groups in the range of 500-1,000 m. Interestingly, Jørgensen [56] reports a bimodal altitudinal distribution of vines in the Ecuadorian flora, with maximal diversity below 500 m and in the 2,000–3,000 m range, and a maximal diversity for Passiflora at 2,500–3,000 m. Taking latitudinal variation into account (Tacsonia species usually show a higher distribution in Ecuador, with a difference of 300–500 m), this corresponds very well with our observations in Colombia. Considering all Passifloraceae, the variation in number of Ecuadorian species with altitude [57] follows the same pattern as in Colombia. The Ecuadorian richness and high endemism level for Tacsonia is another strong point of convergence with the Colombian situation. According to Jørgensen [56], bimodality in altitudinal vine diversity distribution might be due to differential collecting intensity. However, there is no reason to expect a more continuous pattern. Indeed, Kessler [57] showed that there is no common elevational pattern for diversity, but a wide variety of independent patterns at all taxonomic levels, and that endemism appeared highest in the narrowest and most fragmented elevational belts: “The degree to which these influences become visible along the elevational gradient are determined by which combination of species is analyzed”. The same conclusion may be drawn within Passiflora, taking into account infrageneric divisions. This result restricts the potential use of Passiflora species as an indicator group to the Andean region, where they have developed most of their diversity.

3.3. Climatic Requirements

The PCA on the 19 climatic variables evidenced a first factor accounting for half of the variation (49%), strongly correlated with temperature variables (maximum, mean and minimal, but not seasonality in temperature), and a second one explaining 28 percent of the variation, related with precipitation in the whole year and in particular seasons (but again, not for their seasonality) (Table 2). Thus, in the principal plane (Figure 4), the first axis differentiates Andean species adapted to temperatures below 15 °C (i.e., >2,000 m), on the left side from those growing below 2,000 m, on the right side. Characteristically, these rightmost species originate from the Amazonian and Orinoquian. The second axis separates the species according to precipitation. Thus P. arbelaezii, P. costaricensis, P. chocoensis, P. lobata, P. occidentalis, P. pacifica, P. palenquensis and P. tica show preferences for high precipitation, a predominant condition in the Pacific region, and all are predicted to exist sympatrically. At the other extreme of the second axis, are species adapted to lower precipitation levels, specifically to the marked dry season of the Caribbean, such as P. bicornis, P. serrulata, P. guazumaefolia and P. pallida. Amazonian species take intermediate positions. The species repartition in the principal plane consistently reflects the potential for climatic adaptation of the groups that were defined for the analysis of altitudinal distribution. Thus, the Tacsonia group shows adaptation to cool conditions, while subgenus Astrophea and the Passiflora-like group show higher potential in hot and mild climates. The Decaloba group shows a much broader adaptation range, explaining its quite constant presence across the different biogeographic regions.
Figure 3. Distribution of total species richness (within circles) and species relative diversity in relation to altitude in Colombia, for genus Passiflora and five infrageneric groups.
Diversity 02 01158 g003

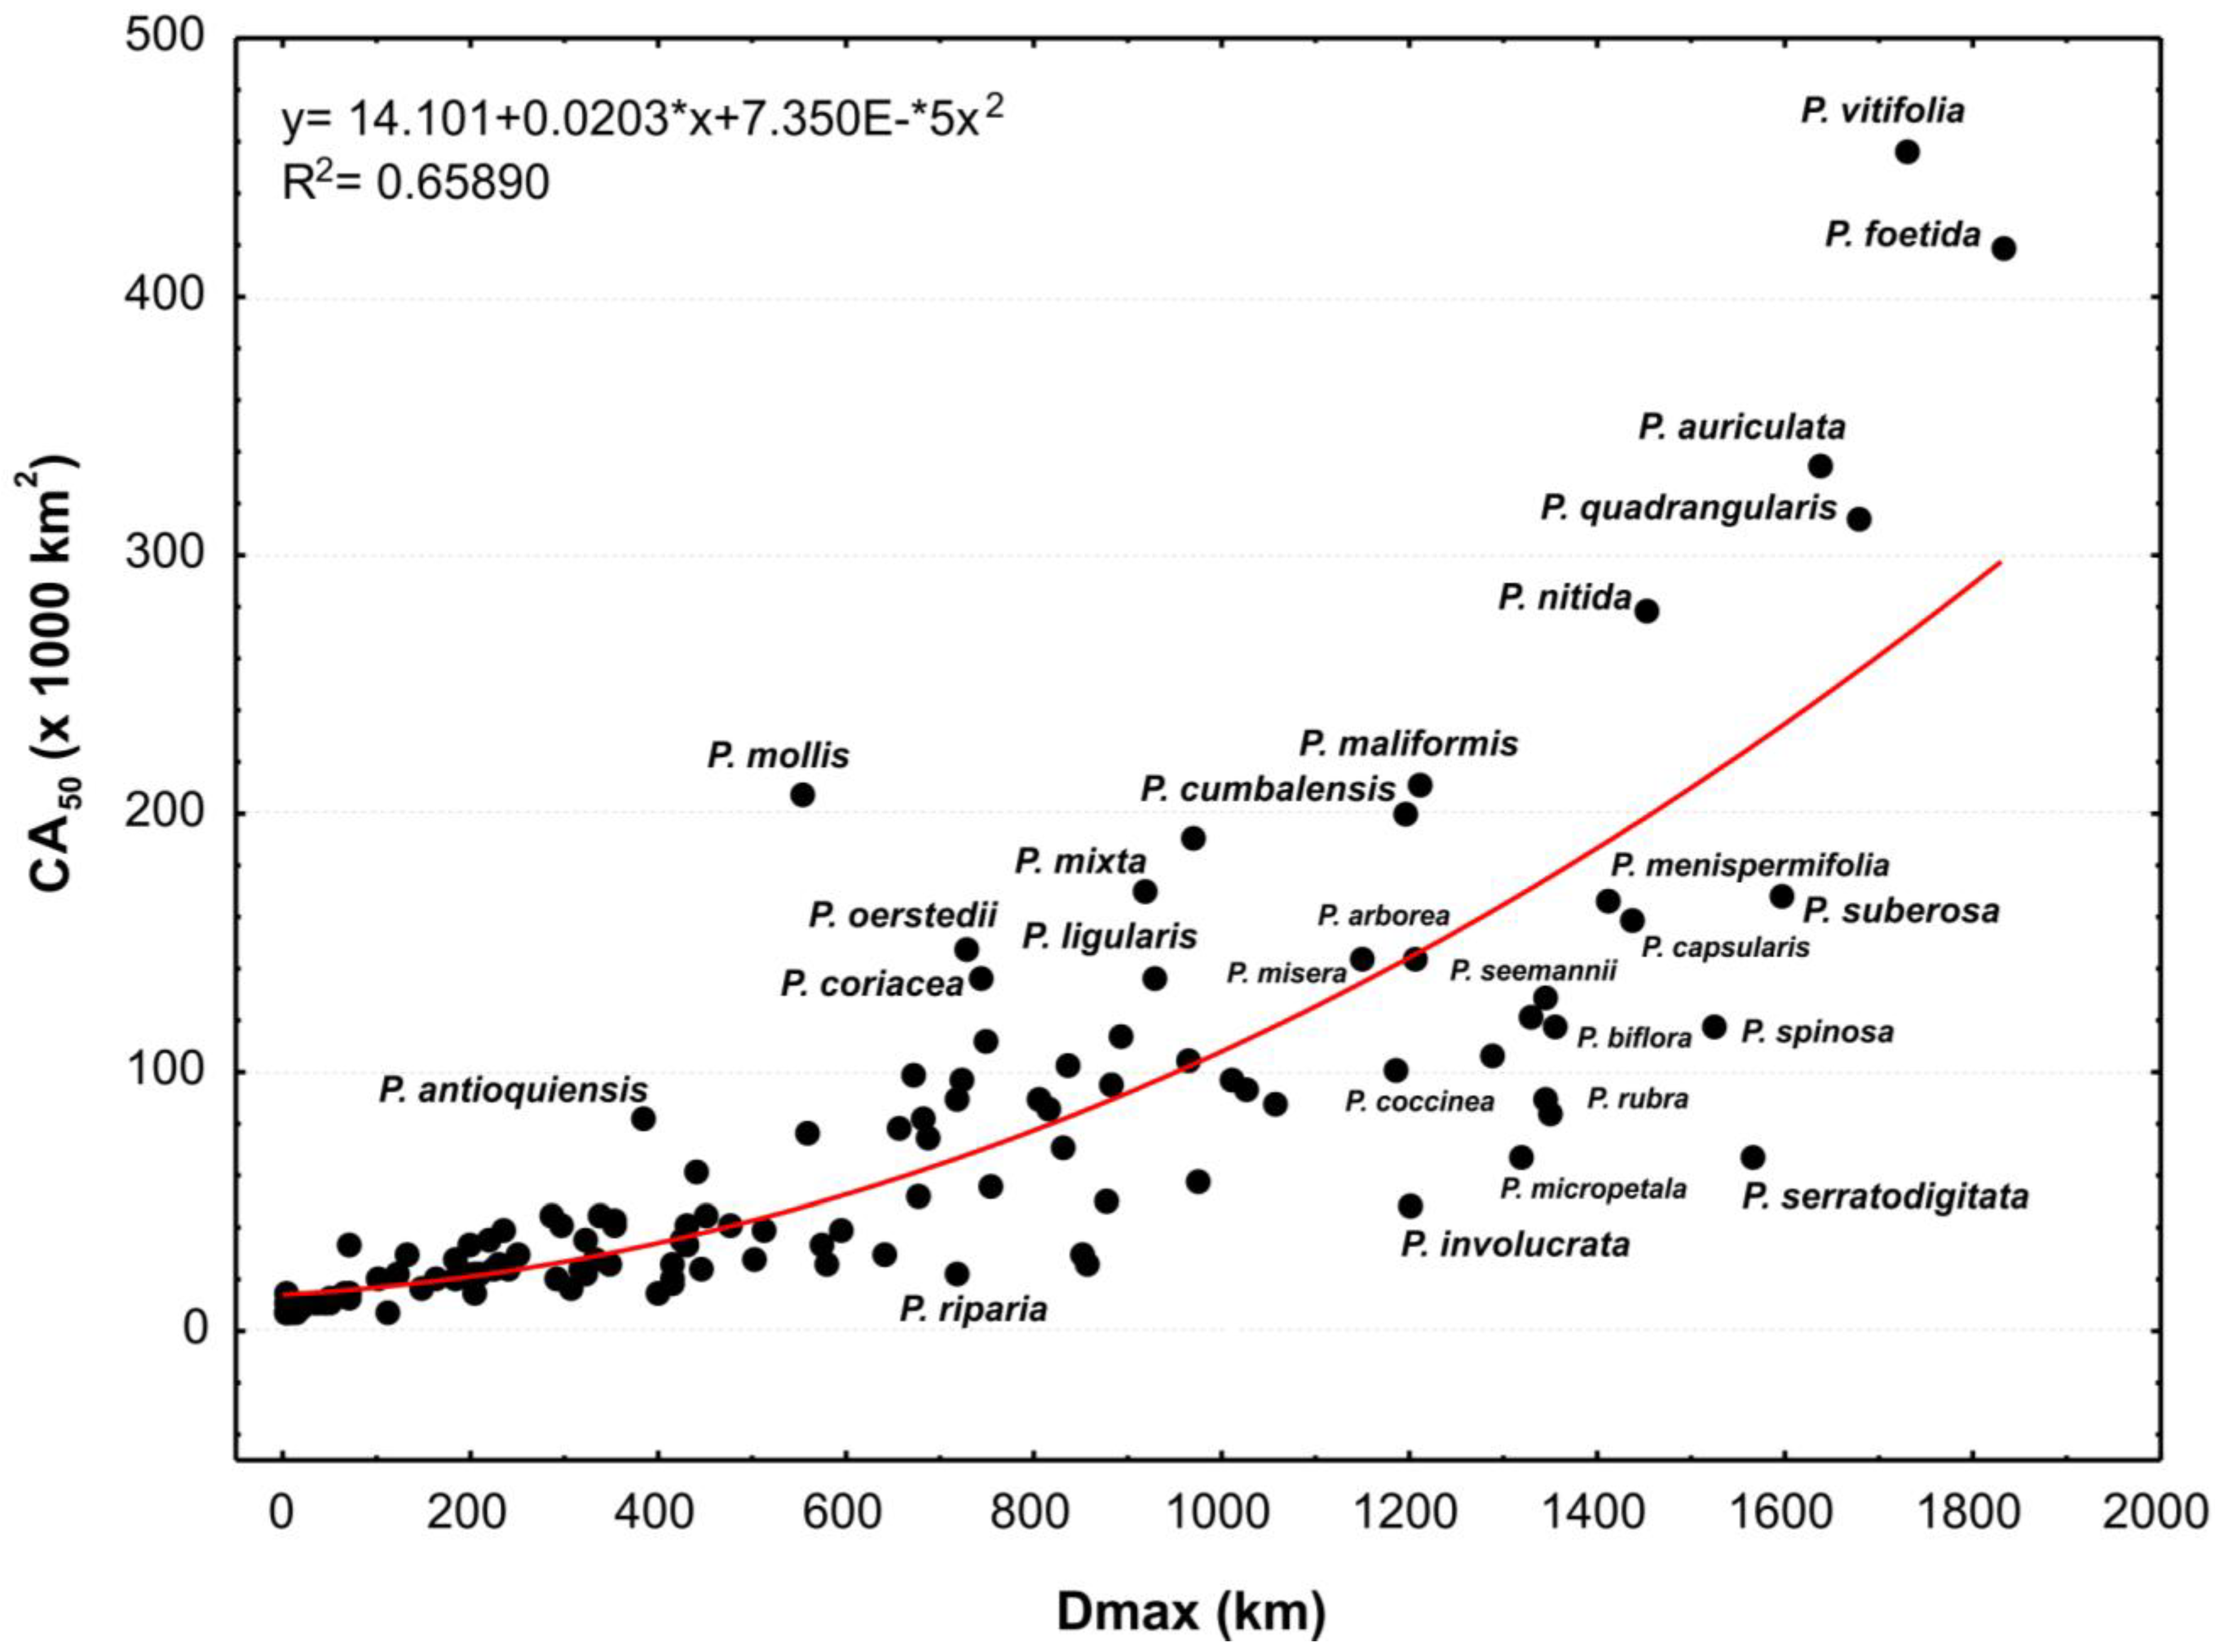
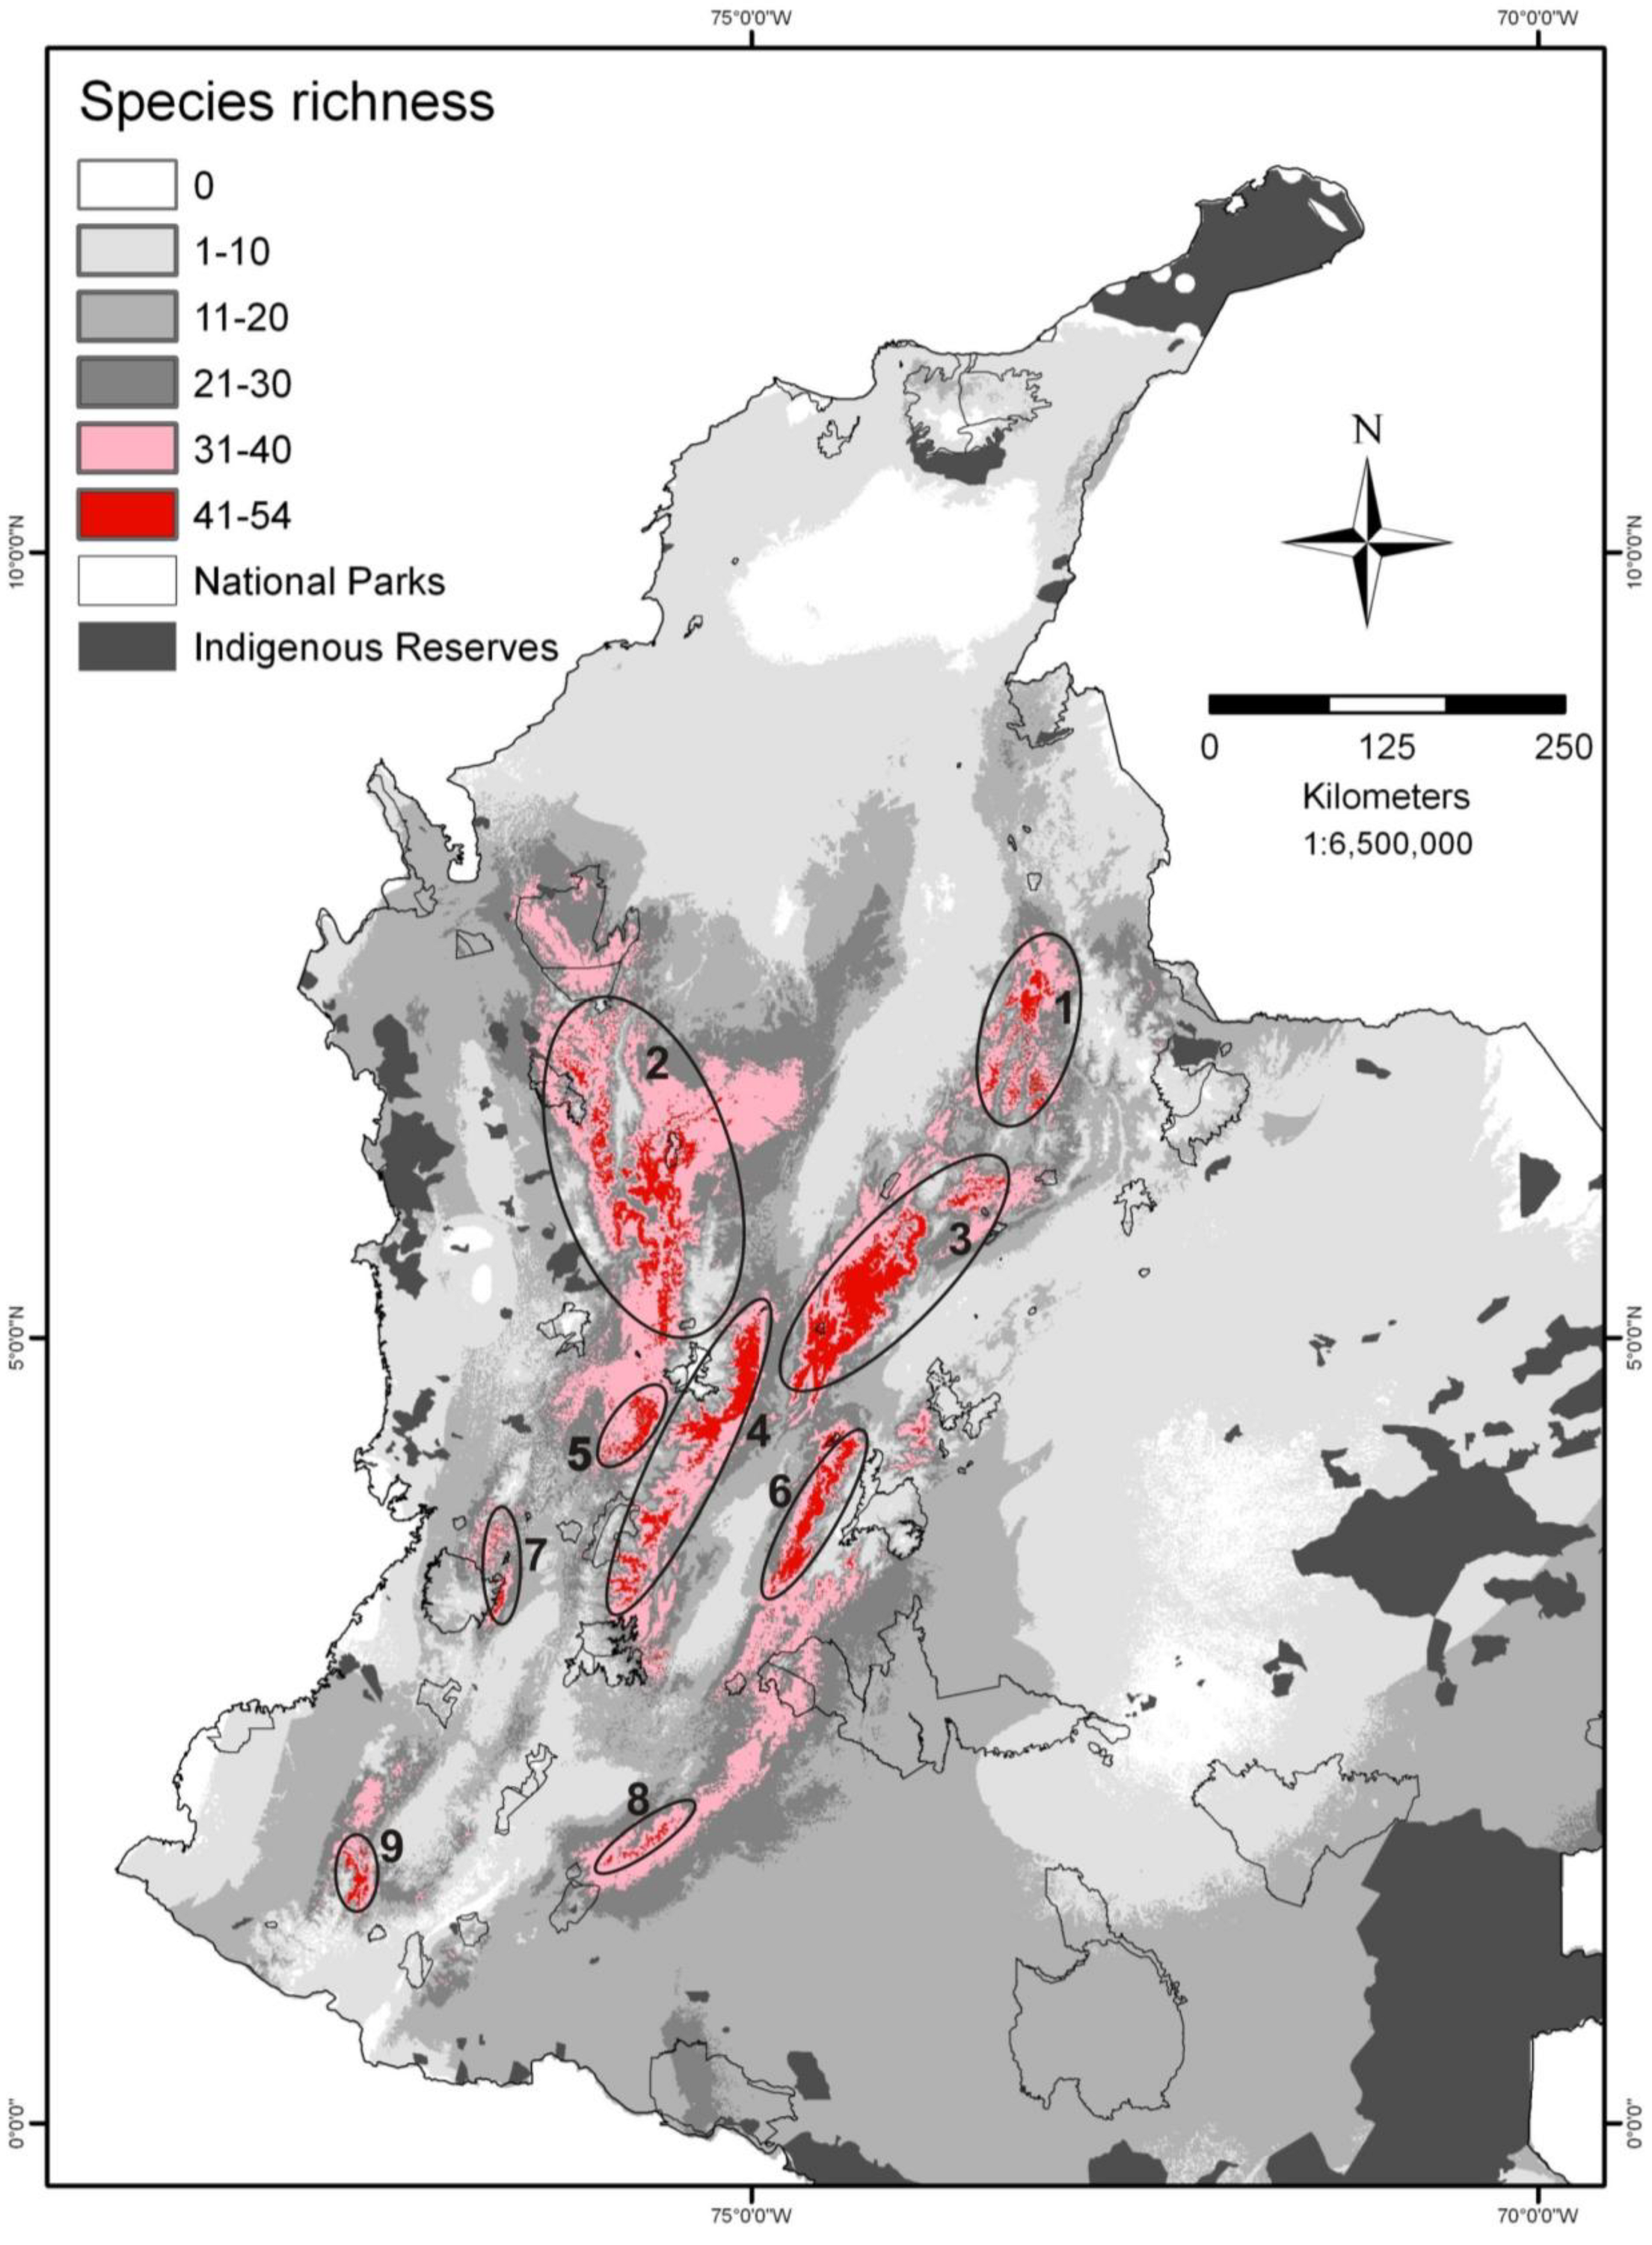
3.4. Areas of Distribution and Endemism

Distribution parameters (MaxD and CA50) have been given for each native species in Ocampo et al. [12]. Figure 5 shows a good correspondence between them, and their comparison provides information on species dispersion. For instance, a high MaxD and relatively low CA50 indicate low density, resulting from biological rarity and/or under-collection. The species with the widest distributions in Colombia (more than 1,100 km MaxD) are those showing a wide Neotropical distribution, such as the common P. foetida, P. auriculata, P. quadrangularis, P. laurifolia, P. suberosa, P. serratodigitata, P. capsularis, P. rubra, P. misera, and others of still considerable regional distribution, such as P. vitifolia, P. coccinea, P. spinosa, P. nitida, P. subpeltata, P. maliformis, P. menispermifolia, and P. biflora. Only P. arborea (Panamá to Ecuador) and P. cumbalensis (Colombia to Peru) show a more restricted distribution. These high-MaxD species are concentrated at low to medium elevations, the only exception being P. cumbalensis. According to IUCN [58] criteria, they are not threatened (Least Concern category), except for P. arborea (Near Threatened; [12]). Between 200 and 1,100 km of MaxD, are species of regional importance, such as P. mixta, P. ligularis, and endemics with a relatively wide distribution, such as P. sphaerocarpa (96,244 km²), P. lehmanni (91,156 km²), P. antioquiensis and P. mollis. The latter displays a relatively high CA50 in its group, as its 17 observations are quite scattered along the Cordillera Occidental. The position of P. coriacea in this group of medium dispersion is surprising, as it is found in all Neotropical countries. The 71 species with MaxD values below 225 km include 34 narrow endemics, 21 of which are exclusive to nine departments, particularly Antioquia (six species), Tolima (four) and Santander (three). The 15 others show similar MaxD and CA50 but live across administrative divisions. Only four of these 36 narrow endemics are represented by 10 or more observations while 10 are only known from the type collection. The situation of 33 non-endemic species with a MaxD under 100 km must be examined in relation to their distribution in neighboring countries. P. truxilliensis, shared with Venezuela, is a narrow endemic living around the border. The distribution of 14 species extends to farther places in neighboring countries, and 18 species present a wide distribution, extending to non-neighboring countries. For example, P. tricuspis is only reported once, in the Andean foothill, so it has a null MaxD, however its distribution extends south to Bolivia. Sixteen of these 33 species are adapted to lowland conditions, which suggests that their apparent rarity is in fact due to the poor collecting in the corresponding regions.
Figure 4. Distribution of Passiflora species centroids in the PCA principal plane for climatic variables.
Diversity 02 01158 g004
Figure 5. Passiflora species distributions in Colombia: circular area (CA50) vs. maximum distance (MaxD).
Diversity 02 01158 g005

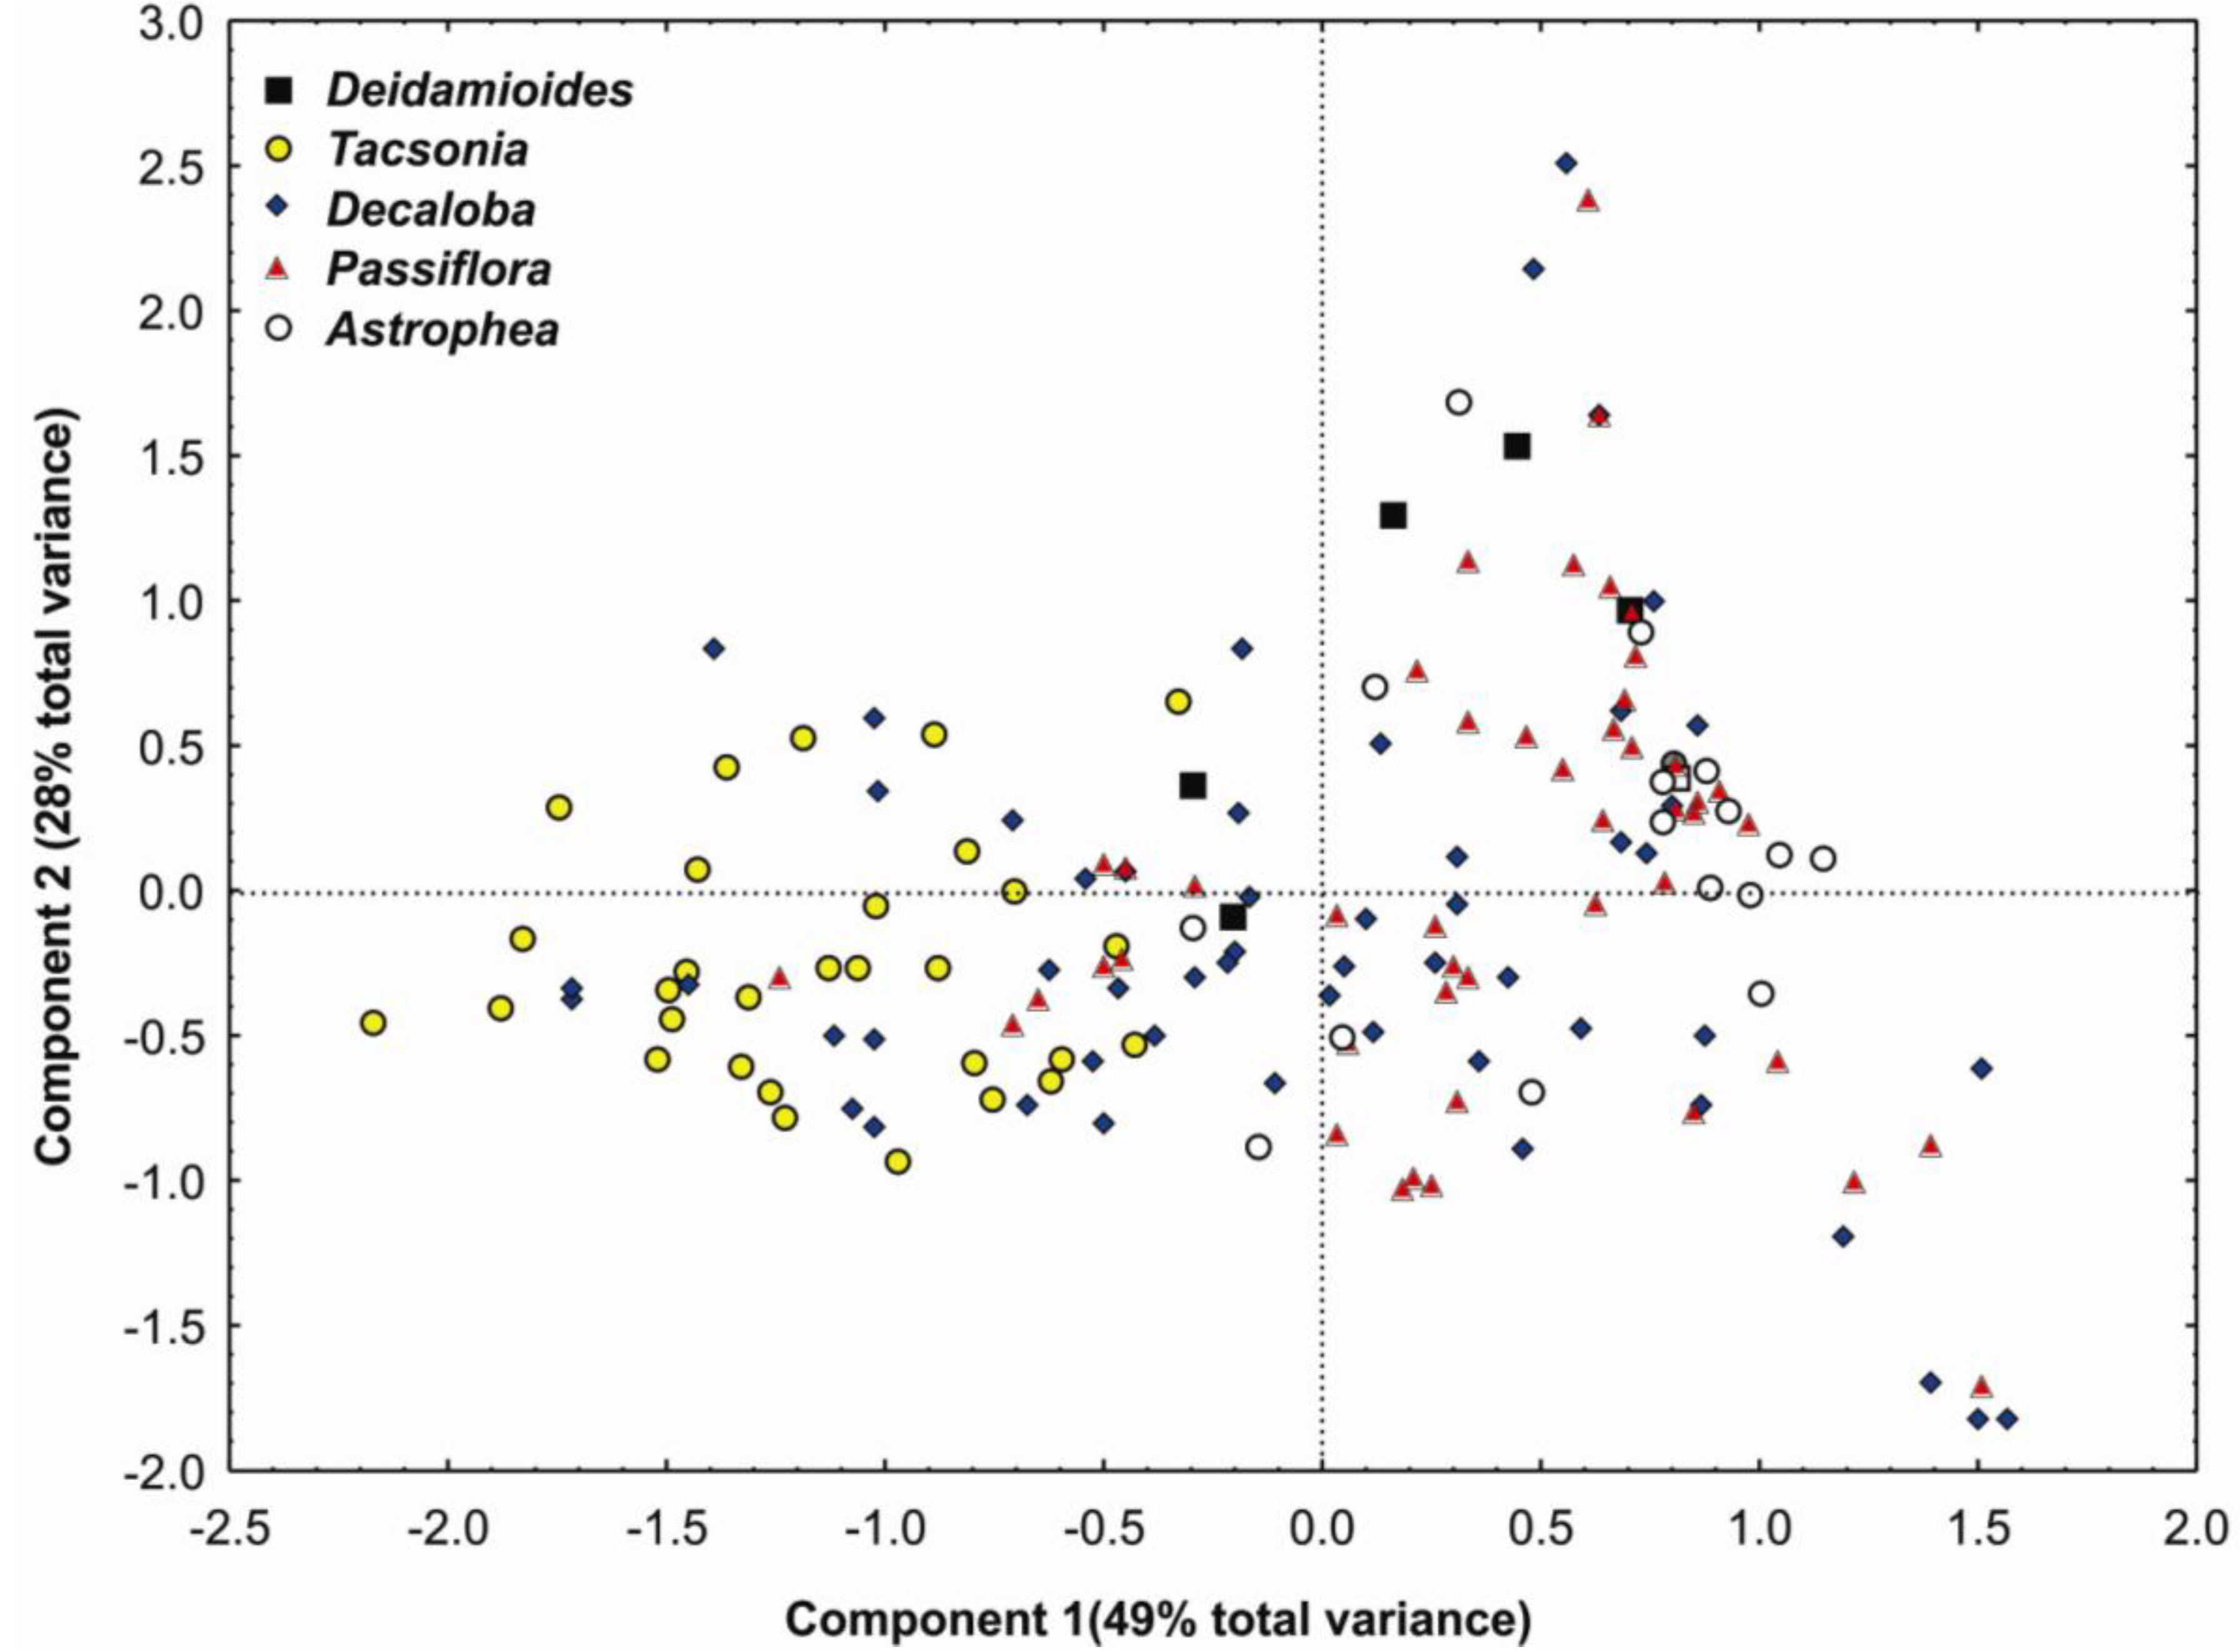
3.5. Modeling Distributions and Species Assemblages

The predicted distributions of the 80 species with more than 10 observations cannot be presented here, but are available upon request. Figure 6 presents the potential distribution of richness obtained by assembling them. The areas of highest predicted richness (41 to 54 predicted sympatric species) are mostly located in the center of the country, on the slopes of the three cordilleras, between an elevation of 1,000 and 2,000 m. Despite collection intensity in these areas, the correspondence is not perfect between observed and modeled distribution. While the species-rich areas of Antioquia, Caldas, Quindío, Cundinamarca and eastern Boyacá, and even the poorly explored but promising Santander, are well represented on the map (areas 2, 5, 3, 4 and 1 respectively), only very small richness spots are drawn for Valle del Cauca (area 7), and none for Cauca and southern Huila. Conversely, predicted richness spots 6, 8 and 9 (eastern Tolima-northern Huila-southern Cundinamarca, western Caquetá, Nariño) were not detected in the analysis of observed diversity, suggesting collecting gaps. The model predicts a poor representation of Passiflora in the lowlands of the Caribbean, Orinoquian and part of the Pacific, as well as in the Sierra Nevada de Santa Marta, an isolated mountain range on the Caribbean Coast, reputed for its high level of endemism. In both cases, this may be attributed to the poor exploration of these areas (low densities of observations) and poor representation of their species (few observations/per species), resulting in them not having sufficient observations to be used in the predictive modeling. This bias can be corrected by further collecting in these regions. Alternatively, materials of Colombian species collected in border regions of neighboring countries, belonging to the same biogeographic entities (e.g., the Venezuelan Llanos for the Orinoquian, Costa Rican and Ecuadorian Pacific, Brazilian, Ecuadorian and Peruvian Upper Amazonian) might be used to refine these models and increase the number of observations per species under analysis.
Table 2. Factor loadings, eigenvalues and percentages of variance for the first four components, resulting from the PCA analysis on 19 bioclimatic parameters for the 3,923 collection points.
Bioclim ParametersPrincipal components
1234
Annual Mean Temperature0.980.170.09−0.03
Mean Monthly Temperature Range0.08−0.21−0.16−0.96
Isothermality0.000.06−0.95−0.01
Temperature Seasonality0.450.030.77−0.18
Max, Temperature of Warmest Month0.970.160.12−0.12
Min, Temperature of Coldest Month0.980.200.060.04
Temp, Annual Range0.08−0.220.37−0.89
Mean Temperature of Wettest Quarter0.980.170.09−0.02
Mean Temperature of Driest Quarter0.980.180.10−0.04
Mean Temperature of Warmest Quarter0.980.170.11−0.04
Mean Temperature of Coldest Quarter0.980.170.07−0.03
Annual Precipitation0.240.960.040.10
Precipitation of Wettest Month0.290.910.150.10
Precipitation of Driest Month0.090.91−0.280.13
Precipitation Seasonality0.23−0.550.600.00
Precipitation of Wettest Quarter0.280.910.170.09
Precipitation of Driest Quarter0.090.93−0.250.13
Precipitation of Warmest Quarter0.100.87−0.200.12
Precipitation of Coldest Quarter0.290.890.050.02
Eigenvalue9.245.351.741.50
Percentage of variance48.7128.289.137.95

3.6. Conservation of Passiflora species and their Habitat

The biodiversity hotspot concept not only considers diversity but also endemism. Analyzing the distributions of New Zealand ferns, Mexican gymnosperms, or European butterflies, Lehmann et al. [36], Contreras-Medina and Luna-Vega [59], and Werner and Buszko [60] observed a poor correlation between both parameters. At the genus level, Jaramillo [61] found some correspondence between them for Piper diversity in the Chocó region, however there was a negative correlation between phylogenetic diversity and the proportion of endemics. For Passiflora in Colombia, we could not establish rigorously their correspondence, as the analysis was not designed for rare species, however we compared their spatial repartition, distinguishing four categories among the 56 endemics: those with a relatively wide distribution (MaxD > 100 km, 19 species), the narrow endemics (11 species), the rare endemics (three species), and the rare narrow endemics (23 species). Six of the 11 narrow endemics, seven of the 23 rare narrow endemics, and none of the three rare endemics live in one of the areas defined by our analysis. Indeed, seven endemics are adapted to lowlands, and two belong to the Sierra Nevada de Santa Marta, an area of endemism not sufficiently taken into account for reasons explained previously. In any case, of the 37 living Andean rare/narrow endemics, only 13 live in one of the “hotspots”. This proportion must be compared with more than 54 sympatric species out of 80 non-rare species whose distribution determined those hotspots. Thus, preserving these nine areas should have a less positive impact on the conservation of narrow endemics than on the general Passiflora diversity, which appears to limit the application of the biodiversity hotspot concept.
According to the analysis of complementarity for reserve selection, 52 sites of 25 × 25 km would suffice to represent all 162 native species throughout the country. The best five sites, in Caldas, Risaralda, Norte de Santander, southern Antioquia and Boyacá, capture a total 64 species. In just seven sites, 50 percent of all species could be conserved, though many of the endemic/rare species are not captured in these sites.
Figure 6 also shows a general lack of correspondence between the estimated distribution of Passiflora diversity and that of protected areas in the Colombian Andes, concentrated around the summits, obviously targeting páramo ecosystems. Very few small protected areas harbor a high Passiflora diversity: the watershed forest reserves of Sierra del Peligro (Boyacá, 16.5 km²), Río Nare (Antioquia, 118.8 km²), Río San Francisco, Cuchillas Peñas Blancas, and Cerro Quininí (Cundinamarca, 28.8, 16.3 and 18.0 km²). The Parque Nacional Farallones (Valle del Cauca) is the only reserve of national importance to protect part of a small Passiflora hotspot, on its eastern fringes. This poor coverage is not good news, neither for a genus including 71 percent threatened species, nor for the habitats where these species have developed numerous interactions with many other organisms.
Figure 7 shows a striking general superposition of areas of high Passiflora diversity on certain coffee growing zone ecotopes [62] whose conservation is of the utmost importance for Colombia. This is not surprising, as the corresponding elevation belts include or enclose those of major diversity. Clearly, efforts for the conservation of Passiflora habitats and genetic resources must be integrated in the more general management of the coffee growing zone environment at the landscape level.
Figure 6. Modeled distribution of Colombian Passiflora species diversity based on data from 80 species presenting more than 10 observations. Ellipses individualize high richness spots mentioned in the text. Distribution of protected areas in Colombia, showing poor correspondence with areas of high Passiflora diversity.
Diversity 02 01158 g006
Figure 7. Correspondence between Passiflora species high richness spots and coffee growing zone ecotopes.
Diversity 02 01158 g007

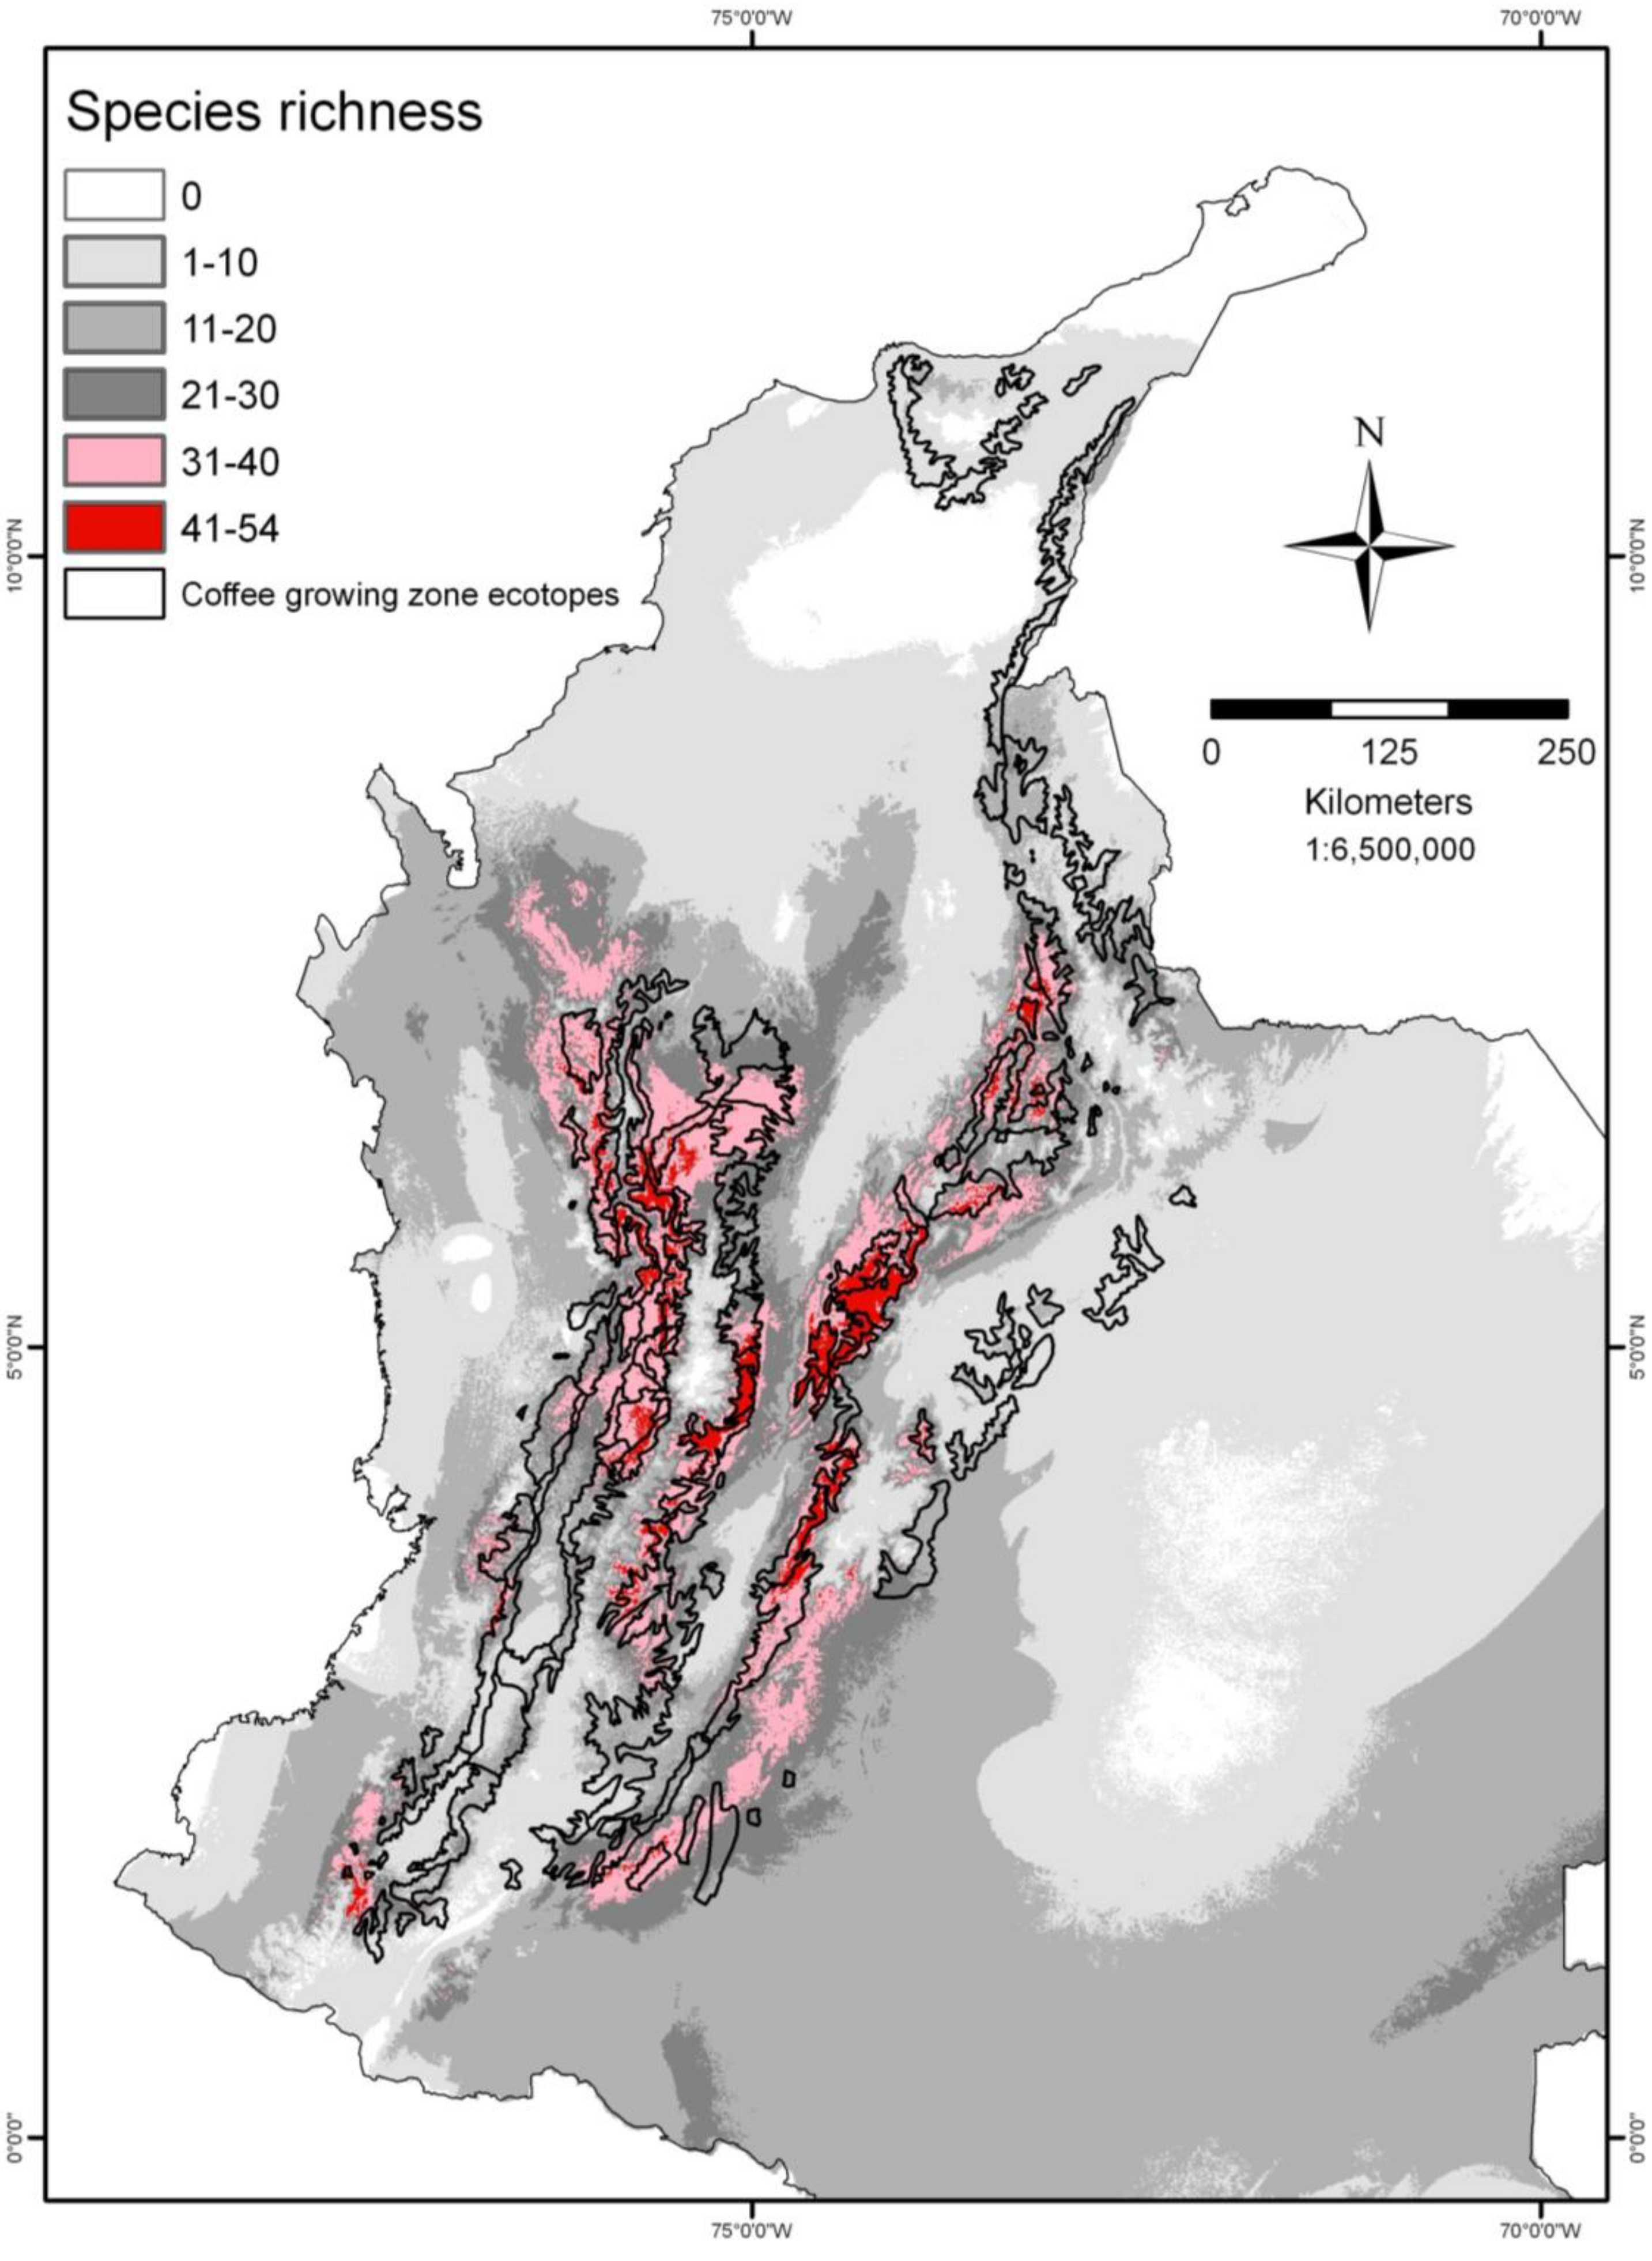
3.7. Passiflora as Indicators of Biodiversity

According to Pearson [34], an ideal indicator taxon should cumulate seven criteria: (i) a well-known and stable taxonomy, (ii) well-known natural history, (iii) readily surveyed and manipulated, (iv) higher taxa broadly distributed geographically and over a breadth of habitats, (v) lower taxa specialized and sensitive to habitat changes, (vi) patterns of diversity reflected in other taxa, and (vii) potential economic importance. Passiflora clearly fills the fifth and seventh criteria, though we must keep in mind that several common species are indicators of more or less disturbed habitats. Concerning the fourth criterion, our analyses have repeatedly underlined that Colombian Passiflora species distribution is concentrated in the Andean region, so their use as indicators should be restricted to the corresponding elevation belts. Lianas growing in high trees are not always easily surveyed (third criterion), however their typical structures, showy flowers and interesting fruits make them easy to identify as a group, catching the attention of local populations and specialists, who can thus help localize the different species in particular places. The application of molecular techniques should produce important progress in the complex taxonomy of this group and further, in understanding its natural history. The sixth criterion is particularly important. The numerous interactions of Passiflora species with other organisms (surrounding vegetation, pollinators, and herbivores) constitute a first indication that their diversity is necessarily related to that of other ecosystem components. Another indication came from a preliminary study, where we found an excellent correspondence between the distributions of diversity of Passiflora and Vasconcellea (mountain papayas), another plant group whose diversification is clearly related to the rise of the Andes [38]. Similar results must be obtained with more plant taxa before considering unequivocally Passiflora as a reliable surrogate for floral diversity in Andean ecosystems. However, given the excellent correspondence between Passiflora diversity maps and coffee growing zone ecotope maps, we may already recommend them as useful indicators of habitat degradation or of restoration in this environmentally and economically very important region. They could complement other indicators working at the landscape level, such as birds, whereas insect diversity indicators work better at a smaller scale [63].

4. Conclusions

Collections of Passiflora have not been uniform as a consequence of difficulty of access and/or chronic social conflict in many areas. They have been much denser in the central coffee growing zone, Antioquia, Valle del Cauca and Cundinamarca. The southern and northeastern Andes, and the Caribbean have been little explored. For the lowland forests of the Pacific, the Orinoquian and the Amazonian, data are so poor that they are misleading. Despite the resulting sampling bias, collecting parameters clearly point to the concentration of observed Passiflora diversity in the Andes, and more particularly the central coffee growing zone.
The modeled species richness map allowed identifying nine richness spots of variable size, three of which, located in the southern and southeastern Andes of Colombia, correspond to collection gaps, as they were not detected in the analysis of observed diversity. Another probable collection gap, not detected by diversity modeling, corresponds to the Sierra Nevada de Santa Marta, an isolated mountain range with both high diversity and endemism. The proportion of endemics living in high richness spots is lower than the proportion of all species used for modeling, confirming the lack of relation between diversity concentration and endemism reported in other studies. If this is further substantiated in different groups of organisms, it could limit the application of the biodiversity hotspot concept, as the best-protected areas for diversity would not necessarily provide protection to a high proportion of narrow endemics.
Passiflora diversity is not conserved by the current network of Colombian protected areas. On the contrary, it is particularly concentrated on certain ecotopes of the coffee growing zone, i.e., highly disturbed habitats, so any conservation effort must be integrated in local management strategies at the landscape level. Passiflora may provide an interesting indicator to evaluate the outcome of such efforts.

Acknowledgements

The first author gratefully acknowledges financial support from the Ginés-Mera Fellowship Foundation (CIAT-IDRC). Part of this research has been funded by the Colombian Ministry for Environment and the Research Center of the Colombian Coffee Grower Federation (Cenicafé) through the collaborative project “Estudio de la Diversidad de las Passifloraceae y Caricaceae en la zona cafetera de Colombia”.

References

  1. Hernández, J.; Hurtado, A.; Ortiz, R.; Walschuburger, T. Unidades biogeográficas de Colombia. In Estado de la biodiversidad en Colombia; Hernández, J., Ortiz, R., Walschuburger, T., Hurtado., Eds.; Colciencias: Bogotá, Colombia, 1991; pp. 15–17. [Google Scholar]
  2. Gentry, A.H. Endemism in tropical versus temperate plant communities. In Conservation Biology; Soulé, M.E., Ed.; Sinauer Associates: Sunderland, MA, USA, 1986; pp. 153–181. [Google Scholar]
  3. MacNeely, J.A.; Miller, K.R.; Reid, N.A.; Mittemer, R.A; Wainer, T.B. Conserving the World’s Biological Diversity; International Union for the Conservation of Nature and Natural Resources, World Resources Institute, Conservation International, WWF and World Banks: Washington, DC, USA, 1990; p. 174. [Google Scholar]
  4. May, R.M. How many species inhabit the Earth? Sci. Amer. 1992, 267, 18–24. [Google Scholar]
  5. Groombridge, B.; Jenkins, M.D. World Atlas of Biodiversity, Earth’s Living Resources in the 21st Century; University of California Press: Berkeley, CA, USA, 2002; p. 340. [Google Scholar]
  6. Villegas, B.; Sesana, L.; Hurtado-García, A.; Nieto, F. Parques Naturales Nacionales de Colombia; Villegas, Editores., Ed.; Villegas Editores—Parques Nacionales—Instituto de Investigaciones Biológicas Alexander Von Humboldt: Bogotá, Colombia, 2006; p. 448. [Google Scholar]
  7. Olson, D.M.; Dinerstein, E. The Global 2000: A representative approach to conserving the earth’s most biologically valuable ecoregions. Conserv. Biol. 1998, 12, 502–515. [Google Scholar]
  8. Midgley, G.F.; Hannah, L.; Millar, D.; Rutherford, M.C.; Powrie, L.W. Assessing the vulnerability of species richness to anthropogenic climate change in a biodiversity hotspot. Global Ecol. Biogeog. 2002, 11, 445–451. [Google Scholar] [CrossRef]
  9. Myers, N.; Mittermeier, R.A.; Mittermeier, C.G.; da Fonseca, G.A.B.; Kent, J. Biodiversity hotspots for conservation priorities. Nature 2000, 403, 853–858. [Google Scholar] [CrossRef]
  10. Word Wildlife Fund (WWW). Biodiversity Vision for the Northern Andes Ecoregional Complex; S. Palminteri: Santiago de Cali, Colombia, 2001; pp. 1–88. [Google Scholar]
  11. Villareal, H.; Álvarez, M.; Córdoba, S.; Escobar, F.; Fagua, G.; Gast, F.; Mendoza, H.; Ospina, M.; Umaña, A.M. Manual de métodos para el desarrollo de inventarios de biodiversidad, Programa de Inventarios de Biodiversidad, 2nd ed.; Instituto de Investigación de Recursos Biológicos Alexander von Humboldt: Bogotá, Colombia, 2006; p. 210. [Google Scholar]
  12. Ocampo, J.; Coppens d’Eeckenbrugge, G.; Restrepo, M.; Jarvis, A.; Salazar, M.; Caetano, C. Diversity of Colombian Passifloraceae: biogeography and an updated list for conservation. Biota Colombiana 2007, 8, 1–45. [Google Scholar]
  13. Hernández, A.; Garcia, N. Las Pasifloras. In Libro rojo de las plantas de Colombia: Las bromelias, las labiadas, y las pasifloras; Garcia, N., Galeano, G., Eds.; Instituto Alexander von Humboldt—Instituto de Ciencias Naturales de la Universidad Nacional de Colombia: Bogotá, Colombia, 2006; pp. 583–567. [Google Scholar]
  14. Ulmer, T.; MacDougal, J. Passiflora, Passionflowers of the World, 1st ed.; Timber Press: Portland, OR, USA, 2004; p. 430. [Google Scholar]
  15. Martin, F.W.; Nakasone, H.Y. The edible species of Passiflora. Econ. Bot. 1970, 24, 333–343. [Google Scholar] [CrossRef]
  16. Coppens d’Eeckenbrugge, G.; Segura, S.D.; Hodson De Jaramillo, E.; Góngora., G.A. Passion Fruits. In Tropical Plant Breeding; Charrier, A., Jacquot, M., Hamon, S., Nicolas, D., Eds.; Enfield Sciences: Montpellier, France, 2001; pp. 381–401. [Google Scholar]
  17. Passion fruit. Supply and demand. iTi tropicals Inc. 2010. Available online: http://passionfruitjuice.com (accessed on 26 July 2010).
  18. Killip, E.P. The American Species of Passifloraceae; Botanical Series 19; Field Museum of Natural History Publication: Chicago, IL, USA, 1938; p. 613. [Google Scholar]
  19. Escobar, L.K. Passifloraceae, Flora de Colombia 10; Instituto de Ciencias Naturales, Universidad Nacional de Colombia: Bogotá, Colombia, 1988; p. 143. [Google Scholar]
  20. Escobar, L.K. A new subgenus and five new species in Passiflora (Passifloraceae) from South America. Ann. Missouri Bot. Gard. 1989, 76, 877–885. [Google Scholar] [CrossRef]
  21. MacDougal, J.M. Revision of Passiflora section Decaloba, Pseudodysosmia (Passifloraceae). Syst. Bot. Monogr. 1994, 14, 146. [Google Scholar]
  22. Feuillet, C.; MacDougal, J. A new infrageneric classification of Passiflora L. (Passifloraceae). Passiflora 2003, 13, 34–38. [Google Scholar]
  23. Muschner, V.; Lorenz-Lemke, A.; Cervi, A.C.; Bonatto, S.; Souza-Chies, T.; Salzano, F.; Freitas, L. A first molecular phylogenetic analysis of Passiflora (Passifloraceae). Am. J. Bot. 2003, 90, 1229–1238. [Google Scholar] [CrossRef]
  24. Yockteng, R.; Nadot, S. Phylogenetic relationships among Passiflora species based on the glutamine synthetase nuclear gene expressed in chloroplast (ncpGS). Mol. Phyl. Evol. 2004, 31, 379–396. [Google Scholar] [CrossRef]
  25. Hansen, A.K.; Lawrence, G.; Simpson, B.B.; Downie, S.R.; Stephen, S.; Cervi, A.C.; Jansen, R.K. Phylogenetic relationships and chromosome number evolution in Passiflora. Syst. Bot. 2006, 31, 138–150. [Google Scholar] [CrossRef]
  26. Ocampo, J. Study of the Diversity of Genus Passiflora L. (Passifloraceae) and its Distribution in Colombia. Ph.D. Dissertation, Sciences Agronomiques; Ecole Nationale Supérieure Agronomique, de Montpellier, France, 2007; p. 268. [Google Scholar]
  27. Gilbert, L.E. The evolution of a butterfly and a vine, Heliconious butterflies. Sci. Am. 1982, 247, 10–121. [Google Scholar]
  28. Radhamani, T.R.; Sudarshana, L.; Krishnan, R. Defence and carnivory: dual roles of bracts in Passiflora foetida L. J. Biosci. 1995, 20, 657–664. [Google Scholar] [CrossRef]
  29. Apple, J.; Feener, D. Ant visitation of extrafloral nectaries of Passiflora: the effects of nectary attributes and ant behavior on patterns in facultative ant-plant mutualisms. Oecologia 2001, 127, 409–416. [Google Scholar] [CrossRef]
  30. Büchert, A.; Mogens, J. The fragility of extreme specialization: Passiflora mixta and its pollinating hummingbird Ensifera ensifera. J. Trop. Ecol. 2001, 17, 323–329. [Google Scholar]
  31. Sazima, M.; Sazima, I. Bat pollination of the passion flower, Passiflora mucronata, in southeastern Brazil. Biotropica 1978, 10, 100–109. [Google Scholar] [CrossRef]
  32. Debouck, D.G.; Libreros-Ferla, D. Neotropical montane forests: a fragile home of genetic resources of wild relatives of New World crops. In Biodiversity and Conservation of Neotropical Montane Forests, Proceedings of a Symposium; Biodiversity and Conservation of Neotropical Montane Forests, Proceedings of a Symposium, New York Botanical Garden, New York, NY, USA, 21–26 June 1993; Churchill, S.P., Balslev, H., Forero, E., Luteyn, J.L., Eds.; pp. 561–577.
  33. Maxted, N.; van Slageren, M.W.; Rihan, J.R. Ecogeographic surveys. In Collecting Plant Genetic Diversity, Technical Guidelines; Guarino, L., Ramanatha Rao, V., Reid, R., Eds.; CAB International: Wallingford, Australia, 1995; pp. 255–286. [Google Scholar]
  34. Pearson, D.L. Selecting indicator taxa for the quantitative assessment of biodiversity. Phil. Trans. Roy. Soc. Lond. 1994, 345, 75–79. [Google Scholar] [CrossRef]
  35. Skov, F. Potential plant distribution mapping based on climatic similarity. Taxon 2000, 49, 503–515. [Google Scholar] [CrossRef]
  36. Lehmann, A.; Leathwick, J.R.; Overton, J.M. Assessing New Zealand fern diversity from spatial predictions of species assemblages. Biodivers. Conserv. 2002, 11, 2217–2238. [Google Scholar] [CrossRef]
  37. Hijmans, R.J.; Spooner, D.M. Geography of wild potato species. Am. J. Bot. 2001, 88, 2101–2112. [Google Scholar] [CrossRef]
  38. Scheldeman, X.; Willemen, L.; Coppens d'Eeckenbrugge, G.; Romeijn-Peeters, E.; Restrepo, M.T.; Romero Motoche, J.; Jiménez, D.; Lobo, M.; Medina, C.I.; Reyes, C.; Rodríguez, D.; Ocampo, J.A.; Van Damme, P.; Goetgebeur, P. Distribution, diversity and crop ecology of highland papayas (Vasconcellea spp.) and papaya (Carica papaya L.) in Latin America. Biodivers. Conserv. 2006, 16, 1867–1884. [Google Scholar]
  39. Jarvis, A.; Ferguson, M.E.; Williams, D.E.; Guarino, L.; Jones, P.G.; Stalker, H.T.; Valls, J.F.M.; Pittman, R.N.; Simpson, C.E.; Bramel, P. Biogeography of wild Arachis: assessing conservation status and setting future priorities. Crop Sci. 2003, 43, 1100–1108. [Google Scholar] [CrossRef]
  40. Kingston, N.; Waldren, S. A conservation appraisal of the rare and endemic vascular plants of Pitcairn Island. Biodivers. Conserv. 2005, 14, 781–800. [Google Scholar] [CrossRef]
  41. Zaharieva, M.; Prosperi, J.M.; Monneveux, P. Ecological distribution and species diversity of Aegilops L. genus in Bulgaria. Biodivers. Conserv. 2004, 13, 2319–2337. [Google Scholar] [CrossRef]
  42. Peterson, A.T. Predictability of the geography of species invasions via ecological niche modeling. Quart. Rev. Biol. 2001, 78, 419–433. [Google Scholar] [CrossRef]
  43. Peterson, A.T.; Robins, C.R. When endangered meets invasive: ecological niche modeling predicts double trouble for spotted owls, Strix occidentalis. Conserv. Biol. 2003, 17, 1161–1165. [Google Scholar] [CrossRef]
  44. Leimberck, R.; Valencia, R.; Balslev, H. Landscape diversity patterns and endemism of Araceae in Ecuador. Biodivers. Conserv. 2004, 13, 1755–1779. [Google Scholar] [CrossRef]
  45. Peterson, A.T. Predicting species geographic distribution based on ecological niche modeling. Condor 2001, 10, 599–605. [Google Scholar] [CrossRef]
  46. Rodríguez, D.; Marín, C.; Quecán, H.; Ortiz, R. Áreas potenciales para colectas del género Vasconcellea Badillo en Venezuela. Bioagro 2005, 17, 3–10. [Google Scholar]
  47. Jarvis, A.; Lane, A.; Hijmans, R.J. The effect of climate change on crop wild relatives. Agricult., Ecosyst. Environm. 2008, 126, 13–23. [Google Scholar]
  48. Segura, S.; Coppens d’Eeckenbrugge, G.; López, L.; Grum, M.; Guarino, L. Mapping the potential distribution of five species of Passiflora in Andean countries. Gen. Res. Crop. Evol. 2003, 50, 555–566. [Google Scholar]
  49. Killip, E.P. Supplemental Notes on the American Species of Passifloraceae with Descriptions of New Species; Bulletin of the United States National Museum—Herbarium; Volume 35, Part 1; Smithsonian Institution: Washington, DC, USA, 1960; p. 29. [Google Scholar]
  50. Uribe, L. Pasifloráceas y Begoniáceas de la Real Expedición Botánica del Nuevo Reino de Granada; Ediciones Cultura Hispánica 26: Madrid, España, 1955; p. 98. [Google Scholar]
  51. Escobar, L.K. Two new species and a key to Passiflora subg. Astrophea. Syst. Bot. 1994, 19, 203–210. [Google Scholar] [CrossRef]
  52. Hijmans, R.J.; Schreuder, M.; De la Cruz, M.; Rojas, E. Computer tools for spatial analysis of plant genetic resources data: DIVA-GIS. Pl. Gen. Res. Newsl. 2001, 27, 15–19. [Google Scholar]
  53. Busby, J.R. BIOCLIM - A bioclimate prediction system. In Nature Conservation: Cost Effective Biological Surveys and Data Analysis; Margules, C.R., Austin, M.P., Eds.; CSIRO: Melbourne, Australia, 1991; pp. 4–68. [Google Scholar]
  54. Hijmans, R.J.; Graham, C.H. The ability of climate envelope models to predict the effect of climate change on species distributions. Glob. Chan. Biol. 2006, 12, 2272–2281. [Google Scholar] [CrossRef]
  55. Rebelo, A.G.R. Iterative selection procedures: centers of endemism and optimal placement of reserves. Strelitzia 1994, 1, 231–257. [Google Scholar]
  56. Jørgensen, P.M. Passifloraceae. In Catalogue of the Vascular Plants of Ecuador; Jørgensen, P.M., León-Yánez, S., Eds.; Monographs in Systematic Botany 75; Missouri Botanical Garden: St. Louis, MO, USA, 1999; pp. 779–783. [Google Scholar]
  57. Kessler, M. The elevational gradient of Andean plant endemism: varying influences of taxon-specific traits and topography at different taxonomic levels. J. Biogeogr. 2002, 29, 1159–1165. [Google Scholar] [CrossRef]
  58. IUCN. Guidelines for Application of IUCN Red List Criteria at Regional Levels: Version 3.0; IUCN Species Survival Commission; IUCN: Gland, Switzerland and Cambridge, UK, 2003; p. 26. [Google Scholar]
  59. Contreras-Medina, R.; Luna-Vega, I. Species richness, endemism and conservation of Mexican gymnosperms. Biodivers. Conserv. 2007, 16, 1803–1821. [Google Scholar] [CrossRef]
  60. Werner, U.; Buszko, J. Detecting diversity hot spots using species-area and endemics-area relationships: the case of butterflies. Biodiv. Conser. 2005, 14, 1977–1988. [Google Scholar] [CrossRef]
  61. Jaramillo, M.A. Using Piper species diversity to identify conservation priorities in the Chocó Region of Colombia. Biodivers. Conserv. 2006, 15, 1695–1712. [Google Scholar] [CrossRef]
  62. Federación Nacional de Cafeteros de Colombia. El Café. In Atlas de Colombia, 5a ed.; Instituto Agustín Codazzi: Bogotá, Colombia, 2003; p. 252. [Google Scholar]
  63. Perfecto, I.; Mas, A.; Dietsch, T.; Vandermeer, J. Conservation of biodiversity in coffee agroecosystems: a tri-taxa comparison in southern Mexico. Biodivers. Conserv. 2003, 12, 1239–1252. [Google Scholar] [CrossRef]

