Article

The CC-Bio Project: Studying the Effects of Climate Change on Quebec Biodiversity

by
Dominique Berteaux
1,*,
Sylvie de Blois
2,
Jean-François Angers
3,
Joël Bonin
4,
Nicolas Casajus
1,
Marcel Darveau
5,
François Fournier
6,
Murray M. Humphries
7,
Brian McGill
8,
Jacques Larivée
9,
Travis Logan
10,
Patrick Nantel
11,
Catherine Périé
12,
Frédéric Poisson
13,
David Rodrigue
14,
Sébastien Rouleau
14,
Robert Siron
10,
Wilfried Thuiller
15 and
Luc Vescovi
16
1
Canada Research Chair in Conservation of Northern Ecosystems and Centre of Nordic Studies, Quebec University at Rimouski, 300 allée des Ursulines, Rimouski, QC, G5L 3A1, Canada
2
Department of Plant Science and McGill School of Environment, Macdonald Campus, McGill University, 21111 Lakeshore Road, Ste-Anne-de-Bellevue, QC, H9X 3V9, Canada
3
Mathematics and Statistics Department, Montreal University, Montréal, QC, H3T 1J4, Canada
4
The Nature Conservancy Canada, Montréal, QC, H2T 2S6, Canada
5
Ducks Unlimited Canada and Laval University, 710 rue Bouvier, bur. 260, Québec, QC, G2J 1C2, Canada
6
Canadian Wildlife Service, Environment Canada, Sainte-Foy, QC, G1V 3W5, Canada
7
Department of Natural Resource Sciences, Macdonald Campus, McGill University, 21111 Lakeshore Road, Ste-Anne-de-Bellevue, QC, H9X 3V9, Canada
8
University of Maine, School of Biology and Ecology, Orono, ME 04469, USA
9
Regroupement QuébecOiseaux, Montréal, QC, H1V 3R2, Canada
10
Ouranos, Montréal, QC, H3A 1B9, Canada
11
Parks Canada, Gatineau, QC, K1A 0M5, Canada
12
Forest Research Branch, Ministry of Natural Resources and Wildlife, Québec, QC, G1P 3W8, Canada
13
Ecological Heritage Branch and Parks, Ministry of Sustainable Development, Environment and Parks, Québec, QC, G1R 5V7, Canada
14
St. Lawrence Valley Natural History Society, Ste-Anne-de-Bellevue, QC, H9X 3Y7, Canada
15
Laboratory of Alpine Ecology, UMR CNRS 5553, Université Joseph Fourier, 38041, Grenoble, France
16
Council for Science and Technology, Montréal, QC, H3A 2S9, Canada
*
Author to whom correspondence should be addressed.
Diversity 2010, 2(11), 1181-1204; https://doi.org/10.3390/d2111181
Submission received: 25 September 2010 / Accepted: 9 November 2010 / Published: 19 November 2010
(This article belongs to the Special Issue Biodiversity, Conservation and Ecosystem Management)

Abstract

:
Anticipating the effects of climate change on biodiversity is now critical for managing wild species and ecosystems. Climate change is a global driver and thus affects biodiversity globally. However, land-use planners and natural resource managers need regional or even local predictions. This provides scientists with formidable challenges given the poor documentation of biodiversity and its complex relationships with climate. We are approaching this problem in Quebec, Canada, through the CC-Bio Project (http://cc‑bio.uqar.ca/), using a boundary organization as a catalyst for team work involving climate modelers, biologists, naturalists, and biodiversity managers. In this paper we present the CC-Bio Project and its general approach, some preliminary results, the emerging hypothesis of the northern biodiversity paradox (a potential increase of biodiversity in northern ecosystems due to climate change), and an early assessment of the conservation implications generated by our team work.

1. Introduction

Species can respond to climate change in several ways. They can move to track climatic conditions or stay in place and evolve to the new climate. If they do not move or evolve, they must face the consequences of a mismatch between the climate conditions under which they have evolved and the climate conditions they currently experience, which may involve reduced fitness, and abundance or extinction. Although rapid evolution is possible [1,2], movement that tracks climate is by far the most common response [3,4,5]. Several syntheses have shown that shifts in phenology and distribution of plants and animals have occurred in the last 30–40 years in the direction predicted from global warming [6,7,8,9,10,11,12]. Meta-analyses show mean advancement of spring events by 2.3 days/decade, and mean range shifts of 6.1 km/decade towards the poles, or 6 m/decade upward in elevation (a “globally coherent fingerprint”; [7]). Climate will likely continue to warm [13]. A strong reorganization of abundance patterns and ranges of species is thus expected from historical reconstructions [14], current observations (see above), and knowledge of biological processes at work [15]. Given the current rate of habitat loss and fragmentation and the limited dispersal potential of some species [16], there is serious concern about our ability to manage biodiversity in the context of climate change.
All over the world, biodiversity conservation largely rests on two complementary approaches that involve (1) identifying species at risk and taking actions to decrease extinction risks, and (2) protecting and restoring areas which represent the diversity of ecosystems. Implementing both approaches depends on knowing the distribution and abundance of species, and on estimating how these will change over time. Projecting shifts in the range and abundance of species under future climate scenarios is thus critical to explore the possible effects of climate change on biodiversity [17,18,19].
Although biodiversity conservation is guided by general principles, it is constrained and shaped by regional and local realities [20]. Research must therefore address the regional or even local effects of climate change on biodiversity. This is challenging given the poor documentation of biodiversity and its complex relationships with climate. In addition, the institutional or intellectual barriers between academics who develop the science, naturalists who gather important information about biodiversity, decision makers who influence policy, and practitioners who manage biodiversity, add to the difficulties of conserving biodiversity in a changing climate.
In this paper we describe the organization, the scientific approach, some preliminary or expected results, an emerging hypothesis, and the expected conservation impacts of an ongoing project started in 2007 and called CC-Bio (an acronym for “Effects of Climate Change on Quebec Biodiversity”). The general objective of CC-Bio is to project potential effects of climate change on the distribution and abundance of a large range of Quebec’s plant and animal species, in order to develop knowledge and tools needed to implement regional strategies of adaptation to climate change in the field of biodiversity conservation. Through this paper, we wish to inform natural scientists and biodiversity managers about identified research gaps, how progress is thought to be achieved, and what scientific and social impacts can be expected. Since many scientific communities throughout the world need to address the regional effects of climate change on biodiversity, we hope that our sharing of information will facilitate and speed the efforts of other research groups with similar objectives.
In Canada, biodiversity is structured by strong climatic gradients [21] and the distribution of species has shifted dramatically in latitude during the Holocene in step with climatic changes [22,23,24]. The rate of climate warming during the 21st century is expected to exceed Holocene changes. Lemieux and Scott [25] estimated that 37–48% of Canada’s protected areas could experience a change in terrestrial biome type under a scenario of doubled atmospheric CO2. In south-western Quebec, where CC-Bio takes place, average surface temperatures have increased by 1.25 ºC in the last 4 decades [26,27], and climatic models project a further 3–5 ºC increase during the present century [28].

2. Methods

2.1. Research Structure

One of the most original aspects of the CC-Bio research structure is that the project was initiated by a boundary organization [29], Ouranos (http://www.ouranos.ca/), which mediates the relationship between science and policy. Ouranos is a private non-profit organization that was created in 2001 as a joint initiative by the Quebec government, Hydro-Québec and Environment Canada. The objective of Ouranos is to help Quebec society adapt to climate change by developing regional climate change models and climate change adaptation strategies in sectors such as human health, energy, forestry and water resources, transportation, agriculture, and natural ecosystems and biodiversity.
CC-Bio was thus developed as a highly collaborative project involving academic institutions providing expertise on the science of biodiversity, governmental and non-governmental organizations in charge of biodiversity conservation or natural resource management in Quebec, and associations of naturalists offering both data and expert knowledge on Quebec biodiversity (Figure 1). For instance, university researchers co-supervise students with scientists at the Quebec Ministry of Natural Resources (MRNF) to model trees, with scientists at Ducks Unlimited Canada to model wetland species, and with scientists at Parks Canada to investigate species at risk. In addition to facilitating exchanges across boundaries (biology and climatology; science and management; professional scientists and amateur naturalists), Ouranos also provides CC-Bio with expertise on regional climate models and spatial analysis.

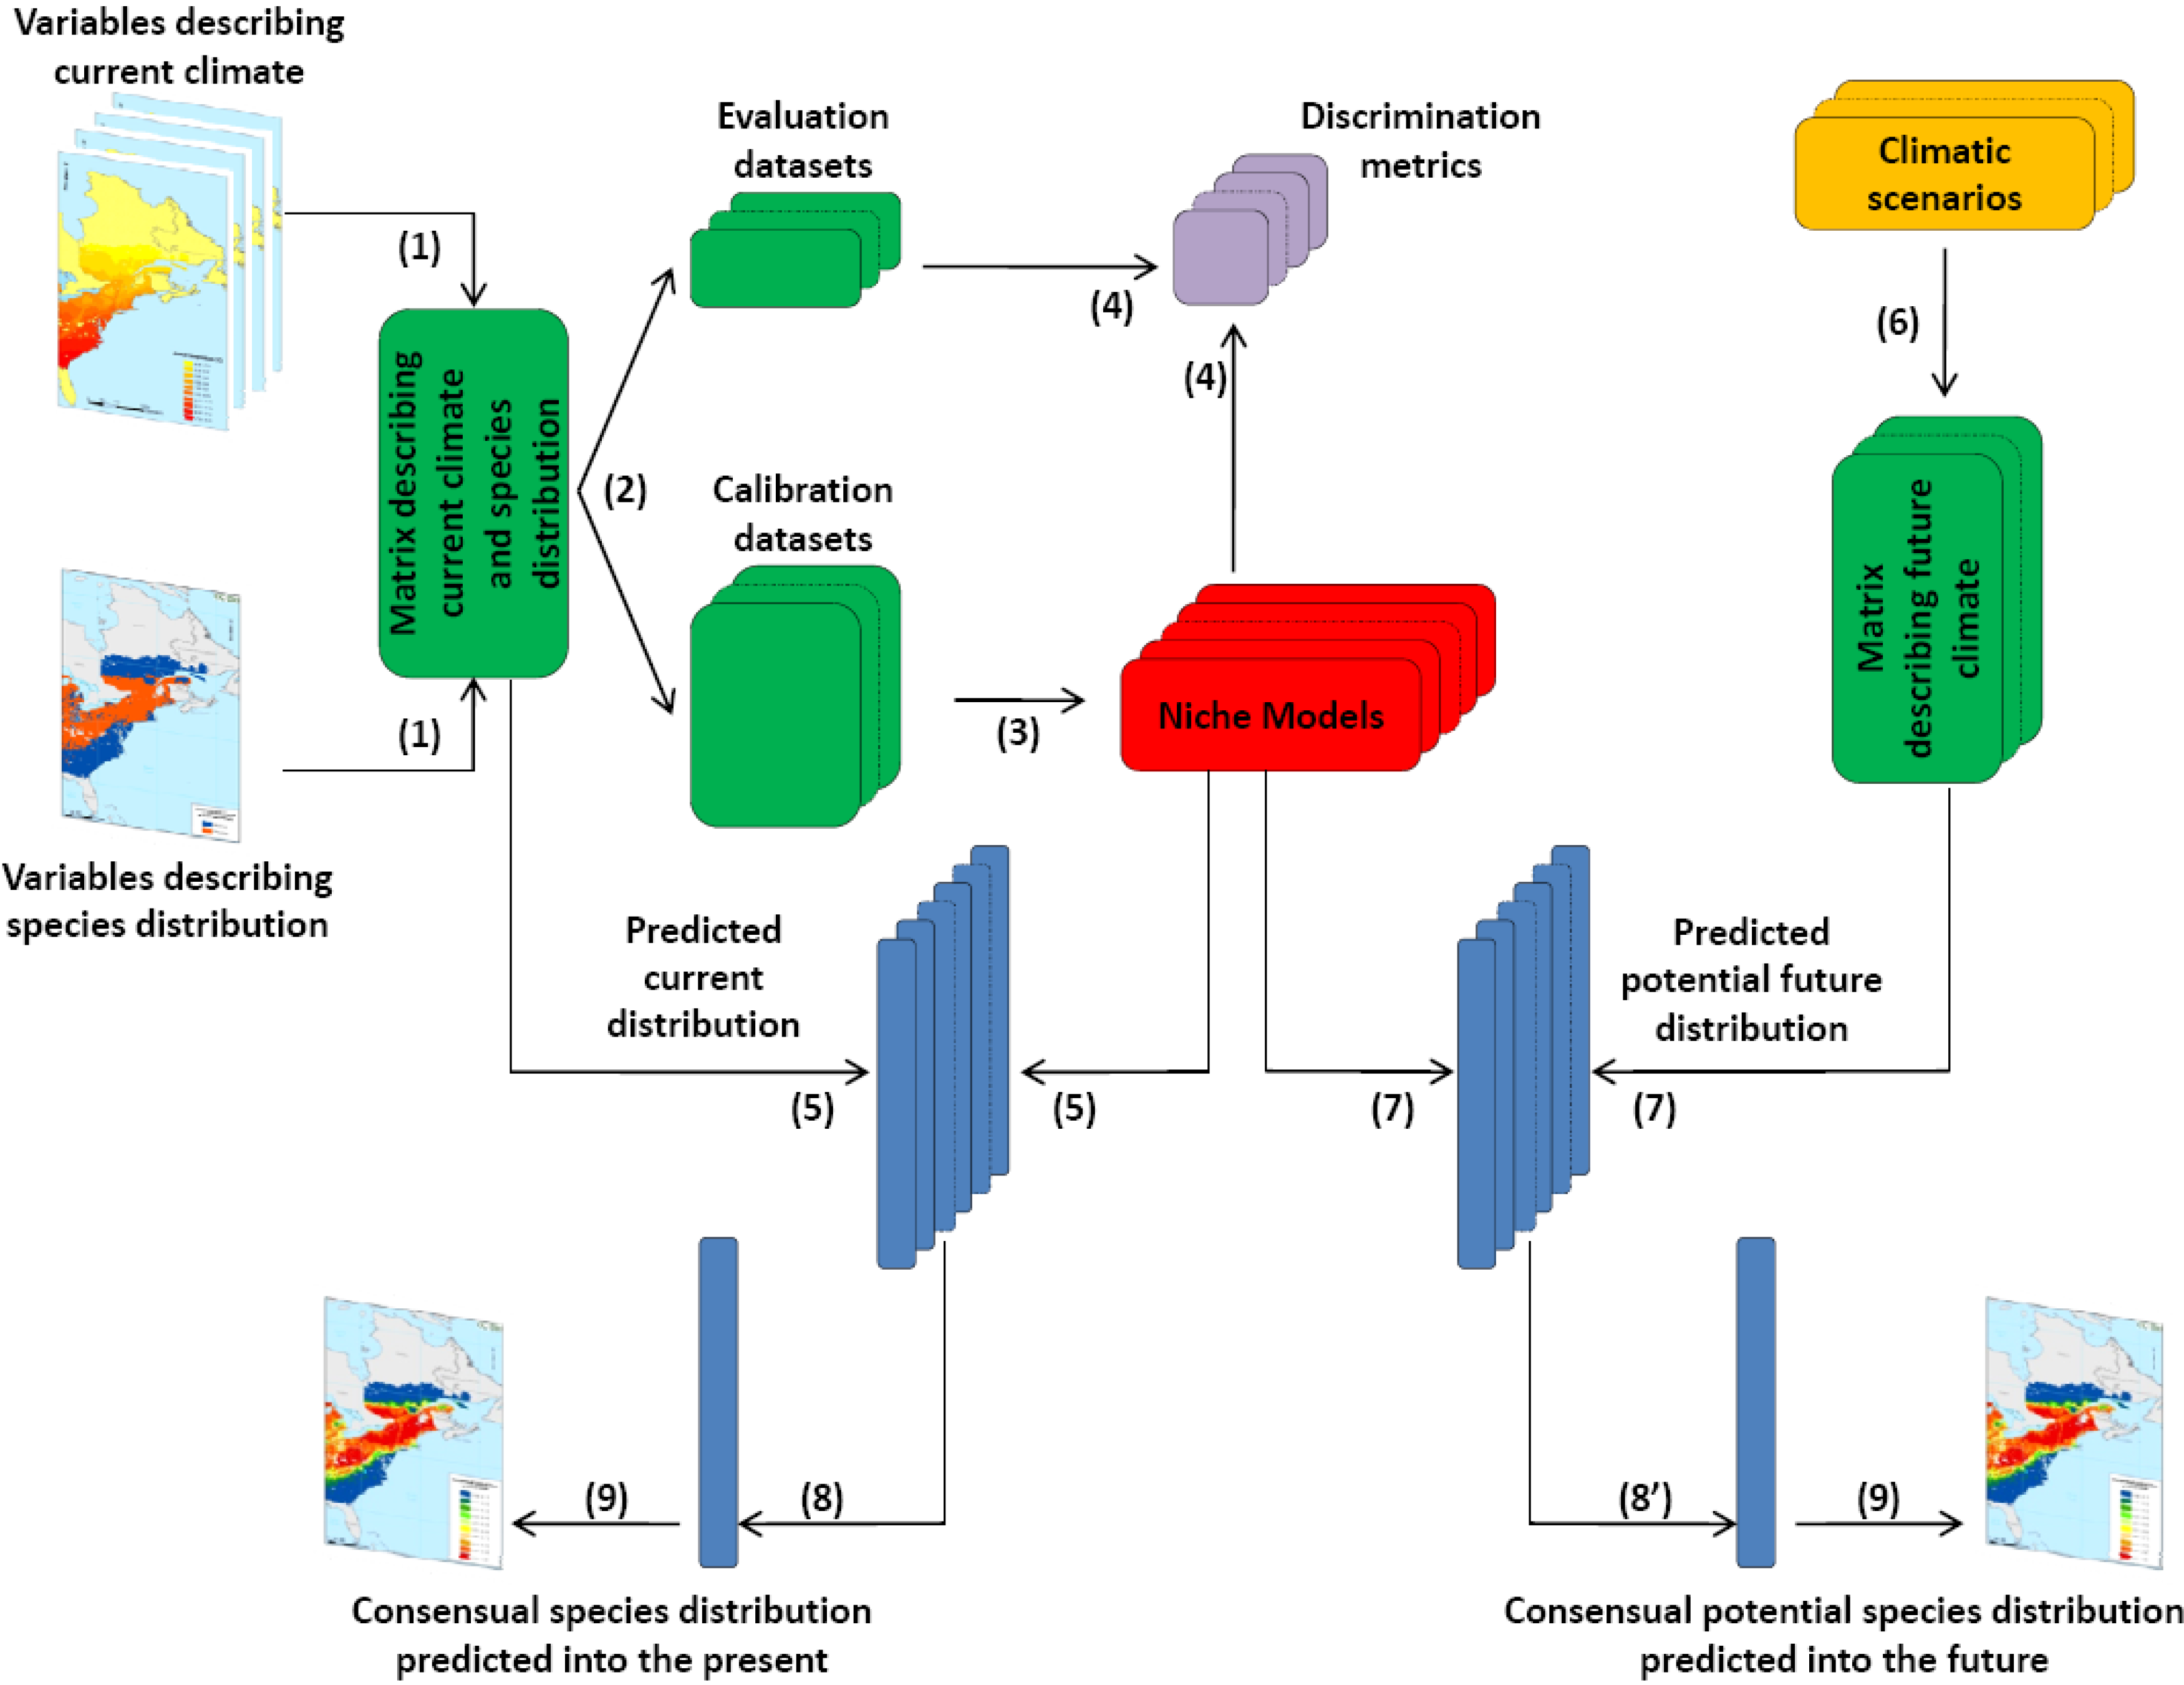
2.2. Scientific Approach

We use a three-pronged approach with the following specific objectives: (1) to describe the relationships between recent (30–40 years) changes in climate, and changes in the phenology and distribution of target animal and plant species from Quebec; (2) to forecast, using ecological niche models, potential future changes in distribution and abundance of a large range of species under plausible climate change scenarios; and (3) to develop regional adaptation strategies for biodiversity conservation.
Reporting on the current effects of climate change on local biodiversity (Objective 1) makes climate change more tangible and tractable and is critical to convince managers, policy makers, and the public that future changes to biodiversity patterns are to be expected from climate change. In addition, the credibility of projections generated by complex models (Objective 2) is strongly enhanced when projections are consistent with trends already observed locally (e.g., northward displacement of species ranges). Development of regional adaptation strategies (Objective 3) is more likely to be successful when partners collectively create the scientific knowledge (Objectives 1 and 2) from which these strategies are derived. The following summarizes the methods used to progress each objective.
Figure 1. Research structure of the CC-Bio Project highlighting the catalyst role of a boundary organization (center), the diversity of involved partners (circles), and the expertise contributed (italics). Colors of outer circles indicate the type of institution (yellow: universities; green: non-governmental organizations; blue: Quebec provincial government; red: Canadian federal government).
Diversity 02 01181 g001
Objective 1—We quantify contemporary trends in species phenology and distribution, two variables which were selected as indicators of changes to regional biodiversity because of data availability and ease of comparison with global trends [7]. We test three broad hypotheses: (1) timing of spring events such as migration or reproduction has been advanced in reptiles, amphibians, and birds; (2) timing of autumn events such as bird migration has been delayed, and (3) distribution of species such as trees and birds has started to shift poleward. Selection of studied taxa is described in section 2.3.
Objective 2—The strong association between climate or other environmental variables and species distributions has led to the development of ecological niche models [30,31,32,33]. These models develop correlative descriptions of the current environment and species distribution and then, given predicted future environmental conditions, project future species’ potential ranges. Ecological niche models are a central tool for scientists exploring the effects of climate change on living organisms [34,35,36,37]. They have been criticized because they assume species distributions are at quasi-equilibrium with current climate, they sometimes interpret species-climate correlations as causal, and they ignore parameters such as dispersal and biotic interactions [38,39] (but see [40,41,42]). Ecological niche models should thus be seen as powerful initial tools providing a first estimate as to the dramatic impact of climate change on biodiversity [32,43]. They must be used as such rather than as providers of definitive predictions. Imperfect predictions are exceedingly valuable when compared to no projection [44].
Many statistical models (e.g., Generalized Linear and Generalized Additive Models, Classification and Regression Trees, Boosted Regression Trees, Multiple Adaptive Regression Splines, Maximum Entropy) exist to relate environmental variables to species distribution. Model selection is important because it can affect output of analyses. We therefore use multiple models within an ensemble forecasting framework [45,46], and synthesize results using model averaging [47,48]. We use the BIOMOD package [49] implemented in R, a free software environment for statistical computing and graphics [50]. We also developed an R platform which allows us to model species abundance under an ensemble forecasting approach. Bayesian inference is an increasingly important statistical tool in ecology [51,52] and conservation biology [53]. A section of our project aims at developing Bayesian approaches to take into account species interactions when modeling species distributions.
We apply ecological niche models to forecast future potential distributions of a large range of plant (tree and herbaceous species) and animal (amphibians, reptiles, birds, and beaver) species at a common continental scale (grain size of 20 km × 20 km). Independent environmental variables include primarily climate but also some non climatic variables such as altitude, soil characteristics, and land cover (see section 2.3) for a better assessment of species-environment relationships, which improves model quality [38]. The steps leading from initial datasets to projections are summarized in Figure 2 and detailed in Guisan and Zimmermann [31] and Araújo et al. [54]. We use the 2041–2070 and 2071–2100 time periods for our projections because these time scales are ecologically relevant and correspond to available climate projections.
Nearly all existing ecological niche models are based on species distributions that assume a region of continuous presence bordered by an abrupt transition to species absence. These presence/absence range maps exclude information about variations in abundance. If species show a long tail of low abundance as their range limit is approached, delimitation of range limits may be arbitrary and, counter-intuitively, changes in abundance resulting from climate change are likely to be greater near the core of the species’ range than at the periphery [55]. The major barrier to improving models with information about variation in abundance is lack of empirical data. We address this important limitation by analyzing three data sets involving measures of the relative abundance of trees, beaver, and birds across large portions of Quebec.
Objective 3—Adaptation strategies to conserve biodiversity in the face of climate change refer to human activities intended to minimize the anticipated effects of anthropogenic climate change on species that will be adversely affected [56]. Climate envelope models are a first logical step to anticipate the direction and magnitude of future changes to regional biodiversity. However, climate envelope models say nothing about the capacity of species to adapt to climate change. For example, a generalist bird species may be able to quickly shift its distribution with shifting isotherms, whereas a tree species with low dispersal capacity may be unable to do so. For this reason, we complement the top-down approach (i.e., from regional climate change scenarios to potential changes in species ranges) outlined in Figure 2 with a vulnerability assessment of biodiversity components (bottom-up approach), where vulnerability is the product of exposure and sensitivity to climate change. We do so using the Climate Change Vulnerability Index [57] developed by NatureServe (http://www.natureserve.org/climatechange).
Figure 2. Simplified representation of the modeling approach used in CC-Bio. Only the modeling of species presence-absence is shown here. First, data on explanatory variables and species distribution are gathered in the same matrix (1) (for most species, only climatic variables are used as explanatory variables, but for some, such as trees or beaver, edaphic or other physical variables are also used). In order to evaluate models on a pseudo-independent dataset, this matrix is randomly split into two sub-datasets (2): a calibration set (70% of the original matrix) and an evaluation set (the remaining data). This process is repeated several times (represented on the figure by juxtaposed tables) to reduce sampling biases generated during the random selection. Models are built in step (3). Many statistical algorithms are used (e.g., GLM, GAM, CTA, neural networks, random forest) for each calibration dataset in order to consider uncertainty due to differences in modeling procedures (this is the primary main source of uncertainty in the modeling procedure). The predictive performance of all models is then tested (model evaluation) on the evaluation datasets with discrimination metrics (4). Once the predictive performance of models is acceptable, they are used to calculate a probability of occurrence and project the current distribution of species (5). In parallel, many climatic scenarios are generated by climatologists (6). A range of scenarios is used to take into account the second main source of uncertainty into the modeling procedure. Step (7) consists of projecting ecological niches into the future. Multiple projections are then aggregated (steps (8) and (8’)) by a consensus method (ensemble forecasting) that averages all the predictions and summarizes information while considering uncertainty. Step (9) is the final mapping of consensual species current and future ecological niches, considered as potential species distributions.
Diversity 02 01181 g002
The comparison of species vulnerability to climate change across taxa, life history characteristics, protection level, or geographical areas will form the basis for the development of adaptation strategies tailored to Quebec’s environmental and climatic contexts. The development of adaptation strategies to conserve biodiversity in the face of climate change has been a very intense source of research, debate and controversies in the last decade [58,59]. Surprisingly, most of the tools needed to implement these strategies (e.g., protecting dispersal corridors, assisting migration, increasing the size of protected areas) are already known to conservationists [60]. Objective 3 of CC-Bio therefore primarily involves developing the knowledge needed to design new conservation strategies adapted to the specific context of Quebec which is, as shown below, largely defined by its northern biogeography.

2.3. Sources of Data Used in the Project

The type of analyses used in this project requires high-quality data on species distribution. Unfortunately, these data are scarce and taxonomically biased. We thus focused our efforts on the five groups (trees, other vascular plants, amphibians, reptiles, birds) for which good quality data were accessible to us. We also added beaver because we had access to a dataset of exceptional quality. Other sources of information on Quebec biodiversity do exist but either require too much preliminary work to be used in the short-term (e.g., mammals except beaver), are not covered by the taxonomic expertise of the team (e.g., freshwater fish and marine species), or were unknown to us when planning the project (e.g., dragonflies). Although we work with only a fraction of regional biodiversity, the spatial distribution of chosen species is representative of that from other groups, they have a diversified natural history, they strongly structure ecosystems (e.g., trees), and they are the focus of many conservation or management efforts. The magnitude of potential range shifts expected for the chosen species should be highly informative with regard to the expected spatial reorganization of regional biodiversity.
Table 1 gives a referenced summary of the data sources used in CC-Bio, whereas a detailed description of databases is available as Supplementary Material Deposit.

3. Outlook of Expected Results

Because CC-Bio is ongoing, results from Objective 1 are not yet available, whereas results from objectives 2 and 3 are only partial. Yet the analysis of the spatial link between Quebec biodiversity and climate, and the modeling of the climate envelope of one taxon (trees), does demonstrate why Quebec biodiversity should strongly respond to climate change and how it might do so.
Table 1. Referenced list of databases on biodiversity, climate, and soil used by CC-Bio to study the effects of climate change on Quebec biodiversity.
Type of dataName of databaseReference
Biodiversity
BirdsÉtude des Populations d’Oiseaux du Québec (ÉPOQ)http://www.quebecoiseaux.org/index.php?option=com_content&view=article&id=196&Itemid=103
BirdsBreeding Bird Survey (BBS)http://www.pwrc.usgs.gov/BBS/index.html
Amphibians, ReptilesAtlas des Amphibiens et Reptiles du Québec (AARQ)http://www.atlasamphibiensreptiles.qc.ca/
AmphibiansNational Amphibian Atlashttp://www.pwrc.usgs.gov/naa
AmphibiansAtlantic Canada Conservation Data Centerhttp://www.accdc.com/Products/Publicdata.html
Beaver-Jarema et al. [55]
Trees
  • Placettes-échantillons temporaires (PET 3rd program; 120,000 plots)
  • Placettes-échantillons permanentes (PEP; 12,000 permanent plots)
  • USDA Forest Service Tree Atlas
Vascular plantsActaea databasehttp://cc-bio.uqar.ca/publications/ActaeaReport.pdf
Wetlands-Ménard et al. [61]
Threatened and vulnerable speciesCentre de données sur le patrimoine naturel du Québec (CDPNQ)http://www.cdpnq.gouv.qc.ca/index-en.htm
Climate
Current climateAnusplin USDA Forest Service datahttp://forest.moscowfsl.wsu.edu/climate/
Historical climateAdjusted Historical Canadian Climate Data (AHCCD)http://www.cccma.bc.ec.gc.ca/hccd/data/temperature/tempdata_e.shtml
Future climateCanadian Regional Climate Model (CRCM4)http://www.ouranos.ca/
Future climateGlobal Climate Modelshttp://www-pcmdi.llnl.gov/ipcc/about_ipcc.php
Soil variables
Soil (Quebec)SIEFhttp://www.mrnf.gouv.qc.ca/forets/connaissances/connaissances-inventaire-cartes-sief-temporaires.jsp
Soil (USA)USDA SSURGOhttp://soils.usda.gov/survey/geography/ssurgo/

3.1. The Biological Importance of Climate Change in Quebec

Quebec is characterized by its northern climate and relatively low biodiversity. The temperate broadleaf/mixed forest biome, the boreal forest/taiga biome, and the tundra biome represent 14%, 71%, and 15% of the land area (1.7 million km2) of the province, respectively [62]. These biomes are distributed along a 2,000 km latitudinal gradient along which annual average temperature ranges from 5 °C to −8 ºC (Figure 3a). Quebec contains the northern range limit of most of its species, 62% of the threatened or vulnerable species of the province are northern peripherals [62], and the region is the end member of a south-north gradient of decreasing biodiversity that runs through eastern continental North America [63]. Accordingly, the spatial distribution of biodiversity in Quebec is strongly associated with average annual temperature isotherms, as illustrated in Figure 3b to Figure 3c which present data from two vertebrate groups.
Surface air temperatures have increased in southern Quebec during 1960–2005, with significant warming being evident in the western, southern and central parts of the province [26]. These changes have resulted in a shorter frost season and longer growing season [26], two variables directly influencing the biology of most species.
These warming trends should continue in the future, with estimated increases in average annual temperatures in Quebec of 2–5 °C from present to 2090–2099 [13]. The warming climate will induce a quick shift in isotherms globally [64]. We calculated the median future isotherm locations (as the median value of 70 climate scenarios for annual average temperature) and found that the northward shift of isotherms ranges from 240 km (5 °C isotherm) to 650 km (−5 °C isotherm) from present (Figure 3a) to 2071–2100 (Figure 3d). The consequences of such a dramatic shift in isotherms on the future structure (Figure 3e, Figure 3f) and function of biodiversity are unknown, but it is clear that regional changes in climate represent a considerable driver of changes in biodiversity patterns.

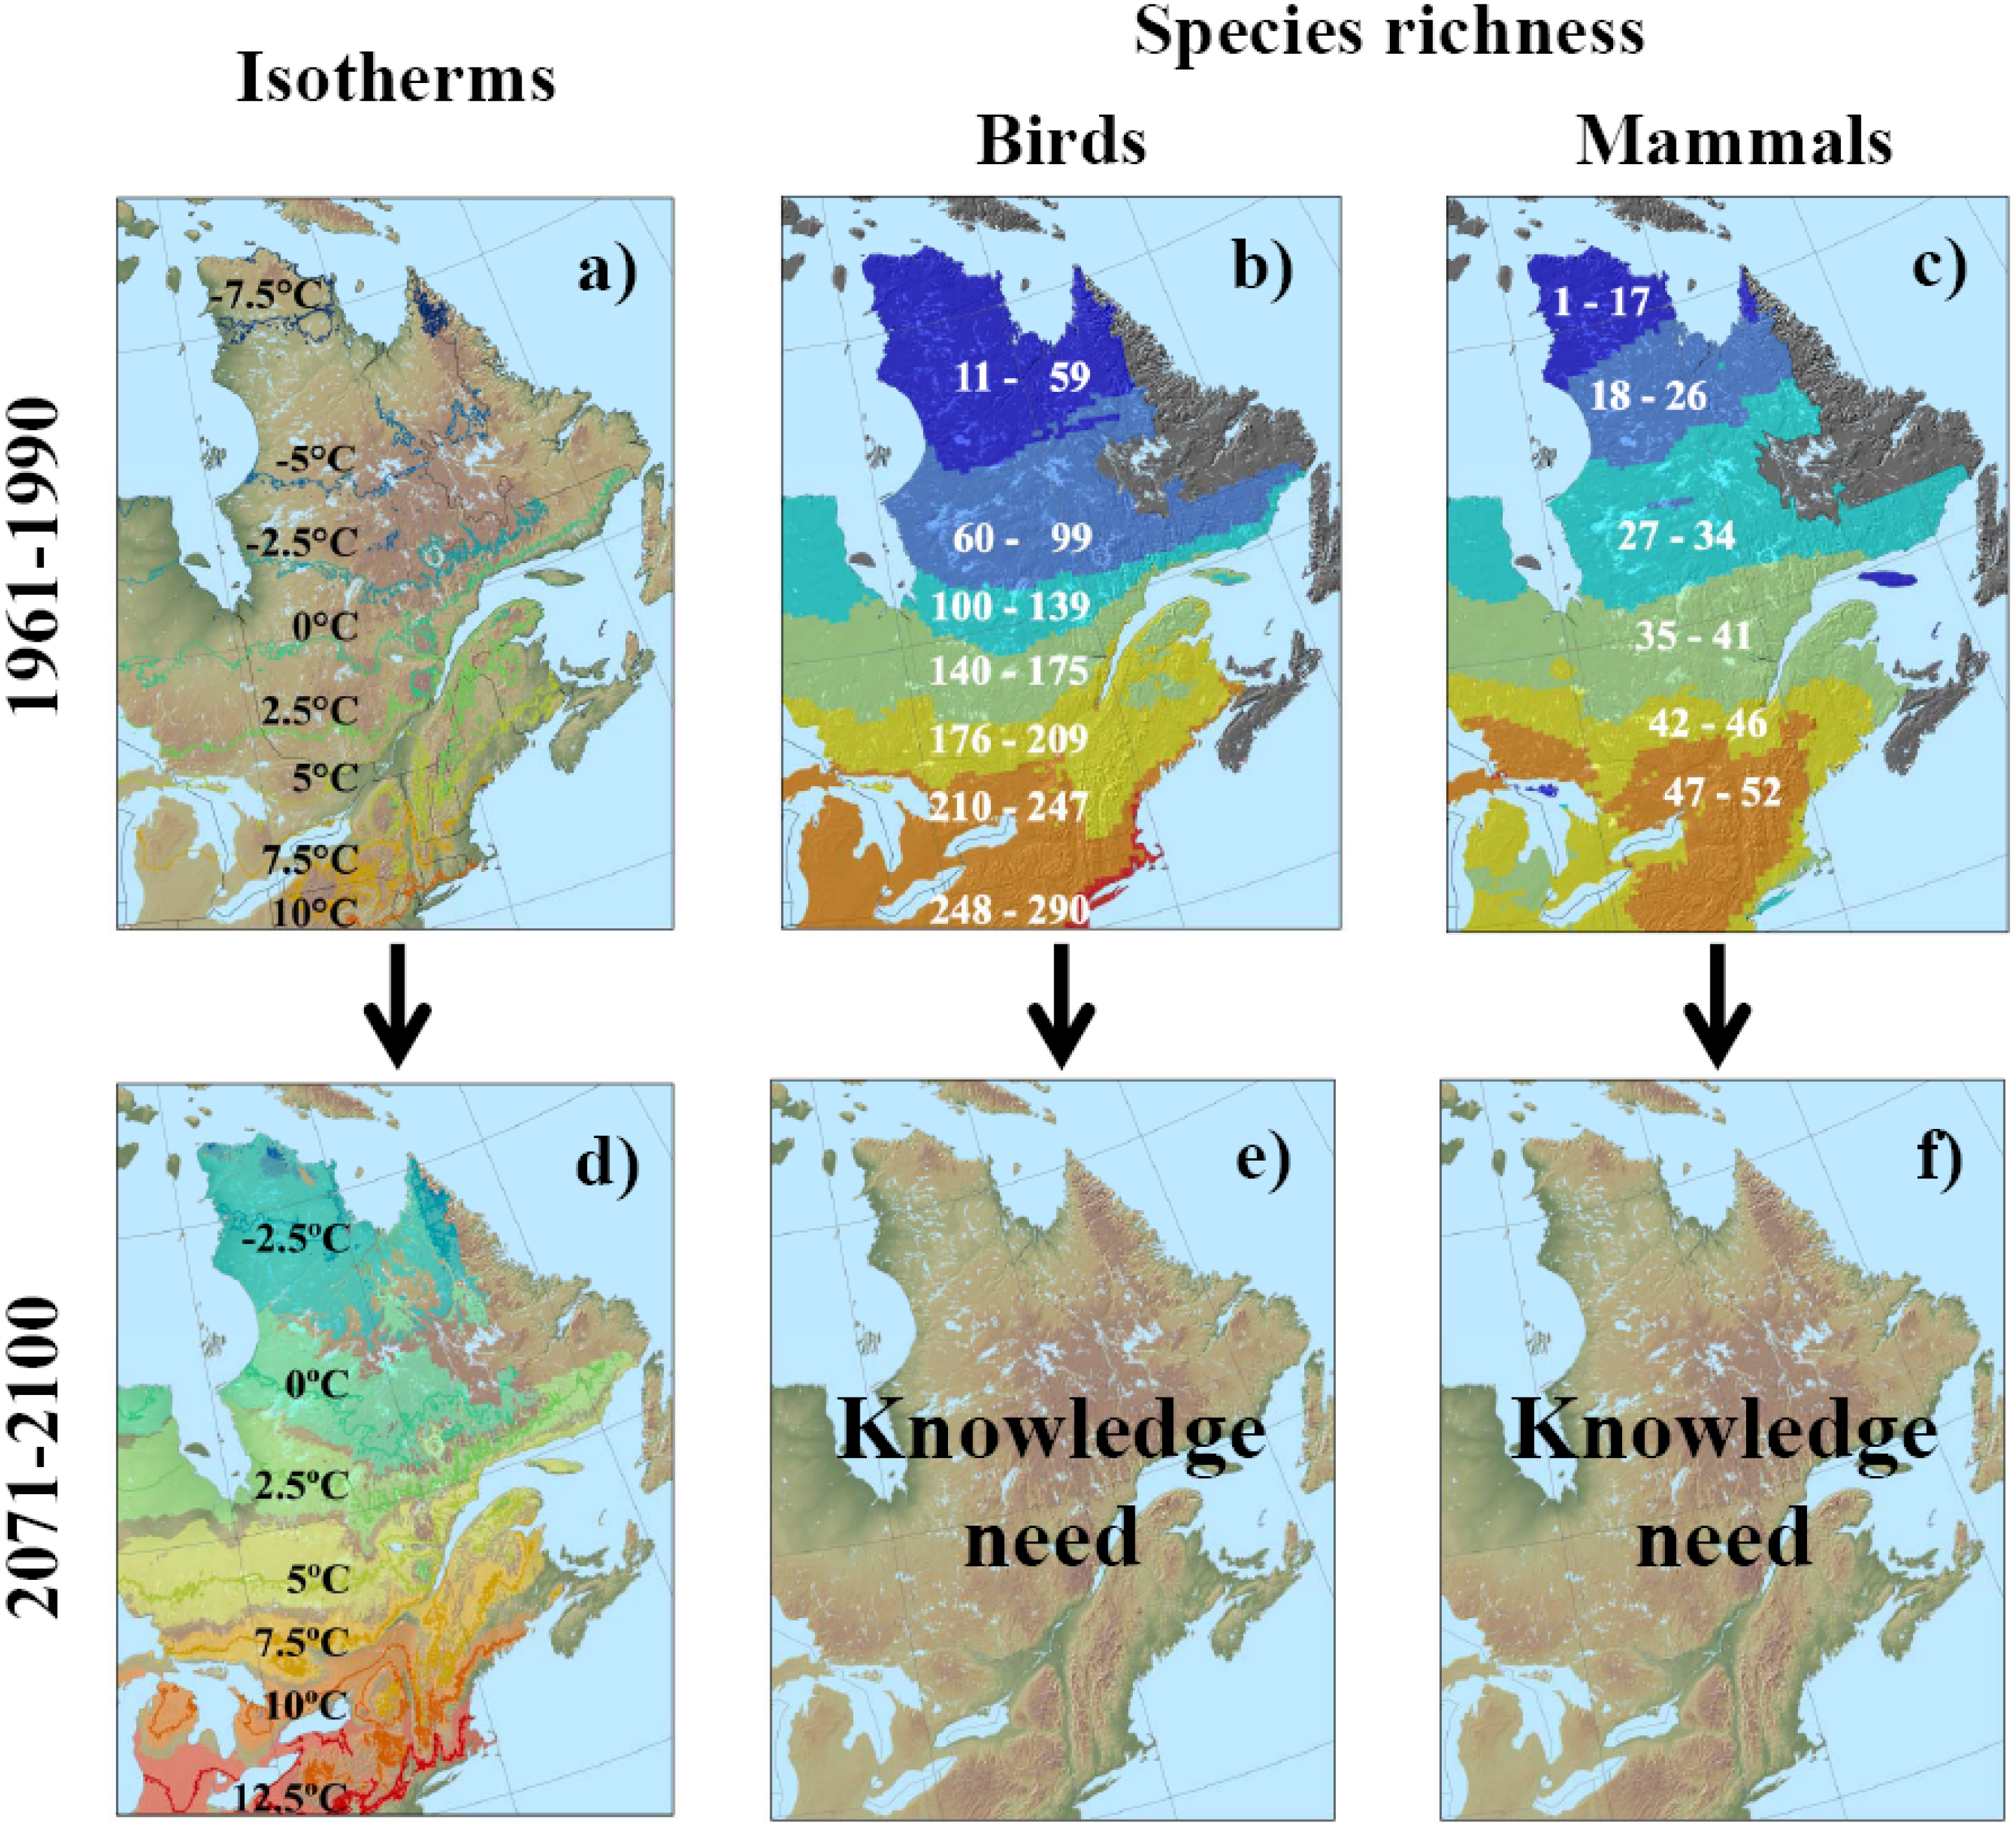
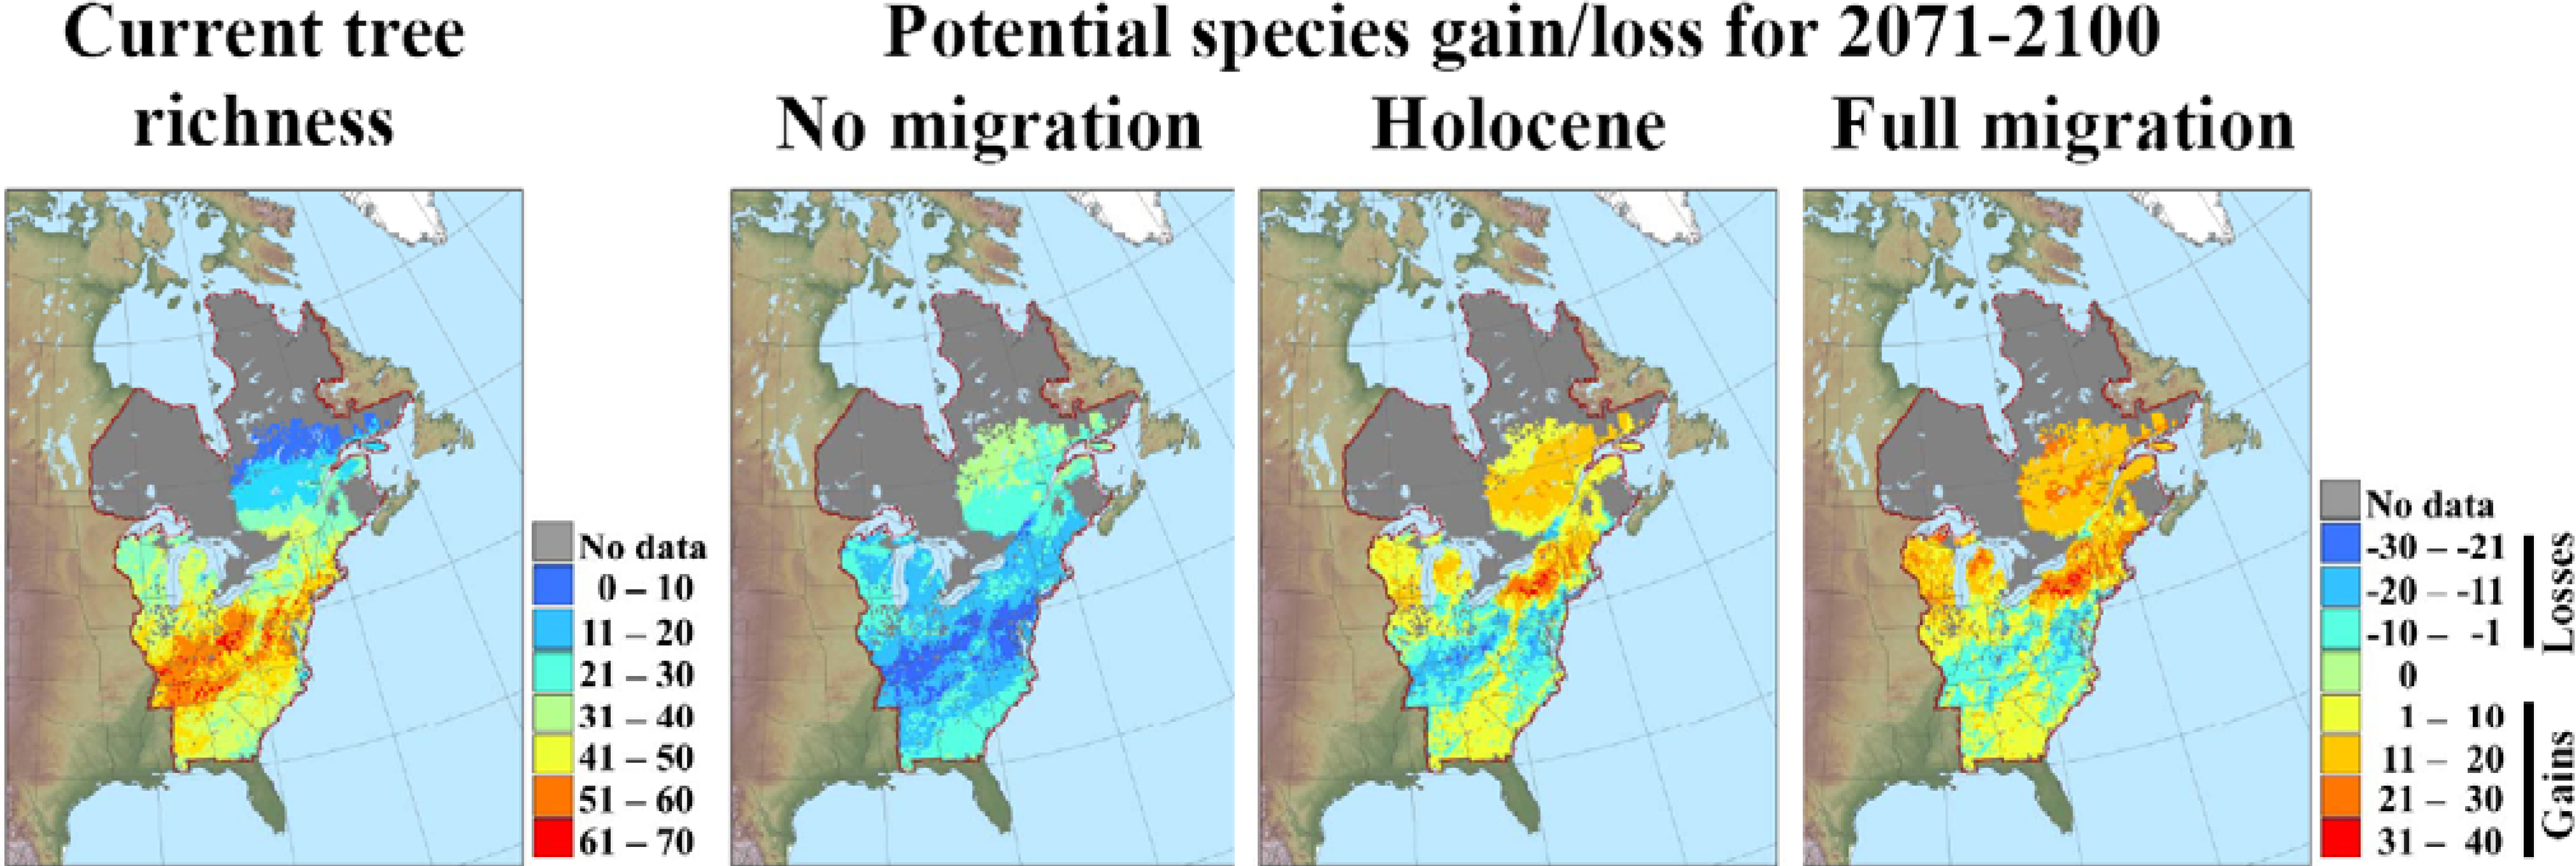
3.2. Potential Response of Quebec Biodiversity to Climate Change: Towards a Northern Biodiversity Paradox

Preliminary results and published information lead us to hypothesize that anthropogenic climate change might increase Quebec biodiversity during this century. This hypothesis (which we refer to as the northern biodiversity paradox) is paradoxical given the largely negative effects of climate change anticipated for biodiversity on a global scale [13,68]. We present the two main sources of support for this hypothesis, as well as three of its important limitations.
Projections for 126 trees species (Figure 4) and six bird species from five families (Northern cardinal, Cardinalis cardinalis; Eastern wood pewee, Contopus virens; Bay-breasted warbler, Dendroica castanea; Turkey vulture, Cathartes aura; Alder flycatcher, Empidonax alnorum; Wild turkey, Meleagris gallopavo; results not shown) suggest that the ecological niche of species occupying the southern part of Quebec (where most of the biodiversity lies) will increase in size due to gains made at the northern periphery of their ranges. This expected northward expansion of the ecological niche confirms modeling results obtained for 15 North American boreal and temperate trees [69], for 150 species of birds in the Eastern United States [70], for mammal species in Canada [71], for the little brown bat Myotis lucifugus in Canada [15], and for a common Lyme disease vector, the deer tick Ixodes scapularis in Quebec [72]. Ecological niche modeling thus strongly supports the northern biodiversity paradox.
Figure 3. Graphical demonstration of the knowledge needs generated by the relations between current climatic gradients, current biodiversity gradients, and expected future climatic gradients in Quebec, Canada: (a) Current (1961–1990) distribution of average annual temperature isotherms, based on data from the USDA Forest Service (see Section 2.3); (b) current bird species richness calculated from range maps provided in Ridgey et al. [65] and overlaid on a 20 × 20 km grid; and (c) current terrestrial mammal species richness calculated from range maps provided in Patterson et al. [66] and overlaid on a 20 × 20 km grid. Classification of species richness values was done using the Jenk's algorithm in ArcGIS 9.3 [67]. Projected distribution of isotherms for 2071–2100 is shown in (d); colored solid lines represent the projected median values of average annual temperatures calculated from 70 future climate scenarios (see section 2.3.), whereas colored envelopes around the lines represent the 95% confidence intervals calculated from the same 70 scenarios. The impacts of anticipated spatial shifts of isotherms on biodiversity patterns are currently unknown (e, f), but represent a critical knowledge need for biodiversity managers and thus constitute a central research goal for the scientific community.
Diversity 02 01181 g003
Figure 4. Potential effects of climate change on tree species richness in eastern North America. Current species richness of trees (a) was generated using modeling procedures explained in Figure 1 (steps 1 to 5) and data on the distribution of 126 species (including 49 species currently present in Quebec) available in various databases (see section 2.3). Model results were overlaid to a 20 × 20 km grid. Potential tree species distribution gains from present to 2071–2100 is shown in ac under 8 climate scenarios representing the full variability of the 70 scenarios used in the CC-Bio project (section 2.3). Model results were aggregated using a consensus approach (Figure 1, step 8’) and three assumptions of tree migration rates were used: (b) species cannot migrate as new suitable niches are created by a warmer climate; (c) migration rates cannot exceed 3 km per year, in accordance with average migration rates of trees during the Holocene [73,74]; (d) migration rates are not constrained. The red line indicates limits of the CC-Bio study area and legends show correspondence between colors and current tree species richness (a) and between colors and potential gain/loss in tree species richness by 2071–2100 (b-d).
Diversity 02 01181 g004
The northern biodiversity paradox gains further support when one considers the important reservoir of species inhabiting regions bordering Quebec to the south (Table 2) and potentially available to colonize new habitats as climatic constraints are relaxed. For example, the reservoirs of terrestrial species from seven taxa of conservation importance represent 24% to 150% (mean: 73%) of the current Quebec species richness (Table 2). In short, the northern biodiversity paradox suggests that, in northern regions where low temperatures are currently a limiting factor for the establishment of many species, climate warming can lead to potential biodiversity increases.
Although the northern biodiversity paradox hypothesis is supported by modeling results coupled to current latitudinal gradients of biodiversity, its predictive power is limited by the assumptions under which ecological niche modeling is performed. In particular, the potential limitations to the migration of species, the cumulative impacts of climate change and other drivers, and the unknown outcomes of new species interactions, generate three important uncertainties regarding the ability of species to effectively track their shifting ecological niche. We explain each of these limitations in the specific context of Quebec.
Table 2. Estimated species richness of several taxonomic groups in Quebec and in the jurisdictions bordering Quebec to the south. QC: Quebec, ON: Ontario, NY: New York, VT: Vermont, NH: New Hampshire, ME: Maine, NB: New Brunswick, Ref.: references. The column “Res.” (Reservoir) gives the number of species (and percentage relative to current species richness in Quebec) which are absent from Quebec but present in at least one of the other jurisdictions. The last row gives the area (thousands of km2) of each jurisdiction.
TaxaQCNYVTNHMENBONRes. (%)Ref.
Breeding birds23323018418119717924157 (24%)a
Mammals7596557879749130 (40%)b
Amphibians2132212117162214 (67%)c
Reptiles 1163219181672424 (150%)c
Odonata 213918513515315912917070 (50%)d
Trees164302184184200123258188 (115%)e
Vascular plants 32,8553,2672,0071,9652,1551,5502,4121,821 (62%)e
Area1,542141252486731,076 f
1 excluding marine turtles; 2 dragonflies and damselflies; 3 vascular plants other than trees.a North America Breeding Birds Survey (BBS): http://www.pwrc.usgs.gov/BBS/b Smithsonian National Museum of Natural History: http://www.mnh.si.edu/mna/search_latlong.cfmc Ontario Herpetofaunal Summary Atlas: http://nhic.mnr.gov.on.ca/MNR/nhic/herps/ohs.html; New York State Amphibian and Reptile Atlas Project: http://www.dec.ny.gov/animals/7140.html; The Vermont Reptile and Amphibian Atlas: http://community.middlebury.edu/~herpatlas/herp_index.htm; New Hampshire Reptile and Amphibian Reporting Program: http://www.wildlife.state.nh.us/Wildlife/Nongame/RAARP/NH_herp_list.htm; Maine Herpetological Society: http://www.maineherp.org/index.php; New Brunswick Natural Resources: http://www1.gnb.ca/0078/WildlifeStatus/results-f.asp; Atlas des amphibiens et des reptiles du Québec: http://www.atlasamphibiensreptiles.qc.ca/d http://www.odonatacentral.org/; http://entomofaune.qc.ca/entomofaune/odonates/Liste_especes.htmle United States Department of Agriculture (Natural Resources Conservation Center): http://plants.usda.gov/adv_search.htmlf Institut de la statistique du Québec: http://www.stat.gouv.qc.ca/jeunesse/territoire/superficie.htm; Wikipedia The Free Encyclopedia: http://en.wikipedia.org/wiki/List_of_U.S._states_and_territories_by_area
The limitations to the immigration of species to Quebec stem from several sources. First, the speed at which isotherms are shifting exceeds the speed at which some species can colonize new habitats through dispersal of individuals or propagules. For example, the velocity of the 5 °C isotherm is projected to be about 2 km per year during this century in Quebec (Figure 3a, d), whereas the speed at which earthworms can colonize new habitats through active dispersal is in the order of only a few meters per year [75]. Second, some natural (e.g., the Ottawa River between Ontario and Quebec) and anthropogenic (e.g., the Montreal urbanized area and the fragmented habitats in southern Quebec) landscape features represent important dispersal barriers for some species, such as terrestrial reptiles, amphibians, or some plants. Therefore not all species will be able to take advantage, within a few decades, of the northward expansion of their climatic niche.
The potentially positive effects of climate change on species richness do not take into account future changes in land use that may arise from potential changes in urbanization, agricultural practices, or forest management. For example, farming practices are quickly changing in the St. Lawrence lowlands, with important consequences for local biodiversity [76,77]. There is a possibility that cumulative impacts of both climate and land use changes result in a net loss of biodiversity in Quebec, even if climate change alone would lead to a net increase in biodiversity.
The reorganization in the distribution and abundance of species will generate a myriad of new species interactions, as well as changes in the intensity of many interactions that already exist. It is impossible to predict the outcomes of all these complex interactions [44,78], but it is likely that competition with presently-established species will strongly limit colonization by some potential newcomers. For example, it is unclear how the mechanisms governing the transition between the deciduous and conifer forests (Figure 4) will allow for a fast northward migration of deciduous species into the ecozones dominated by conifers. Likewise, Quebec is relatively protected from aggressive invasive species because of its climate, but warming trends combined with novel habitats may facilitate the spread of exotic invaders that will compete with local biodiversity [79]. In addition to the limitations of the northern biodiversity paradox outlined above, one must add the potential disappearance of some arctic or alpine species that will not be able to cope with the new climatic conditions or will be excluded by more competitive species moving northward or upslope.

4. Expected Conservation Impacts

There are several implications of our emerging results for biodiversity conservation in Quebec. Mawdsley et al. [60] recently reviewed scientific literature and public policy documents to develop a list of climate change adaptation strategies for wildlife management and biodiversity conservation. They focused on strategies developed in government agencies and nonprofit organizations in Canada, Mexico, South Africa, and the United States. They found that 16 adaptation strategies had been proposed, and grouped them into four broad categories: land and water protection and management, direct species management, monitoring and planning, and law and policy. They note that strategies are “broad and general, such as might be adopted by management agencies at a national or subnational level”. We used Mawdsley et al.’s [60] list as starting point to evaluate some of the main merits and drawbacks of available adaptation strategies in the Quebec context (Table 3). This evaluation stemmed from both the structure of CC-Bio (Figure 1) that promoted exchanges between experts, and our preliminary results (Figure 3 and Figure 4) that created a new context for thinking regional biodiversity conservation.
Table 3. List of climate-change adaptation strategies for biodiversity conservation developed by government agencies and nonprofit organizations in Canada, Mexico, South Africa, and the United States (left column, modified from Mawdsley et al. [60]) with comments on their suitability in the Quebec regional context (right column).
Adaptation strategySuitability for Quebec
Land and water protection and management
1. Increase extent of protected areasCurrently undertaken in northern Quebec where protected areas are scarce and human density is low. Little room is available in the southern part of Quebec (<50º Lat. N) where human density and demand for land are high and where biodiversity and presence of species at risk reach their peak in the province [62]. A target of 12% of protected area has been set for 2015 in Quebec (the 2009 figure is 8.12%, [80], but this may be insufficient to conserve some taxonomic groups [81,82].
2. Improve representation and replication within protected-area networks to conserve multiple examples of each ecosystem typeSame as #1, but more knowledge is needed to predict how ecosystem types will be reorganized through time as climate changes, and how decisions about representation made now will remain valid in the future.
3. Improve management of existing protected areas to offset some of the effects of climate change (e.g., build dikes to protect some coastal sites from sea-level rise)This strategy might potentially prove useful but a gap analysis is first needed to identify the protected areas most vulnerable to climate change, and to determine the management tools that could offset the effects of climate change.
4. Design new natural areas and restoration sites to maximize resilience of natural systems to climate-change effects (e.g., establish protected area networks along elevational gradients to allow species to shift distributions along these gradients)The strong latitudinal gradient in temperatures found in Quebec suggests that species migrations will occur mostly along a south-north or southwest-northeast axis. Therefore, spatial configuration of protected areas and corridors should favor connectivity along these axes. This raises important challenges for conservation in the agricultural parts of Quebec [80]. Also, although altitudinal gradients are less important in Quebec than in other Canadian provinces (like British Columbia), some regions with strong altitudinal gradients and high biodiversity value have already been identified (e.g., Chic-Chocs area) and should deserve special attention.
5. Protect movement corridors, stepping stones, and refugia to direct protection efforts toward areas deemed essential for climate-induced species redistributionSee # 4.
6. Manage and restore ecosystem function rather than focusing on specific components (species or assemblages)Ecosystem-based management approaches are progressively implemented in Quebec to manage some ecosystem types such as forests and oceans. However, the complexity of this approach requires a long implementation time, a high level of support and information sharing from federal, provincial and local decision bodies, and a strong involvement of all stakeholders involved in natural resource management.
7. Improve the matrix by increasing landscape permeability to species movementAn important strategy that must be developed in southern Quebec, where the landscape is severely fragmented by urbanization and agriculture. This strategy must be weighed, however, against the costs generated by the facilitation of the immigration of unwanted species coming from the south.
Direct Species Management
8. Focus conservation resources on species that might become extinctThis strategy was implemented in 1989 through the Loi sur les espèces menacées ou vulnérables (Quebec) and in 2002 through the Species At Risk Act (Canada). However, financial resources and political support are often lacking for adequate action, and lack of coordination between the institutions responsible for conservation of resources prevents the strategy from being fully efficient.
9. Translocate species at risk of extinction from sites becoming unsuitable due to climate change to sites more favorable to their continued existenceEarly debate has emerged in Quebec regarding this strategy, with both strong proponents and opponents. The acceptability and effectiveness of this strategy is likely to be case specific. Decisions will need to rely on detailed cost-benefit analyses involving complex assessments of potential ecological risks and sufficient data about population dynamics.
10. Establish captive populations of species that would otherwise go extinctIn a context of limited resources, this might be an interesting tool in cases of extreme necessity, but must not be seen as a viable option in the long-term because of prohibitive costs (except perhaps in the case of ex situ conservation of plants, if this is considered as part of strategy # 10).
11. Reduce pressures on species from sources other than climate changeThis is the main goal of currently-existing conservation strategies implemented in Quebec, but habitat loss and fragmentation are still the most likely causes of extinction or extirpation for some taxa (e.g., reptiles, amphibians). Most species at risk are located in the south of the province, where land tenure is mostly private and protected areas are scarce.
Monitoring and Planning
12. Evaluate and enhance monitoring programs for wildlife and ecosystemsWays to enhance biodiversity monitoring programs in the context of climate change are currently being analyzed by the Quebec government, in collaboration with academic researchers. However, the costs involved in biodiversity monitoring in a large area with low population density such as the province of Quebec can be prohibitive. Improved support to and better coordination of the efforts of naturalists (citizen science) must be considered.
13. Incorporate predicted climate-change impacts into species and land-management plans, programs, and activitiesThe existence of a boundary organization such as Ouranos (see text) which is in relation with data users, planners, and decision-makers, and the current implementation of new research projects through the Quebec Plan d’Action sur les Changements Climatiques should help to implement this strategy in Quebec.
14. Develop dynamic landscape conservation plans that explicitly address the climate adaptation needs of wildlife and biodiversity at a landscape scaleSee # 13. However, the perceived poor economic benefits of conserving biodiversity represent a strong obstacle to fully implementing this strategy.
15. Ensure wildlife and biodiversity needs are considered as part of the broader societal adaptation process, which targets mainly human health, infrastructure needs, and economically important resources See # 14.
Law and Policy
16. Review and modify existing laws, regulations, and policies regarding wildlife and natural resource management, which were designed for the conservation of “static” biodiversityNot to be implemented in the short term, since additional knowledge on the effects of climate change on biodiversity, as well as massive collaboration between stakeholders are first required.
Outlining detailed strategies for conservation of Quebec biodiversity in a new context of climate change requires more knowledge than is currently available, a longer period of time than the duration of the CC-Bio Project, and further dialogue between stakeholders than this team of authors could afford to organize. Therefore, Table 3 is a preliminary exercise; yet a few salient points emerge. First, many tools available to conserve biodiversity in a stable climate remain pertinent in a changing climate, and most strategies developed in other countries are useful when transposed to the Quebec context. However, the strong spatial reorganization and functional modifications of biodiversity that are anticipated from climate change create a number of new challenges regarding biodiversity conservation (e.g., Table 3, bullets 4, 5, 7, 9, 13, 14). These are the topics for which new knowledge and new forums for discussion must be urgently developed in Quebec.
Second, although climate change might become in the future the main cause of species extinction [83], it must not be forgotten that habitat destruction, pollution, introduction of exotic species, and over-exploitation [84] still remain the main sources of biodiversity loss in Quebec and elsewhere.
Third, Quebec presents some unique characteristics regarding its biogeography and climates, which might generate some unique challenges regarding biodiversity conservation. These are not well reflected in Table 3. For example, the fact that most species reach their northern range limit in Quebec, that models predict an increase in the size of the ecological niche of many species, and that many species currently living south of Quebec will see their niche overlapping the Quebec territory in the future, potentially generates the northern biodiversity paradox, as described earlier. This paradox, which might emerge in all northern jurisdictions well connected to their southern neighbors, complicates the messages that the research community must send locally to managers and the public, and raises the question of how to manage new species arriving to Quebec. Will northern regions become future refuges of biodiversity, and will this generate new responsibilities, opportunities, or challenges for biodiversity conservation in these regions?

5. Conclusions

Implementing effective climate change adaptation strategies for biodiversity conservation and ecosystem management is challenging (e.g., [85]). In Quebec, the first forum where information can be coproduced and shared by various players with an interest in biodiversity and ecosystems has now been established through the CC-Bio Project, with the help of a boundary organization. A research approach and sources of data have been identified, preliminary results are being produced, first directions for adaptive strategies have been proposed, and training of a new generation of biologists increasingly informed of climate change issues has started. Although not discussed in this paper, one main boundary object [29] from the CC-Bio Project has been identified in the form of a Climatic Atlas of Quebec Biodiversity, which should greatly help to disseminate the key findings of this research.
Several other large projects (e.g., ATEAM-Advanced Terrestrial Ecosystem Analysis and Modelling [86]; ALARM-Assessing LArge scale Risks for biodiversity with tested Methods [87]; ECOCHANGE-Biodiversity and ecosystem changes in Europe) have identified the vulnerability to global change of human sectors relying on ecosystem services, and the dialogue between scientists and stakeholders as central foci. Coproduction of knowledge is key for progress when developing policies to address complex issues surrounding biodiversity, conservation, and ecosystem management in an era of climate change. The sharing of expertise among scientists within and outside academia ensures that societal concerns are taken into account in the interpretation and discussion of results. More than anything, CC-Bio collaborations are helping to catalyze climate change and biodiversity research in Quebec, contribute to the debate about biodiversity and resource conservation, and inform policy by providing state-of-the art spatial information on potential distribution changes for native species and their ecosystems.

Supplementary Files

Supplementary File 1

Acknowledgements

The CC-Bio project is administered at Université du Québec à Rimouski and is financially supported by (alphabetical order): Ducks Unlimited Canada, the Government of Canada, the Ministère des Ressources naturelles et de la Faune du Québec, the Ouranos Consortium on Regional Climatology and Adaptation to Climate Change, and the Natural Sciences and Engineering Research Council of Canada (Strategic Project Grant STPGP 350816–07). We thank all the naturalists who provided information on Quebec biodiversity, and whose efforts are of immense benefit to science and the conservation of biodiversity. We also thank the students working in CC-Bio. Their time and energy are sustaining this initiative. M. Fast and Y. Gendreau provided useful comments on the final version of the manuscript.

References and Notes

  1. Berteaux, D.; Reale, D.; McAdam, A.G.; Boutin, S. Keeping pace with fast climate change: Can arctic life count on evolution? Integr. Comp. Biol. 2004, 44, 140–151. [Google Scholar] [CrossRef]
  2. Bradshaw, W.E.; Holzapfel, C.M. Evolutionary response to rapid climate change. Science 2006, 312, 1477–1478. [Google Scholar] [CrossRef]
  3. Birks, H.J.B. Holocene Isochrone maps and patterns of tree-spreading in the British Isles. J. Biogeogr. 1989, 16, 503–540. [Google Scholar] [CrossRef]
  4. Huntley, B. European post-glacial forests: compositional changes in response to climatic change. J. Veg. Sci. 1990, 1, 507–518. [Google Scholar] [CrossRef]
  5. Lovejoy, T.E.; Hannah, L. Climate Change and Biodiversity; Yale University Press: New Haven, CT, USA and London, UK, 2004. [Google Scholar]
  6. Walther, G.R.; Post, E.; Convey, P.; Menzel, A.; Parmesan, C.; Beebee, T.J.C.; Fromentin, J.M.; Hoegh-Guldberg, O.; Bairlein, F. Ecological responses to recent climate change. Nature 2002, 416, 389–395. [Google Scholar] [CrossRef]
  7. Parmesan, C.; Yohe, G. A globally coherent fingerprint of climate change impacts across natural systems. Nature 2003, 421, 37–42. [Google Scholar]
  8. Root, T.L.; Price, J.T.; Hall, K.R.; Schneider, S.H.; Rosenzweig, C.; Pounds, J.A. Fingerprints of global warming on wild animals and plants. Nature 2003, 421, 57–60. [Google Scholar] [CrossRef]
  9. Thomas, J.A. Monitoring change in the abundance and distribution of insects using butterflies and other indicator groups. Phil. Trans. R. Soc. B 2005, 360, 339–357. [Google Scholar] [CrossRef]
  10. Walther, G.R.; Berger, S.; Sykes, M.T. An ecological ‘footprint’ of climate change. Proc. R. Soc. B 2005, 272, 1427–1432. [Google Scholar] [CrossRef]
  11. Parmesan, C. Ecological and evolutionary responses to recent climate change. Annu. Rev. Ecol. Evol. Syst. 2006, 37, 637–669. [Google Scholar] [CrossRef]
  12. Walther, G.R.; Roques, A.; Hulme, P.E.; Sykes, M.T.; Pysek, P.; Kühn, I.; Zobel, M.; Bacher, S.; Botta-Dukát, Z.; Bugmann, H.; Czúcz, B.; Dauber, J.; Hickler, T.; Jarošík, V.; Kenis, M.; Klotz, S.; Minchin, D.; Moora, M.; Nentwig, W.; Ott, J.; Panov, V.E.; Reineking, B.; Robinet, C.; Semenchenko, V.; Solarz, W.; Thuiller, W.; Vilà, M.; Vohland, K.; Settele, J. Alien species in a warmer world: Risks and opportunities. Trends Ecol. Evol. 2009, 24, 686–693. [Google Scholar] [CrossRef]
  13. IPCC Climate Change 2007: The Physical Science Basis. Contribution of Working Group I to the Fourth Assessment Report of the Intergovernmental Panel on Climate Change; IPCC: Geneva, Switzerland, 2007.
  14. Lyons, S.K. A quantitative assessment of the range shifts of Pleistocene mammals. J. Mammal. 2003, 84, 385–402. [Google Scholar] [CrossRef]
  15. Humphries, M.M.; Thomas, D.W.; Speakman, J.R. Climate-mediated energetic constraints on the distribution of hibernating mammals. Nature 2002, 418, 313–316. [Google Scholar] [CrossRef]
  16. de Blois, S.; Domon, G.; Bouchard, A. Landscape issues in plant ecology. Ecography 2002, 25, 244–256. [Google Scholar] [CrossRef]
  17. Thuiller, W.; Lavorel, S.; Araújo, M.B. Niche properties and geographical extent as predictors of species sensitivity to climate change. Global Ecol. Biogeogr. 2005, 14, 347–358. [Google Scholar] [CrossRef]
  18. Berteaux, D.; Stenseth, N.C. Measuring, understanding and projecting the effects of large-scale climatic variability on mammals. Climate Res. 2006, 32, 95–97. [Google Scholar] [CrossRef]
  19. Thuiller, W. Biodiversity: Climate change and the ecologist. Nature 2007, 448, 550–552. [Google Scholar]
  20. Root, T.L.; Schneider, S.H. Conservation and climate change: The challenges ahead. Conserv. Biol. 2006, 20, 706–708. [Google Scholar]
  21. Kerr, J.T. Butterfly species richness patterns in Canada: Energy, heterogeneity, and the potential consequences of climate change. Conserv. Ecol. 2001, 5, 10. [Google Scholar]
  22. Clark, J.S.; Grimm, E.C.; Lynch, J.; Mueller, P.G. Effects of Holocene climate change on the C4 grassland/woodland boundary in the Northern Plains, USA. Ecology 2001, 82, 620–636. [Google Scholar]
  23. Hadly, E.A.; Maurer, B.A. Spatial and temporal patterns of species diversity in montane mammal communities of western North America. Evol. Ecol. Res. 2001, 3, 477–486. [Google Scholar]
  24. Nelson, D.M.; Hu, F.S.; Tian, J.; Stefanova, I.; Brown, T.A. Response of C3 and C4 plants to middle-Holocene climatic variation near the prairie–forest ecotone of Minnesota. Proc. Natl. Acad. Sci. USA 2004, 101, 562–567. [Google Scholar] [CrossRef]
  25. Lemieux, C.J.; Scott, D.J. Climate change, biodiversity conservation and protected area planning in Canada. Can. Geogr. 2005, 49, 384–397. [Google Scholar] [CrossRef]
  26. Yagouti, A.; Boulet, G.; Vincent, L.; Vescovi, L.; Mekis, É. Observed Changes in Daily Temperature and Precipitation Indices for Southern Québec, 1960–2005. Atmosphere-Ocean 2008, 46, 243–256. [Google Scholar] [CrossRef]
  27. DesJarlais, C.; Allard, M.; Bélanger, D.; Blondlot, A.; Bouffard, A.; Bourque, A.; Chaumont, D.; Gosselin, P.; Houle, D.; Larrivée, C.; Lease, N.; Pham, A.T.; Roy, R.; Savard, J.P.; Turcotte, R.; Villeneuve, C. Savoir s’Adapter aux Changements Climatiques; Ouranos: Montréal, Canada, 2010. [Google Scholar]
  28. Hulme, M.; Sheard, N. Climate Change Scenarios for Canada; Climatic Research Unit: Norwich, UK, 1999. [Google Scholar]
  29. Guston, D.H. Boundary organizations in environmental policy and science: An introduction. Sci. Technol. Hum. Val. 2001, 26, 399–408. [Google Scholar] [CrossRef]
  30. Austin, M.P.; Cunningham, R.B.; Berry, P.M. New approaches to direct gradient analysis using environmental scalars and statistical curve-fitting procedures. Vegetatio 1984, 55, 11–27. [Google Scholar]
  31. Guisan, A.; Zimmermann, N.E. Predictive habitat distribution models in ecology. Ecol. Model. 2000, 135, 147–186. [Google Scholar] [CrossRef]
  32. Guisan, A.; Thuiller, W. Predicting species distribution: offering more than simple habitat models. Ecol. Lett. 2005, 8, 993–1009. [Google Scholar] [CrossRef]
  33. Austin, M.P.; Belbin, L.; Meyers, J.A.; Doherty, M.D.; Luoto, M. Evaluation of statistical models used for predicting plant species distributions: Role of artificial data and theory. Ecol. Model. 2006, 199, 197–216. [Google Scholar] [CrossRef]
  34. Araújo, M.B.; Pearson, R.G.; Thuiller, W.; Erhard, M. Validation of species-climate impact models under climate change. Glob. Change Biol. 2005, 11, 1504–1513. [Google Scholar]
  35. Martínez-Meyer, E. Climate change and biodiversity: some considerations in forecasting shifts in species' potential distributions. Biodivers. Inform. 2005, 2, 42–55. [Google Scholar]
  36. Heikkinen, R.K.; Luoto, M.; Araujo, M.B.; Virkkala, R.; Thuiller, W.; Sykes, M.T. Methods and uncertainties in bioclimatic envelope modelling under climate change. Prog. Phys. Geog. 2006, 30, 751–777. [Google Scholar] [CrossRef]
  37. Thuiller, W.; Midgley, G.F.; Hugues, G.O.; Bomhard, B.; Drew, G.; Rutherford, M.C.; Woodward, F.I. Endemic species and ecosystem sensitivity to climate change in Namibia. Glob. Change Biol. 2006, 12, 759–776. [Google Scholar]
  38. Pearson, R.G.; Dawson, T.P. Predicting the impacts of climate change on the distribution of species: are bioclimate envelope models useful? Global Ecol. Biogeogr. 2003, 12, 361–371. [Google Scholar] [CrossRef]
  39. Hampe, A. Bioclimate envelope models: What they detect and what they hide. Global Ecol. Biogeogr. 2004, 13, 469–471. [Google Scholar] [CrossRef]
  40. Midgley, G.F.; Hughes, G.O.; Thuiller, W.; Rebelo, A.G. Migration rate limitations on climate change-induced range shifts in Cape Proteaceae. Diversity Distrib. 2006, 12, 555–562. [Google Scholar] [CrossRef]
  41. Hughes, G.O.; Thuiller, W.; Midgley, G.F.; Collins, K. Environmental change hastens the demise of the critically endangered riverine rabbit (Bunolagus monticularis). Biol. Conserv. 2008, 141, 23–34. [Google Scholar] [CrossRef]
  42. Engler, R.; Guisan, A. MigClim: Predicting plant distribution and dispersal in a changing climate. Diversity Distrib. 2009, 15, 590–601. [Google Scholar] [CrossRef]
  43. Rose, N.; Burton, P.J. Using bioclimatic envelopes to identify temporal corridors in support of conservation planning in a changing climate. For. Ecol. Manage. 2009, 258, S64–S74. [Google Scholar] [CrossRef]
  44. Berteaux, D.; Humphries, M.M.; Krebs, C.J.; Lima, M.; McAdam, A.G.; Pettorelli, N.; Réale, D.; Saitoh, T.; Tkadlec, E.; Weladji, R.B.; Stenseth, N.C. Constraints to projecting the effects of climate change on mammals. Climate Res. 2006, 32, 151–158. [Google Scholar] [CrossRef] [Green Version]
  45. Thuiller, W. Patterns and uncertainties of species' range shifts under climate change. Glob. Change Biol. 2004, 10, 2020–2027. [Google Scholar] [CrossRef]
  46. Araújo, M.B.; New, M. Ensemble forecasting of species distributions. Trends Ecol. Evol. 2006, 22, 42–47. [Google Scholar] [CrossRef]
  47. Raftery, A.E.; Madigan, D.; Hoeting, J.A. Bayesian Model Averaging for Linear Regression Models. J. Am. Stat. Assoc. 1997, 92, 179–191. [Google Scholar] [CrossRef]
  48. Marmion, M.; Parviainen, M.; Luoto, M.; Heikkinen, R.K.; Thuiller, W. Evaluation of consensus methods in predictive species distribution modelling. Diversity Distrib. 2009, 15, 59–69. [Google Scholar] [CrossRef]
  49. Thuiller, W.; Lafourcade, B.; Engler, R.; Araújo, M.B. BIOMOD—A platform for ensemble forecasting of species distributions. Ecography 2009, 32, 369–373. [Google Scholar] [CrossRef]
  50. R Development Core Team. R: A Language and Environment for Statistical Computing; R Foundation for Statistical Computing: Vienna, Austria, 2009. [Google Scholar]
  51. Ellison, E. Bayesian inference in ecology. Ecol. Lett. 2004, 7, 509–520. [Google Scholar] [CrossRef]
  52. Clark, J.S. Why environmental scientists are becoming Bayesians. Ecol. Lett. 2005, 8, 2–14. [Google Scholar] [CrossRef]
  53. Wintle, B.A.; McCarthy, M.A.; Volinsky, C.T.; Kavanagh, R.P. The use of Bayesian Model averaging to better represent uncertainty in ecological models. Conserv. Biol. 2003, 17, 1579–1590. [Google Scholar] [CrossRef]
  54. Araújo, M.B.; Thuiller, W.; Pearson, R.G. Climate warming and the decline of amphibians and reptiles in Europe. J. Biogeogr. 2006, 33, 1712–1728. [Google Scholar] [CrossRef]
  55. Jarema, S.I.; Samson, J.; McGill, B.J.; Humphries, M.M. Variation in abundance across a species’ range predicts climate change responses in the range interior will exceed those at the edge: A case study with North American beaver. Glob. Change Biol. 2009, 15, 508–522. [Google Scholar]
  56. Fischlin, A.; Midgley, G.F.; Price, J.T.; Leemans, R.; Gopal, B.; Turley, C.; Rounsevell, M.D.A.; Dube, O.P.; Tarazona, J.; Velichko, A.A. Ecosystems, their properties, goods, and services. In Climate Change 2007: Impacts, Adaptation and Vulnerability. Contribution of Working Group II to the Fourth Assessment Report of the Intergovernmental Panel on Climate Change; Parry, M.L., Canziani, O., Palutikof, J.P., van der Linden, P.J., Hanson, C.E., Eds.; Cambridge University Press: Cambridge, UK, 2007; pp. 211–272. [Google Scholar]
  57. Young, B.E.; Byers, E.; Gravuer, G.; Redder, A. Guidelines for using the NatureServe Climate Change Vulnerability Index; NatureServe: Arlington, VA, USA, 2009. [Google Scholar]
  58. von Storch, H. Climate research and policy advice: Scientific and cultural constructions of knowledge. Environ. Sci. Pol. 2009, 12, 741–747. [Google Scholar] [CrossRef]
  59. West, J.M.; Julius, S.H.; Kareiva, P.; Enquist, C.; Lawler, J.J.; Petersen, B.; Johnson, A.E.; Shaw, M.R. U.S. natural resources and climate change: concepts and approaches for management adaptation. Environ. Manage. 2009, 44, 1001–1021. [Google Scholar] [CrossRef]
  60. Mawdsley, J.R.; O'Malley, R.; Ojima, D.S. A Review of climate-change adaptation strategies for wildlife management and biodiversity conservation. Conserv. Biol. 2009, 23, 1080–1089. [Google Scholar]
  61. Ménard, S.; Darveau, M.; Imbeau, L.; Lemelin, L.V. Méthode de Classification des Milieux Humides du Québec Boréal à Partir de la Carte Écoforestière du 3e Inventaire Décennal. Rapport Technique Q2006-3; Canards Illimités: Québec, Canada, 2006. [Google Scholar]
  62. Tardif, B.; Lavoie, G.; Lachance, Y. Québec Biodiversity Atlas—Threatened or Vulnerable Species; Gouvernement du Québec, Ministère du développement durable, du patrimoine écologique et des parcs, Direction du développement durable, du patrimoine écologique et des parcs: Québec, Canada, 2005. [Google Scholar]
  63. Rockwell, D. Nature of North America; Berkley (TRD): New York, NY, USA, 2002. [Google Scholar]
  64. Loarie, S.R.; Duffy, P.B.; Hamilton, H.; Asner, G.P.; Field, C.B.; Ackerly, D.D. The velocity of climate change. Nature 2009, 462, 1052–1055. [Google Scholar] [CrossRef]
  65. Ridgely, R.S.; Allnutt, T.F.; Brooks, T.; McNicol, D.K.; Mehlman, D.W.; Young, B.E.; Zook, J.R. Digital Distribution Maps of the Birds of the Western Hemisphere; NatureServe: Arlington, VA, USA, 2007; Version 3.0. [Google Scholar]
  66. Patterson, B.D.; Ceballos, G.; Sechrest, W.; Tognelli, M.F.; Brooks, T.; Luna, L.; Ortega, P.; Salazar, I.; Young, B.E. Digital Distribution Maps of the Mammals of the Western Hemisphere; NatureServe: Arlington, VA, USA, 2007; Version 3.0. [Google Scholar]
  67. ESRI. ArcGIS 9.3; ESRI Inc.: Redlands, Canada, 2008. [Google Scholar]
  68. Global Biodiversity Outlook 3; Secretariat of the Convention on Biological Diversity: Montreal, Canada, 2010.
  69. Morin, X.; Thuiller, W. Comparing niche- and process-based models to reduce prediction uncertainty in species range shifts under climate change. Ecology 2009, 90, 1301–1313. [Google Scholar] [CrossRef]
  70. Matthews, S.N.; O'Connor, R.J.; Iverson, L.R.; Prasad, A.M. Atlas of Climate Change Effects in 150 Birds Species of the Eastern United States; US Department of Agriculture, Forest Service, Northeastern Research Station: Newton Square, PA, USA, 2004. [Google Scholar]
  71. Kerr, J.T.; Packer, L. The impact of climate change on mammal diversity in Canada. Environ. Monit. Assess. 1998, 49, 263–270. [Google Scholar] [CrossRef]
  72. Ogden, N.H.; Bigras-Poulin, M.; Hanincová, K.; Maarouf, A.; O’Callaghan, C.J.; Kurtenbach, K. Projected effects of climate change on tick phenology and fitness of pathogens transmitted by the North American tick Ixodes scapularis. J. Theor. Biol. 2008, 254, 621–632. [Google Scholar]
  73. Iverson, L.R.; Schwartz, M.W.; Prasad, A.M. Potential colonization of newly available tree-species habitat under climate change: an analysis for five eastern US species. Landscape Ecol. 2004, 19, 787–799. [Google Scholar] [CrossRef]
  74. Malmsheimer, R.W.; Hefferman, P.; Brink, S.; Crandall, D.; Deneke, F.; Galik, C.; Gee, E.; Helms, J.A.; McClure, N.; Mortimer, M.; Ruddell, S.; Smith, M.; Steward, J. Forest Management Solutions for Mitigating Climate Change in the United States. J. Forest. 2008, 106, 115–117. [Google Scholar]
  75. Marinissen, J.C.Y.; Bosch, F. Colonization of new habitats by earthworms. Oecologia 1992, 91, 371–376. [Google Scholar] [CrossRef]
  76. Jobin, B.; DesGranges, J.L.; Boutin, C. Population trends in selected species of farmland birds in relation to recent developments in agriculture in the St. Lawrence Valley. Agric. Ecosyst. Environ. 1996, 57, 103–116. [Google Scholar]
  77. Roy, V.; de Blois, S. Evaluating hedgerow corridors for the conservation of native forest herb diversity. Biol. Conserv. 2008, 141, 298–307. [Google Scholar]
  78. Krebs, C.J.; Berteaux, D. Problems and pitfalls in relating climate variability to population dynamics. Climate Res. 2006, 32, 143–149. [Google Scholar] [CrossRef]
  79. Brisson, J.; Paradis, E.; Bellavance, M.E. New evidence of common reed (Phragmites australis) sexual reproduction in Eastern Canada: a consequence of the recent global warming? Rhodora 2008, 110, 225–230. [Google Scholar] [CrossRef]
  80. Brassard, F.; Bouchard, A.R.; Boisjoly, D.; Poisson, F.; Bazoge, A.; Bouchard, M.A.; Lavoie, G.; Tardif, B.; Bergeron, M.; Perron, J.; Balej, R.; Blais, D. Portrait du Réseau d’Aires Protégées au Québec, Période 2002/2019; Gouvernement du Québec, ministère du Développement durable, de l’Environnement et des Parcs, Direction du patrimoine écologique et des parcs: Québec, Canada, 2010. [Google Scholar]
  81. Wiersma, Y.F.; Nudds, T.D. Conservation targets for viable species assemblages in Canada: Are percentage targets appropriate? Biodivers. Conserv. 2006, 15, 4555–4567. [Google Scholar] [CrossRef] [Green Version]
  82. Wiersma, Y.F.; Nudds, T.D. Efficiency and effectiveness in representative reserve design in Canada: The contribution of existing protected areas. Biol. Conserv. 2009, 142, 1639–1646. [Google Scholar] [CrossRef]
  83. MEA (Millenium Ecosystem Assessment). Ecosystems and Human Well-Being: Biodiversity Synthesis; World Resources Institute: Washington, DC, USA, 2005. [Google Scholar]
  84. Diamond, J.M. "Normal" extinctions of isolated populations. In Extinctions; Nitecki, M.H., Ed.; Chicago University Press: Chicago, MI, USA, 1984; pp. 191–246. [Google Scholar]
  85. Steffen, W.; Burbidge, A.A.; Hugues, L.; Kitching, R.; Lindenmayer, D.; Musgrave, W.; Stafford Smith, M.; Werner, P.A. Australia's Biodiversity and Climate Change; CSIRO Publishing: Collingwood, Australia, 2009. [Google Scholar]
  86. Cramer, W. Advanced terrestrial ecosystem analysis and modelling. Reg. Environ. Change 2008, 8, 89–90. [Google Scholar] [CrossRef]
  87. Settele, J.; Hammen, V.C.; Hulme, P.E.; Karlson, U.; Klotz, S.; Kotarac, M.; Kunin, W.E.; Marion, G.; O'Connor, M.; Petanidou, T.; Peterson, K.; Potts, S.G.; Pritchard, H.; Pysek, P.; Rounsevell, M.; Spangenberg, J.; Steffan-Dewenter, I.; Sykes, M.T.; Vighi, M.; Zobel, M.; Kuhn, I. ALARM: Assessing Large scale environmental Risks for biodiversity with tested Methods. Gaia 2005, 14, 69–72. [Google Scholar]

