Article

The Canarian Camel: A Traditional Dromedary Population

1
Camino del Aleman 5, 04250 Pechina, Almeria, Spain
2
Laboratorio de Genética, Facultad de Veterinaria, Universidad Complutense, 28040 Madrid, Spain
3
Laboratorio de Genética Molecular Aplicada, Departamento de Genética, Universidad de Córdoba, 14071 Córdoba, Spain
4
Servicio de Ganadería, Diputación Foral de Bizkaia, Avenida Lehendakari Agirre 9-2º, 48014 Bilbao, Spain
*
Author to whom correspondence should be addressed.
Diversity 2010, 2(4), 561-571; https://doi.org/10.3390/d2040561
Submission received: 13 January 2010 / Revised: 10 March 2010 / Accepted: 11 March 2010 / Published: 7 April 2010
(This article belongs to the Special Issue Biological Diversity Assessed by Molecular Methods)

Abstract

:
The domestic camel (dromedary) is the most important livestock species in the Canary Islands and the most important autochthonous European camel population. After six centuries of a successful adaptation process to the particular environment of the Canary Islands, the abandonment of traditional agriculture has led this population to a major bottleneck. Along with a lack of foreign genetic interchanges, this could lead the population to the brink of extinction. Genetic analysis using 13 microsatellites showed the closest genetic proximity to the North African (Tindouf, Algeria) camel population and a certain degree of sub-division, with significant genetic differences among breeders. An important level of genetic differentiation among the different populations analyzed was found with a global FST value of 0.116.

1. Introduction

The earliest origin of the camel (Camelus dromedarius) in the Canary Islands dates back to the European colonization of the islands, without any evidence of pre-Hispanic existence of this species among the “guanches”, the local indigenous population before the Hispanic colonization. The camel (traditionally the term “dromedary” is not used) arrived on the islands from Africa around 1405, accompanying the first expeditions of the Moors. Diego Garcia is quoted as the first, followed by Juan de Bethencourt, to introduce camels into the islands from the nearby African coast during the fifteenth century [1]. The latter came to Africa in search of slaves, as depicted in contemporary documents, and animals were transferred to the Canary Islands together with slaves. The suitability of the camels to the islands led to their expansion throughout the archipelago, although their presence was highest in the south of Gran Canaria and Tenerife, and throughout the island of Fuerteventura and Lanzarote [2]. Such was the prosperity of the camel in these arid lands that only two centuries after its first introduction, there were thousands of animals in the different islands. Significantly, the Canary Islands were the origin of the first introduction of camels to the Australian continent in 1840 [3].
This species was brought from Arabian countries to Spain in 1020 and to Sicily in 1059, and there were many countries that utilized the camel occasionally, such as the German army in Namibia or North Americans in Mexico. However, the species eventually became extinct in those places, with the exceptions of Australia and the Canaries. There were no successful imports to Australia until 1860 [3], so camels have only existed on that continent for 150 years. However, the camel has remained in the Canaries since 1405 without interruption; it has been used as a domestic animal in the Archipelago for more than six centuries and has adapted to the particular climate of the eastern islands. The camel participated in virtually all agricultural work requiring animal power. It also contributed to other different related activities, such as exploiting the steeper slopes to increase arable land, building retaining walls in terrace terrain or loading and transporting rocks where there was no alternative. The cultivation of grape vines in “La Geria” and the rolling swathes of black lava ash across the island geography are examples of the historic impact of camels on the landscape, which is known worldwide [2].
Nowadays, the camel census in the Canary Islands is very limited, without any precise knowledge about which animals could be considered as belonging to the indigenous population. Veterinarians working with this species estimate that there are around 1,000 in the Canaries, particularly in Lanzarote and the south of Fuerteventura.
After several decades and due to health restrictions, the camel population in the Canary Islands is completely isolated. Its genetic characterization is of major importance for the establishment of a proper management program that takes into account the distribution of genetic variability between possible different populations on the different islands, and the identification of the genetic groups that constitute reservoirs of genetic variability. As in other domestic animal species, microsatellites in camels are highly polymorphic, and enough informative markers exist to carry out diversity studies [4,5,6].
The objectives of this study were two-fold: firstly, to position the camel population in the Canary Islands with respect to other traditional camel populations from different countries in Africa and Asia, and secondly, to analyze the level of genetic subdivision on farms in the Islands.

2. Results and Discussion

2.1. Genetic Variability

Microsatellite polymorphism provided 139 different alleles and an average of 10.7 alleles over 13 loci (Table 1). The average expected heterozygosity over all loci ranged from 0.58 (Kenyan origin) to 0.63 (Arabian origin) (Table 2). Significant inbreeding was recorded in the Kenyan (0.05) and Arabian (0.13) populations, as is apparent from the genetic differences given in Table 3. FIS was also positive when considered across populations (FIS = 0.04 ± 0.01). The genetic level of differentiation measured by the FST statistics ranged from 0.095 to 0.116 when the populations were considered separately, or grouped by geographic origin, respectively.
Table 1. Microsatellite polymorphism: the name, primer sequence, number of alleles and reference for the 13 microsatellite markers used.
NamePrimer sequences (5'-3')No of allelesReference
VOLP03AGACGGTTGGGAAGGTGGTA15[7]
CGACAGCAAGGCACAGGA
VOLP08CCATTCACCCCATCTCTC4[7]
TCGCCAGTGACCTTATTTAGA
VOLP10CTTTCTCCTTTCCTCCCTACT8[7]
CGTCCACTTCCTTCATTTC
VOLP32GTGATCGGAATGGCTTGAAA2[7]
CAGCGAGCACCTGAAAGAA
YWLL08ATCAAGTTTGAGGTGCTTTCC21[8]
CCATGGCATTGTGTTGAAGAC
YWLL38GGCCTAAATCCTACTAGAC8[8]
CCTCTCACTCTTGTTCTCCTC
YWLL44CTCAACAATGCTAGACCTTGG8[8]
GAGAACACAGGCTGGTGAATA
CVRL01GAAGAGGTTGGGGCACTAC22[9]
CAGGCAGATATCCATTGAA
CVRL02TGTCACAAATGGCAAGAT4[9]
AGTGTACGTAGCAGCATTATTT
CVRL05CCTTGGACCTCCTTGCTCTG13[9]
GCCACTGGTCCCTGTCATT
CVRL06TTTTAAAAATTCTGACCAGGAGTCTG4[9]
CATAATAGCCAAAACATGGAAACAAC
CVRL07AATACCCTAGTTGAAGCTCTGTCCT20[9]
GAGTGCCTTTATAAATATGGGTCTG
LCA66GTGCAGCGTCCAAATAGTCA10[10]
CCAGCATCGTCCAGTATTCA
Table 2. Inbreeding rate in terms of FIS, expected and observed heterozygosities, and allelic richness (based on minimum sample size of 28 animals) computed by geographical origin of the populations.
OriginFISHeterozygosityAllelic Richness
ExpectedObserved
Canarian0.010.5930.5866.0
Arabian0.13*0.6330.5525.3
Kenyan0.05*0.5810.5525.8
Pakistani-0.020.6240.6404.9
Tindouf (Algeria)0.010.5880.5855.4
* P < 0.01.
The Canarian camel population showed a higher allelic richness with a low level of sub-population division, which could be explained by the currently practiced random mating system.

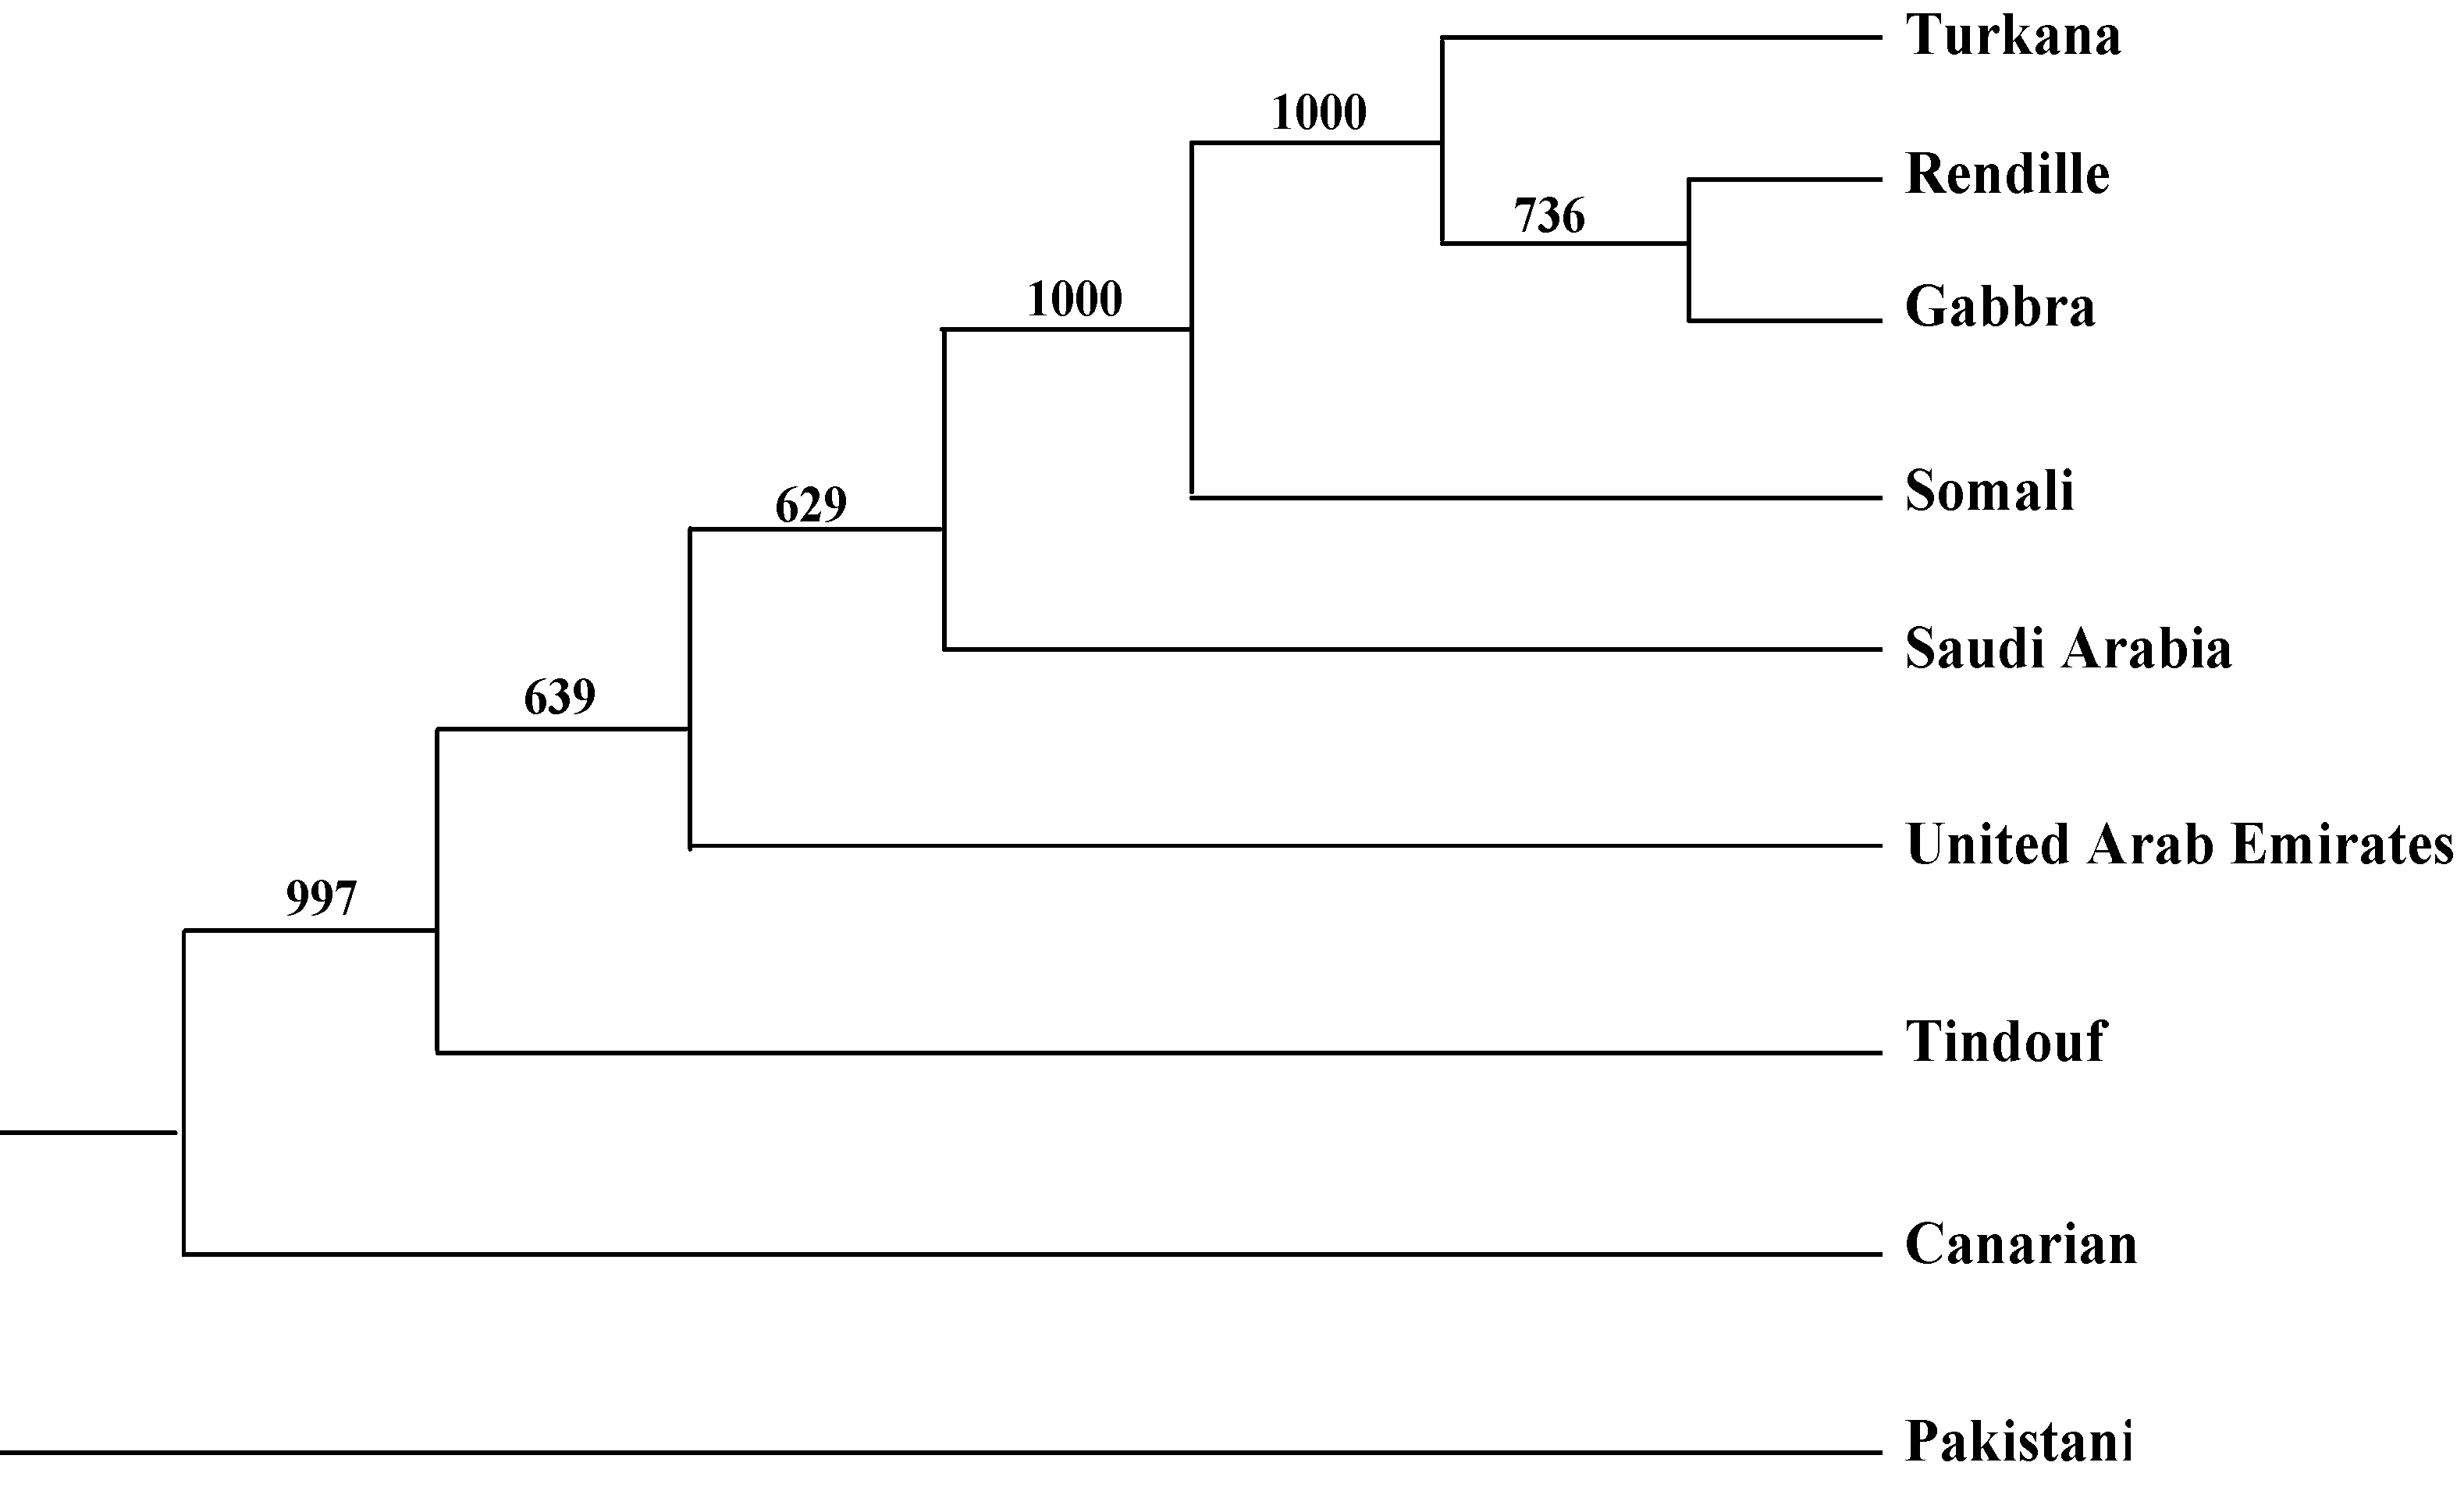
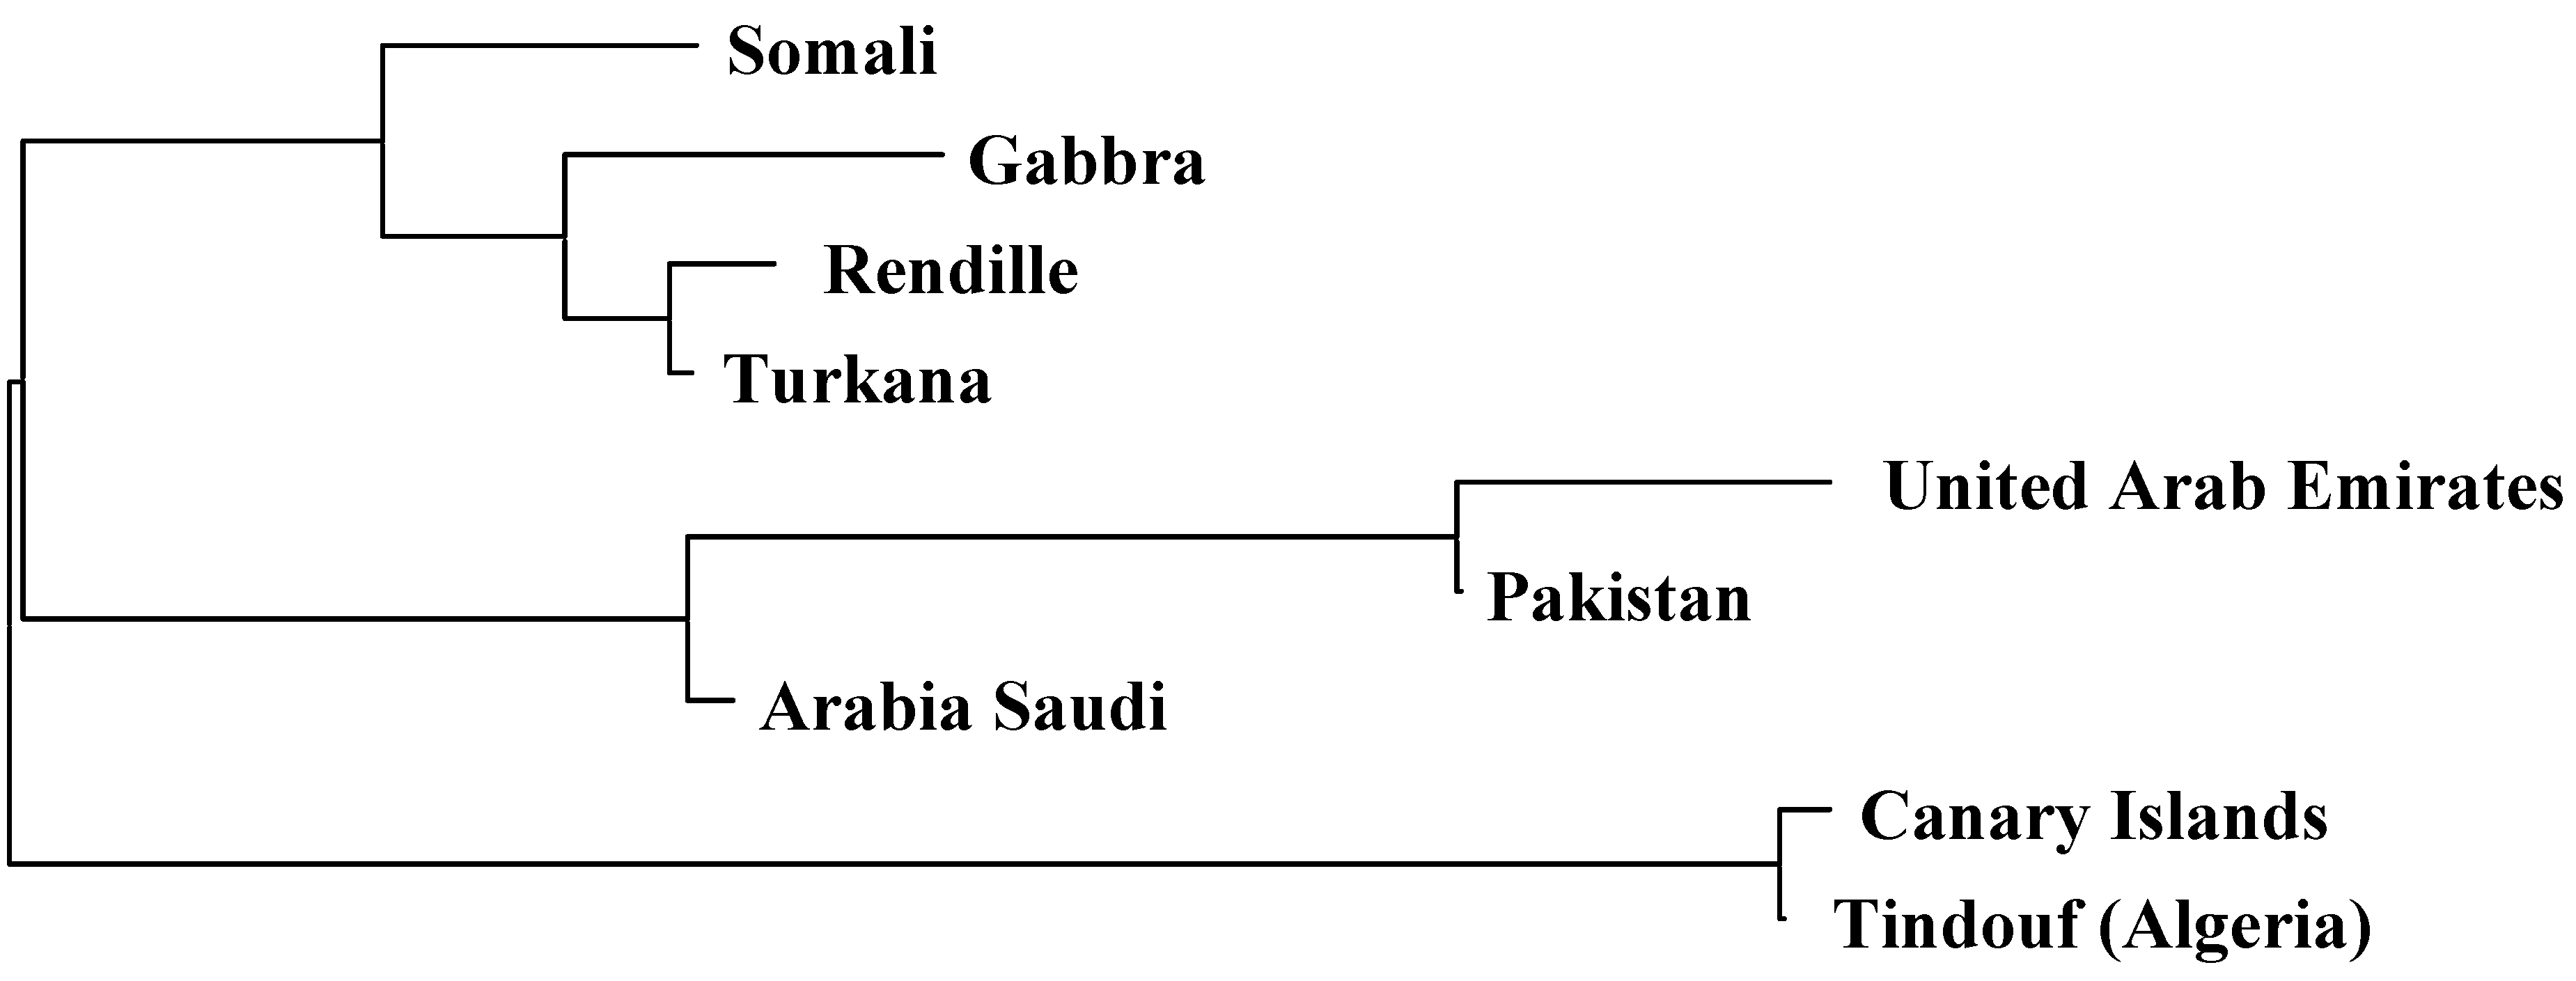
2.2. Genetic Distances and Clustering

All pairwise FST values except three were significantly positive (P < 0.01), and ranged from 0.01 (Somali versus Rendille) to 0.17 (Gabbra and Rendille versus UAE) (Table 3). However, the average genetic differentiation between populations was moderate, with a mean FST of 0.10 ± 0.03.
Table 3. Genetic distance, in terms of FST, for each pair of populations, and average genetic differentiation of each population from the rest.
SomaliRendilleTurkanaGabbraPakistaniSaudi ArabiaUnited Arab EmiratesTindouf (Algeria)Average
Canarian0.140.150.150.150.110.080.110.010.11
Somali 0.010.020.020.110.080.150.140.08
Rendille 0.000.000.130.100.170.160.09
Turkana 0.000.110.090.160.160.09
Gabbra 0.130.090.170.160.09
Pakistani 0.070.090.100.11
Saudi Arabia 0.070.080.08
United Arab Emirates 0.120.13
Tindouf (Algeria) 0.12
The consensus dendrogram in Figure 1 shows the genetic relationships among the populations when the Neighbor-Joining algorithm implemented in the PHYLIP software [11] is applied. Surprisingly, the bootstrap values (values in the nodes) were high, suggesting that the robustness of the tree is also high.
Figure 1. Consensus Neighbor-Joining tree based on the FST distances. The numbers on the branches indicate bootstrap values (the number of times the partition of the populations into the two sets separated by that branch occurred among the trees, out of 1,000 trees).
Diversity 02 00561 g001
Model-based clustering [12] of the camel microsatellite allele frequencies showed that the likelihood of the model increases with the number of inferred clusters (k) and reaches a plateau around k = 4. The information contained in Table 4 represents average percentages of the genome that are assigned to the different theoretical origins in each model obtained from each animal in each population.
Table 4. Estimated membership fractions of camel populations for each of the k inferred clusters with k from 2 to 4. The membership fractions greater than 10 % sharing the same cluster as the Canarian population are shadowed.
Population
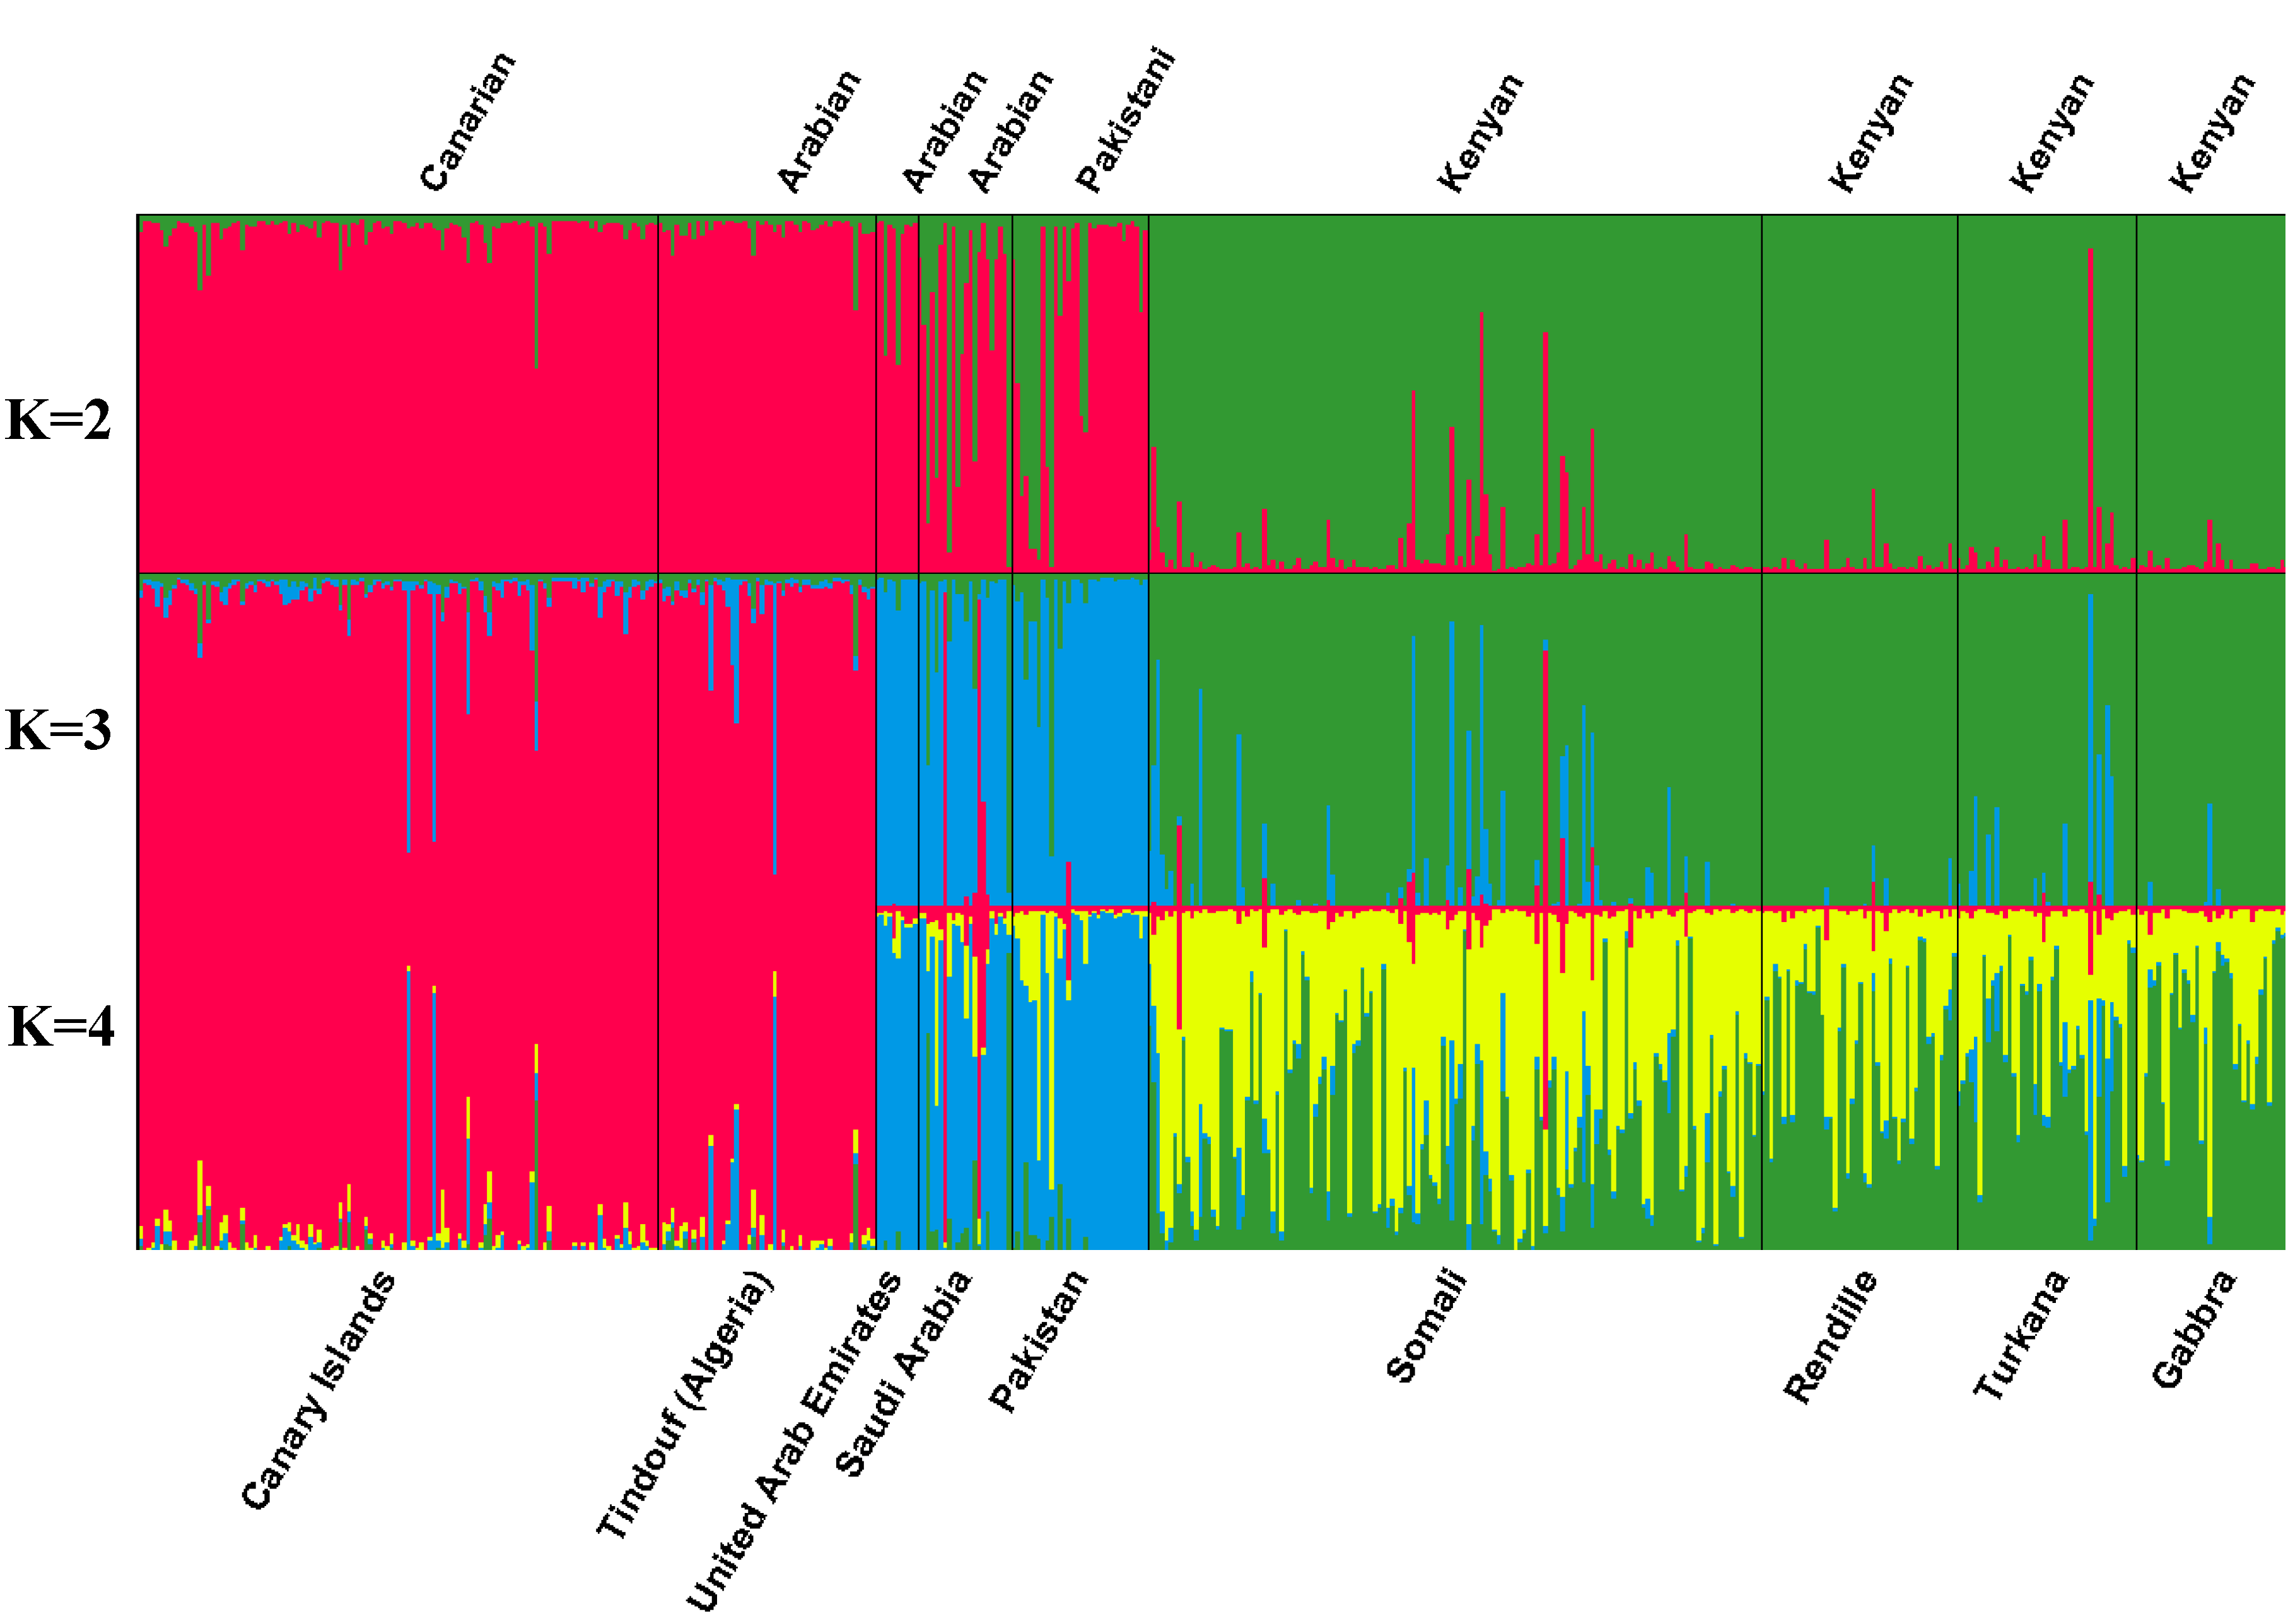
Number of inferred clusters
Two clusters (k=2) Three clusters (k = 3) Four clusters (k = 4)
12 123 1234
Canary Islands0.9670.033 0.9360.0260.038 0.9120.0270.0240.037
Somali0.0570.943 0.0340.8770.089 0.0300.3670.5510.051
Rendille0.0240.976 0.0180.9620.020 0.0170.5860.3810.015
Turkana0.0550.945 0.0210.8760.104 0.0210.5650.3430.072
Gabbra0.0220.978 0.0160.9590.025 0.0150.6610.3080.016
Pakistan0.7200.280 0.0180.0790.903 0.0190.0460.1020.834
Saudi Arabia0.6740.326 0.1330.1240.742 0.1360.1220.0850.656
United Arab Emirates0.9020.098 0.0280.0210.951 0.0290.0230.0290.919
Tindouf (Algeria)0.9690.031 0.9230.0240.053 0.8990.0270.0230.052
It is possible, therefore, to plot the percentage of each animal that comes from each hypothetical source, in order to graphically display the location of possible common origins that they can share with the populations analyzed (Figure 2).
Figure 2. Stacked vertical line plots of the estimated membership fractions of each individual analyzed for each of the k inferred clusters with k from 2 to 4. Individuals are grouped by population.
Diversity 02 00561 g002
According to the results obtained, the genetic proximity between camel populations from the Canary Islands and from Western Africa (Tindouf population) is clearly visible (Figure 2 and Table 4).
Note that when the number of proposed origins is 2 (k = 2), the Canarian population genome is shared with the Arabian countries (Algeria, UAE and Saudi Arabia) and Pakistan. However, when the cluster is 3 (k = 3), Pakistani populations, along with those from UAE and Saudi Arabia, are separated from the Canary Islands and Western Sahara.
Estimated membership coefficients qk(i) of breed i for cluster k were converted into genetic distances of breeds via [13]. Distances were averaged over five different runs at k = 4 and are represented in a Neighbor-Joining tree (Figure 3) by the algorithm implemented in the MEGA program [14].
Figure 3. Neighbor-Joining tree of genetic distances based on estimated membership coefficients qk(i) of population i for cluster k as in [13].
Diversity 02 00561 g003
Since the introduction of camels to the islands in the early fifteenth century, a genetic exchange with the geographically closest camel populations has occurred. This exchange, significantly declined during the twentieth century until 1985, and it was almost suppressed about 12 years ago as a result of sanitary barriers. Actually, the last major import from Western Sahara was in 1969, and although limited imports may have occurred occasionally, the only other relevant transaction was in 1985 from Mauritania. Therefore, a close genetic relationship between the Canary Island camels and the Western Sahara populations is expected, the latter being not only the origin of today's indigenous Canarian population, but also historically the population with which an exchange of breeding individuals has been continuously performed. Concerning the differences between the results when considering three or four clusters, it should be noted that the only relevant fact is the sub-division in populations of the Kenyan camel origin, but this does not affect the conclusions on the Canarian population.
It is noteworthy that over 90% of the genome from Canarian camel population samples seems to have a single cluster to be assigned, and that the same origin is shared in a large percentage (>89%) by camels from the Maghreb, and in a small but significant percentage (>13%) by the population of Saudi Arabia.
In a previous study [6], neutral genetic differences between the camels of African origin and those originating within the Fuerteventura Island (the Majorero population) were pointed out. It might be of interest to analyze the distribution of the genetic diversity within the Canarian camel population in greater depth and to know the relative position of their different farms to the North African population, which, as is to be expected from what we know of the Canarian camel origin, was the closest population. The global FST value was 0.02 (± 0.003) and seems to indicate a certain degree of genetic differences among farms. This was corroborated by the significant genetic differences (FST > 0) for almost 60% of the pair of farms (27 from the 46 pair of populations) (data not shown), the Majorera population being the most different in terms of FST with an average value of 0.062. On the other hand, six of the farms included in the analysis had a significant level of departure from the North African population, with an average of 4%, while four of them look genetically indistinct from that population. This situation is a direct consequence of the use of reproductive animals coming directly from, or being descendants of, the African continent. The result may be indicative of the genetic drift process beginning nearly a quarter of a century ago and that would have significantly accelerated as a result of complete reproductive, and therefore genetic, isolation for nearly three decades, approximately two generations.
The relative genetic isolation observed, along with the inability to import animals from outside Europe due to health reasons, should be taken into account in the future to establish a conservation program because, given the small population size, it can be a source of excessive increases in inbreeding and, consequently, a loss of genetic diversity.

3. Experimental Section

3.1. Sample Collection

Five hundred and five camels were available to carry out the analysis (Table 5). Of these, 122 samples belonged to 10 different farms in the Canary Islands, including a Majorero population previously described by [6]. Blood was collected and stored in 10 ml Magic Buffer® storage buffer.
Samples from Saudi Arabia, United Arab Emirates, Kenya and Pakistan are described in [4] and genotypes were kindly provided by O. Hanotte.
Table 5. Origin and number of the animals included in the analysis.
OriginPopulationN
Canary IslandsCanarian122
Arabian countriesTindouf (Algeria)51
Saudi Arabian22
United Arab Emirates10
KenyaSomali144
Rendille46
Turkana42
Gabbra36
PakistanPakistani32

3.2. DNA Extraction, Microsatellite Markers and Genotyping

Twenty micrograms of genomic DNA were extracted from whole blood using the standard proteinase K/SDS-phenol-chloroform method [15].
Details of the primers, number of alleles and references for the 13 microsatellites used as markers are shown in Table 1.
PCR were performed by multiplexing all microsatellites using the Qiagen Multiplex PCR kit (Izasa, Spain) in a MJ Research PTC200 Thermalcycler (Ecogen, Spain). A volume of 1.2 μL (of 1:8 water diluted PCR product) was mixed with an internal lane standard mixture (LIZ 500, Applied Biosystems Spain) and analysed in an ABI 3130 (Applied Biosystems, USA) automated DNA capillary sequencer. Allele sizes were determined with ABI GeneMapper4.0 software.

3.3. StatisticalAnalyses

Unbiased estimates of gene diversity (expected heterozygosity or Hardy-Weinberg [H-W] heterozygosity), observed heterozygosity and the number of alleles per breed (with their associated standard errors) were calculated using the MICROSATELLITE TOOLKIT [16]. The FSTAT program [17] was used for calculating allelic richness standardized for variation in sample size.
Wright’s F statistics (FIT, FIS and FST, [18]) were calculated with the GENETIX 4.0 [19] program. The significance of FIT and FIS was tested by permutation of the alleles 1000 times within the whole set of populations and within each population respectively. Significant deviation of FST from the null hypothesis was tested using random permutations of genotypes among samples.
To analyze the genetic relationships among individuals and among populations, first we used the FST, which under pure drift conditions (excluding mutations and admixture) increases linearly with time. Secondly, different levels of subdivision and estimates of the proportions of the individual genomes that are derived from the respective inferred clusters were obtained by using the model-based clustering STRUCTURE program [12]. The number of inferred clusters (k) varied from 2 to 4, and for each value of k, five independent analyses were carried out under an admixture model. The proportional contribution of each inferred ancestral population to a given individual was graphically displayed with the DISTRUCT software [20].

4. Conclusions

The situation of the Canarian camel population requires urgent actions in the area of genetic management to maintain the remaining genetic variability in the only European traditional camel population.

Acknowledgements

ADERLAN partially supported this work. We thank Olivier Hanotte (International Livestock Research Institute) for providing the molecular information from the Kenyan, Pakistani, United Arab Emirates and Saudi Arabian camel populations. The Tindouf authorities are also gratefully acknowledged for providing the Saharan camel samples. We thank Ann Holliday for linguistic assistance.

References

  1. Morera, M. La tradición del camello en Canarias. Estudios Atlánticos, n37; Patronato de la Casa de Colón: Madrid-Las Palmas, Spain, 1991; pp. 167–204. [Google Scholar]
  2. Schulz, U. El Camello en Lanzarote; ADERLAN: Lanzarote, Spain, 2008. [Google Scholar]
  3. Phillipson, N.E. Camels in Australia. Proc. Royal Geog. Soc. Aust. 1899, 3, 83–92. [Google Scholar]
  4. Mburu, D.N.; Ochieng, J.W.; Kuria, S.G.; Jianlin, H.; Kaufmann, B.; Rege, J.E.O.; Hanotte, O. Genetic diversity and relationships of indigenous Kenyan camel (Camelus dromedarius) populations: implications for their classification. Anim. Genet. 2003, 34, 26–32. [Google Scholar]
  5. Baumung, R.; Simianer, H.; Hoffmann, I. Genetic diversity studies in farm animals—a survey. J. Anim. Breed. Genet. 2004, 121, 361–373. [Google Scholar] [CrossRef]
  6. Schulz, U.; Minguez, Y.; Checa, M.L.; Garcia-Atance, P.; Dunner, S.; Garcia, D.; Cañón, J. The Majorero camel (Camelus dromedarius) breed. Anim. Genet. Res. Inf. 2005, 36, 61–72. [Google Scholar] [CrossRef]
  7. Obreque, V.; Coogle, L.; Henney, P.J.; Bailey, E.; Mancilla, R.; Garcia-Huidobro, J.; Hinrichsen, P.; Cothran, E.G. Characterization of 10 polymorphic alpaca dinucleotide microsatellites. Anim. Genet. 1998, 29, 460–467. [Google Scholar]
  8. Lang, K.D.M.; Wang, Y.; Plante, Y. Fifteen polymorphic dinucleotide microsatellites in llamas and alpacas. Anim. Genet. 1996, 27, 285–294. [Google Scholar]
  9. Sasse, J.; Mariasegaram, M.; Jahabar Ali, M.K.; Pullenayegum, R.; Kinne, B.R.; Werney, U. Development of a microsatellite parentage and identity verification test for dromedary racing camels. In Presented at the 27th International Conference on Animal Genetics, St Paul/Minneapolis, MN, USA, July 2000.
  10. Penedo, C.; Caetano, A.; Cordova, K. Eight microsatellite markers for South American camelids. Anim. Genet. 1998, 30, 166–167. [Google Scholar] [CrossRef]
  11. Felsenstein, J. PHYLIP. (Phylogeny Inference Package) Version 3.69; Department of Genetics, University of Eashington: Seattle, WA, USA, 2009. Available online: http://evolution.gs.washington.edu/phylip.html (accessed on 10 February 2010).
  12. Pritchard, J.K.; Stephens, M.; Donnelly, P. Inference of population structure from multilocus genotype data. Genetics 2000, 155, 945–959. [Google Scholar]
  13. Cañón, J.; García, D.; García-Atance, M.A.; Obexer-Ruff, G.; Lenstra, J.A.; Ajmone-Marsan, P.; Dunner, S. the ECONOGENE Consortium Geographical partitioning of goat diversity in Europe and the Middle East. Anim. Genet. 2006, 37, 327–334. [Google Scholar] [CrossRef]
  14. Tamura, K.; Dudley, J.; Nei, M.; Kumar, S. MEGA4: Molecular Evolutionary Genetics Analysis (MEGA) software version 4.0. Mol. Biol. Evol. 2007, 24, 1596–1599. [Google Scholar] [CrossRef]
  15. Sambrook, J.; Fritsch, E.F.; Maniatis, T. Molecular Cloning: A Laboratory Manual, 2nd ed.; Cold Spring Harbor: New York, NY, USA, 1989. [Google Scholar]
  16. Park, S.D.E. Trypanotolerance in West African Cattle and the Population Genetic Effects of Selection. Ph.D. Thesis, University of Dublin, Dublin, Ireland, 2001. [Google Scholar]
  17. Goudet, J. FSTAT, A Program to Estimate and Test Gene Diversities and Fixation Indices (Version 2.9.3.2); University of Lausanne: Lausanne, Switzerland, 2001. Available online: http://www2.unil.ch/popgen/softwares/fstat.htm (accessed on 10 February 2010).
  18. Wright, S. The interpretation of population structure by F-statistics with special regard to systems of mating. Evolution 1965, 19, 395–420. [Google Scholar] [CrossRef]
  19. Belkhir, K.; Borsa, P.; Chikhi, L.; Raufaste, N.; Bonhomme, F. Genetix, logiciel sous Windows TM pour la génétique des populations, Laboratoire Génome, Populations, Interactions, CNRS UPR 9060; Université de Montpellier II: Montpellier, France, 2001. Available online: http://www.genetix.univ-montp2.fr/genetix/intro.htm (accessed on 10 February 2010).
  20. Rosenberg, N.A. Distruct: a Program for the Graphical Display of Structure Results; University of Michigan: MI, USA, 2002. Available online: http://rosenberglab.bioinformatics.med.umich.edu/ distruct.html (accessed on 10 February 2010).

