Using Chloroplast trnF Pseudogenes for Phylogeography in Arabidopsis Lyrata

Abstract
:1. Introduction
2. Materials and Methods
2.1. Samples

| Population name | Abbreviation | Latitude | Longitude | Holmgren list acronym | Number of Individuals | Date collected | Collector | Herbarium (inc. Date) | Full sequence haplotype 1 (Number) | Full sequence haplotype 2 (Number) | P-TR haplotype (Number) |
|---|---|---|---|---|---|---|---|---|---|---|---|
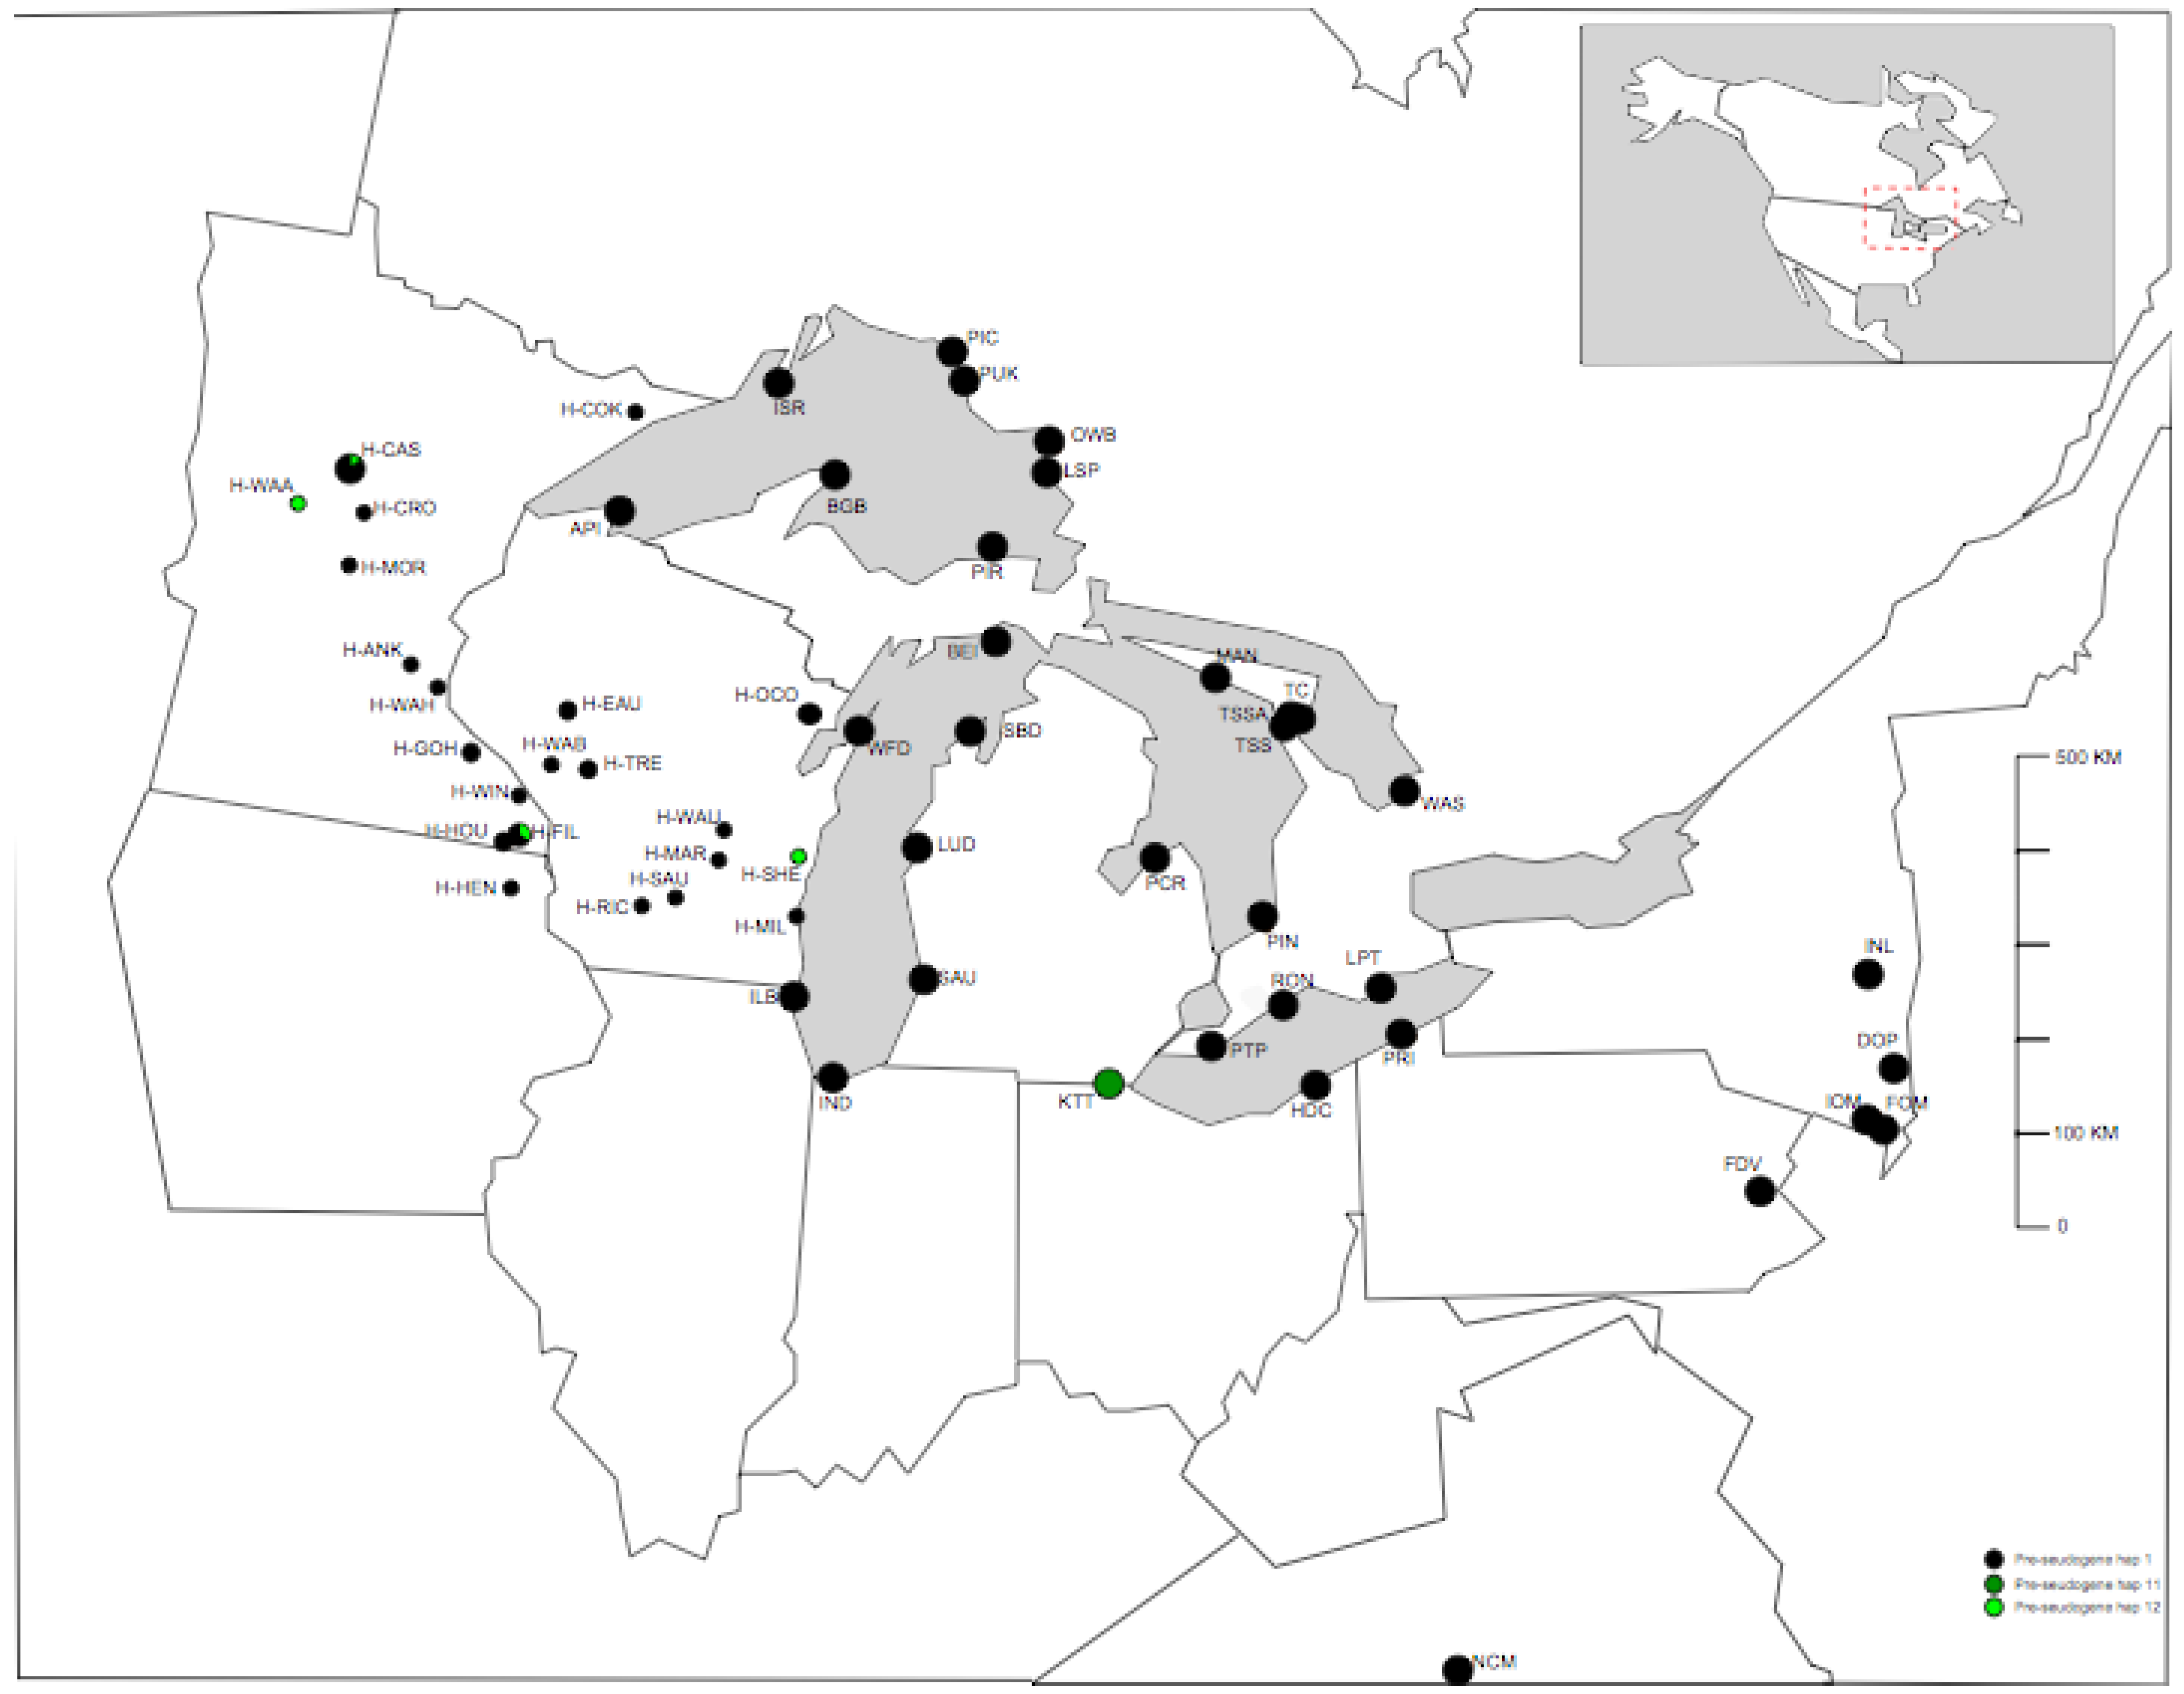
| Point Pelee† | PTP | 41.93 | −82.51 | - | 8 | 2003 | BM | - | L1 | - | 1 |
| Iona Marsh* | IOM | 41.30 | −73.98 | - | 8 | 2007 | YW | - | L4 | - | 1 |
| Pictured Rock† | PIR | 46.67 | −86.02 | - | 8 | 2003 | BM | - | L1 | - | 1 |
| Presque Isle† | PRI | 42.17 | −80.07 | - | 8 | 2007 | BM. AT. PH. | - | L4 | - | 1 |
| Long Point† | LPT | 42.58 | −80.39 | - | 8 | 2007 | BM. AT. PH. | - | L1 | - | 1 |
| Indiana Dunes† | IND | 41.62 | −87.21 | - | 8 | 2007 | BM. AT. PH. | - | L1 (4) | L2 (4) | 1 |
| Rondeau† | RON | 42.26 | −81.85 | - | 8 | 2007 | BM. AT. PH. | - | L1 | - | 1 |
| Sleeping Bear dunes† | SBD | 44.94 | −85.87 | - | 8 | 2007 | BM. AT. PH. | - | S3 | - | 1 |
| North Carolina, Mayodan† | NCM | 36.41 | −79.97 | - | 8 | 2007 | DM | - | S2 | - | 1 |
| Tobermoray Alvar† | TSSA | 45.19 | −81.59 | - | 8 | 2007 | BM. AT. PH. | - | S1 (4) | L1 (4) | 1 |
| Lake Superior Park† | LSP | 47.57 | −84.97 | - | 8 | 2003 | BM | - | S1 | - | 1 |
| Tobermory Cliff† | TC | 45.25 | −81.52 | - | 8 | 2007 | BM. AT. PH. | - | S1 | - | 1 |
| Old Woma Bay† | OWB | 47.79 | −84.90 | - | 8 | 2003 | BM | - | S1 | - | 1 |
| Pic River† | PIC | 48.60 | −86.30 | - | 8 | 2003 | BM | - | S1 | - | 1 |
| Pukaskwa National Park† | PUK | 48.40 | −86.19 | - | 8 | 2003 | BM | - | S1 | - | 1 |
| Manitoulin Island† | MAN | 45.67 | −82.26 | - | 8 | 2003 | BM | - | L2 | - | 1 |
| Tobermoray SS† | TSS | 45.19 | −81.58 | - | 8 | 2007 | BM. AT. PH. | - | S1 | - | 1 |
| Pinery† | PIN | 43.27 | −81.83 | - | 8 | 2007 | BM. AT. PH. | - | L1 | - | 1 |
| Beaver Island* | BEI | 45.76 | −85.51 | - | 8 | 2007 | YW | - | S1 | - | 1 |
| Headland Dunes† | HDC | 41.76 | −81.29 | - | 8 | 2007 | BM. AT. PH. | - | L4 | - | 1 |
| Kitty Todd† | KTT | 41.62 | −83.79 | - | 8 | 2007 | BM. AT. PH. | - | L3 | - | 11 |
| Port Cresent† | PCR | 44.00 | −83.07 | - | 8 | 2007 | BM. AT. PH. | - | L2 | - | 1 |
| Wasaga Beach† | WAS | 44.52 | −80.01 | - | 8 | 2003 | BM | - | L4 (6) | L1 (2) | 1 |
| White fish Dunes | WFD | 44.92 | −87.19 | - | 8 | 2007 | BM. AT. PH. | - | L4 (4) | S3 (4) | 1 |
| Indian Ladder* | INL | 42.66 | −74.02 | - | 6 | 2007 | YW | - | S4 | - | 1 |
| Dover Plains* | DOP | 41.74 | −73.58 | - | 6 | 2007 | YW | - | S1 (4) | S4 (2) | 1 |
| Fort Montgomery* | FOM | 41.33 | −73.99 | - | 6 | 2007 | YW | - | L4 | - | 1 |
| Illinois Beach* | ILB | 42.42 | −87.81 | - | 6 | 2007 | YW | - | L2 | - | 1 |
| Apostle Island* | API | 46.94 | −90.74 | - | 6 | 2007 | YW | - | L2 | - | 1 |
| Bete Grise Bay* | BGB | 47.39 | −87.96 | - | 6 | 2007 | YW | - | L1 (4) | L4 (2) | 1 |
| Isle Royal* | ISR | 48.00 | −88.83 | - | 6 | 2007 | YW | - | S1 | - | 1 |
| Ludington* | LUD | 43.96 | −86.45 | - | 6 | 2007 | YW | - | L4 | - | 1 |
| Saugatuck* | SAU | 42.68 | −86.18 | - | 6 | 2007 | YW | - | L2 | - | 1 |
| Friedensville* | FDV | 40.55 | −75.41 | - | 6 | 2007 | YW | - | L4 | - | 1 |
| Fillmore Co. MN | H-FIL | 43.67 | −92.10 | MIN | 3 | - | - | 1977/1941 | L6 (2) | L9 (1) | 1 |
| Houston Co. MN | H-HOU | 43.67 | −92.24 | MIN | 2 | - | - | 1942/1962 | L6 (1) | L8 (1) | 1(1) 12(1) |
| Wabasha Co. MN | H-WAB | 44.28 | −91.77 | MIN | 1 | - | - | 1997 | L6 | - | 1 |
| Winona Co. MN | H-WIN | 43.97 | −91.77 | MIN | 1 | - | - | 1992 | L7 | - | 1 |
| Trempealeau Co. WI | H-TRE | 44.32 | −91.35 | WIS | 2 | - | - | NR | L2 (1) | L7 (1) | 1 |
| Eau Claire, WI | H-EAU | 44.82 | −91.50 | WIS | 2 | - | - | NR | L6 | - | 1 |
| Marquette Co. WI | H-MAR | 43.82 | −89.40 | WIS | 1 | - | - | NR | L6 | - | 1 |
| Richland Co. WI | H-RIC | 43.38 | −90.43 | WIS | 1 | - | - | NR | L6 | - | 1 |
| Sauk Co. WI | H-SAU | 43.45 | −89.95 | WIS | 1 | - | - | NR | L6 | - | 1 |
| Waushara Co. WI | H-WAU | 44.12 | −89.29 | WIS | 1 | - | - | NR | L6 | - | 1 |
| Cass Co. MN | H-CAS | 46.92 | −94.28 | MIN | 6 | - | - | 1992/1997 | L6 (5) | L5 (1) | 1(5) 12(1) |
| Goodhue Co. MN | H-GOH | 44.42 | −92.72 | MIN | 2 | - | - | 1987/1940 | L6 | - | 1 |
| Crow wing Co. MN | H-CRO | 46.47 | −94.08 | MIN | 1 | - | - | 1936 | L6 | - | 1 |
| Anoka Co. MN | H-ANK | 45.25 | −93.25 | MIN | 1 | - | - | 1960 | L6 | - | 1 |
| Hennepin Co. MN | H-HEN | 43.08 | −92.24 | MIN | 1 | - | - | 1922 | L6 | - | 1 |
| Sheboygan Co. WI | H-SHE | 43.73 | −87.93 | WIS | 1 | - | - | NR | L5 | - | 12 |
| Wadena Co. MN | H-WAA | 46.58 | −94.97 | MIN | 1 | - | - | 1992 | L5 | - | 12 |
| Oconto Co. WI | H-OCO | 45.00 | −88.18 | WIS | 3 | - | - | NR | L2 | - | 1 |
| Washington Co. MN | H-WAH | 45.03 | −92.92 | MIN | 1 | - | - | 1961 | L2 | - | 1 |
| Morrison CO. MN | H-MOR | 46.02 | −94.30 | MIN | 1 | - | - | 1990 | L2 | - | 1 |
| Cook Co. MN | H-COK | 47.92 | −90.55 | MIN | 1 | - | - | 1980 | L2 | - | 1 |
| Milwaukee Co. WI | H-MIL | 43.00 | −87.97 | WIS | 1 | - | - | NR | L1 | - | 1 |
2.2. Sequencing
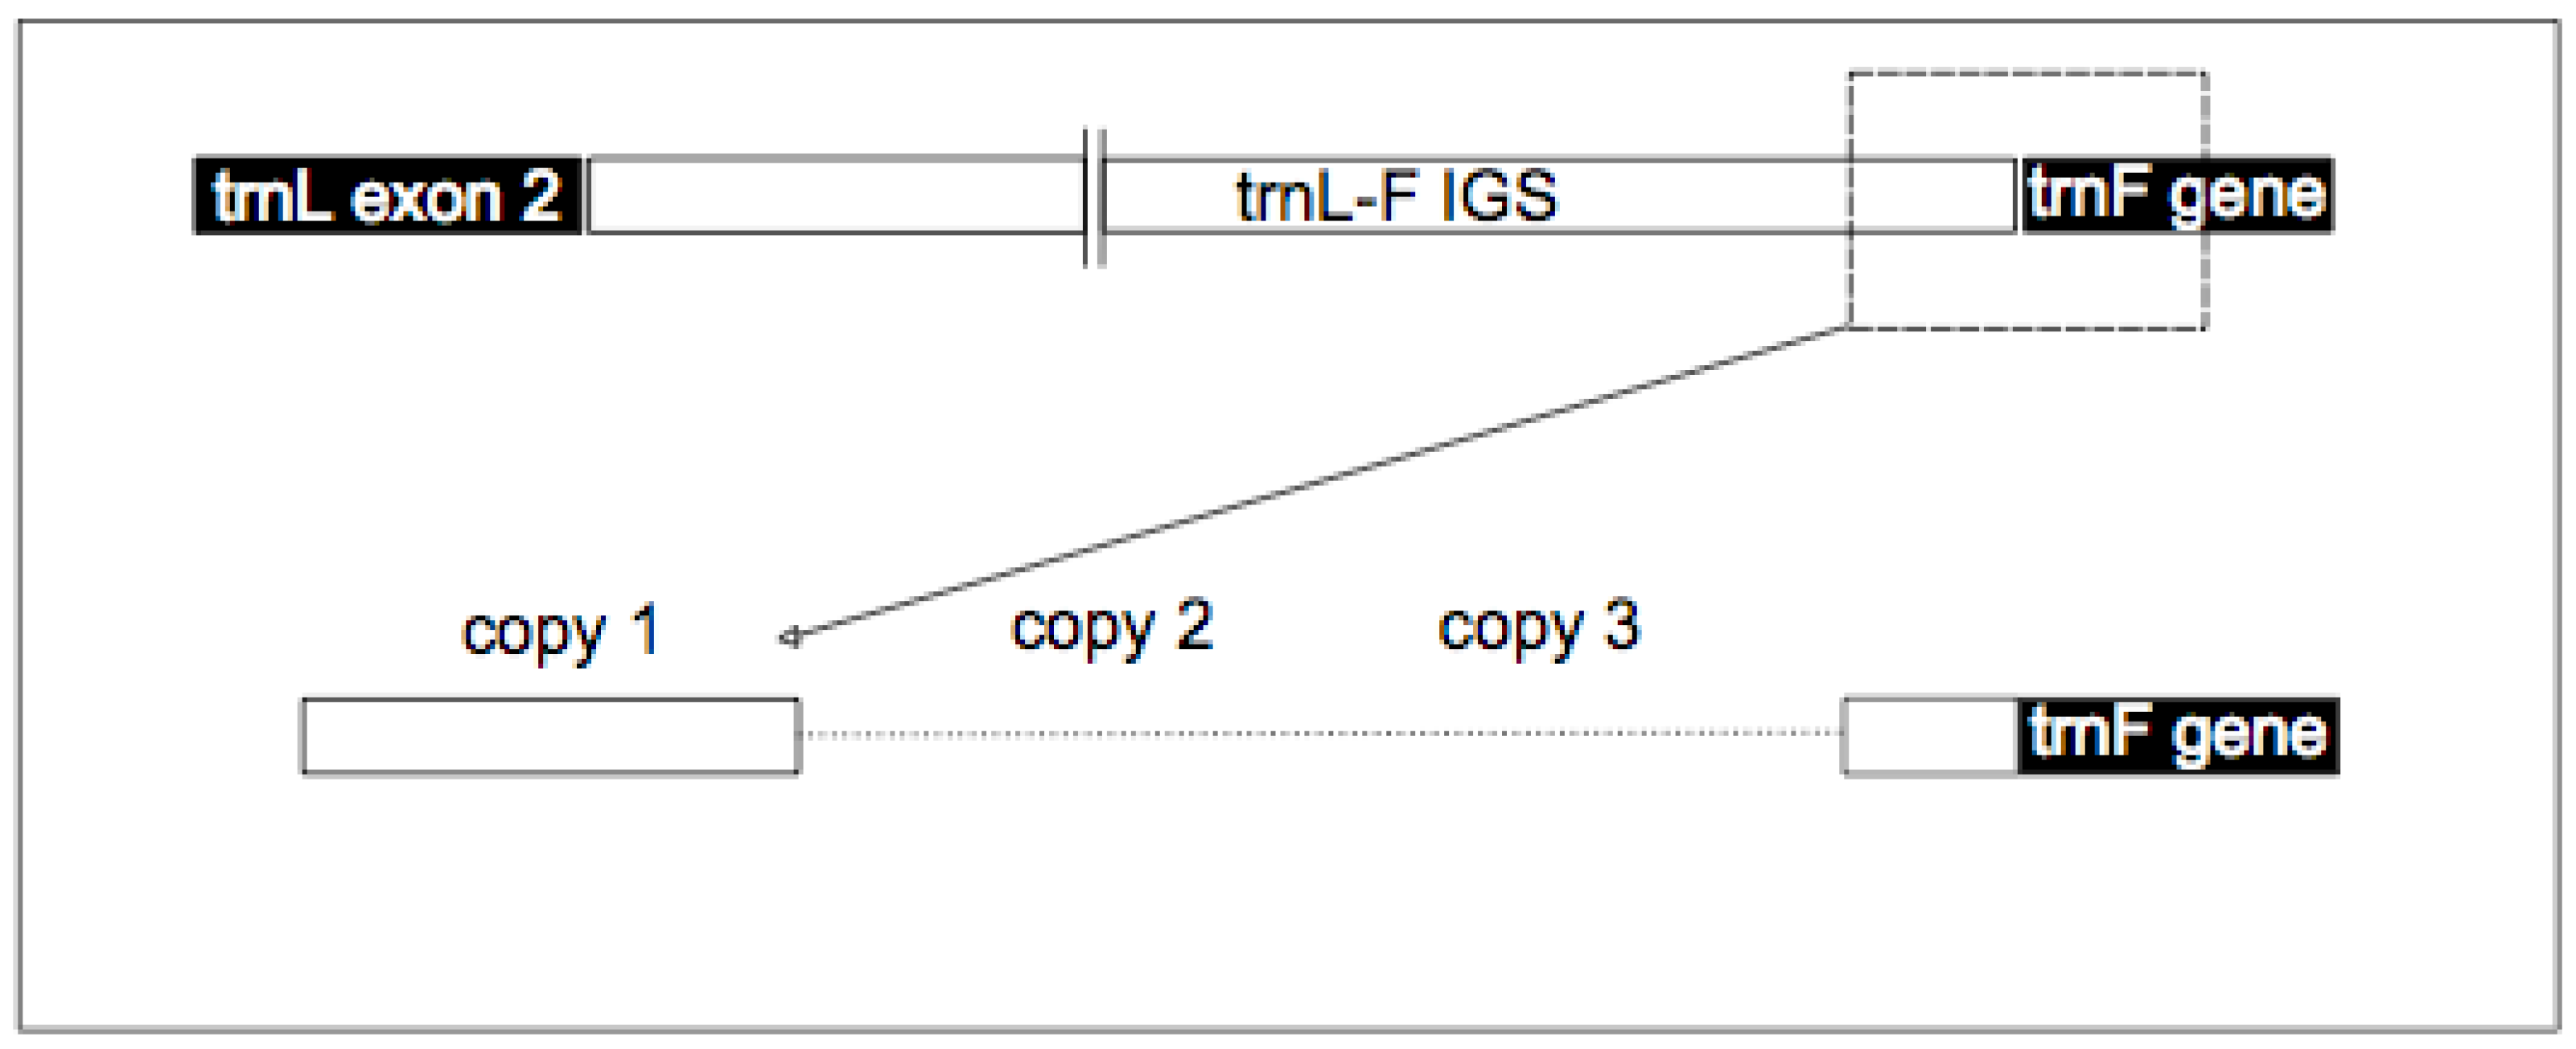
2.3. TrnF Sequence Alignment and Pseudogene Recognition
2.4. TrnF Sequence Variation Based Only On the P-TR Region
2.5. TrnL-F Full Sequence Variation Based Only On Mutations within Length Variants
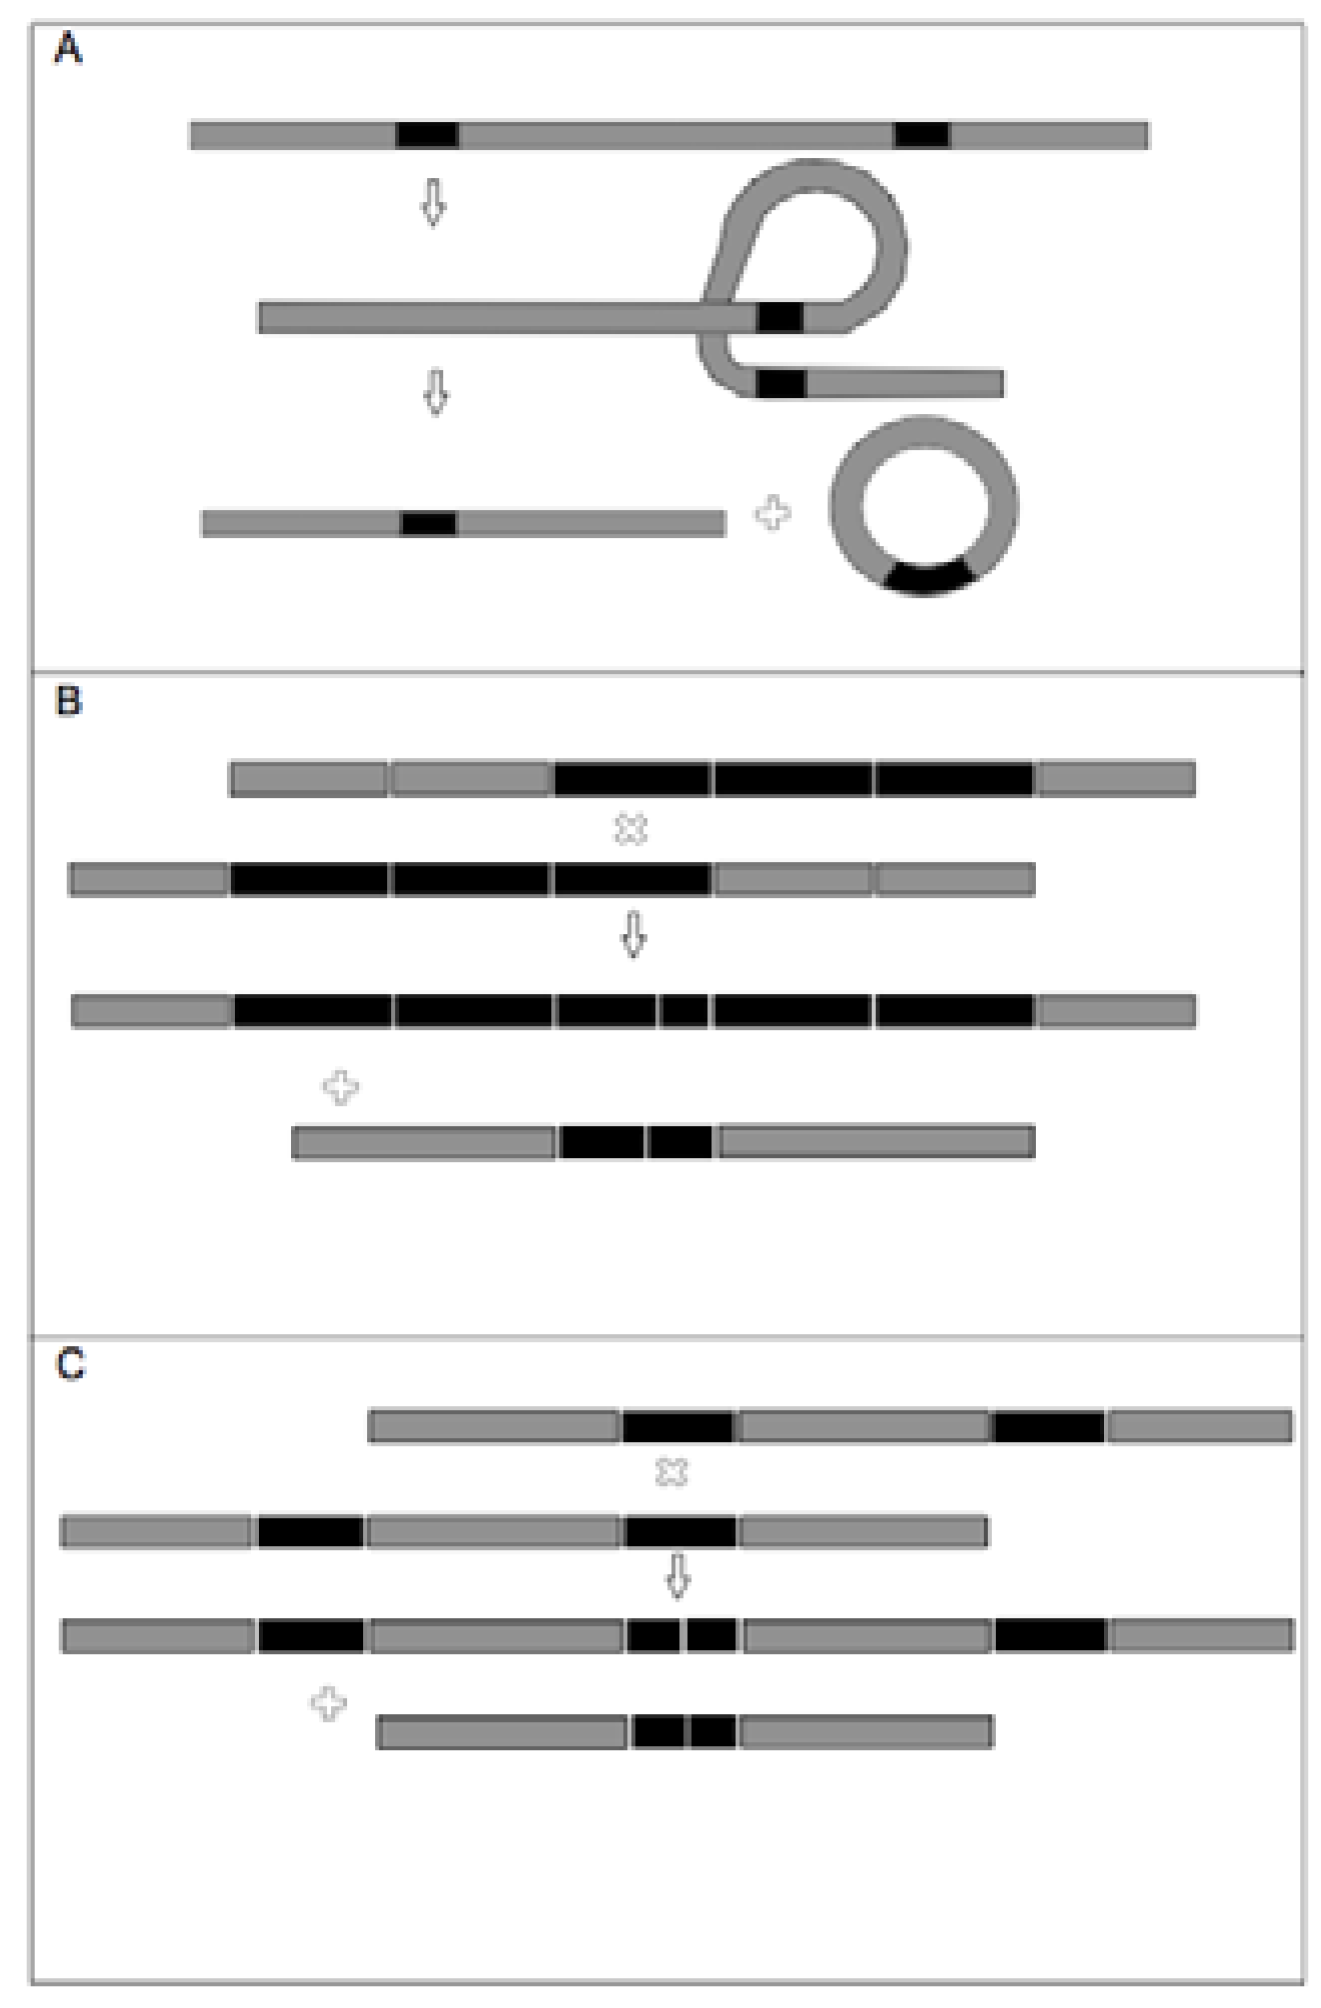
2.6. TrnL-F Full Sequence Variation Considering Evolution of Copy Number Variants
| Psuedogene copy number | Present in A.lyrata | Species* | Size (bp) | Start position (bp) |
| P-TR | Y | Unknown | 179 | 1 |
| 1 | Y | A. lyrata | 93 | 180 |
| 2 | Y | A. lyrata | 77 | 273 |
| 3 | N | A.thaliana | 32 | 350 |
| 4 | N | A.halleri | 100 | 382 |
| 5 | N | A.halleri | 98 | 480 |
| 6 | Y | A. lyrata | 99 | 579 |
| 7 | Y | A. lyrata | 67 | 646 |
| 8 | N | A.halleri | 67 | 713 |
| 9 | Y | A. lyrata | 68 | 781 |
| 10 | Y | A. lyrata | 125 | 906 |
| trnF gene | Y | Unknown | 1,032 |
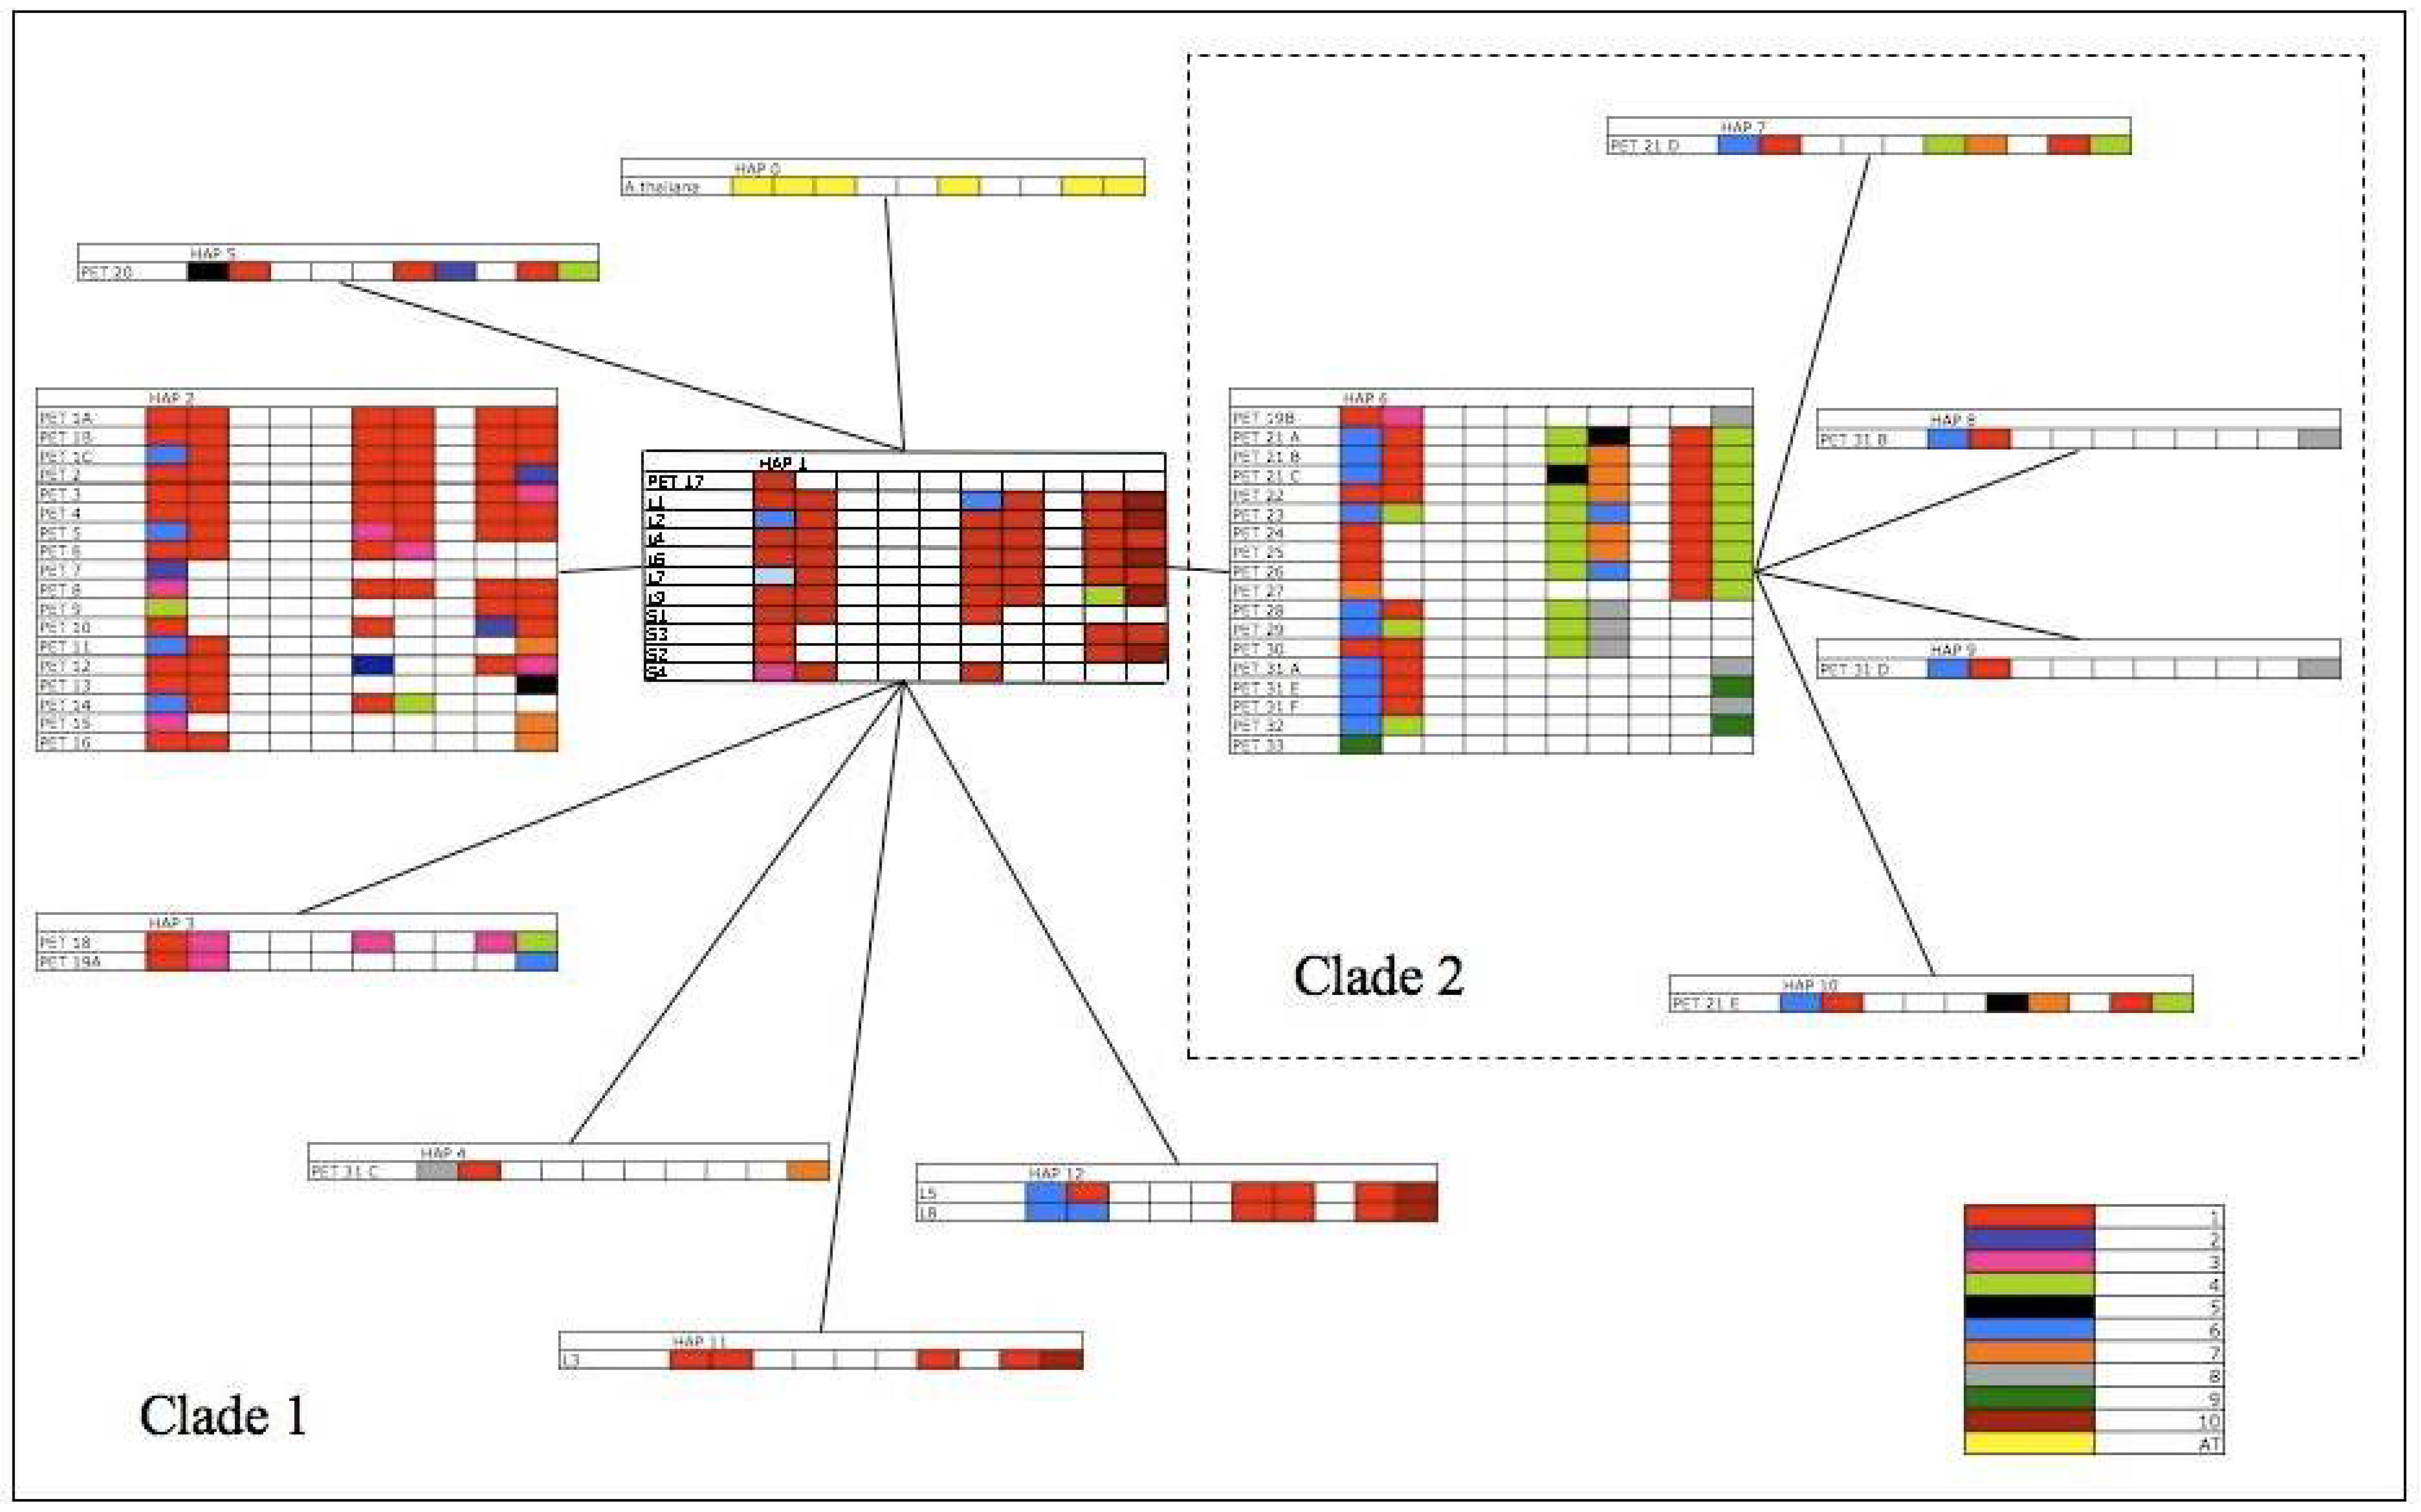
| Species & Haplotype | P-TR Haplotype | 1 | 2 | 3 | 4 | 5 | 6 | 7 | 8 | 9 | 10 |
| Arabidopsis lyrata ssp. Petraea | |||||||||||
| PET 1A | 2 | 1.1 | 2.1 | – | – | – | 6.1 | 7.1 | – | 9.1 | 10.1 |
| PET IB | 2 | 1.1 | 2.1 | – | – | – | 6.1 | 7.1 | – | 9.1 | 10.1 |
| PET 1C | 2 | 1.6 | 2.1 | – | – | – | 6.1 | 7.1 | – | 9.1 | 10.1 |
| PET 2 | 2 | 1.1 | 2.1 | – | – | – | 6.1 | 7.1 | – | 9.1 | 10.2 |
| PET 3 | 2 | 1.1 | 2.1 | – | – | – | 6.1 | 7.1 | – | 9.1 | 10.3 |
| PET 4 | 2 | 1.1 | 2.1 | – | – | – | 6.1 | 7.1 | – | 9.1 | 10.1 |
| PET 5 | 2 | 1.6 | 2.1 | – | – | – | 6.3 | 7.1 | – | 9.1 | 10.1 |
| PET 6 | 2 | 1.1 | 2.1 | – | – | – | 6.1 | 7.3 | – | – | – |
| PET 7 | 2 | 1.2 | – | – | – | – | – | – | – | – | – |
| PET 8 | 2 | 1.3 | – | – | – | – | 6.1 | 7.1 | – | 9.1 | 10.1 |
| PET 9 | 2 | 1.4 | – | – | – | – | – | – | – | 9.1 | 10.1 |
| PET 10 | 2 | 1.1 | – | – | – | – | 6.1 | – | – | 9.2 | 10.1 |
| PET 11 | 2 | 1.6 | 2.1 | – | – | – | – | – | – | – | 10.7 |
| PET 12 | 2 | 1.1 | 2.1 | – | – | – | 6.2 | – | – | 9.1 | 10.3 |
| PET 13 | 2 | 1.1 | 2.1 | – | – | – | – | – | – | – | 10.5 |
| PET 14 | 2 | 1.6 | 2.1 | – | – | – | 6.1 | 7.4 | – | – | – |
| PET 15 | 2 | 1.3 | – | – | – | – | – | – | – | – | 10.7 |
| PET 16 | 2 | 1.1 | 2.1 | – | – | – | – | – | – | – | 10.7 |
| PET 17 | 1 | 1.1 | – | – | – | – | – | – | – | – | – |
| PET 18 | 3 | 1.1 | 2.3 | – | – | – | 6.3 | – | – | 9.3 | 10.4 |
| PET 19A | 3 | 1.1 | 2.3 | – | – | – | – | – | – | – | 10.6 |
| PET 19B | 6 | 1.1 | 2.3 | – | – | – | – | – | – | – | 10.8 |
| PET 20 | 5 | 1.5 | 2.1 | – | – | – | 6.1 | 7.2 | – | 9.1 | 10.4 |
| PET 21A | 6 | 1.6 | 2.1 | – | – | – | 6.4 | 7.5 | – | 9.1 | 10.4 |
| PET 21B | 6 | 1.6 | 2.1 | – | – | – | 6.4 | 7.7 | – | 9.1 | 10.4 |
| PET 21C | 6 | 1.6 | 2.1 | – | – | – | 6.5 | 7.7 | – | 9.1 | 10.4 |
| PET 21D | 7 | 1.6 | 2.1 | – | – | – | 6.4 | 7.7 | – | 9.1 | 10.4 |
| PET 21E | 10 | 1.6 | 2.1 | – | – | – | 6.5 | 7.7 | – | 9.1 | 10.4 |
| PET 22 | 6 | 1.1 | 2.1 | – | – | – | 6.4 | 7.7 | – | 9.1 | 10.4 |
| PET 23 | 6 | 1.6 | 2.4 | – | – | – | 6.4 | 7.6 | – | 9.1 | 10.4 |
| PET 24 | 6 | 1.1 | – | – | – | – | 6.4 | 7.7 | – | 9.1 | 10.4 |
| PET 25 | 6 | 1.1 | – | – | – | – | 6.4 | 7.7 | – | 9.1 | 10.4 |
| PET 26 | 6 | 1.1 | – | – | – | – | 6.4 | 7.6 | – | 9.1 | 10.4 |
| PET 27 | 6 | 1.7 | – | – | – | – | – | – | – | 9.1 | 10.4 |
| PET 28 | 6 | 1.6 | 2.1 | – | – | – | 6.4 | 7.8 | – | – | – |
| PET 29 | 6 | 1.6 | 2.4 | – | – | – | 6.4 | 7.8 | – | – | – |
| PET 30 | 6 | 1.1 | 2.1 | – | – | – | 6.4 | 7.8 | – | – | – |
| PET 31A | 6 | 1.6 | 2.1 | – | – | – | – | – | – | – | 10.8 |
| PET 31B | 8 | 1.6 | 2.1 | – | – | – | – | – | – | – | 10.8 |
| PET 31C | 4 | 1.8 | 2.1 | – | – | – | – | – | – | – | 10.7 |
| PET 31D | 9 | 1.6 | 2.1 | – | – | – | – | – | – | – | 10.8 |
| PET 31E | 6 | 1.6 | 2.1 | – | – | – | – | – | – | – | 10.9 |
| PET 31F | 6 | 1.6 | 2.1 | – | – | – | – | – | – | – | 10.8 |
| PET 32 | 6 | 1.6 | 2.4 | – | – | – | – | – | – | – | 10.9 |
| PET 33 | 6 | 1.9 | – | – | – | – | – | – | – | – | – |
| PET 34 | 6 | 1.9 | – | – | – | – | – | – | – | – | – |
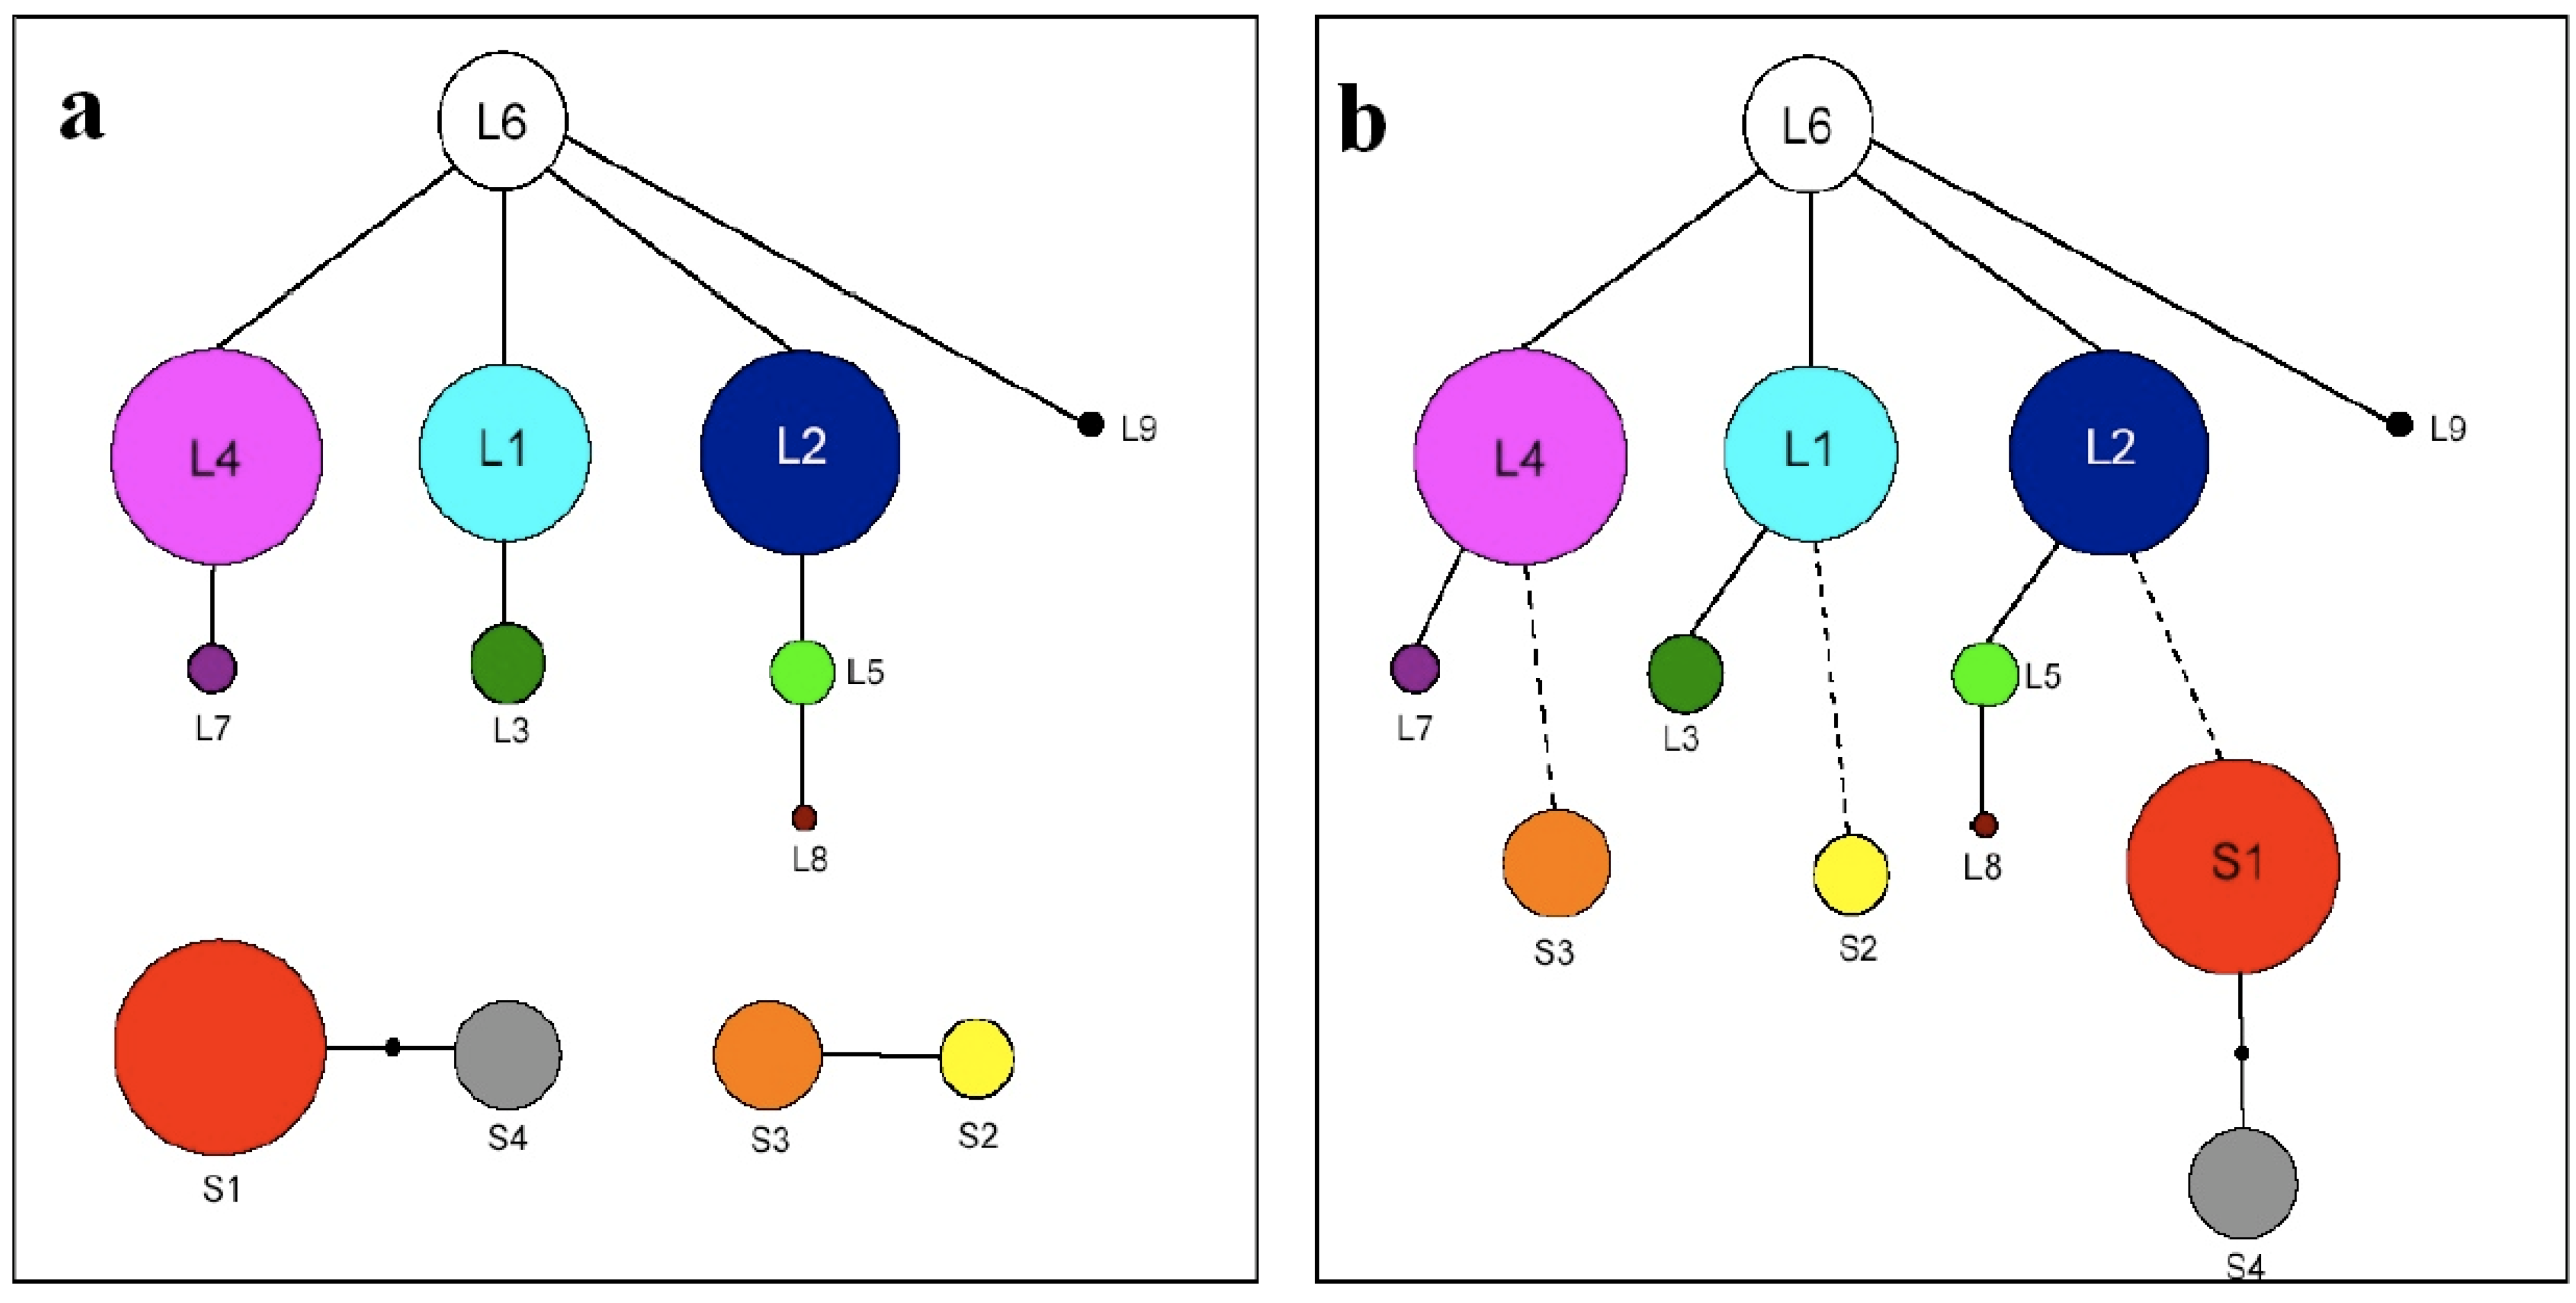
| Arabidopsis lyrata ssp. lyrata | |||||||||||
| L1 | 1 | 1.1 | 2.1 | – | – | – | 6.6 | 7.1 | – | 9.1 | 10.10 |
| L2 | 1 | 1.2 | 2.1 | – | – | – | 6.1 | 7.1 | – | 9.1 | 10.10 |
| L3 | 11 | 1.1 | 2.1 | – | – | – | 6.6 | 7.1 | – | 9.1 | 10.10 |
| L4 | 1 | 1.1 | 2.1 | – | – | – | 6.1 | 7.1 | – | 9.1 | 10.1 |
| L5 | 12 | 1.6 | 2.1 | 6.1 | 7.1 | 9.1 | 10.10 | ||||
| L6 | 1 | 1.1 | 2.1 | 6.1 | 7.1 | 9.1 | 10.10 | ||||
| L7 | 1 | 1.11 | 2.1 | 6.1 | 7.1 | 9.1 | 10.1 | ||||
| L8 | 12 | 1.6 | 2.6 | 6.1 | 7.1 | 9.1 | 10.10 | ||||
| L9 | 1 | 1.1 | 2.1 | 6.1 | 7.1 | 9.4 | 10.10 | ||||
| S1 | 1 | 1.1 | 2.1 | – | – | – | 6.7 | – | – | – | – |
| S2 | 1 | 1.4 | – | – | – | – | – | – | – | 9.1 | 10.1 |
| S3 | 1 | 1.4 | – | – | – | – | – | – | – | 9.1 | 10.10 |
| S4 | 1 | 1.1 | 2.1 | – | – | – | 6.1 | – | – | – | – |
| Arabidopsis thaliana | |||||||||||
| A.thaliana | 0 | 1.AT | 2.AT | 3.AT | – | – | 6.AT | – | – | 9.AT | 10.AT |
3. Results
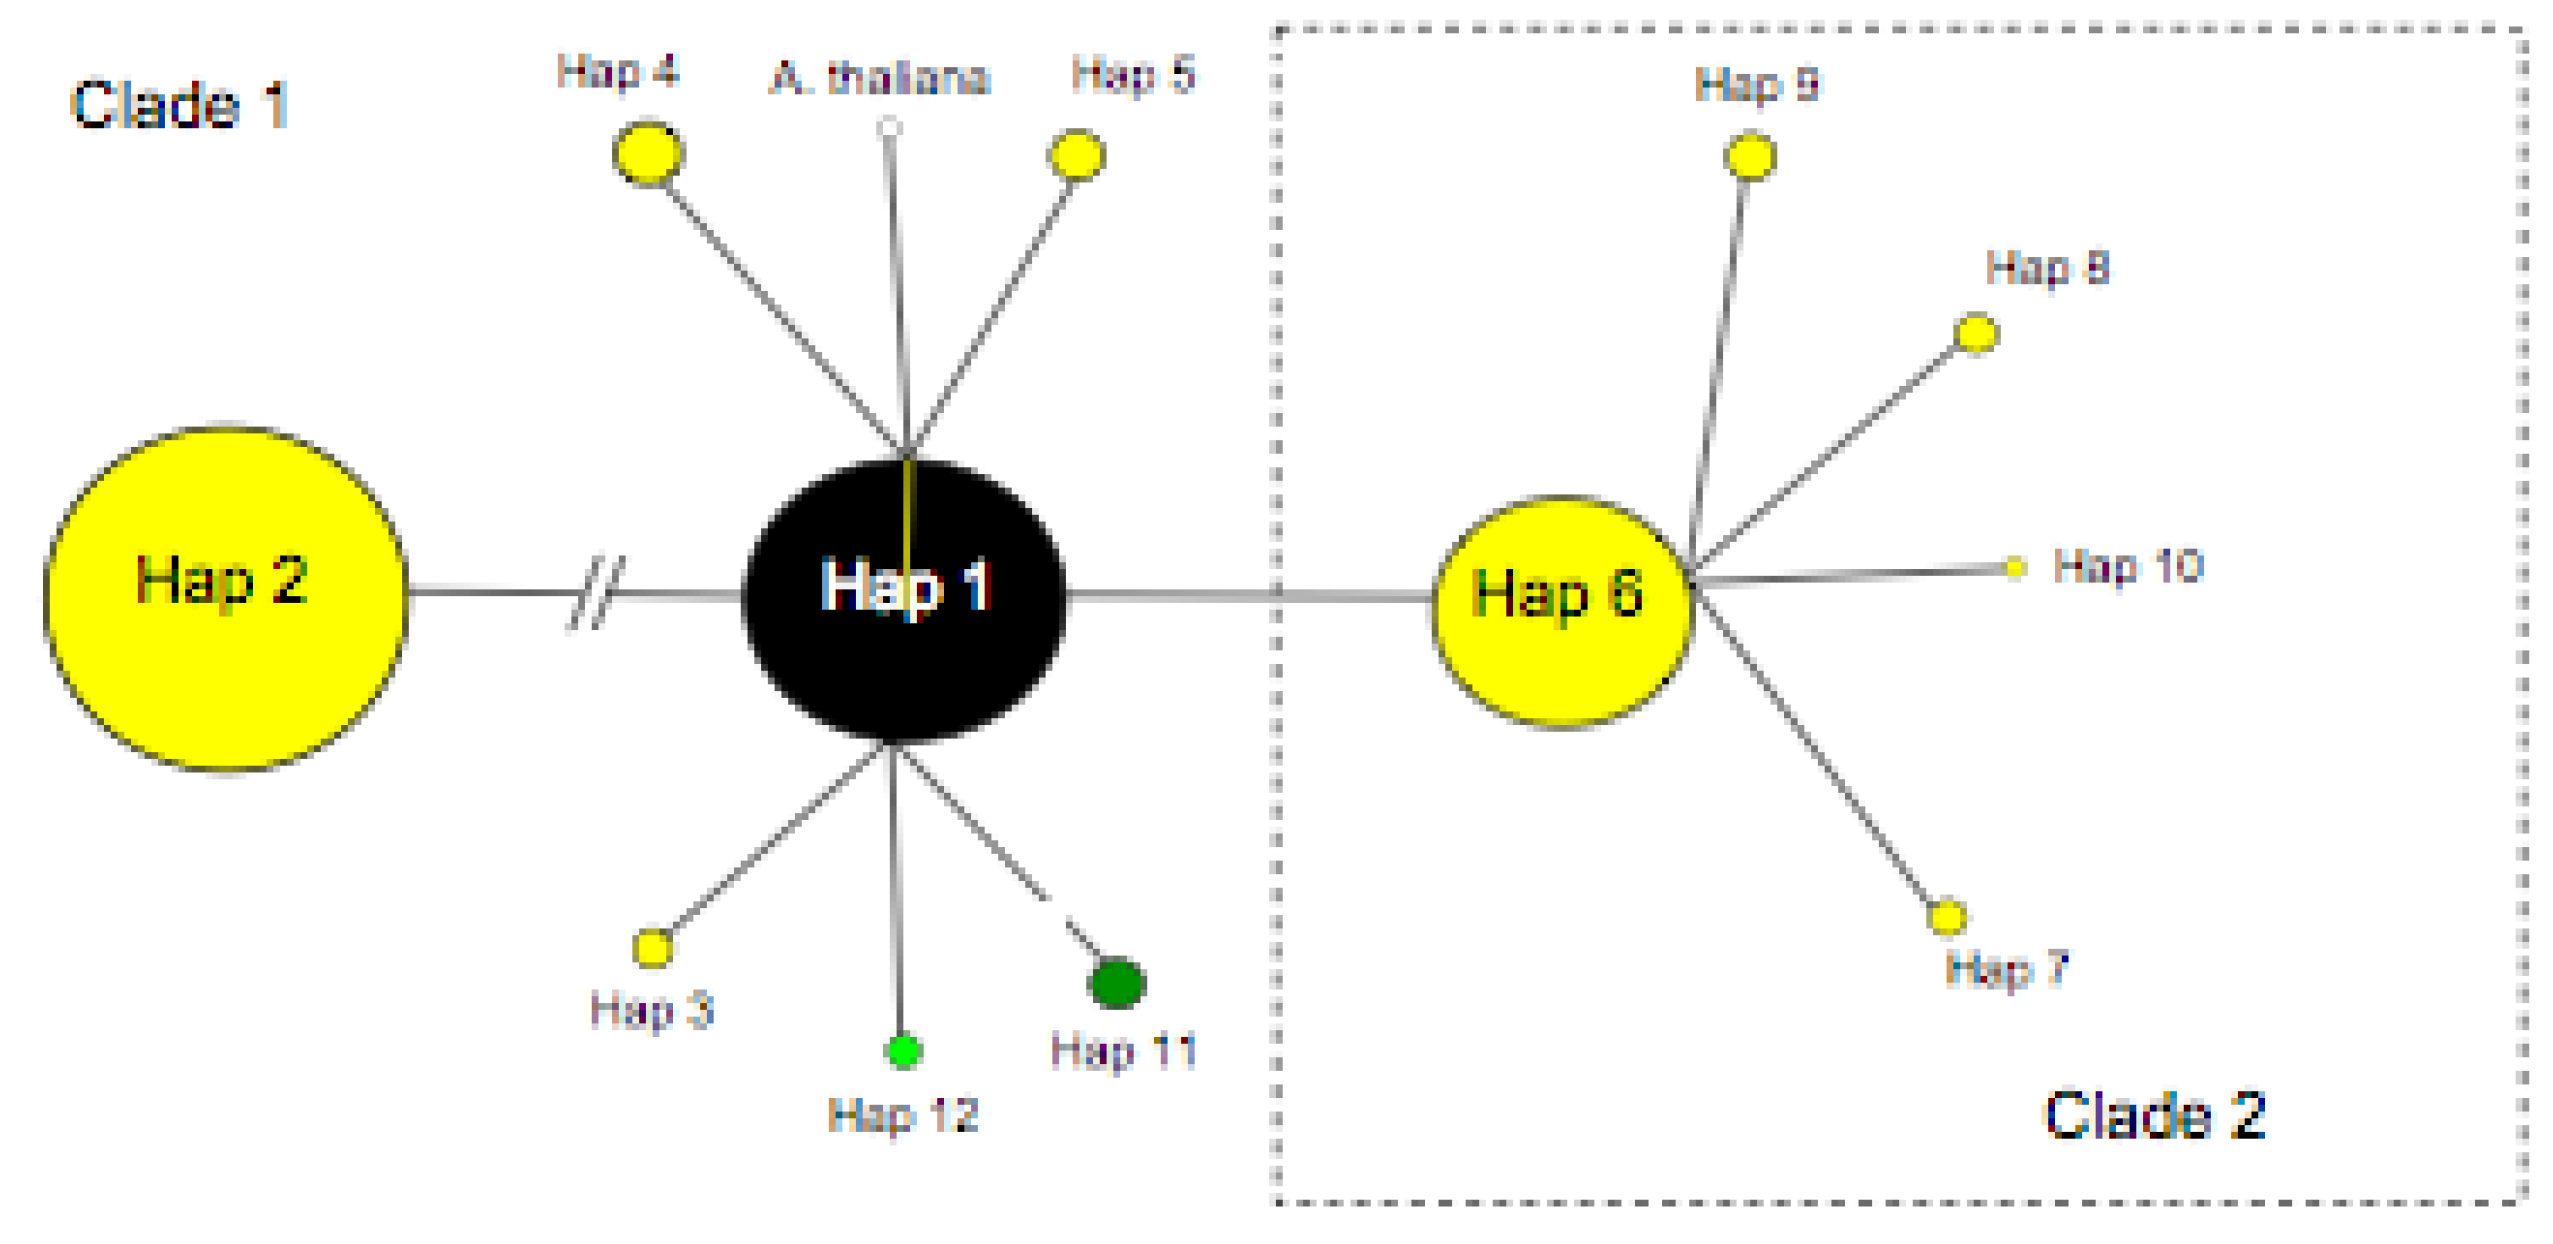
3.1. Sequence Variation Based On the P-TR Region
| Position of trnL - trnF alignment | ||||||||||||
| Haplotype | 46 | 47 | Indel A | 88 | 96 | 101 | 111 | 119 | 136 | 154 | 156 | 167 |
| 0 | A | T | − | C | A | T | G | C | A | T | C | C |
| 1 | A | A | − | C | A | T | G | C | A | T | C | C |
| 2 | A | A | + | C | A | T | G | C | A | T | C | C |
| 3 | A | A | − | C | T | T | G | C | A | T | C | C |
| 4 | A | A | − | C | A | T | G | C | A | T | A | C |
| 5 | A | A | − | C | A | T | G | C | A | G | C | C |
| 6 | A | A | − | T | A | T | G | C | A | T | C | C |
| 7 | A | A | − | T | A | T | G | C | C | T | C | C |
| 8 | A | A | − | T | A | T | G | T | A | T | C | C |
| 9 | G | A | − | T | A | T | G | C | A | T | C | C |
| 10 | A | A | − | T | A | T | G | C | A | T | C | C |
| 11* | A | A | − | T | A | T | T | C | A | T | C | T |
| 12* | A | A | − | T | A | A | G | C | A | T | C | C |


3.2. TrnL-F Full Sequence Variation Based Only On Mutations within Length Variants


3.3. TrnL-F Full Sequence Variation Considering Evolution of Copy Number Variants
4. Discussion
4.1. Summary of Chloroplast Variation within Arabidopsis Lyrata
4.2. TrnF Sequence Variation Based Only On the P-TR Region
4.3. TrnF Full Sequence Variation Based only on Mutations within Length Variants
4.4. Trn-F Full Sequence Variation Considering Evolution of Copy Number Variants
4.5. Pseudogenes in a Population Level Study
Acknowledgements
References
- Palmer, J.D. Plastid chromosomes: structure and evolution. In Cell Culture and Somatic Cell Genetics in Plants:The Molecular Biology of Plastids; Bogorad, L., Vasil, I.K., Eds.; Acedemic Press: San Deigo, CA, USA, 1991; Volumn 7, pp. 5–53. [Google Scholar]
- Raubson, L.A.; Jansen, R.K. Chloroplast Genomes of Plants. In Plant Diversity and Evolution: Genotypic and Phenotypic Variation in Higher Plants; Henry, R.J., Ed.; CABI Publishing: Cambridge, MA, USA, 2005; pp. 45–68. [Google Scholar]
- Muse, S.V. Examining rates and patterns of nucleotide substitutions in plants. Pl. Mol. Biol. Rep. 2000, 42, 481–490. [Google Scholar]
- Mitchell-Olds, T.; Al.-Shehbaz, I.; Koch, M.; Sharbel, T. Crucifer evolution in the post-genomic era. In Plant Diversity and Evolution:Genotypic and Phenotypic Variation in Higher Plants; Henry, R.J., Ed.; CABI Publishing: Oxon, UK, 2005; pp. 119–136. [Google Scholar]
- Hiratsuka, J.; Shimada, H.; Whittier, R.; Ishibashi, T.; Sakamoto, M.; Mori, M.; Kondo, C.; Honji, Y.; Sun, C.R.; Meng, B.Y.; Li, Y.Q.; Kanno, A.; Nishizawa, Y.; Hirai, A.; Shinozaki, K.; Sugiura, M. The Complete Sequence of the Rice (Oryza-Sativa) Chloroplast Genome—Intermolecular Recombination between Distinct Transfer-RNA Genes Accounts for a Major Plastid DNA Inversion during the Evolution of the Cereals. Mol. Gen. Genet. 1989, 217, 185–194. [Google Scholar] [CrossRef]
- Ingvarsson, P.K.; Ribstein, S.; Taylor, D.R. Molecular Evolution of Insertions and Deletion in the Chloroplast Genome of Silene. Mol. Biol. Evol. 2003, 20, 1737–1740. [Google Scholar] [CrossRef]
- Ogihara, Y.; Terachi, T.; Sasakuma, T. Intramolecular Recombination of Chloroplast Genome Mediated by Short Direct-Repeat Sequences in Wheat Species. Proc. Nat. Acad. Sci.USA 1988, 85, 8573–8577. [Google Scholar] [CrossRef]
- Pyke, K.A. Plastid Division and Development. Plant Cell 1999, 11, 549–556. [Google Scholar] [CrossRef]
- Dobeš, C.; Kiefer, C.; Kiefer, M.; Koch, M.A. Plastidic trnF(UUC) pseudogenes in North American genus Boechera (Brassicaceae): Mechanistic aspects of evolution. Plant Biol. 2007, 9, 502–515. [Google Scholar] [CrossRef]
- Taberlet, P.; Gielly, L.; Pautou, G.; Bouvet, J. Universal Primers for Amplification of 3 Noncoding Regions of Chloroplast DNA. Pl. Mol. Biol. Rep. 1991, 17, 1105–1109. [Google Scholar] [CrossRef]
- Ansell, S.W.; Schneider, H.; Pedersen, N.; Grundmann, M.; Russell, S.J.; Vogel, J.C. Recombination diversifies chloroplast trnF pseudogenes in Arabidopsis lyrata. J. Evol. Biol. 2007, 20, 2400–2411. [Google Scholar] [CrossRef]
- Ansell, S.W.; Stenoien, H.K.; Grundmann, M.; Schneider, H.; Hemp, A.; Bauer, N.; Russell, S.J.; Vogel, J. Population structure and historical biogeography of European Arabidopsis lyrata. Heredity 2010, in press. [Google Scholar] [CrossRef]
- Koch, M.A.; Dobeš, C.; Matschinger, M.; Bleeker, W.; Vogel, J.; Kiefer, M.; Mitchell-Olds, T. Evolution of the trnF(GAA) gene in Arabidopsis relatives and the Brassicaceae family: Monophyletic origin and subsequent diversification of a plastidic pseudogene. Mol. Biol. Evol. 2005, 22, 1032–1043. [Google Scholar] [CrossRef]
- Schmickl, R.; Kiefer, C.; Dobeš, C.; Koch, M. Evolution of trn F(GAA) pseudogenes in cruciferous plants. Plant Syst. Evol. 2008, 282, 229–240. [Google Scholar] [CrossRef]
- Lihova, J.; Fuertes Aguilar, J.; Marhold, K.; Nieto Feliner, G. Origin of the disjunct tetraploid Cardamine amporitana (Brassicaceae) assessed with nuclear and chloroplast DNA sequence data. Am. J. Bot. 2004, 91, 1231–1242. [Google Scholar] [CrossRef]
- Bleeker, W.; Hurka, H. Introgressive hybridization in Rorippa (Brassicaceae): gene flow and its consequences in natural and anthropogenic habitats. Mol. Ecol. 2001, 10, 2013–2022. [Google Scholar] [CrossRef]
- Mummenhoff, K.; Bruggemann, H.; Bowman, J.L. Chloroplast DNA phylogeny and biogeography of Lepidium (Brassicaceae). Amer. J. Bot. 2001, 88, 2051–2063. [Google Scholar] [CrossRef]
- Al-Shehbaz, I.A.; O'Kane, S.L. Taxonomy and phylogeny of Arabidopsis (Brassicaceae). In The Arabidopsis Book; Somerville, C.R., Meyerowitz, E.M., Eds.; American Society of Plant Biologist: Rockville, MD, USA, 2002; pp. 1–22. [Google Scholar]
- Schmickl, R.; Jorgensen, M.; Brysting, A.; Koch, M. Phylogeographic implications for the North American boreal-arctic Arabidopsis lyrata complex. Pl. Ecol. Divers. 2008, 1, 245–254. [Google Scholar] [CrossRef]
- Koch, M.; Matschinger, M. Evolution and genetic differentiation among relatives of Arabidopsis thaliana. Proc. Nat. Acad. Sci. USA 2007, 104, 6272–6277. [Google Scholar] [CrossRef]
- Koch, M.A.; Dobeš, C.; Kiefer, C.; Schmickl, R.; Klimes, L.; Lysak, M.A. Supernetwork identifies multiple events of plastid trnF(GAA) pseudogene evolution in the Brassicaceae. Mol. Biol. Evol. 2007, 24, 63–73. [Google Scholar]
- Hoebe, P.N.; Stift, M.; Tedder, A.; Mable, B.K. Multiple losses of self-incompatibility in North-American Arabidopsis lyrata: Phylogeographic context and population genetic consequences. Mol. Ecol. 2009, 18, 4924–4939. [Google Scholar] [CrossRef]
- Excoffier, L.; Laval, G.; Schneider, S. Arlequin (version 3.0): An integrated software package for population genetics data analysis. Evol. Bioinformatics 2005, 1, 47–50. [Google Scholar]
- Templeton, A.R.; Crandall, K.A.; Sing, C.F. A Cladistic-Analysis of Phenotypic Associations with Haplotypes Inferred from Restriction Endonuclease Mapping and DNA-Sequence Data . 3. Cladogram Estimation. Genetics 1992, 132, 619–633. [Google Scholar]
- Clement, M.; Posada, D.; Crandall, K.A. TCS: a computer program to estimate gene genealogies. Mol. Ecol. 2000, 9, 1657–1659. [Google Scholar] [CrossRef]
- Kelchner, S.A. The evolution of non-coding chloroplast DNA and its application in plant systematics. Ann. Mo. Bot. Gard. 2000, 87, 482–498. [Google Scholar] [CrossRef]
- Holman, J.A. Late Quaternary Herpetofauna of the Central Great-Lakes Region, USA Zoogeographical and Paleoecological Implications. Quaternary Sci. Rev. 1992, 11, 345–351. [Google Scholar] [CrossRef]
- Balañá-Alcaide, D.; Ramos-Onsins, S.E.; Boone, Q.; Aguade, M. Highly structured nucleotide variation within and among Arabidopsis lyrata populations at the FAH1 and DFR gene regions. Mol. Ecol. 2006, 15, 2059–2068. [Google Scholar] [CrossRef]
- Ross-Ibarra, J.; Wright, S.I.; Foxe, J.P.; Kawabe, A.; DeRose-Wilson, L.; Gos, G.; Charlesworth, D.; Gaut, B.S. Patterns of Polymorphism and Demographic History in Natural Populations of Arabidopsis lyrata. Plos. One. 2008, 3, e2411. [Google Scholar] [CrossRef]
- Clauss, M.J.; Mitchell-Olds, T. Population genetic structure of Arabidopsis lyrata in Europe. Mol. Ecol. 2006, 15, 2753–2766. [Google Scholar] [CrossRef]
- Wright, S.I.; Lauga, B.; Charlesworth, D. Subdivision and haplotype structure in natural populations of Arabidopsis lyrata. Mol. Ecol. 2003, 12, 1247–1263. [Google Scholar] [CrossRef]
- Schmickl, R.; Jorgensen, M.; Brysting, A.; Koch, M. The evolutionary history of the Arabidopsis lyrata complex: A hybrid in the amphi-Beringian area closes a large distribution gap and builds up a genetic barrier. BMC Evol. Biol. 2010. In press. [Google Scholar] [CrossRef]
- Clauss, M.J.; Cobban, H.; Mitchell-Olds, T. Cross-species microsatellite markers for elucidating population genetic structure in Arabidopsis and Arabis (Brassicaeae). Mol. Ecol. 2002, 11, 591–601. [Google Scholar] [CrossRef]
- Holman, J.A. Pleistocene amphibians and reptiles in North America. Oxford Monogr. Geol. Geop. 1995, 32, 1–243. [Google Scholar]
- Placyk, J.S.; Burghardt, G.M.; Small, R.L.; King, R.B.; Casper, G.S.; Robinson, J.W. Post-glacial recolonization of the Great Lakes region by the common gartersnake (Thamnophis sirtalis) inferred from mtDNA sequences. Mol. Phylogenet. Evol. 2007, 43, 452–467. [Google Scholar] [CrossRef]
- Soltis, D.E.; Morris, A.B.; McLachlan, J.S.; Manos, P.S.; Soltis, P.S. Comparative phylogeography of unglaciated eastern North America. Mol. Ecol. 2006, 15, 4261–4293. [Google Scholar] [CrossRef]
Appendixes


| Sequence Name | Accession number | Author |
| PET 1A | DQ989814 | Ansell et al. 2007 |
| PET IB | DQ989815 | Ansell et al. 2007 |
| PET 1C | DQ989816 | Ansell et al. 2007 |
| PET 2 | DQ989817 | Ansell et al. 2007 |
| PET 3 | DQ989818 | Ansell et al. 2007 |
| PET 4 | DQ989819 | Ansell et al. 2007 |
| PET 5 | DQ989820 | Ansell et al. 2007 |
| PET 6 | DQ989821 | Ansell et al. 2007 |
| PET 1 | DQ989822 | Ansell et al. 2007 |
| PET 8 | DQ989823 | Ansell et al. 2007 |
| PET 9 | DQ989824 | Ansell et al. 2007 |
| PET 10 | DQ989825 | Ansell et al. 2007 |
| PET 11 | DQ989826 | Ansell et al. 2007 |
| PET 12 | DQ989827 | Ansell et al. 2007 |
| PET 13 | DQ989828 | Ansell et al. 2007 |
| PET 14 | DQ989829 | Ansell et al. 2007 |
| PET 15 | DQ989830 | Ansell et al. 2007 |
| PET 16 | DQ989831 | Ansell et al. 2007 |
| PET 17 | DQ989832 | Ansell et al. 2007 |
| PET 18 | DQ989833 | Ansell et al. 2007 |
| PET 19A | DQ989834 | Ansell et al. 2007 |
| PET 19B | DQ989835 | Ansell et al. 2007 |
| PET 20 | DQ989836 | Ansell et al. 2007 |
| PET 21A | DQ989837 | Ansell et al. 2007 |
| PET 21B | DQ989838 | Ansell et al. 2007 |
| PET 21C | DQ989839 | Ansell et al. 2007 |
| PET 21D | DQ989840 | Ansell et al. 2007 |
| PET 21E | DQ989841 | Ansell et al. 2007 |
| PET 22 | DQ989842 | Ansell et al. 2007 |
| PET 23 | DQ989843 | Ansell et al. 2007 |
| PET 24 | DQ989844 | Ansell et al. 2007 |
| PET 25 | DQ989845 | Ansell et al. 2007 |
| PET 26 | DQ989846 | Ansell et al. 2007 |
| PET 27 | DQ989847 | Ansell et al. 2007 |
| PET 28 | DQ989848 | Ansell et al. 2007 |
| PET 29 | DQ989849 | Ansell et al. 2007 |
| PET 30 | DQ989850 | Ansell et al. 2007 |
| PET 31A | DQ989851 | Ansell et al. 2007 |
| PET 31B | DQ989852 | Ansell et al. 2007 |
| PET 31C | DQ989853 | Ansell et al. 2007 |
| PET 31D | DQ989854 | Ansell et al. 2007 |
| PET 31E | DQ989855 | Ansell et al. 2007 |
| PET 31F | DQ989856 | Ansell et al. 2007 |
| PET 32 | DQ989857 | Ansell et al. 2007 |
| PET 33 | DQ989858 | Ansell et al. 2007 |
| PET 34 | DQ989859 | Ansell et al. 2007 |
© 2010 by the authors; licensee MDPI, Basel, Switzerland. This article is an open-access article distributed under the terms and conditions of the Creative Commons Attribution license (http://creativecommons.org/licenses/by/3.0/).
Share and Cite
Tedder, A.; Hoebe, P.N.; Ansell, S.W.; Mable, B.K. Using Chloroplast trnF Pseudogenes for Phylogeography in Arabidopsis Lyrata. Diversity 2010, 2, 653-678. https://doi.org/10.3390/d2040653
Tedder A, Hoebe PN, Ansell SW, Mable BK. Using Chloroplast trnF Pseudogenes for Phylogeography in Arabidopsis Lyrata. Diversity. 2010; 2(4):653-678. https://doi.org/10.3390/d2040653
Chicago/Turabian StyleTedder, Andrew, Peter N. Hoebe, Stephen W. Ansell, and Barbara K. Mable. 2010. "Using Chloroplast trnF Pseudogenes for Phylogeography in Arabidopsis Lyrata" Diversity 2, no. 4: 653-678. https://doi.org/10.3390/d2040653