Article

Distinctiveness of Bean Landraces in Italy: the Case Study of the ‘Badda’ Bean

Department of Agrobiology and Agrochemistry, Università degli Studi della Tuscia, Via S.C. de Lellis, s.n.c., 01100 Viterbo, Italy
*
Author to whom correspondence should be addressed.
Diversity 2010, 2(5), 701-716; https://doi.org/10.3390/d2050701
Submission received: 10 March 2010 / Revised: 27 April 2010 / Accepted: 27 April 2010 / Published: 5 May 2010
(This article belongs to the Special Issue Biological Diversity Assessed by Molecular Methods)

Abstract

:
In this study, we present the morphological and molecular characterization of the ‘Badda’ bean, a landrace of outstanding organoleptic qualities that is diffused in the area of Polizzi in the province of Palermo in Sicily, Italy. This landrace is entitled to be valorized in the local market and therefore needs a thorough description to draw criteria to establish its distinctiveness from landraces with morphological and geographical proximity. Three ‘Badda’ accessions, representing the morphological variability within the landrace, have been evaluated together with suitable references. With the help of morpho-physiological traits, digital scanning of apical leaflets and ISSR molecular markers, we describe a spectrum of descriptors useful to distinguish the ‘Badda’ accessions among themselves and from similar landraces.

1. Introduction

The cultivated forms of common bean (Phaseolus vulgaris L.) originated in America during two independent events of domestication occurring, respectively, in the Central and in the South-Western regions of the continent [1]. According to these two origins, the common bean germplasm can be classified as belonging to the Mesoamerican or to the Andean gene pool by using morphological, biochemical and molecular descriptors [2,3]. When the Spaniards introduced the common bean into Europe at the beginning of the 16th century, germplasm from both Central and South America was involved, thus representing the two gene pools also in the Old World [4]. In Europe, common beanrapidly spread into cultivation, being most successful in the South Western countries where it found a secondary center of diversification. Its adaptation to the new environment resulted in a wide array of variants that became more or less fixed into landraces that have been cultivated for centuries [3]. Many of these landraces are still commonly found at local markets [5,6].
Unfortunately, nowadays this variability is endangered; in Italy a great number of landraces have been dropped from the National Register, due to lack of commercial interest from major seed companies that focus on the breeding of the few types preferred by the market (e.g., borlotto and cannellino types). At the same time, relatively few traditional types have been accepted into alternative variety protection systems. To counteract this phenomenon, owing to the interest raised by bean landraces both as a germplasm source for breeding programs and as an added-value produce to be valorized in local and niche markets, the characterization of the Italian treasure of bean local varieties has recently been undertaken by several authors [5,7,8,9,10,11,12].
The ‘Badda’ bean is an Italian landrace that has been cultivated for more than two centuries in the area of Polizzi Generosa (province of Palermo, Sicily) in the natural park of the Madonie mountains, between 700 and 900 m above sea level. In this environment, ‘Badda’ finds optimal conditions for the production of both fresh pods and dry seed, giving a product with superior organoleptic qualities. The name in local dialect means “ball” and refers to the round seed shape. The seed is typically spotted bicolor; two sub-types are distinguished, the ‘Badda Bianco’ (White Badda) with ivory background and a spot ranging from brown to brownish, and the ‘Badda Nero’ (Black Badda) with ivory background and a spot ranging from black to purple. According to the classification reported by Santalla et al. [13], the ‘Badda’ bean morphotypes belong to the market class of white (bi-colored) seed, having the types Hen eye, Rounded Caparron and Kidney Caparron as references for the ‘Badda Nero’ and the ‘Badda Bianco’ with brownish and brown spot, respectively [13].
A group of farmers recently funded a consortium for the protection and valorization of the ‘Badda’ bean, thus raising the need for a thorough characterization of the landrace and the establishment of distinctiveness criteria. These actions are generally necessary in order to pursue landrace valorization through quality marks or the inscription to the Register of Conservation Varieties [9]. In this work, we set out to describe with morphological traits and molecular markers three accessions belonging to the ‘Badda’ landrace, in comparison with several reference materials and with landraces showing morphological and/or geographical proximity.
Several classes of genetic markers have been used in order to infer genetic variability, phylogeny and distinctiveness in common bean, including biochemical polymorphisms [2,6,8,14] and molecular markers such as random amplified polymorphic DNAs (RAPDs) [15,16], amplified fragment length polymorphisms (AFLPs) [5,9,15,17,18], simple sequence repeats (SSRs) [9,10,12,18] and inter simple sequence repeats (ISSRs) [10,16,19,20]. Here, we adopt ISSR marker analysis on DNA bulks from different plants, in order to maximize cost-effectiveness and information for landrace distinction.

2. Experimental Section

2.1. Plant Material and Morphological Analysis

Bean accessions representative of the morphological variability for the seed color found in the ‘Badda’ landrace, ‘Badda Nero’ and ‘Badda Bianco’, were collected from farmers in the Polizzi Generosa area in Sicily. For a preliminary assessment of molecular diversity and a classification of the ‘Badda’ type according to the main gene pools described for common bean, the accessions were grown in a first trial together with reference genotypes including three landraces from central Italy, two cultivars and the American control accessions BAT93 and JaloEEP558 as representative of the Mesoamerican and Andean gene pool, respectively (Table 1). In this trial, DNA was extracted from two plants of each ‘Badda’ accession and from one individual from the other populations. The DNA was analyzed with primers ISSR1 to ISSR12 (Table S1). Primers ISSR1 to ISSR6 were adopted because they were already used with success in the estimation of genetic diversity in bean [20,21], whereas primers ISSR7 to ISSR12 were derived from a work carried out in lentil [22].
A second field trial included a selection of Italian bean landraces mainly from Southern regions and characterized by bicolored seeds. Seeds were imbibed in Petri dishes and seedlings transferred in Jiffy-pots. At the third leaf stage, plantlets were pricked out in open field according to a randomized block design with two blocks and six plants per elementary experimental unit. Plants were grown according to standard agronomic practices. Morpho-physiological traits, which were scored on a single plant basis, were selected from the list of Shalch and De la Rosa [23] following the IPGRI and UPOV descriptions. The traits scored or measured were: date of flowering, of fruit setting and of harvesting (respectively FLO, code 1.01 according to [23], SET and HAR, code 1.06, corresponding to days after sowing (das) to the first open flower, to the first pod set and to the first pod ripen respectively), type of growth (HAB, code 2.05; 1, determinate; 2, indeterminate), flower standard color (FCO, code 5.11; 1, white; 2, lilac; 3, purple). After harvesting, pod length and width (PLE, code 6.01.02, and PWI, code 6.01.03; in cm) were measured on two representative pods per plant, which also served to judge pod beak position (PBP, code 6.01.14; 1, marginal; 2, central), pod beak shape (PBS, code 6.01.15; 1, outwards; 2, straight; 3, inwards), degree of pod curvature (PCU, code 6.02.02; 1, straight; 2, slightly curved; 3, curved), ripe pod color (PCO, code 6.02.05; 1, red mottled; 2, violet mottled; 3, yellow-brownish; 4, violet; 5, white yellowish/brownish). The seed produced by each plant was scored for the seed color (SCO, codes 7.04 and 7.05; 1, white; 2, white/black; 3, white/brownish; 4, white/brown; 5, white/purple; 6, purple/brownish) and seed type (STY, code 7.06; 1, uniform; 2, spotted bicolor; 3, striped).
For the continuous variables (FLO, SET, HAR, PLE, PWI), differences in mean values between accessions were estimated through an analysis of variance adopting the General Linear Model (GLM) using the SAS software [24]. The continuous and discrete variables, together, were used for multivariate analysis according to the Ward method using the procedures DISTANCE and CLUSTER of the SAS program [24]. The distance matrix was calculated using the algorithm of Gower [25], which analyzes continuous and discrete variables jointly. The dendrogram was constructed with the TREE procedure of the same software.
Table 1. List of the landraces and cultivars included in the trials, their origin, codes and growth habit (HAB).
Accession typeOriginAccession nameAccession codeTrialHAB
RegionProvinceLocation 1st2nd
LandracesSicilyPalermoPolizzi GenerosaBadda BiancoBA4xx2
PalermoPolizzi GenerosaBadda BiancoBA7xx2
PalermoPolizzi GenerosaBadda NeroBA6xx2
BasilicataPotenzaRotondaCastelluccisaCA x2
PotenzaRotondaZà VincenzaZV x2
PotenzaSarconiMonachellaMO x2
PotenzaSarconiO’MarozzoMA x2
CampaniaSalernoCasalbuonoMunacieddMU x2
SalernoCilentoTuvaglieddTU x2
SalernoCasalbuonoPanzarieddPA x2
LatiumRietiColle di ToraA piselloPH x2
ViterboGradoliFagiolo del PurgatorioPUx 1
MarchePesaro e UrbinoUrbaniaBorlotto rossoAN8 x2
Pesaro e UrbinoLecciaBorlottoAN9 x1
MacerataI ColliBorlotto uova di quagliaAN23xx2
MacerataB.go S. AntonioMonachelloAN39xx2
Commercial Big borlottoBBx 1
ClioCLxx1
References BAT93BATx 1
JaloEEP558JAx 1

2.2. Morphometric Analysis of Leaf Shape

To estimate leaf shape in detail, six representative apical leaflets from fully developed trifoliate leaves for each of the 15 landraces adopted in the second trial were scanned into digital images and subjected to morphometric analysis by the Tomato Analyzer ver 1.2 Software [26,27]. Although the software was specifically implemented to analyze fruit morphology, the following descriptors could properly be detected on the leaflet silhouette: leaf perimeter (LP), leaf area (LA), leaf width at mid-height (LWM), maximum width (MW), maximum height (MH), leaf shape index (LSI), proximal leaf blockiness (PLB; “proximal” refers to the tip of the leaflet), distal leaf blockiness (DLB; “distal” refers to the peduncolar end of the leaflet), leaf shape triangle (LST), ellipsoid (ELL), circular (CIR), widest width position (WWP). All parameters are described in detail by Brewer et al. [26] and Gonzalo et al. [27]. After standardization, the arithmetic means over landrace were used to perform an Agglomerative Hierarchical Clustering (AHC) procedure with the XLSTAT 7.5.2 Package (http://www.xlstat.com/). Clustering was based on the Euclidean distance and the Ward method chosen as a fusion criterion.
The dissimilarity matrices obtained from the morpho-physiological and from the leaf shape data were compared by Mantel test using XLSTAT.

2.3. Molecular Analyses

DNA was extracted from single plants using 2–3 young healthy leaflets according to Doyle and Doyle [28]. The extracted DNA was quantified after running an aliquot on 1.2% (w/v) agarose gels and compared with standards of known concentration. For the analysis of the second trial, the DNA extracted from four single plants per accession was separately checked with a control amplification and then bulked by mixing equal amounts. DNA pooling was adopted as a strategy to highlight inter-population diversity and better identify those bands with diagnostic value for distinctiveness.
Thirty ISSR primers, 12 degenerate and 18 non-degenerate, were used for the study (Table S1). The non-degenerated primers (primer codes from ISSR15 onwards) were developed by the authors. ISSR PCR amplification was done in 20 μL of reaction mixture containing 30 ng of DNA, 2.0 μL of 10 × PCR buffer, 2 μL of 100 mM dNTPs, 75 ng of primer and 1.0 U of Taq DNA polymerase (Pharmacia Biotech, San Francisco, CA). The PCR program was 94 °C for 4 min, followed by 35 cycles of 94 °C for 1 min, 56 °C for 1 min, 72 °C for 2 min and a final extension of 5 min at 72 °C. Primer ISSR1 to ISSR6 were given an annealing temperature of 42 °C instead of 56 °C. The PCR products were resolved in 2.0% (w/v) agarose gels in Tris-boric acid/EDTA buffer (1 × TBE) and electrophoresis was carried out for 3 h at a constant voltage of 75 V. Gels were stained with ethidium bromide and photographed with an image analyzer.
Each polymorphic ISSR band was considered as a locus with two alleles: presence (1) or absence (0), thus generating a binary matrix. Weak bands were not taken into consideration. Binary data were used to calculate a genetic distance [29] matrix. Dendrograms were constructed with the unweighted pair-group method of arithmetic clustering (UPGMA) [30] using the Treecon Ver. 1.3b software [31]. Levels for support for the nodes were evaluated using a bootstrap analysis with 500 replicates.
The dissimilarity matrices obtained from the morpho-physiological and from the leaf shape data were compared with that yielded by the ISSR analysis by Mantel test using XLSTAT.

3. Results and Discussion

3.1. Preliminary Characterization of the ‘Badda’ Bean Landrace

A first agronomic trial and analysis with ISSR markers were carried out in order to classify the ‘Badda’ landrace into one of the major bean gene pools and to preliminary assess its distinctiveness from other bean types (Table 1). The analysis produced a total of 138 ‘readable’ ISSR amplification products, two-thirds of which were polymorphic in the studied material (Table 2). The analysis separated the accessions into two clusters, one harboring ‘BAT93’ (BAT) and ‘Fagiolo del Purgatorio’ (PU) and the second grouping the other accessions (Figure S1). In this second cluster, the three ‘Badda’ accessions were shown to be distinguishable from the reference type JA, the other spotted-bicolor (AN39) and Borlotto-type striped beans (CL, AN23 and BB). This distinction reflects the division into the main gene pools of common bean, because BAT is the reference type for the Mesoamerican gene pool and PU has been similarly classified having the S type of phaseolin pattern [11], which is typical of Mesoamerican beans [10]. On the other hand, although an analysis of phaseolins was not performed in this study, the ‘Badda’ landrace grouped together with JA, the reference genotype for the Andean gene pool, and with Borlotto types that in other studies have shown the H and T phaseolin patterns [8], typical of large seeded beans from the Andean region [2,32]. Altogether, the data indicated that the ‘Badda’ landrace belongs to the Andean gene pool, that includes the majority of the genotypes spread in Europe and in particular in Italy [3,8,10,16]. Consequently, the analysis for distinctiveness was addressed to a selected group of accessions, mostly including Italian landraces from the Andean gene pool [33] having phenotypic similarity and geographic proximity to ‘Badda’.
Table 2. Statistics of the molecular analyses carried out with ISSR markers in the preliminary trial (13 genotypes from 10 accessions of the two gene pools) and in the second trial (16 DNA bulks of four plants each, representing landraces belonging to the Andean gene pool from Southern Italy plus the cv Clio). Percentages are reported in parentheses.
Trait1st trial2nd trial
TotalDegenerate primersNon-degenerate primers
No. of informative primers12281117
No. of bands13819469125
No. of bands per primer11.56.96.37.4
No. of polymorphic bands93 (67.4)50 (25.8)20 (29.0)30 (24.0)
No. of polymorphic bands per primer7.81.81.81.8
No. of private bands5 (3.6)*15 (7.7)**4 (5.8)11 (8.8)
No. of private bands per primer0.40.50.40.6
* Four out of five bands are private of the Mesoamerican gene pool (BAT and PU).** Nine out of 15 bands are private of the Clio cultivar.

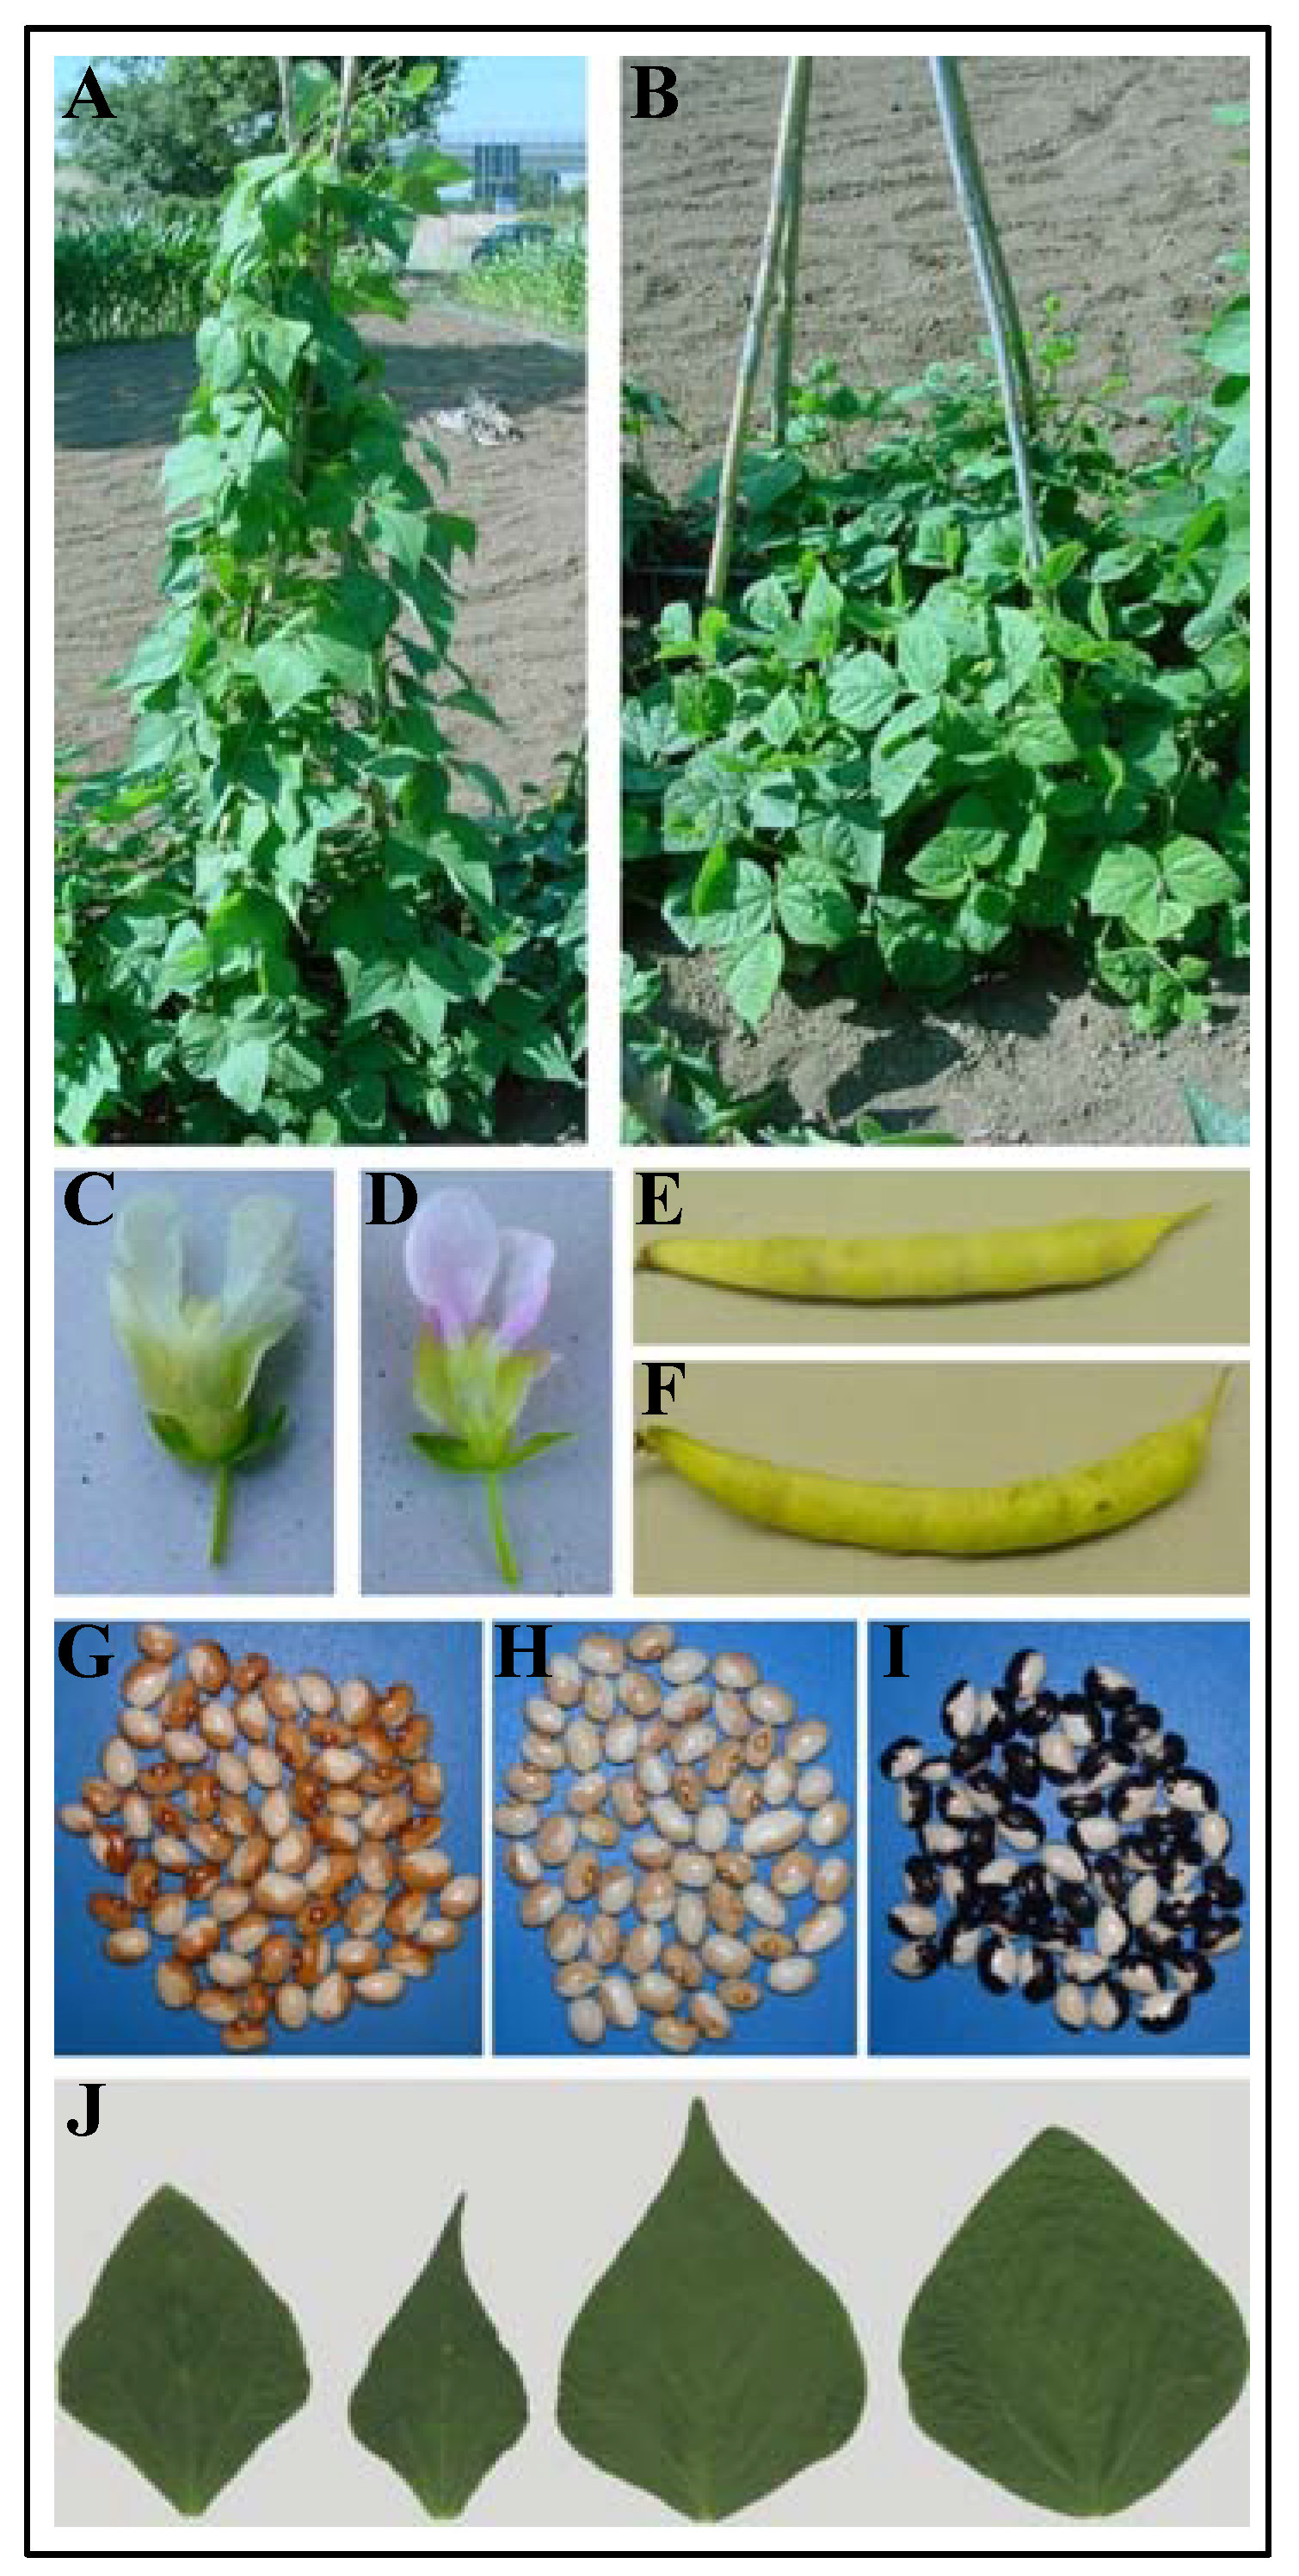
3.2. Morpho-Physiological Analysis

In addition to the three ‘Badda’ accessions, the second trial included four landraces from the Basilicata region, three from Campania, one from Latium and four from Marche (Table 1). The cultivar Clio (CL) was left as a commercial reference.
All the accessions in this trial showed an indeterminate growth habit with the exception of AN9 and CL (Figure 1A, B; Table 1). For all the quantitative variables, the accessions showed significant differences (Table S2). All the ‘Badda’ accessions showed very late flowering time (FLO > 80 das) together with three accessions from Basilicata and ripened the pods only in late summer (Table S2). The ‘Badda’ accessions all had plants with white flower standards (Figure 1C). The other accessions had either white or lilac (Figure 1D) flowers, with the exception of CL, whose flowers were purple.
Figure 1. Morphological characteristics of the ‘Badda’ bean accessions. Indeterminate growth habit in ‘Badda’ (A) compared with the determinate growth habit of the cv Clio (B); flower at anthesis from one ‘Badda’ accession (C) and from the accession MA (D); straight immature pod from the accession BA6 (E) and curved pod from BA4 (F); seed samples from BA4, and BA7, the ‘Badda Bianco’ accessions (G-H) and from BA6, the ‘Badda Nero’ (I); silhouettes of typical apical leaflets from bean accessions representing the four groups yielded by the analysis of leaf shape data (J, from left to right, BA4, BA6, BA7 and MO).
Diversity 02 00701 g001
Only the accessions AN8 showed a pod length significantly longer than the others (Table S2). Pod width was more diverse overall; notably, BA4 showed a thinner pod compared to BA6, whereas BA7 was intermediate. The accessions showed high variability for the other descriptors of the pod and the seed, but the three ‘Badda’ accessions were homogeneous for PBP and STY. ‘Badda Nero’ (BA6) differentiated for having a straight pod and beak shape (Figure 1E) whereas the other ‘Badda’ accessions showed curved phenotypes (Figure 1F). Secondary seed color was finally differentiating the three ‘Badda’ accessions, being brown, brownish or black in BA4, BA7 and BA6 respectively (Figure 1G-I).
When the morpho-physiological data were subjected to multivariate analysis, the lower Gower’s distance was found between BA7 and MO (0.16) and the highest between CL and CA (0.86, data not shown). The cluster analysis sharply separated the accession into two clusters, one including the Borlotto-type accessions (with striped seed, STY = 3; AN8, AN23, AN9, MA, CL) and the other the remaining accessions, all with bicolored seed except PH, which has white uniform seed (Figure 2A). The first cluster included the two accession with determinate habit, and was characterized by plants with lilac/purple flower standards and early flowering (FLO range 43-65 das). The second cluster was further divided into two sub-groups, mainly based on differences in pod curvature and pod beak shape (Figure 2A).
Figure 2. UPGMA dendrograms based on Gower [25] matrix following 13 morphological descriptors (A) and Nei et al. [29] matrix following ISSR analysis (50 polymorphic bands; numbers at the nodes indicate bootstrap values) (B) of 16 bean accessions.
Diversity 02 00701 g002

3.3. Morphometric Analysis of Leaf Shape

The taxonomic value of the shape of the terminal leaflet in the trifoliate leaf was highlighted in previous studies, where four principal morphotypes (cordate, ovate, rhombohedric and hastate) were described on the basis of leaf length and width [34]. Here, morphometric differences in the apical leaflet (hereafter referred to as leaf shape data) were detected by 12 descriptors, adopting the Tomato Analyzer digital system [26], in order to improve the quantity and quality of leaf descriptors. A hierarchical analysis of the data separated the landraces into two groups according to leaflet symmetry as expressed by distal leaf blockiness (DLB; “distal” refers to the peduncular side) and leaf shape triangle (LST, Table 3). Accessions with symmetric or rhombohedric [34] leaves (among which there was BA4, Figure 1J) showed lower values of DLB and higher values of LST (Table 3). Differently, BA6 and BA7 were classified among the accessions with asymmetric or hastate [34] leaves (Figure 1J). Within each first-level group, the accessions were further subdivided according to the size; this was related to different values of LA, which were supported by different MH in the ‘symmetric leaf’ group and different LSI in the ‘asymmetric leaf’ group (Table 3).
The grouping of landraces according to leaf shape data was not correlated to that obtained with the other morphological descriptors; the matrices of dissimilarity were not significantly correlated (r = −0.09, P = 0.20).
Table 3. Group mean value and range of individual means (in parenthesis) for the leaflet morphometric traits discriminating the landraces into four groups.
1st-level groups1st-level discriminant traits2nd-level groups2nd-level discriminant traitsLandraces
DLBLST LALSIMH
‘Symmetric leaflet’ 0.48
(0.40–0.63)
0.35
(0.28–0.50)
‘Big leaflet’33.6
(30.9–35.9)
1.32
(1.28–1.38)
8.6
(8.2–9.3)
AN8, MO, CA, PH
‘Small leaflet’25.1
(23.7–27.2)
1.34
(1.32–1.40)
7.6
(7.4–7.7)
BA4, AN39, ZV
‘Asymmetric leaflet’0.60
(0.53–0.70)
0.26
(0.19–0.39)
‘Big leaflet’31.3
(29.9–33.6)
1.36
(1.32–1.41)
8.4
(8.2–8.7)
BA6, AN23, MA, MU
‘Small leaflet’27.5
(22.3–32.6)
1.46
(1.39–1.54)
8.4
(7.5–9.4)
BA7, PA, AN9, TU

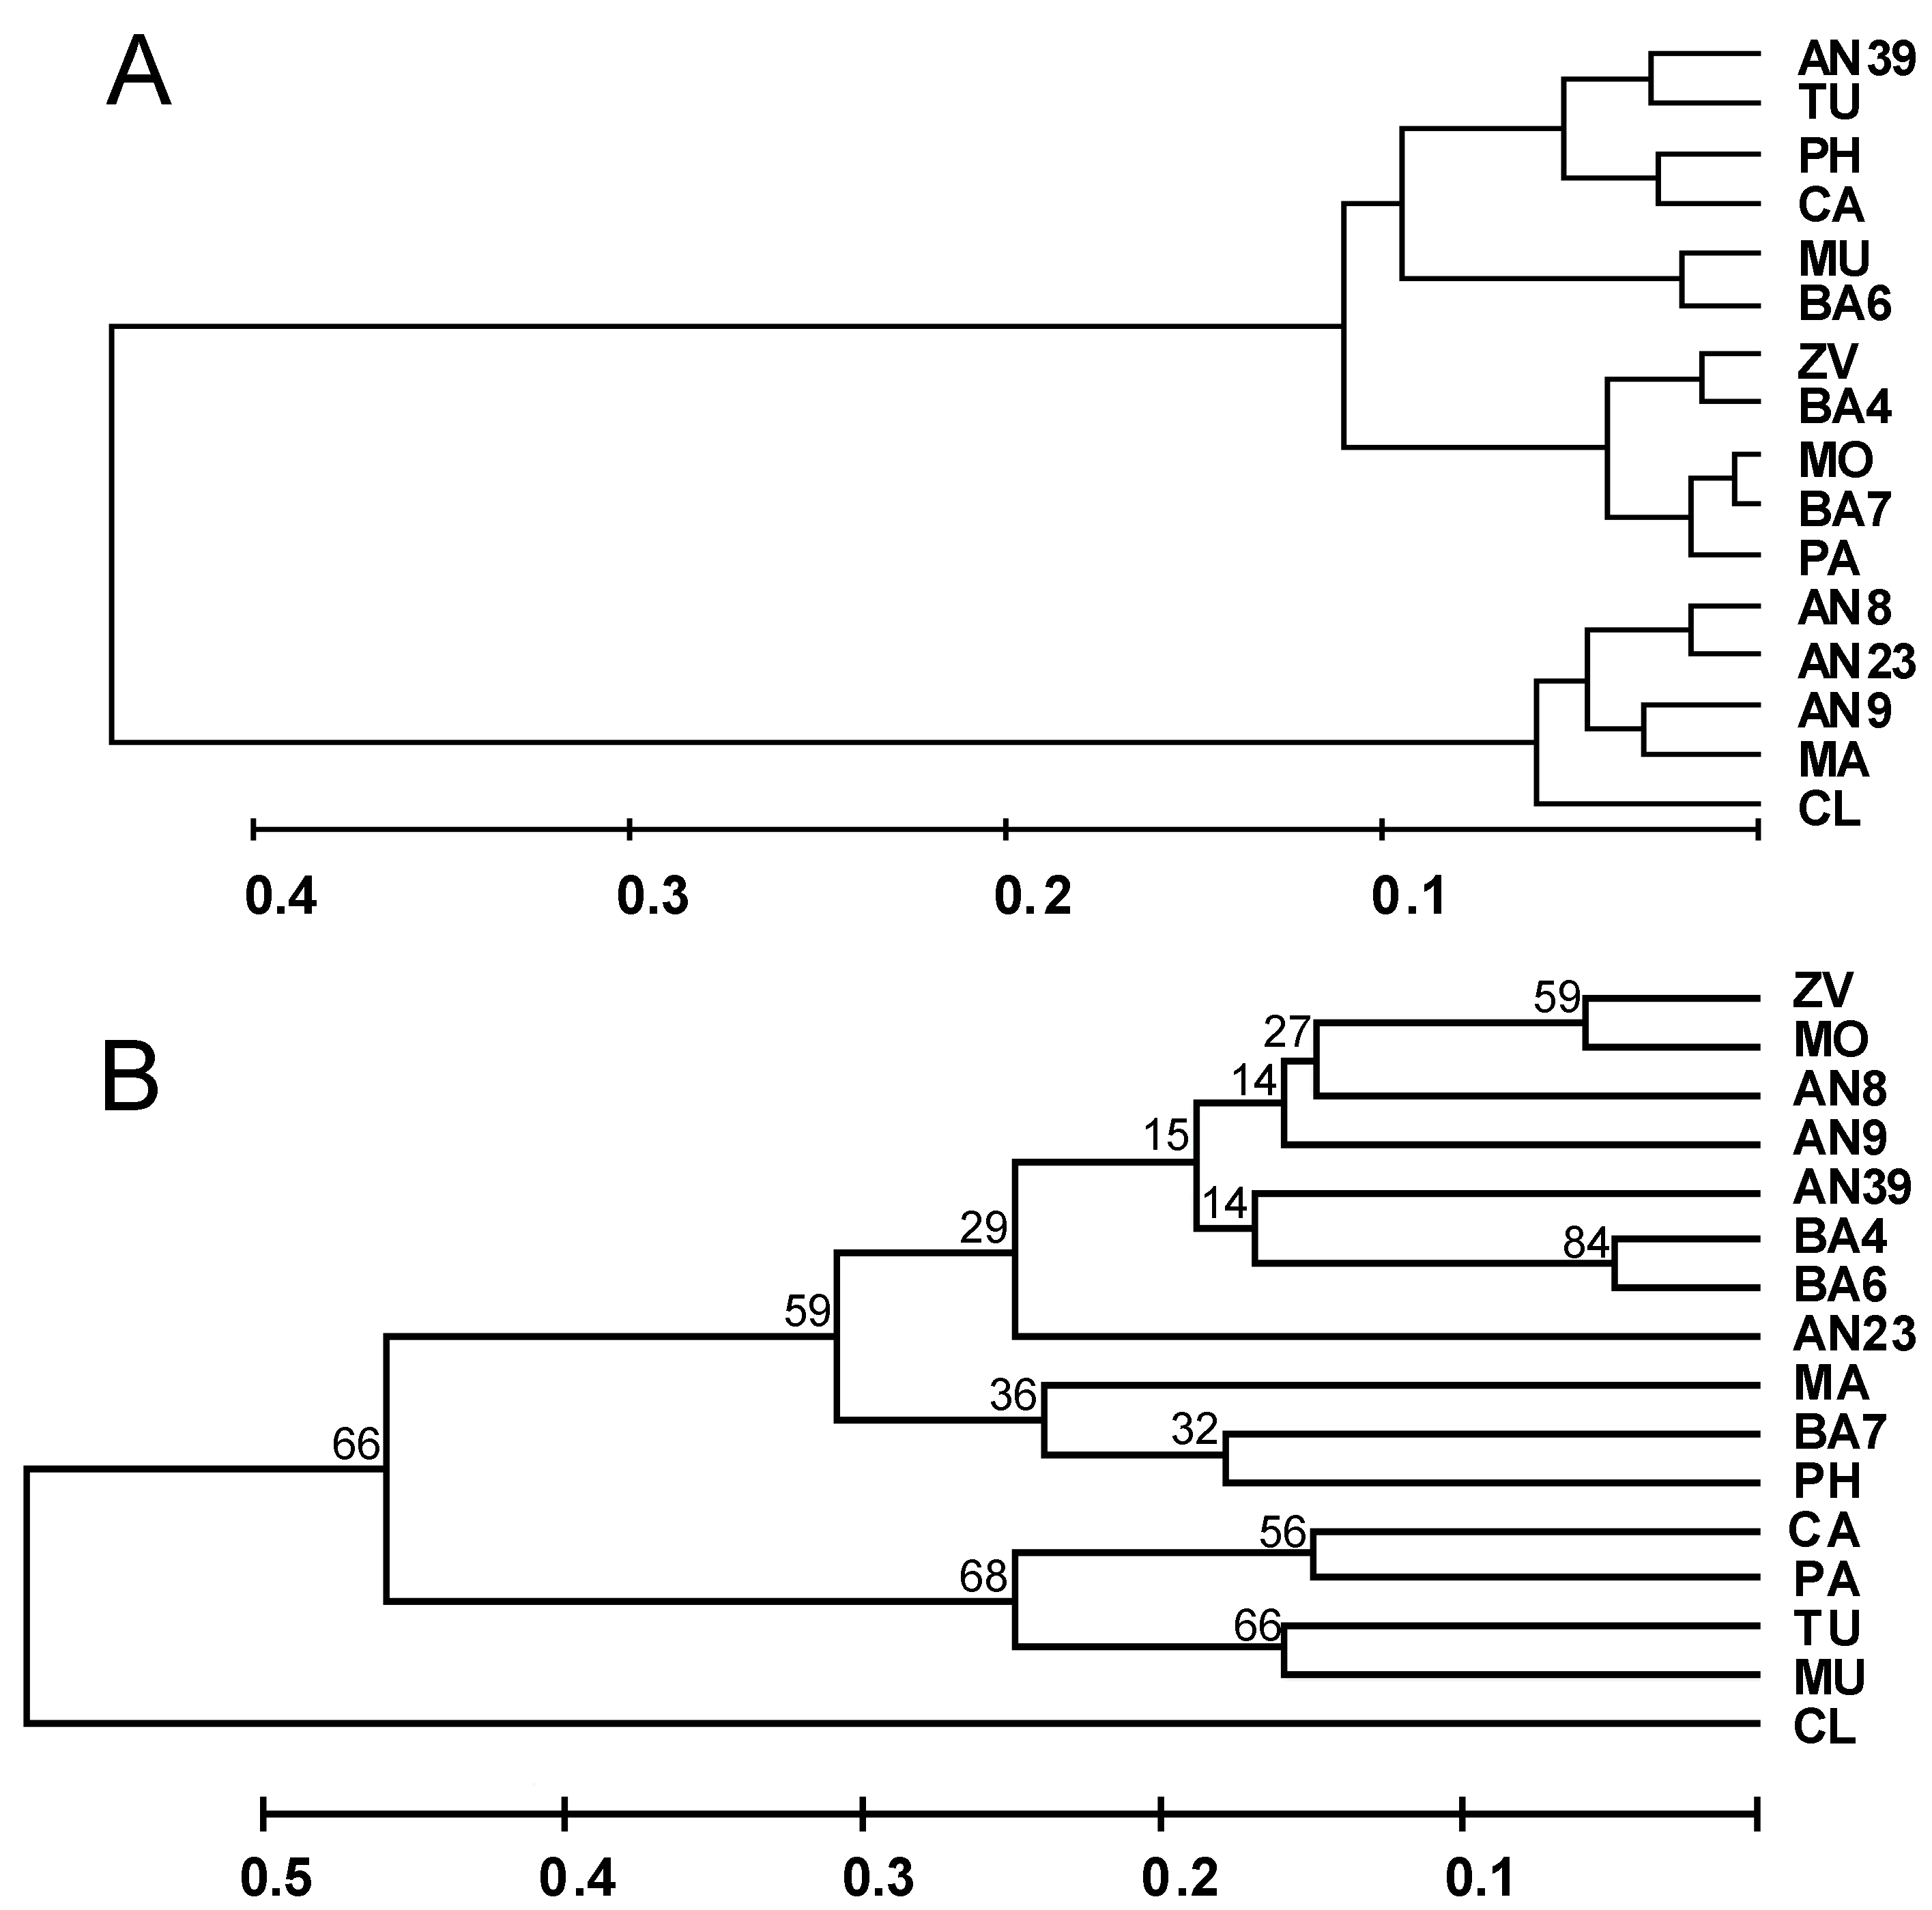
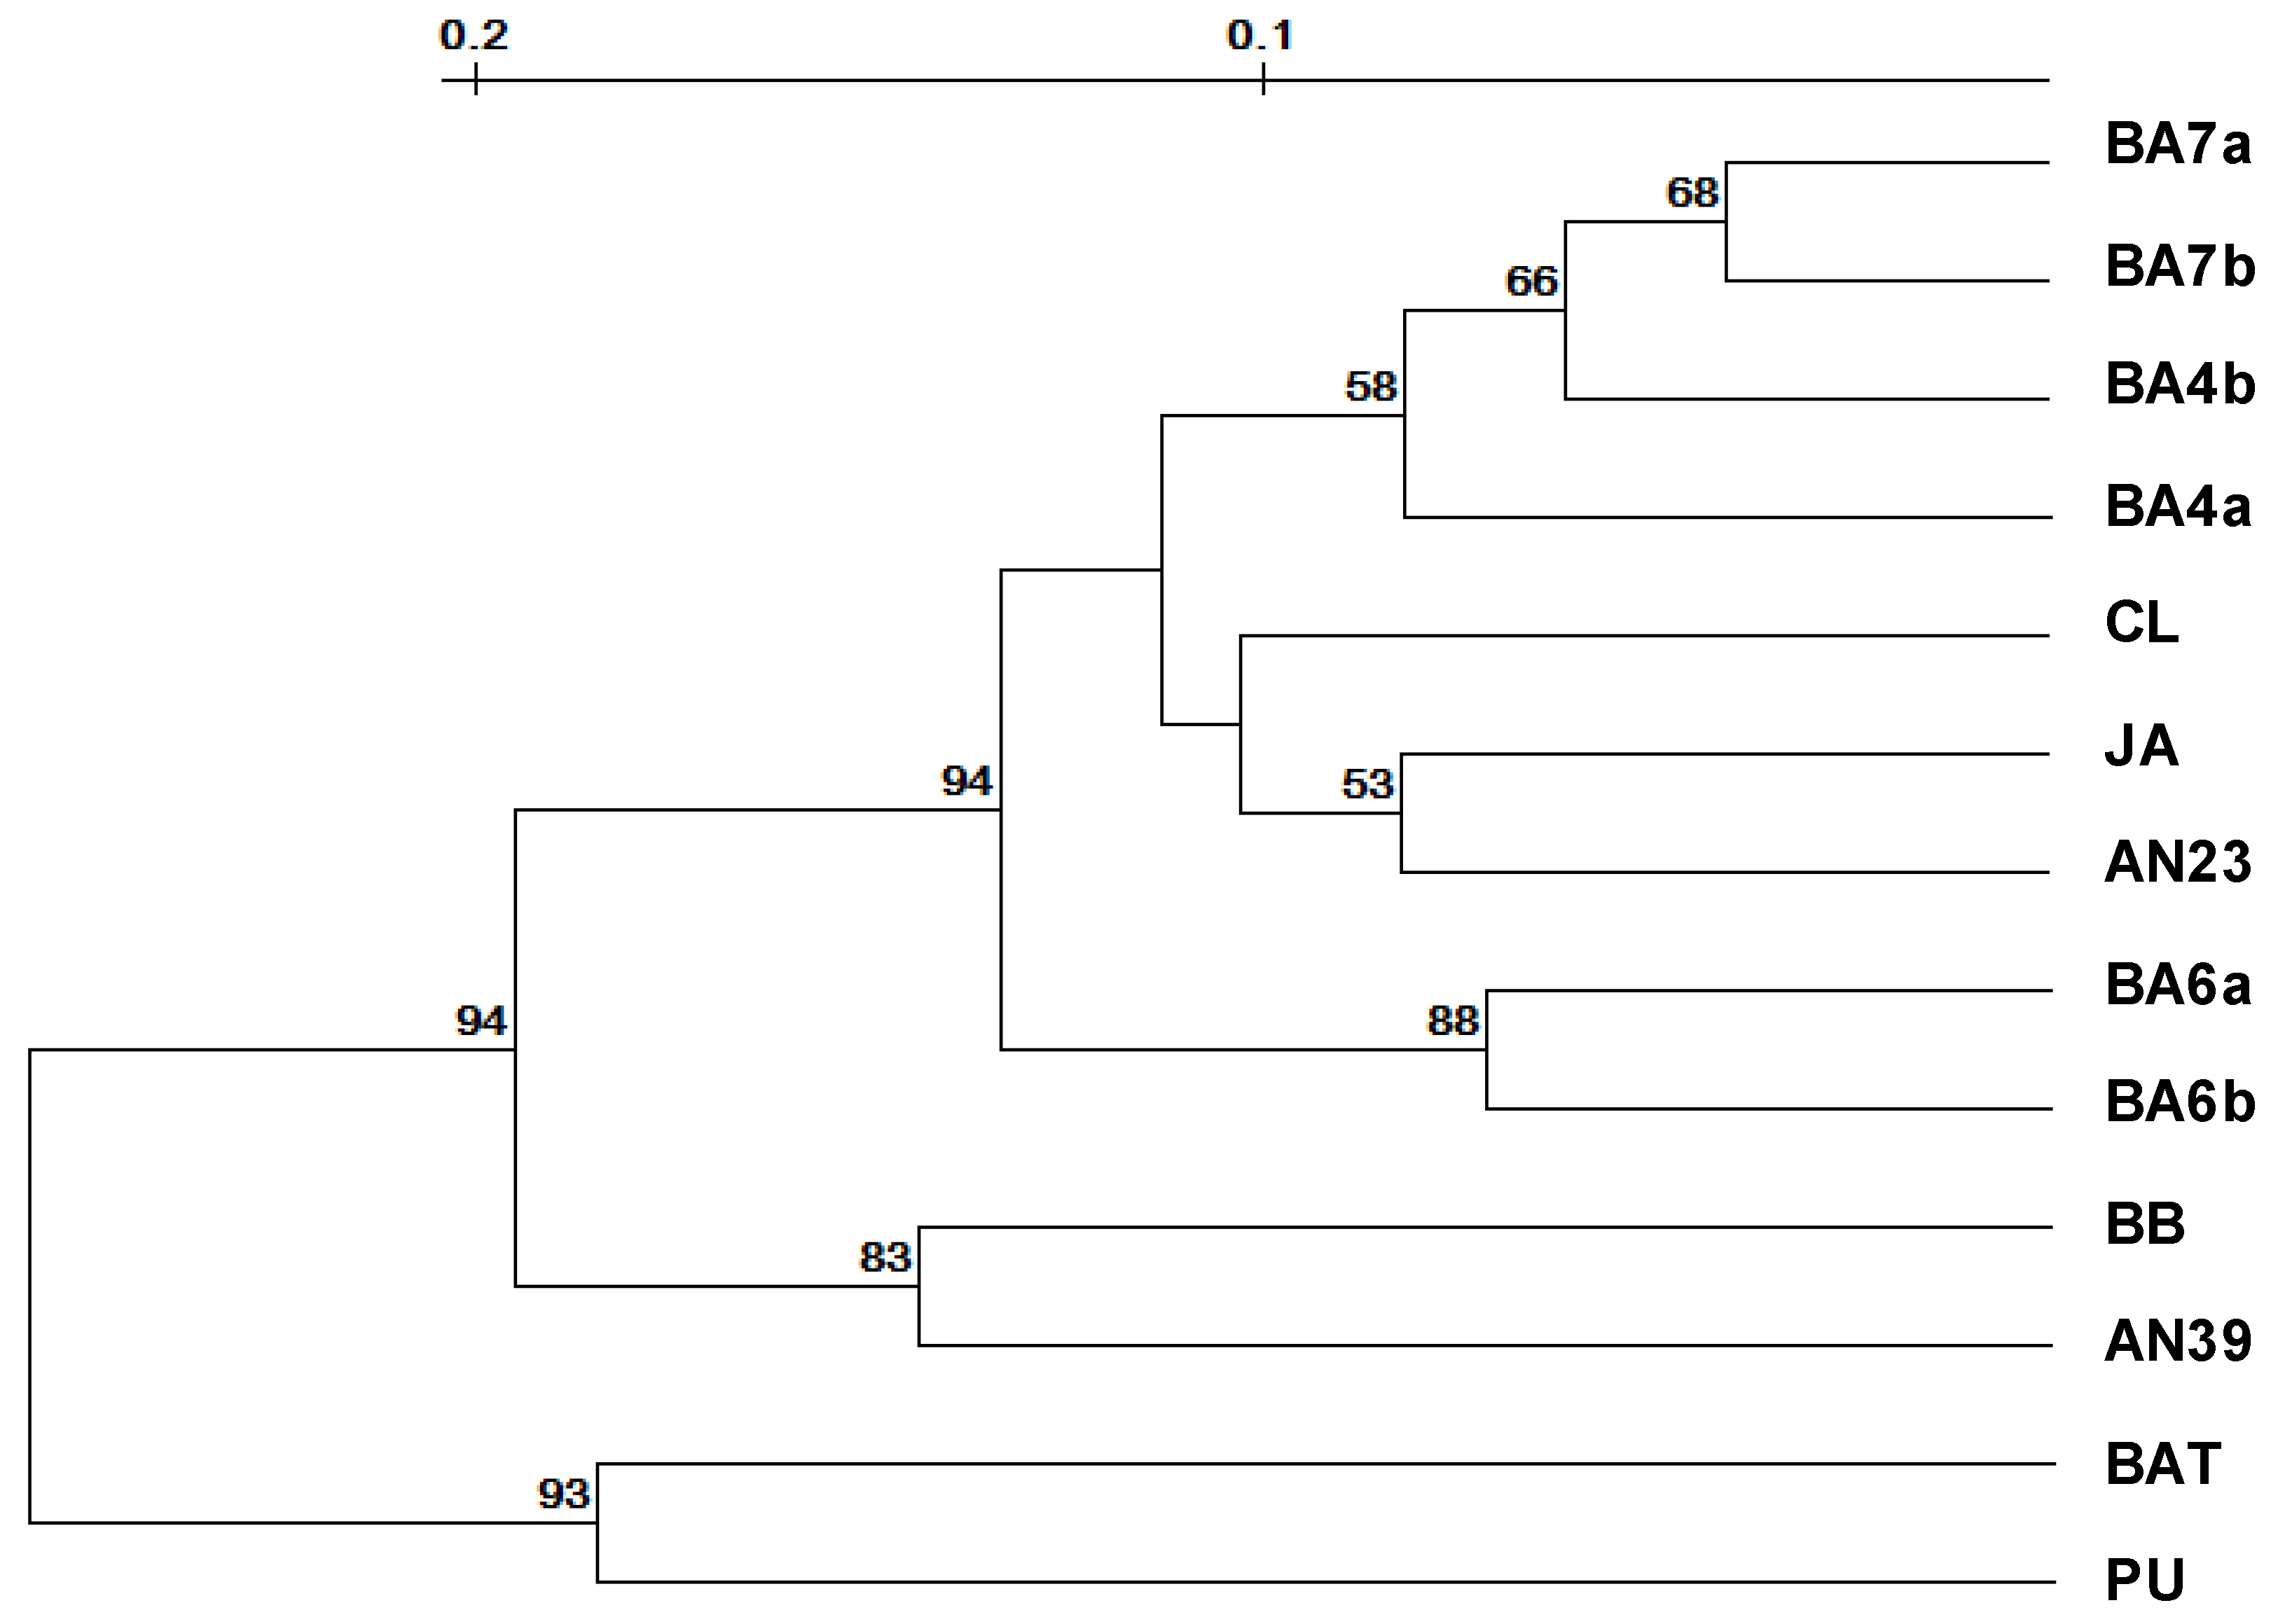
3.4. Molecular Analysis

Because primer ISSR12 and ISSR35 did not amplify readable profiles in this analysis, the results are yielded by amplification with 28 informative primers. The molecular analyses on the 16 DNA bulks corresponding to the accessions evaluated in the second trial yielded a total of 194 bands with a size variable between 110 and 2,200 bp. Of these, 50 were polymorphic among the studied accessions (26%). The mean number of bands per primer was 6.9 and the mean number of polymorphic bands per primer was 1.8 (Table 2). The percentage of polymorphic bands was not significantly different (χ2 for homogeneity 0.63, ns) between the groups of degenerate and non-degenerate primers, nor was the number of polymorphic bands per primer (Table 2). This indicated that the choice of ISSR primers from the literature according to previous experience in the same family, as was the case of the degenerate primers [20,21,22], is not crucial for their efficiency, because the non-degenerate primers, developed by the authors, highlighted similar levels of polymorphism. Bulking plant DNA in the second trial had the effect to drastically lowering the number of polymorphic markers compared to the first analysis (Table 2) and to other reports [16] and of doubling on average the frequency of private bands.
The dendrogram obtained from the Nei distance matrix highlighted the difference of CL from the landraces; the latter were divided into two main clusters, one containing the accessions from Campania (PA, TU, MU) plus CA from Basilicata and the other the remaining accessions (Figure 2B). The two ‘Badda’ accessions BA4 and BA6 grouped very close, showing the highest bootstrap value in the dendrogram. Differently, the accession BA7 was related, more loosely, to the landraces PH and MA (Figure 2B).
Thus, BA4 and BA6 could be referred to a molecularly distinct ‘Badda’ type, whereas BA7 represent a more distant population, possibly derived from a different introduction or contaminated by foreign germplasm. This was supported by the detection of one band private for BA7 and three bands specific to BA7, PH and MA. No private bands were detected either for BA4 or BA6. Only one amplification product was detected specifically in the three ‘Badda’ DNA bulks.
The dissimilarity matrices based on the full range of morphological descriptors and on the molecular markers were significantly but loosely correlated (P = 0.02, r = 0.27). However, when the CL cultivar was excluded from the matrix, the dissimilarity matrix obtained by molecular analysis was not significantly correlated either to that based on general morphology or on leaf shape data (r = 0.09, P = 0.20 and r = −0.02, P = 0.47, respectively). This demonstrated that the three levels of analysis likely sample different regions of the genome and that the most powerful criteria to establish landrace distinctiveness are those combining, at least, two levels of description. Thus, the ‘Badda Nero’ accession is very close to MU for morphological (differing only for the beak position and the seed color; Figure 2A; Table S2) and leaf shape data (Table 3); however, they result well separated by ISSR analysis (Figure 2B). The ‘Badda’ accession with brownish seeds, BA7, is very close to MO in general morphology (differing only for the pod color; Figure 2A; Table S2), but they show definitely different leaf shape classification (Table 3) and are well separated by ISSRs (Figure 2B).

4. Conclusions

Nowadays, the on-farm survival and commercial valorization of Italian bean landraces is only guaranteed for beans from ‘Lamon’, ‘Sarconi’ and ‘Sorana’, that are endowed with a I.G.P. mark of the European Community [35]. However, many other bean types deserve characterization and description to be included in the list of the protected landraces. Several levels of analysis are available to study genetic diversity and distinctiveness of cultivated populations. The discrimination power of manually-scored morpho-physiological traits is greatly improved by the wealth and accessibility of specific and random molecular markers. In addition, new useful strategies may be developed by the use of digitally acquired data that may expedite and objectivise the detection of organ shape, size and color. Detection systems based on digital analysis of seed properties have been successfully proposed to distinguish bean landraces [36].
In the present work, the morphologically diverse ‘Badda’ landrace has been characterized by a combination of continuous and categorical morphological descriptors, morphometric measurements of the leaflet shape and a number of polymorphic ISSR loci. All the levels of analysis yielded a contribution to discriminate the ‘Badda’ accession among themselves and from the other landraces. Accordingly, the better strategy to assess distinctiveness would be the adoption of, at least, two classification criteria. The use of DNA bulks for the ISSR analysis, lowered, as expected, the average number of polymorphic bands per primer, but highlighted those amplification products that can be used to ‘label’ distinct landraces.
Taken together, the analyses showed that the ‘Badda’ accessions share a degree of genetic similarity with other landraces from nearby regions such as Basilicata [35], but that nevertheless the present characterization is sufficient for declaring their identity and distinctiveness.

Acknowledgements

This research has been funded by a contribution of Consorzio di Ricerca “Gian Pietro Ballatore”— Enna, in the frame of the regional project “Piano per la produzione di proteine vegetali (3P-Sicilia)”. The authors thank G. Barcaccia, D. Lafiandra, B. Messina and N. Pogna for the scientific contribution, L. Lioi, R. Papa, V. Negri, G.P. Soressi, P. Spagnoletti Zeuli and M. Zaccardelli for contributing seed samples, four anonymous referees for their constructive comments on the manuscript and M.E. Picarella and L. Bonifazi for expert technical assistance

References

  1. Gepts, P.; Bliss, F.A. Phaseolin variability among wild and cultivated common beans (Phaseolus vulgaris) from Colombia. Econ. Bot. 1986, 40, 469–478. [Google Scholar] [CrossRef]
  2. Gepts, P.; Bliss, F.A. Dissemination pathways of common bean (Phaseolus vulgaris, Fabaceae) deduced from phaseolin electrophoretic variability. II. Europe and Africa. Econ. Bot. 1988, 42, 86–104. [Google Scholar] [CrossRef]
  3. Papa, R.; Nanni, L.; Sicard, D.; Rau, D.; Attene, G. The evolution of genetic diversity in Phaseolus vulgaris L. In Darwin Harvest: New Approaches To The Origin, Evolution, and Conservation of Crops; Motley, T.J., Zerega, N., Cross, H., Eds.; Columbia University Press: New York, NY, USA, 2006; pp. 121–142. [Google Scholar]
  4. Zeven, A.C. The introduction of common bean (Phaseolus vulgaris L.) into Western Europe and the phenotypic variation of dry bean collected in The Netherlands in 1945. Euphytica 1997, 94, 319–328. [Google Scholar] [CrossRef]
  5. Negri, V.; Tosti, N. Phaseolus genetic diversity maintained on-farm in central Italy. Genet. Res. Crop Evol. 2002, 49, 511–520. [Google Scholar] [CrossRef]
  6. Santalla, M.; Rodino, A.P.; De Ron, A.M. Allozyme evidence supporting southwestern Europa as a secondary center of genetic diversity for common bean. Theor. Appl. Genet. 2002, 104, 934–944. [Google Scholar] [CrossRef]
  7. Piergiovanni, A.R.; Laghetti, G. The common bean landraces from Basilicata (Southern Italy): an example of integrated approach applied to genetic resources management. Genet. Res. Crop Evol. 1999, 46, 47–52. [Google Scholar] [CrossRef]
  8. Piergiovanni, A.R.; Taranto, G.; Losavio, F.; Pignone, D. Common bean (Phaseolus vulgaris L.) landraces from Abruzzo and Lazio regions (Central Italy). Genet. Res. Crop Evol. 2006, 53, 313–322. [Google Scholar] [CrossRef]
  9. Lioi, L.; Piergiovanni, A.R.; Pignone, D.; Puglisi, S.; Santantonio, M.; Sonnante, G. Genetic diversity of some surviving on-farm Italian common bean (Phaseolus vulgaris L.) landraces. Plant Breed. 2005, 124, 576–581. [Google Scholar] [CrossRef]
  10. Sicard, D.; Nanni, L.; Porfidi, O.; Bulfon, D.; Papa, R. Genetic diversity of Phaseolus vulgaris L. and P. coccineus L. landraces in Central Italy. Plant Breed. 2005, 124, 464–472. [Google Scholar] [CrossRef]
  11. Santangelo, E.; Mazzucato, A.; Picarella, M.E.; Mosconi, P.; Lioi, L.; Soressi, G.P. Caratterizzazione del ‘Fagiolo del Purgatorio’ di Gradoli (VT). Italus Hortus 2006, 13, 496–502. [Google Scholar]
  12. Foschiani, A.; Miceli, F.; Vischi, M. Assessing diversity in common bean (Phaseolus vulgaris L.) accessions at phenotype and molecular level: a preliminary approach. Genet. Res. Crop Evol. 2009, 56, 445–453. [Google Scholar] [CrossRef]
  13. Santalla, M.; De Ron, A.M.; Voysest, O. European bean market classes. In Catalogue of Bean Genetic Resources; Amurrio, M., Santalla, M., De Ron, A.M., Eds.; PHASELIEU-FAIRPL97-3463, Misión Biológica de Galicia (CSIC): Pontevedra, Spain, 2001; pp. 79–94. [Google Scholar]
  14. Lioi, L. Geographical variation of phaseolin patterns in an old world collection of Phaseolus vulgaris. Seed Sci. Technol. 1989, 17, 317–324. [Google Scholar]
  15. Sánchez, E.; Sifres, A.; Casañas, F.; Nuez, F. The endangered future of organoleptically prestigious European landraces: Ganxet bean (Phaseolus vulgaris L.) as an example of a crop originating in the Americas. Genet. Res. Crop Evol. 2008, 55, 45–52. [Google Scholar] [CrossRef]
  16. Marotti, I.; Bonetti, A.; Minelli, M.; Catizone, P.; Dinelli, G. Characterization of some Italian common bean (Phaseolus vulgaris L.) landraces by RAPD, semi-random and ISSR molecular markers. Genet. Res. Crop Evol. 2007, 54, 175–188. [Google Scholar] [CrossRef]
  17. Maciel, F.L.; Echeverrigaray, S.; Gerald, L.T.S.; Grazziotin, F.G. Genetic relationships and diversity among Brazilian cultivars and landraces of common beans (Phaseolus vulgaris L.) revealed by AFLP markers. Genet. Res. Crop Evol. 2003, 50, 887–893. [Google Scholar] [CrossRef]
  18. Masi, P.; Logozzo, G.; Donini, P.; Spagnoletti-Zeuli, P. Analysis of genetic structure in widely distributed common bean landraces with different plant growth habits using SSR and AFLP markers. Crop Sci. 2009, 49, 187–199. [Google Scholar] [CrossRef]
  19. Galván, M.Z.; Bornet, B.; Balatti, B.A.; Branchard, M. Inter simple sequence repeat (ISSR) markers as a tool for the assessment of both genetic diversity and gene pool origin in common bean (Phaseolus vulgaris L.). Euphytica 2003, 132, 297–301. [Google Scholar] [CrossRef]
  20. Gonzalez, A.; Wong, A.; Delgado Salinas, A.; Papa, R.; Gepts, P. Assessment of inter simple sequence repeat markers to differentiate sympatric wild and domesticated populations of common bean (Phaseolus vulgaris L.). Crop Sci. 2005, 45, 606–615. [Google Scholar] [CrossRef]
  21. Zizumbo-Villarreal, D.; Colunga-GarcíaMarín, P.; de la Cruz, E.P.; Delgado-Valerio, P.; Gepts, P. Population structure and evolutionary dynamics of wild-weedy-domesticated complexes of common bean in a Mesoamerican region. Crop Sci. 2005, 45, 1073–1083. [Google Scholar] [CrossRef]
  22. Sonnante, G.; Pignone, D. Assessment of genetic variation in a collection of lentil using molecular tools. Euphytica 2001, 120, 301–307. [Google Scholar] [CrossRef]
  23. Schachl, R.; De la Rosa, L. Characterisation of Phaseolus accessions. In Handbook on Evaluation of Phaseolus Germplasm; De la Cuadra, C., De Ron, A.M., Schachl, R., Eds.; PHASELIEU-FAIRPL97-3463, Misión Biológica de Galicia (CSIC): Pontevedra, Spain, 2001; pp. 29–43. [Google Scholar]
  24. SAS Institute Inc. SAS Guide for Personal Computers, 9th ed.; SAS Institute: Cary, NC, USA, 2002. [Google Scholar]
  25. Gower, J.C. A general coefficient of similarity and some of its properties. Biometrics 1971, 27, 623–637. [Google Scholar] [CrossRef]
  26. Brewer, M.T.; Lang, L.; Fujimura, K.; Dujmovic, N.; Gray, S.; van der Knaap, E. Development of a controlled vocabulary and software application to analyze fruit shape variation in tomato and other plant species. Plant Physiol. 2006, 141, 15–25. [Google Scholar] [CrossRef]
  27. Gonzalo, M.J.; Brewer, M.T.; Anderson, C.; Sullivan, D.; Gray, S.; van der Knaap, E. Tomato fruit shape analysis using morphometric and morphology attributes implemented in Tomato Analyzer software program. J. Amer. Soc. Hort. Sci. 2009, 134, 77–87. [Google Scholar]
  28. Doyle, J.J.; Doyle, J.L. A rapid DNA isolation procedure for small quantities of fresh leaf tissue. Phytochem. Bull. 1987, 19, 11–15. [Google Scholar]
  29. Nei, M.; Tajima, F.; Tateno, Y. Accuracy of estimated phylogenetic trees from molecular data. II. Gene frequency data. J. Mol. Evol. 1983, 91, 153–170. [Google Scholar]
  30. Sneath, P.H.A.; Sokal, R.R. Numerical Taxonomy; W.H. Freeman: San Francisco, CA, USA, 1973. [Google Scholar]
  31. Van de Peer, Y.; De Wachter, Y. TREECON for Windows: a software package for the construction and drawing of evolutionary trees for the Microsoft Windows environment. Comput. Applic. Biosci. 1994, 10, 569–570. [Google Scholar]
  32. Lioi, L. Geographical variation of phaseolin patterns in an Old World collection of Phaseolus vulgaris. Seed Sci. Technol. 1989, 17, 317–324. [Google Scholar]
  33. Limongelli, G.; Laghetti, G.; Perrino, P.; Piergiovanni, A.R. Variation of seed storage proteins in landraces of common bean (Phaseolus vulgaris L.) from Basilicata, Southern Italy. Euphytica 1995, 92, 393–399. [Google Scholar] [CrossRef]
  34. Singh, S.P.; Gepts, P.; Debouck, D.G. Races of common bean (Phaseolus vulgaris, Fabaceae). Econ. Bot. 1991, 45, 379–396. [Google Scholar] [CrossRef]
  35. Piergiovanni, A.R.; Lioi, L. La conservazione on-farm: importanza della caratterizzazione e valutazione degli agro-ecotipi di fagiolo. Agroindustria 2007, 6, 29–36. [Google Scholar]
  36. Venora, G.; Grillo, O.; Ravalli, C.; Cremonini, R. Identification of Italian landraces of bean (Phaseolus vulgaris L.) using an image analysis system. Sci. Horticult. 2009, 121, 410–418. [Google Scholar] [CrossRef]

Appendices

Appendix 1. Degenerate and non-degenerate ISSR primers used in the analyses, their sequence and annealing temperature (Ta) used in the amplification.
Primer typePrimer codePrimer sequenceTa (°C)
Degenerate*ISSR 1(GACA)3 RG42
ISSR 2 (GACAC)242
ISSR 3(GA)8 RG42
ISSR 4YR (GACA)342
ISSR 5(ACTG)3 RG42
ISSR 6(GACA)3 RT42
ISSR 7(AG)8 YG56
ISSR 8(CA)8 RY56
ISSR 9(AC)8 YA56
ISSR10(GA)8 YT56
ISSR11(GT)8 YC56
ISSR12BDB (CA)756
Non-degenerateISSR 15GTGC(AC)756
ISSR 16GGGC(AC)756
ISSR 17CAGC(CT)756
ISSR 19CCTGC(AC)756
ISSR 32(AGC)4C56
ISSR 35(AGC)4GA56
ISSR 38(AGC)4AT56
ISSR 39(AGC)4AC56
ISSR 50CCA(GCT)456
ISSR 51GCACC(CA)956
ISSR 52GGCAC(CA)956
ISSR 53CGCAA(CA )956
ISSR 54GGCTA(CA)956
ISSR 55CCATC(CA)956
ISSR 56GCTAC(CA)956
ISSR 58CGAAC(CA)956
ISSR 59GGCCA(GCT)656
ISSR 60GCCAC(GCT)656
* R = A + G; Y = C + T; D = G + A; B = G + T + C
Appendix 2. Mean values and scores registered for five continuous and seven discrete variables in 15 accessions of bean landraces plus the CV Clio. Means are reported for date of flowering (FLO), of fruit setting (SET) and of harvesting (HAR), type of plant growth (HAB), flower standard color (FCO), pod length (PLE) and width (PWI), pod beak position (PBP), pod beak shape (PBS), degree of pod curvature (PCU), ripe pod color (PCO), seed color (SCO) and seed type (STY). Accession codes are described in Table 1 and variable scores reported in Section 2.1. das, days after sowing.
Accession codeFLO* SET*HAR*PLE*PWI*FCOPBPPBSPCUPCOSCOSTY
(das)(das)(das)(cm)(cm)
BA 483ab93a150a11.4b1.2d1113342
BA 789a92a150a12.3b1.5bcd1113532
BA 681ab85ab150a13.9b1.7abc1121422
CA87ab93a150a10.9b1.6bcd1132332
ZV87ab93a150a13.1b1.7abc2113442
MO85ab92a140ab13.3b1.7abc1113332
MA66cd71bc129b11.8b1.4cd2113163
MU59d64cd129b14b1.7abc1221432
TU62d68cd150a11.5b1.5d1122252
PA76bc79ab140ab13.3b1.5bcd1111132
PH64cd80ab150a11.5b1.5bcd1132411
AN855d64cd93c17.3a1.5bcd2132163
AN943e54d93c10.7b1.7abc2113363
AN2355d64cd93c10.9b2a2122463
AN3959d65cd93c11b1.4cd1112122
CL43e54c93c13.8b1.4cd3212163
* Means followed by the same lowercase letter in the same column are not significantly different for P ≤ 0.05.
Appendix 3. UPGMA dendrogram based on Nei et al. [22] matrix following ISSR analysis (93 polymorphic amplification products) of 13 bean genotypes representing 10 accessions. Numbers at the nodes represent bootstrap values after 500 replicates, whereas lowercase letters combined to accession codes indicate different plants of the same accession.
Diversity 02 00701 g003

