Article

DNA Markers and FCSS Analyses Shed Light on the Genetic Diversity and Reproductive Strategy of Jatropha curcas L.

1
Laboratory of Plant Genetics and Genomics, College of Agriculture, University of Padova, Campus of Agripolis, Viale dell’Università 16, 35020 Legnaro, Padova, Italy
2
Geneticlab Srl, Via Corte Ferrighi 16/B, 36025 Noventa Vicentina, Vicenza, Italy
3
ENEA, CR Casaccia, BIOTEC Section of Plant Genetics and Genomics, Via Anguillarese 301, 00123 Roma, Italy
4
Apomixis Research Group, Leibniz Institut für Pflanzengenetik und Kulturpflanzenforschung (IPK), Corrensstrasse 3, D-06466 Gatersleben, Germany
*
Author to whom correspondence should be addressed.
Diversity 2010, 2(5), 810-836; https://doi.org/10.3390/d2050810
Submission received: 1 March 2010 / Revised: 5 April 2010 / Accepted: 7 May 2010 / Published: 25 May 2010
(This article belongs to the Special Issue Biological Diversity Assessed by Molecular Methods)

Abstract

:
Jatropha curcas L. (2n = 2x = 22) is becoming a popular non-food oleaginous crop in several developed countries due to its proposed value in the biopharmaceutical industry. Despite the potentials of its oil-rich seeds as a renewable source of biodiesel and an interest in large-scale cultivation, relatively little is known with respect to plant reproduction strategies and population dynamics. Here, genomic DNA markers and FCSS analyses were performed to gain insights into ploidy variation and heterozygosity levels of multiple accessions, and genomic relationships among commercial varieties of Jatropha grown in different geographical areas. The determination of ploidy and the differentiation of either pseudogamous or autonomous apomixis from sexuality were based on the seed DNA contents of embryo and endosperm. The presence of only a high 2C embryo peak and a smaller 3C endosperm peak (ratio 2:3) is consistent with an obligate sexual reproductive system. Because of the lack of either 4C or 5C endosperm DNA estimates, the occurrence of gametophytic apomixis seems unlikely in this species but adventitious embryony cannot be ruled out. The investigation of genetic variation within and between cultivated populations was carried out using dominant RAPD and Inter-SSR markers, and codominant SSR markers. Nei’s genetic diversity, corresponding to the expected heterozygosity, was equal to He = 0.3491 and the fixation index as low as Fst = 0.2042. The main finding is that seeds commercialized worldwide include a few closely related genotypes, which are not representative of the original Mexican gene pool, revealing high degrees of homozygosity for single varieties and very low genetic diversity between varieties.

1. Introduction

Jatropha curcas L. is a mainly diploid (2n = 22) tropical shrub plant belonging to the Euphorbiaceae family, with a relatively small genome of approximately 370 Mb [1]. The species is native to Central and South America, but is now widely present throughout Central America, Africa and Asia. It is becoming a popular non-food oleaginous crop in several developed countries for its proposed value in the biopharmaceutical and biopesticides industry [2]. The short gestation period, easy adaptation to different kinds of marginal lands, even under harsh climatic conditions, relatively high drought- and pest-tolerance, and avoidance by herbivores, make this plant species attractive for cultivation. Its seeds contain up to 40% oil that can be converted into biodiesel by transesterification [3,4,5,6]. Nevertheless, it is worth noting that advanced agronomic practices seem to be necessary under a plantation crop regime, being water inputs, fertilizers and pesticides crucial to maximize seed yields [7].
Despite the potentials of its oil-rich seeds as a renewable source of fuel for diesel engines and the interest towards large-scale plantation systems, basic biological information is scanty [8]. For instance, reproduction strategies and population dynamics are poorly understood. The extent of genetic variation within local ecotypes, as well as genetic differentiation between commercial varieties, remains uncharacterized [9,10]. On the basis of available information, the vast majority of seeds should be set through sexuality, mainly by outcrossing, also even though selfing. In addition, apomixis (i.e., asexual propagation through seeds [11]) has also been reported, but is not well documented [12,13].
In the last years, a few genetic characterization studies using molecular markers have been conducted for J. curcas germplasm (for reference details, see recently published papers [9,14,15]). Some earlier investigations revealed relatively high estimates of polymorphism either within or between populations using RAPD and Inter-SSR markers alone [16,17] or in combination with SSR markers [18]. By contrast, an exceptionally broad genetic similarity along with phenotypic diversity in J. curcas germplasm was found using RAPD and AFLP markers [14]. More recently, a tight clustering of J. curcas worldwide accessions, with the exception of Mexican ecotypes, was reported on the basis of RAPD and Inter-SSR markers [9].
The most important finding remains the occurrence of high genetic diversity within autochthonous germplasm from Central America (e.g., Mexico) and low genetic polymorphism between accessions derived from cultivated plantations of African and Asian regions, both in terms of phorbol ester levels and molecular genetic fingerprints [9]. Low genetic variation in a crop typically implies a population bottleneck or a high level of human-mediated selection, but it may also reveal lack of evolution in the corresponding species (for review, see [19]). An evolutionary event like a genetic bottleneck may have prevented from reproducing a significant proportion of J. curcas populations, leading over time to a gain of homogeneity. In fact, population bottlenecks are also known to markedly accentuate inbreeding at the species level due to the narrowed pool of genes and reduced combination of genotypes. Moreover, recurrent morphological selection programs may have decreased genetic diversity in J. curcas beyond that caused by bottlenecks [19]. As a matter of fact, J. curcas has never been bred for productivity and/or quality traits, and all commercial varieties were derived via phenotype-based selections from local germplasm and propagated by vegetative cuttings. As a consequence, limited genetic variation of J. curcas populations outside the center of origin is likely, due to infrequent introductions without further augmentation of the crop, predominant vegetative propagation or occurrence of asexual reproduction (i.e., apomixis).
Despite the pronounced phenotypic variability shown by plants and seeds among accessions of different geographical origin [20], a number of contrasting results in terms of heterozygosity have been reported, ranging from very high [18] to moderately low [9], as estimated on the basis of co-dominant SSR markers. Additional studies are thus required to shed light on DNA polymorphism levels both within local ecotypes and between commercial varieties; crucial information for genetic conservation and selection programs in this species. In addition, sub-optimal agronomic practices, along with a low number of cloned genes and its uncharacterized genome, make J. curcas a species where major research initiatives in agronomy and biotechnology are required with the aim of breeding new genetically improved varieties [21]. For instance, the adoption of transgenesis for the improvement of biofuel crops, including J. curcas, was recently recommended [22], while the exploitation of interspecific crosses among closely related Jatropha species was postulated as a strategy for the development of new varieties [14].
Traditional methods based on morphology for understanding genetic variation within and among accessions are largely unsuccessful in J. curcas due to the strong influence of agronomic factors and environmental conditions on seed and plant traits. This study deals with the combined use of genomic DNA markers and flow cytometric seed screen (FCSS [23]) analyses to gain new insights into the population genetics and reproduction systems of Jatropha spp. Particular attention was given to the evaluation of ploidy levels and heterozygosity degrees of single accessions, and genomic relationships among commercial varieties grown in different countries and continents, and the Mexican landraces by means of co-dominant SSR marker analysis.

2. Materials and Methods

2.1. Plant Materials

Most of the commercial varieties of J. curcas investigated in the present work were purchased from private companies (Table 1).
About 2,500 seeds belonging to a total of 17 varieties, known to be cultivated in different geographical areas, were gathered (Table 1). Concerning the geographical distribution of accession groups, five distinct varieties were collected in Africa (Togo, Mali and Tanzania), nine varieties were obtained from Eastern Asia (India, Sri Lanka) and three varieties were collected in Southern America (Brazil and Argentina). Central America (Mexico) was represented by nine accessions belonging to two ecotypes locally dominant on the Pacific Ocean coast of Jalisco State (Table 1).
Table 1. The main information on J. curcas germplasm characterized by means of flow cytometric and molecular marker analyses.
Accession Id.Geographical originVarietySeedsPlants
JcCLOAmerica/MexicoCruz de Loredo11004
JcHDEAmerica/MexicoPlayon de Mismaloya1105
JcBRAAmerica/Braziln.s.2305
JcSAMAmerica/Braziln.s.2101
JcLOLAmerica/South AmericaLola20020
JcTOGAfrica/Togon.s.2297
JcENGAfrica/Tanzanian.s.215027
JcBERAfrica/Western AfricaBerenice20022
JcESMAfrica/Western AfricaEsmeralda20018
JcKARAfrica/Western AfricaKarima20010
JcSLKAsia/Sri LankaAnil23020
JcPETAsia/South-East AsiaPetra2007
JcSELAsia/South-East AsiaSelene20019
JcJOR3Asia/Jordann.s.21005
JcCHHAsia/India (Chhattisgarh)Chhattisgarh20010
JcUDAAsia/India (Radjesthan)Udaipur605
JcKAKAsia/India (Andhra Pradesh)Kakinada2004
JcTUTAsia/India (Tamilnadu)Tuticorin605
JcCOIAsia/India (Tamilnadu )Coimbatore20010
Overall 2,579204
1 Refers to the name of the Mexican locality where the landrace was collected;2 The name of the commercial variety was not specified by the private company that provided seeds;3 Accessions not investigated by means of SSR markers but only for ploidy by means of FSSC analysis.
Each of the 19 J. curcas germplasm resources was represented by a minimum of one and up to 27 accessions (Table 1). All the 204 plants belonging to the J. curcas accession groups were investigated by means of RAPD and Inter-SSR fingerprints. With only one exception, three plants per J. curcas accession group were then used for SSR marker analysis, for a total of 55 plants. Individual DNA samples from J. platyphylla, J. standleyi and J. malacophylla plants, recently collected in the Pacific Coast of Jalisco State (Mexico), were used as outgroup reference standards.

2.2. Ploidy Estimation and Flow Cytometric Seed Screen (FCSS) Analysis of Reproductive Modes

A total of 190 seeds, with a sample size ranging from 1 to 25 per accession group, were used for assessing ploidy and inferring reproductive modes by means of flow cytometry.
Nuclei were isolated from 20–30 mg cotiledonary leaf tissue and 10–20 mg of endosperm by chopping with a sharp scalpel in a glass Petri dish containing 600 µL LB01 lysis buffer (15 mM Tris, 2 mM Na2EDTA, 80 mM KCl, 20 mM NaCl, 0.5 mM spermine, 15 mM mercaptoethanol, 0.1% Triton X-100, pH 7.4) supplemented with 100 mM citric acid [24]. Nuclei suspensions were filtered through a 36 µm nylon mesh and immediately stained with 2 µg/mL 4′,6-Diamidino-2-phenyindole (DAPI) for ploidy evaluation.
Ploidy evaluation was performed by flow cytometry (FCSS) using a Fluorescence Activated Cell Sorter FACS Vantage SE (Becton Dickinson, La Jolla, CA, USA) equipped with an argon ion laser emitting 200 mW at a wavelength of 351–363 nm. DAPI-stained nuclei were analyzed at a flow rate of 100 nuclei/sec using a 400 nm long pass filter and chicken red blood cell (CRBC) nuclei as external standard for instrumental calibration and fluorescence reference during measurements, CRBC 2C DNA content = 2.15 pg [25]. DNA fluorescence was acquired as maximum fluorescence intensity (pulse height) and time-related parameters (fluorescence pulse area and width). From three up to 25 independent experiments were carried out for each sample and data were analyzed by CellQuest Pro 4.2.1 acquisition and analysis software (Becton Dickinson, La Jolla, CA, USA).

2.3. Genomic DNA Isolation and DNA Marker Detection

Genomic DNA was isolated from 100 mg of fresh leaf tissue using the DNeasy Plant mini-kit (QIAGEN) following the recommendations of the manufacturer. The DNA pellets were washed twice with 70% ethanol, dried and resuspended in 100 µL of TE 0.1 ° Buffer (Tris-HCl 100 mM, EDTA 0.1 mM pH 8). The quality of DNA samples was assessed by electrophoresis on 0.8% (p/v) agarose gels, and its concentration was determined by optical density reading (DU650 spectrophotometer, Beckman) at 260 nm (1 O.D. = 50 µg/mL). The purity was calculated by the O.D.260/O.D.280 ratio and by O.D.210-O.D.310 pattern [26].
Preliminary analyses defined the optimum PCR conditions for molecular marker survey to select the most efficient primer (RAPD, ISSR) or primer combinations (SSR) to reveal molecular polymorphisms in J. curcas accessions.
For the detection of RAPD markers, PCR reactions were performed in a 25 µL total volume, including 10 mM Tris-HCl, 50 mM KCl, 1.5 mM MgCl2, 200 µM each of dCTP, dGTP, dATP and dTTP, 1.5 U of Taq DNA polymerase (GE Healthcare), 1 µM of a single primer and 20 ng genomic DNA [27]. Ten 10-mer primers from Operon Technologies Inc. were selected on the basis of the number and size of polymorphic bands generated, and reproducibility of banding patterns (Table 2). PCR reactions were performed in a 9700 Thermal Cycler (Applied Biosystems): the temperature profile consisted of an initial denaturation step of 5 min at 95 °C followed by 3 cycles of 2 min at 95 °C, 1 min at 35 °C, 2 min at 72 °C, then 35 cycles of 1 min at 95 °C, 1 min at 36 °C, 2 min at 72 °C, and a final step of 7 min at 72 °C.
Table 2. List of primers used to detect RAPD, Inter-SSR, and SSR molecular markers.
Primer nameSequence (5′-3′)Basic information
RAPD10-mer primerTa (°C)No. ampliconsSize range (bp)
OP-A1CAGGCCCTTC3614300–2,000
OP-A13CAGCACCCAC3616100–1,500
OP-E20AACGGTGACC369300–2,000
OP-G14GGATGAGACC368200–2,100
OP-M3GGGGGATGAG3616250–1,500
OP-M13GGTGGTCAAC3611200–1,700
OP-P2TCGGCACGAC3616170–2,500
OP-P6GTGGGCTGAC3613200–2,000
OP-Q2TCTGTCGGTC3618220–2,000
OP-R8CCCGTTGCCT3611200–1,650
Inter-SSRSSR-anchored primerTa (°C)No. ampliconsSize range (bp)
I-4(CA)8AC589300–1,200
I-15GTGC(AC)76012450–3,000
I-19CCTGC(AC)76110400–2,000
I-30(GT)6TG499450–2,000
I-32(AGC)4C596400–2,100
I-35(AGC)4GA5910480–2,800
SSRForward and Reverse primersTa (°C)RepeatExpected size (bp)
JcSSR1GCAAGAGCTCCACAGTAGAAGA55(AG)15168–187
CTACCAACTCTTTCCAGTCC
JcSSR2GCGCTAGAGATGCTGTTTTCT54(CT)13123–138
CACCACTCTGCAAATAGAAC
JcSSR3GACAATGTTAATCGAAGGAG55(GA)24164–195
GACGGGAAAATATATGGCTA
JcSSR4GTTTTCAGGATTGAATGCTCT55(AG)20178–198
CGCAATCCCATTTTTATTAT
JcSSR5GATGGGCTCTTTGTAGCTTTT56(CT)890
TTCATGCGACTAGAGCCTAC
JcSSR6GTCTATTGAGTGGTTGCATTG55(TG)23170–182
GCTTTCAATATATCATACGTGGT
JcSSR7TTATCAACCTATCATCCTCAT53(TG)18148–202
GCACAGAATCAAACTCAAG
JcSSR8ATTTAGCAGAACCCCAGAAC58(AC)17154–182
ATGTCTCTTTTCCATGTCCAA
JcSSR9TCAACCCACCCTCATATAAACC60(AC)10115
TACACACTTGCCCTGATTTCTG
JcSSR10TTCAGCCAGAATCTCAACAGT64(CT)16178–184
AGGAAGGATGGGAAGTGGGA
Inter-microsatellite markers were assayed by using six different I-SSR primers (synthesized by Life Technologies, Inc.) anchored at 3′ or 5′ terminus of the simple dinucleotide repeat and extended into the flanking sequence by one to four nucleotide residues (Table 2). The PCR protocol for the detection of Inter-SSR markers resembled one previously described for other species [28]: the reaction constituents were 10 mM Tris-HCl, 50 mM KCl, 1.5 mM MgCl2, 150 µM each of dNTPs, 1.5 U of Taq DNA polymerase (GE Healthcare), 1 µM of a single primer and 30 ng of genomic DNA, in a 25 µL total volume. PCR reactions were performed in a 9700 Thermal Cycler (Applied Biosystems) under cycling conditions resembling a touchdown profile: an initial denaturation step of 5 min at 95 °C was followed by 7 cycles of 30 secondat 95 °C, 30 secondat 59 °C and 30 secondat 72 °C. Then, the annealing temperature was reduced by 0.7 °C every cycle until a final annealing temperature of 54 °C was reached. The last cycle was repeated 26 times and terminated by a final step at 72 °C for 10 min.
Both RAPD and Inter-SSR amplicons were separated by electrophoresis in 2% agarose gels run with 1 × TBE buffer [26]. Dominant DNA fingerprints were evaluated by the 1D Image analysis software (Kodak) in order to find amplification products within single lanes and to reliably score qualitative polymorphisms among accessions for all primers.
Microsatellite (SSR) loci analysis was carried out following an already tested PCR protocol [29] with some changes to adapt it to J. curcas templates with the use of the 5′ M13-tailed primer method [30]. DNA fragments were visualized by capillary electrophoresis after amplification reactions performed with the universal M13 primer labeled with a 5′ HEX fluorophore. PCR experiments were conducted in a 20 µL total volume, including 10 mM Tris-HCl, 50 mM KCl, 1.5 mM MgCl2, 200 mM of each dNTP, 3 pmol of primer forward, 8 pmol of primer reverse, 6 pmol M13-labeled primer, 1 U Taq DNA polymerase (GE Healthcare) and 25 ng of genomic DNA as template. A total of 10 SSR loci were investigated in all genomic DNA samples. Six of the SSR loci (i.e., JcSSR1-JcSSR6) were assayed using primer pairs derived from a previously reported study [31], whereas the remaining four primer pairs were designed on SSR-containing sequences retrieved from the NCBI database (accession numbers EU099518; EU099528; EU099520; and EU099522). All primer combinations are reported in Table 2. Amplification reactions were performed in a 9700 Thermal Cycler (Applied Biosystems): the temperature profile consisted of an initial denaturation step of 5 min at 95 °C followed by 40 cycles of 30 second at 95 °C, 30 second at annealing temperature of 55–64 °C, and 30 second at 72 °C, followed in turn by 7 min at 72 °C and then held at 4 °C.
DNA fragment analysis was carried out using a fully automated capillary electrophoresis system (Applied Biosystems 3130) and SSR patterns were visualized and scored using the software PEAK SCANNER software version 1.0 (Applied Biosystems).

2.4. Genetic Diversity and Differentiation Statistics

Measures of genetic variability were used to estimate the levels of polymorphism within and between different J. curcas accessions.
For SSR markers, the average number of alleles observed per locus (no) was computed as the arithmetic mean over loci of the total number of alleles observed at each locus. The effective number of alleles per locus was computed as: ne = 1/Σpi2 where pi is the frequency of the ith allele [32]. This parameter is a measure of diversity and indicates the size of an ideal population in which, given the existing allele frequencies, all individuals are totally differentiated.
Genetic diversity statistics were used to summarize the data of the J. curcas SSR markers. For each marker locus and over all loci, the genetic diversity was computed as H = 1 − Σpi2 corresponding to the Nei’s expected heterozygosity [33]. This parameter ranges from 0 in case of monomorphic allele in all loci to 1 when alleles in equal frequencies occur over all polymorphic loci. Moreover, the phenotypic diversity of marker allele profiles was also estimated using the Shannon’s information index, computed as I = −Σpi2ln pi2 [34].
Gene flow estimates were derived from the fixation index as follows: Nm = 0.25(1 − Fst)/Fst. The result is independent of the population size because the force of gene flow, which is measured by the fraction of migrants in a population (denoted as m), is counteracted by the force of genetic drift, which is proportional to the inverse of the population size (N). Nm < 1 indicates a local differentiation of populations, while Nm > 1 when a little differentiation among populations occurs [35].
A hierarchical analysis of variance with estimation of F-statistics [36] was also performed. Estimates of heterozygosity within accession groups (Fis) and between accessions (Fit) were determined as well as the fixation index (Fst) according to Wright’s statistics [37]. The inbreeding coefficient Fis was computed also for single SSR loci to measure the deficiency (+values) or excess (−values) of heterozygotes at each locus and in all accession groups. The Fst parameter measures the genetic effect of total population subdivision as the proportional reduction in overall heterozygosity owing to variation in SSR allele frequencies among different accession groups. The Slatkin’s Rst [38] was also computed as it provides a convenient approach for estimating levels of genetic differentiation between populations on the basis of variance for marker allele frequencies. This coefficient, adapted to SSR loci by assuming a high-rate stepwise mutation model instead of a low-rate or infinite-allele mutation model, was calculated as follows: Rst = (St − Sw)/St, where Sw is the sum over all loci of twice the weighted mean of the within-population variances, and St is the sum over all loci of twice the variance of the combined populations [39].
Descriptive genetic diversity and differentiation statistics, as well as inbreeding coefficients at each locus and over all loci for each accession group and over all accessions, were conducted using the software POPGENE version 1.21 [40].
An ordination analysis was performed according to the unweighted pair-group arithmetic average method (UPGMA) clustering algorithm [41], and the dendrogram and centroids of all accessions were constructed from the symmetrical genetic similarity matrix. The simple matching (SM) coefficient was applied to calculate the proportion of genetic similarity between all pair-wise comparisons of accessions. The following formula was used: SMij = (p + n)/t, where p and t represent the number of marker alleles, respectively, present and absent in the pair of individuals i and j compared, and t is the total number of marker alleles scored in the population as a whole. The principal coordinate analysis technique [42] was then applied to compute the first two components out of the qualitative data matrix. The triangular matrix of genetic similarity estimates was double-centered and then bi-dimensionally plotted according to the extracted Eigen-vectors. The calculations and analyses were conducted using the appropriate routines of the software NTSYS version 1.80 [43].
The population structure was investigated using the Bayesian (model-based) clustering algorithm implemented in the STRUCTURE software [44,45], which identifies subgroups of individuals according to marker allele combination and distribution. This software was also exploited to assign each individual DNA sample of varieties and landraces, pre-defined according to the geographical origin, to the inferred clusters. All simulations were carried out assuming the admixture model, with no a priori population information. Analyses of SSR data were carried out with 500,000 iterations and 500,000 burn-ins, by assuming the allele frequencies among populations to be correlated [45]. Ten replicate runs were performed with each run, exploring a range of K spanning from 1 up to 16. Estimation of the most likely value of K was done using ΔK as reported in other studies [46].

3. Results

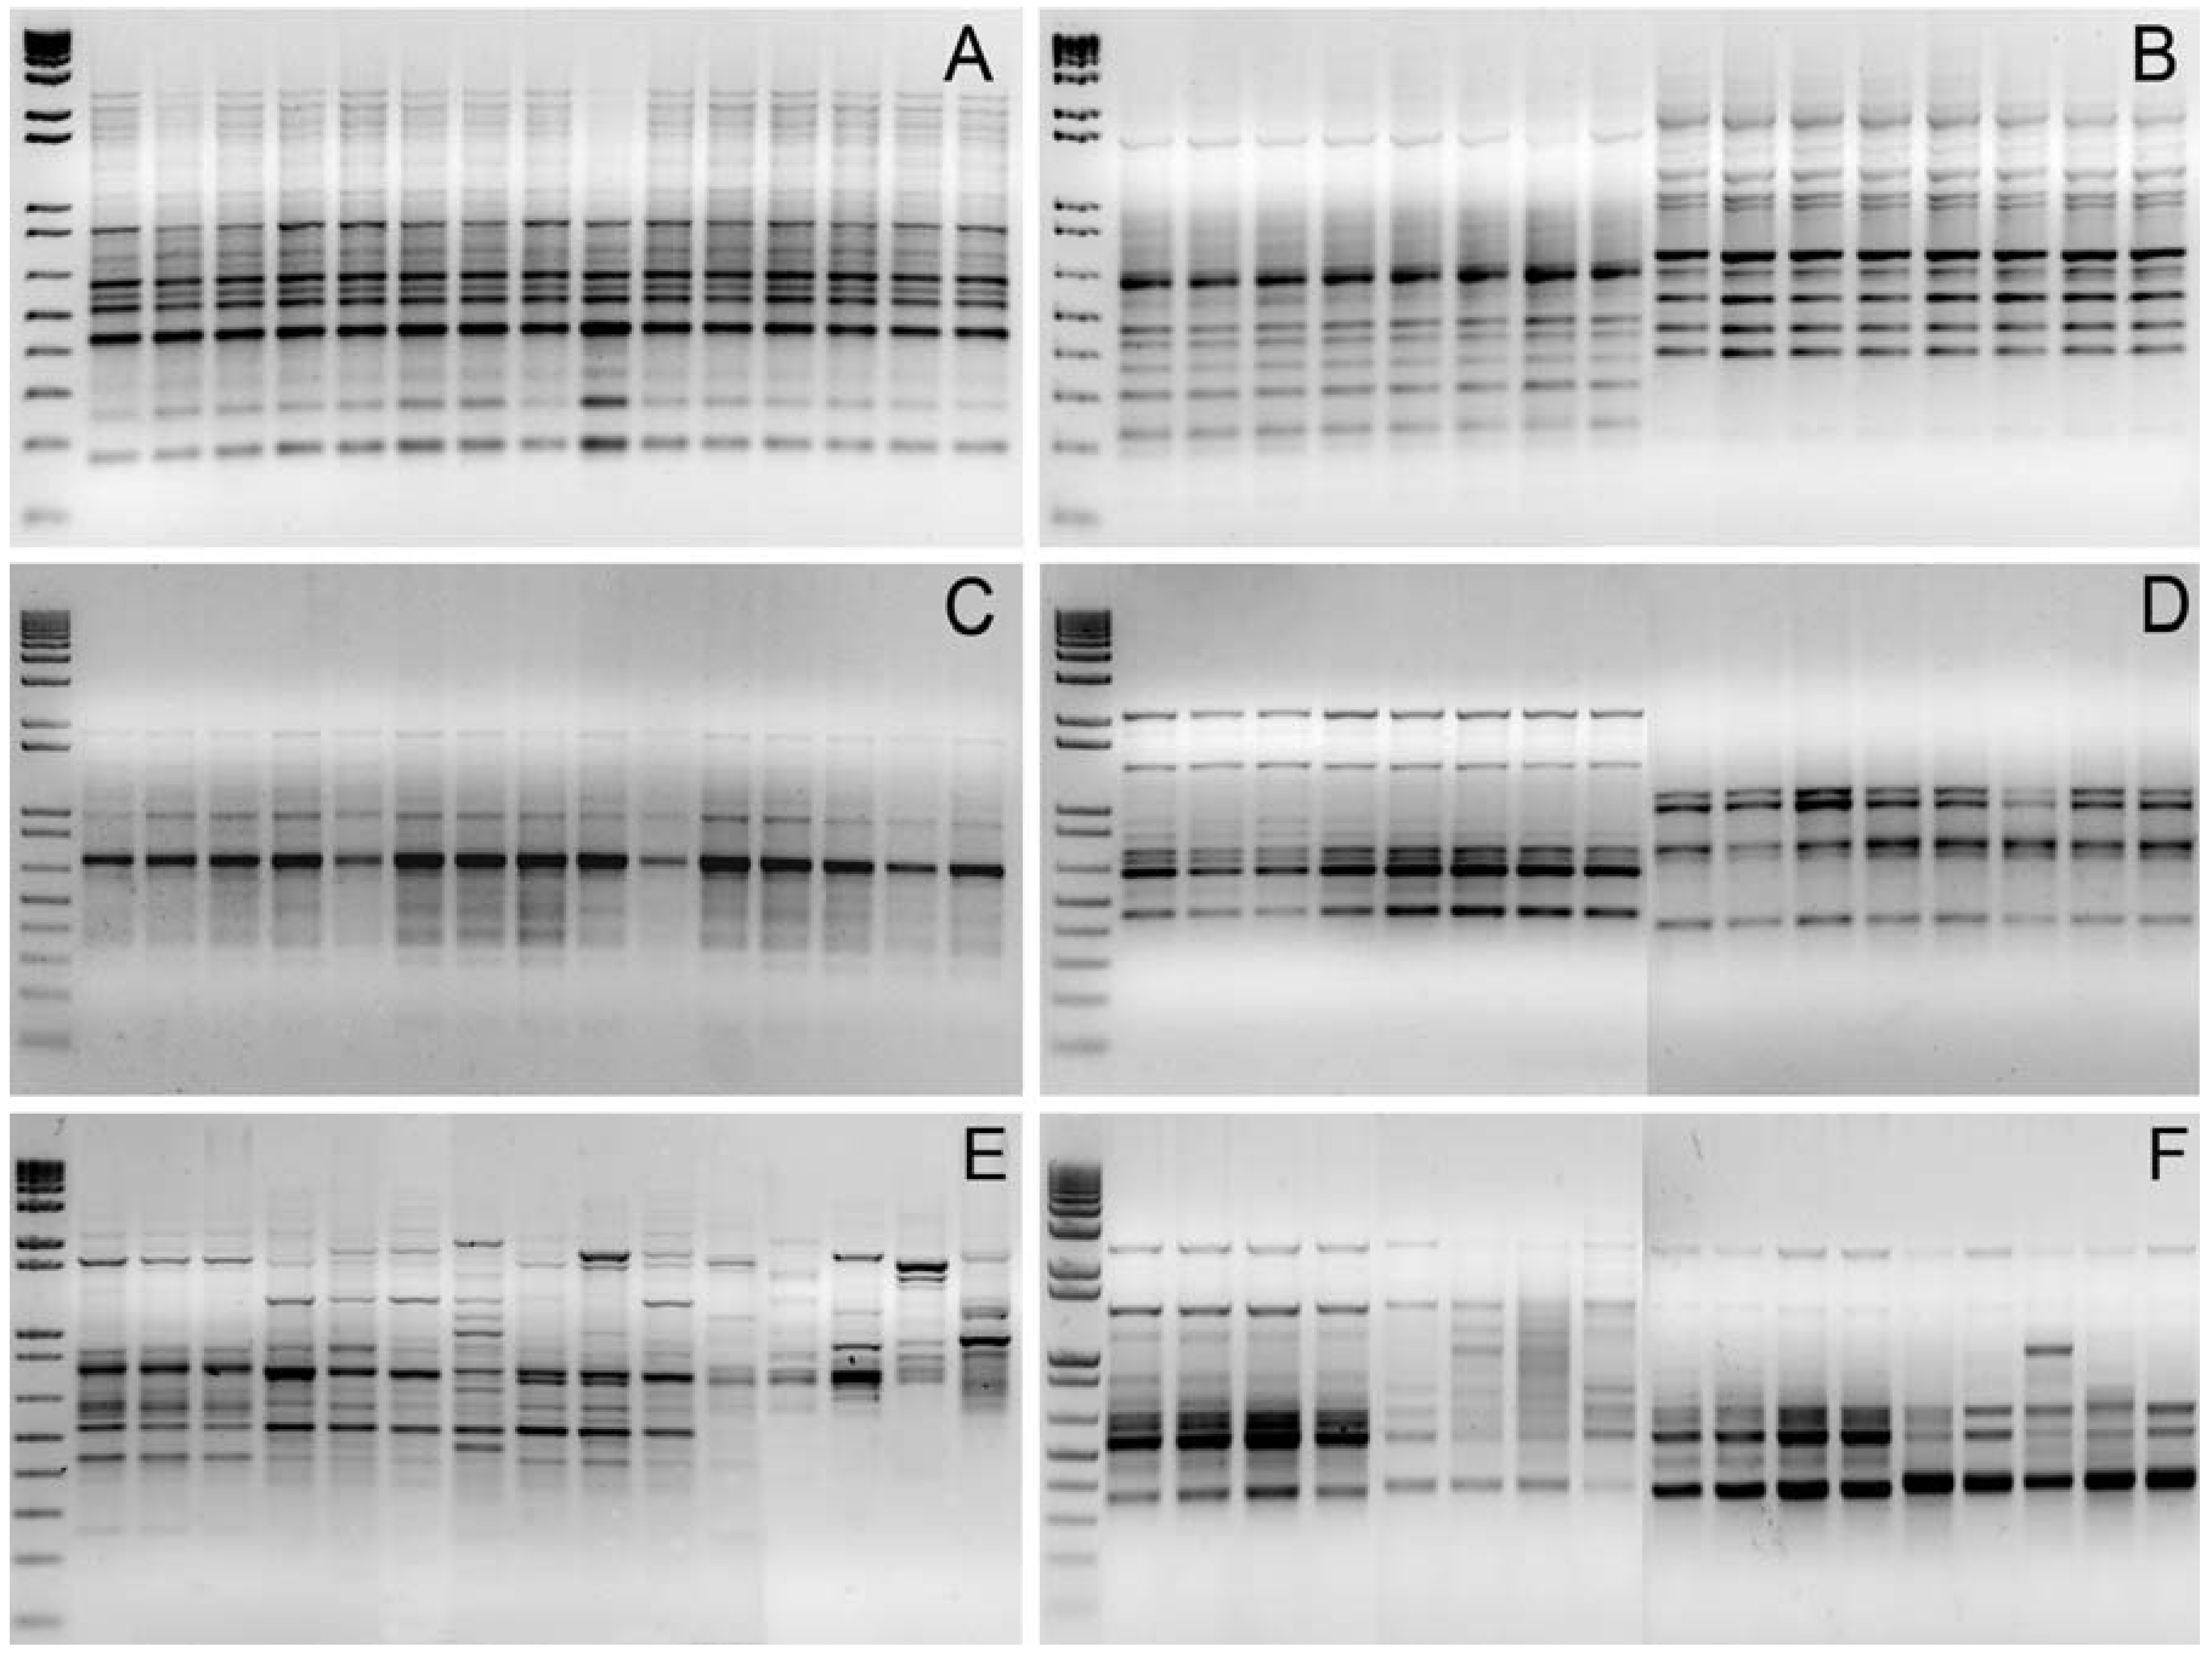
3.1. Genomic DNA Fingerprint Analysis By Means Of RAPD and Inter-SSR Markers

Genetic diversity and differentiation among J. curcas germplasm resources from different geographical areas were initially investigated using dominant RAPD and Inter-SSR markers, with primers selected during preliminary experiments on the basis of the total number of reproducible amplicons. A total of ten 10-mer primers and six SSR-anchored primers (see Table 2) were used to assay 142 and 61 genomic loci, respectively, with an average number of markers per DNA fingerprint equal to 13 and 9. Surprisingly, low genetic variability was documented not only within accession groups but also among accessions of different geographical origin, with the exception of Mexican landraces (Figure 1). In fact, no reliable polymorphism was detected within or between commercial varieties: RAPD and Inter-SSR fingerprints visualized by conventional agarose gel electrophoresis were 100% monomorphic (see Figure 1, panels A-D). As few as nine and five polymorphic loci out of 203 assayed in total (6.9%) were found among landrace individuals using RAPD and Inter-SSR markers, respectively, with the most informative primers being OP-P2 and I-19 (see Figure 1, panels E and F).

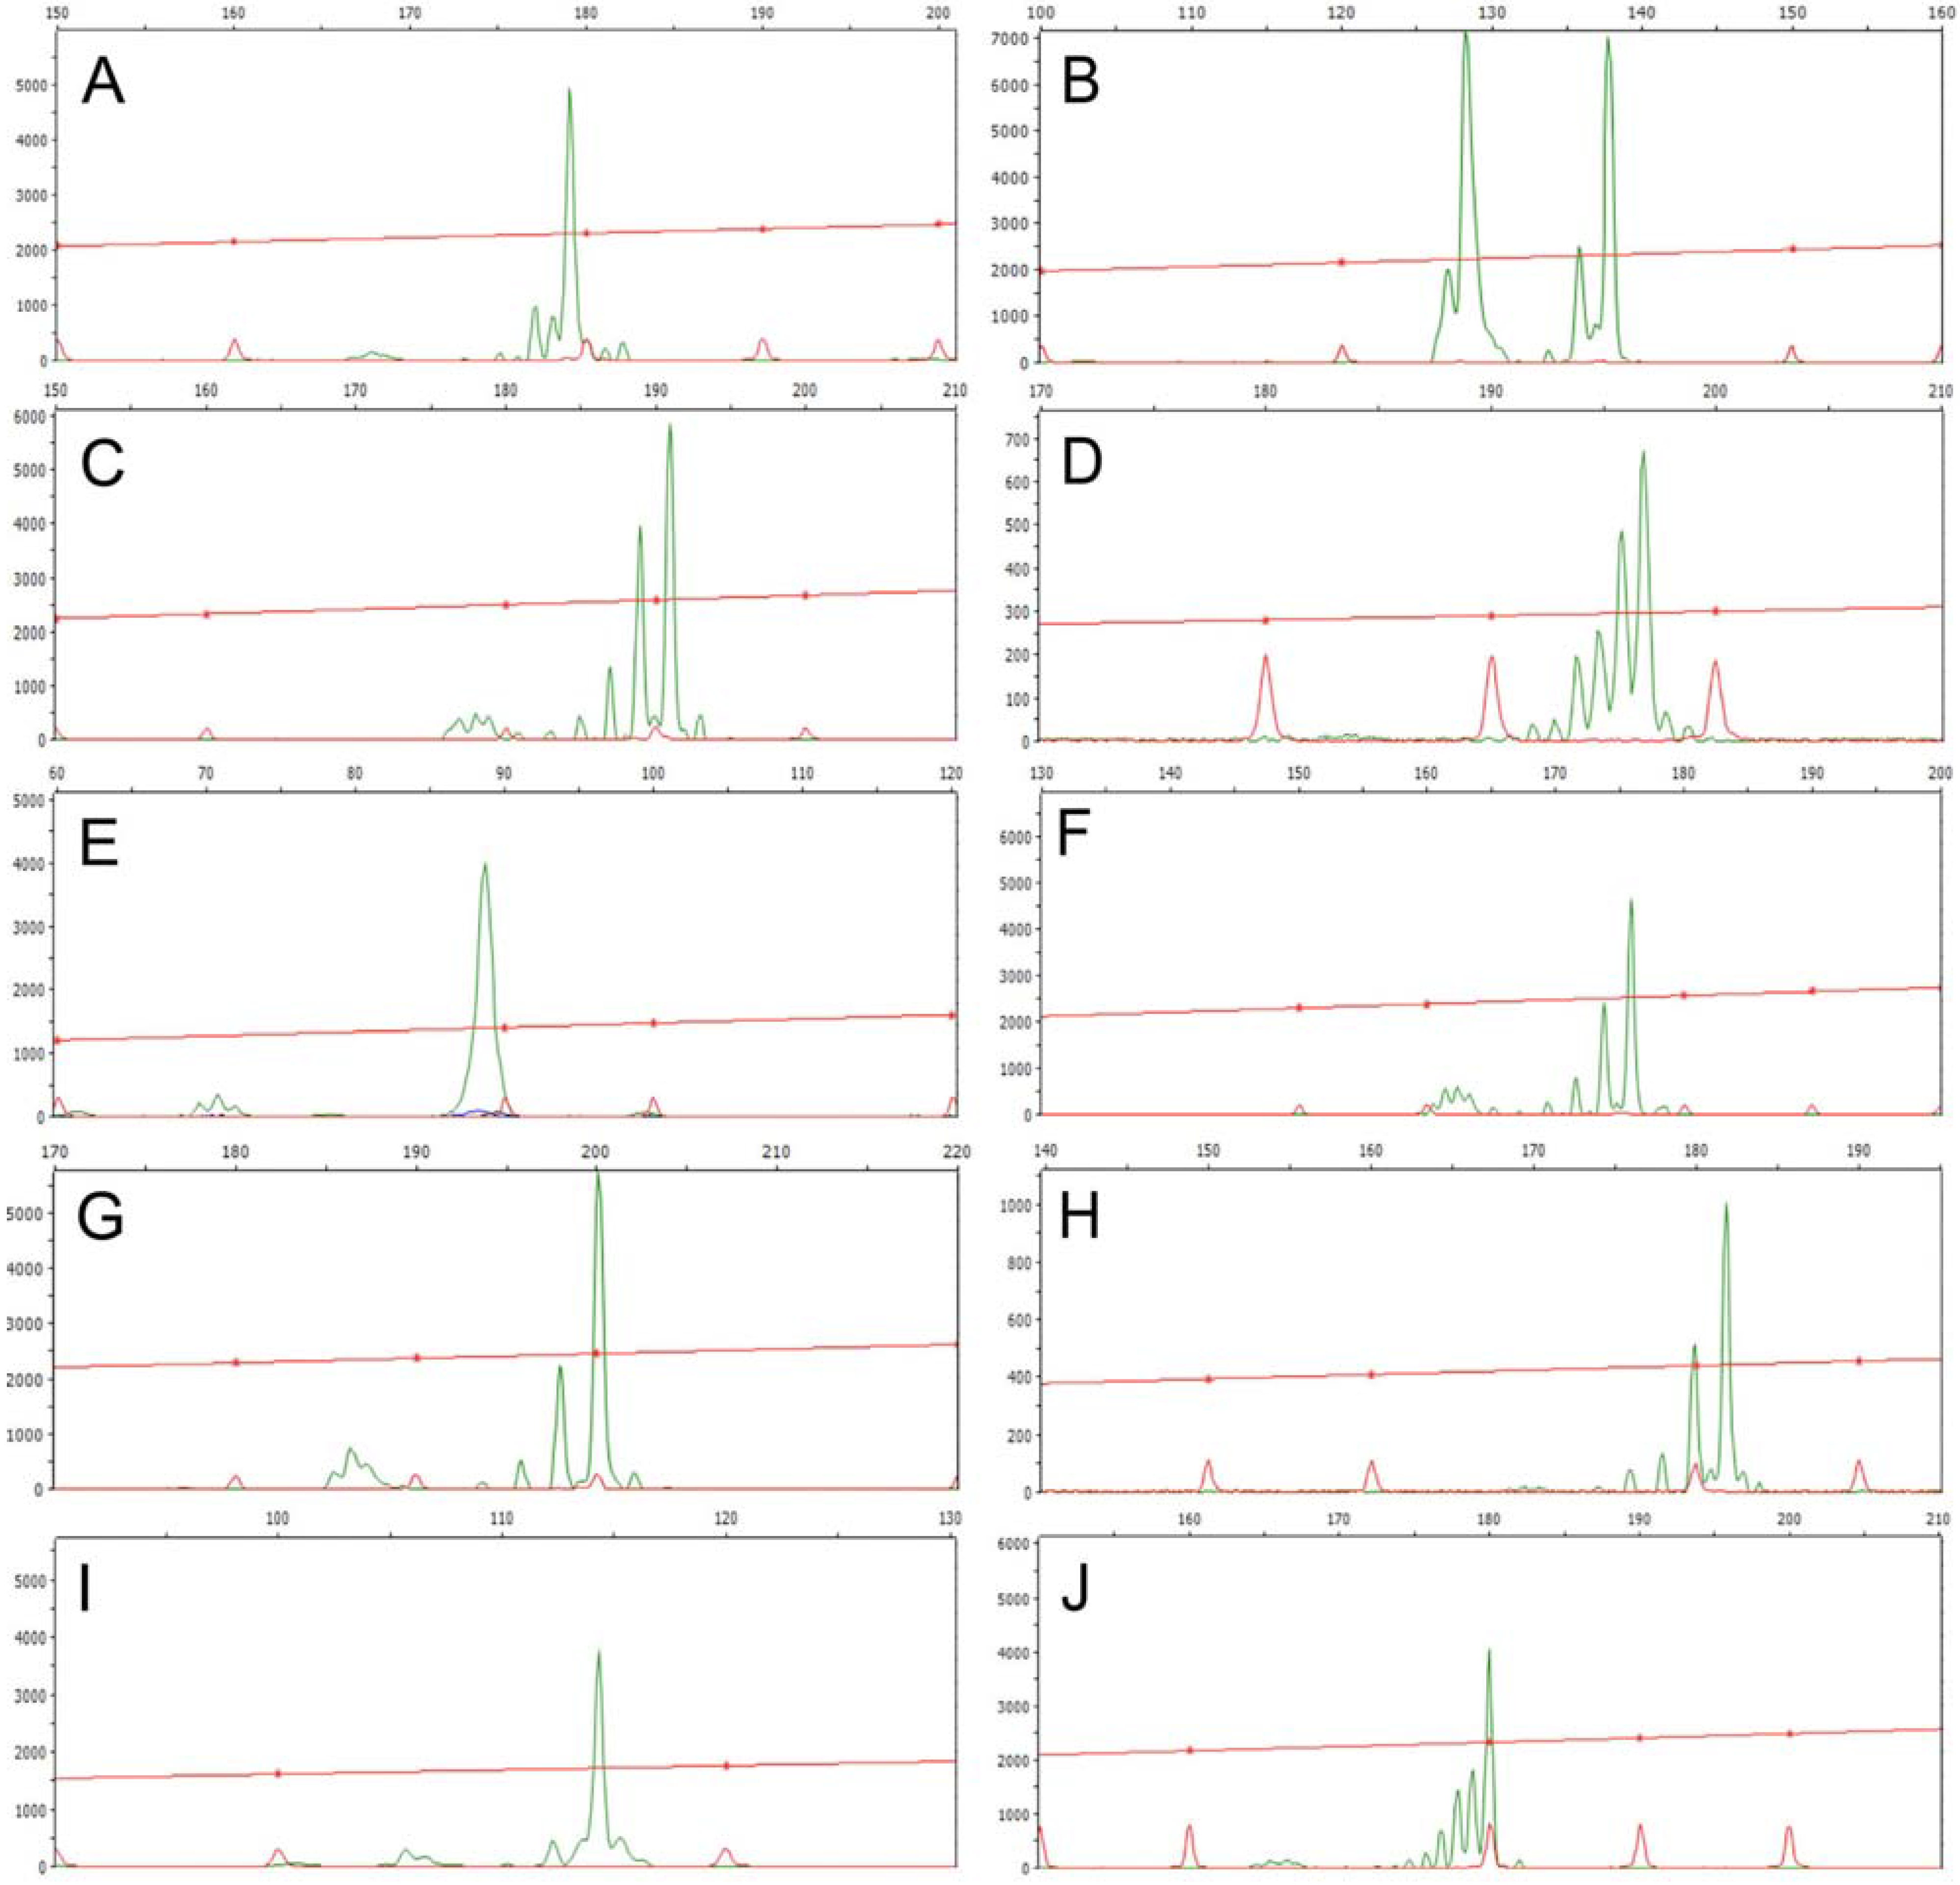
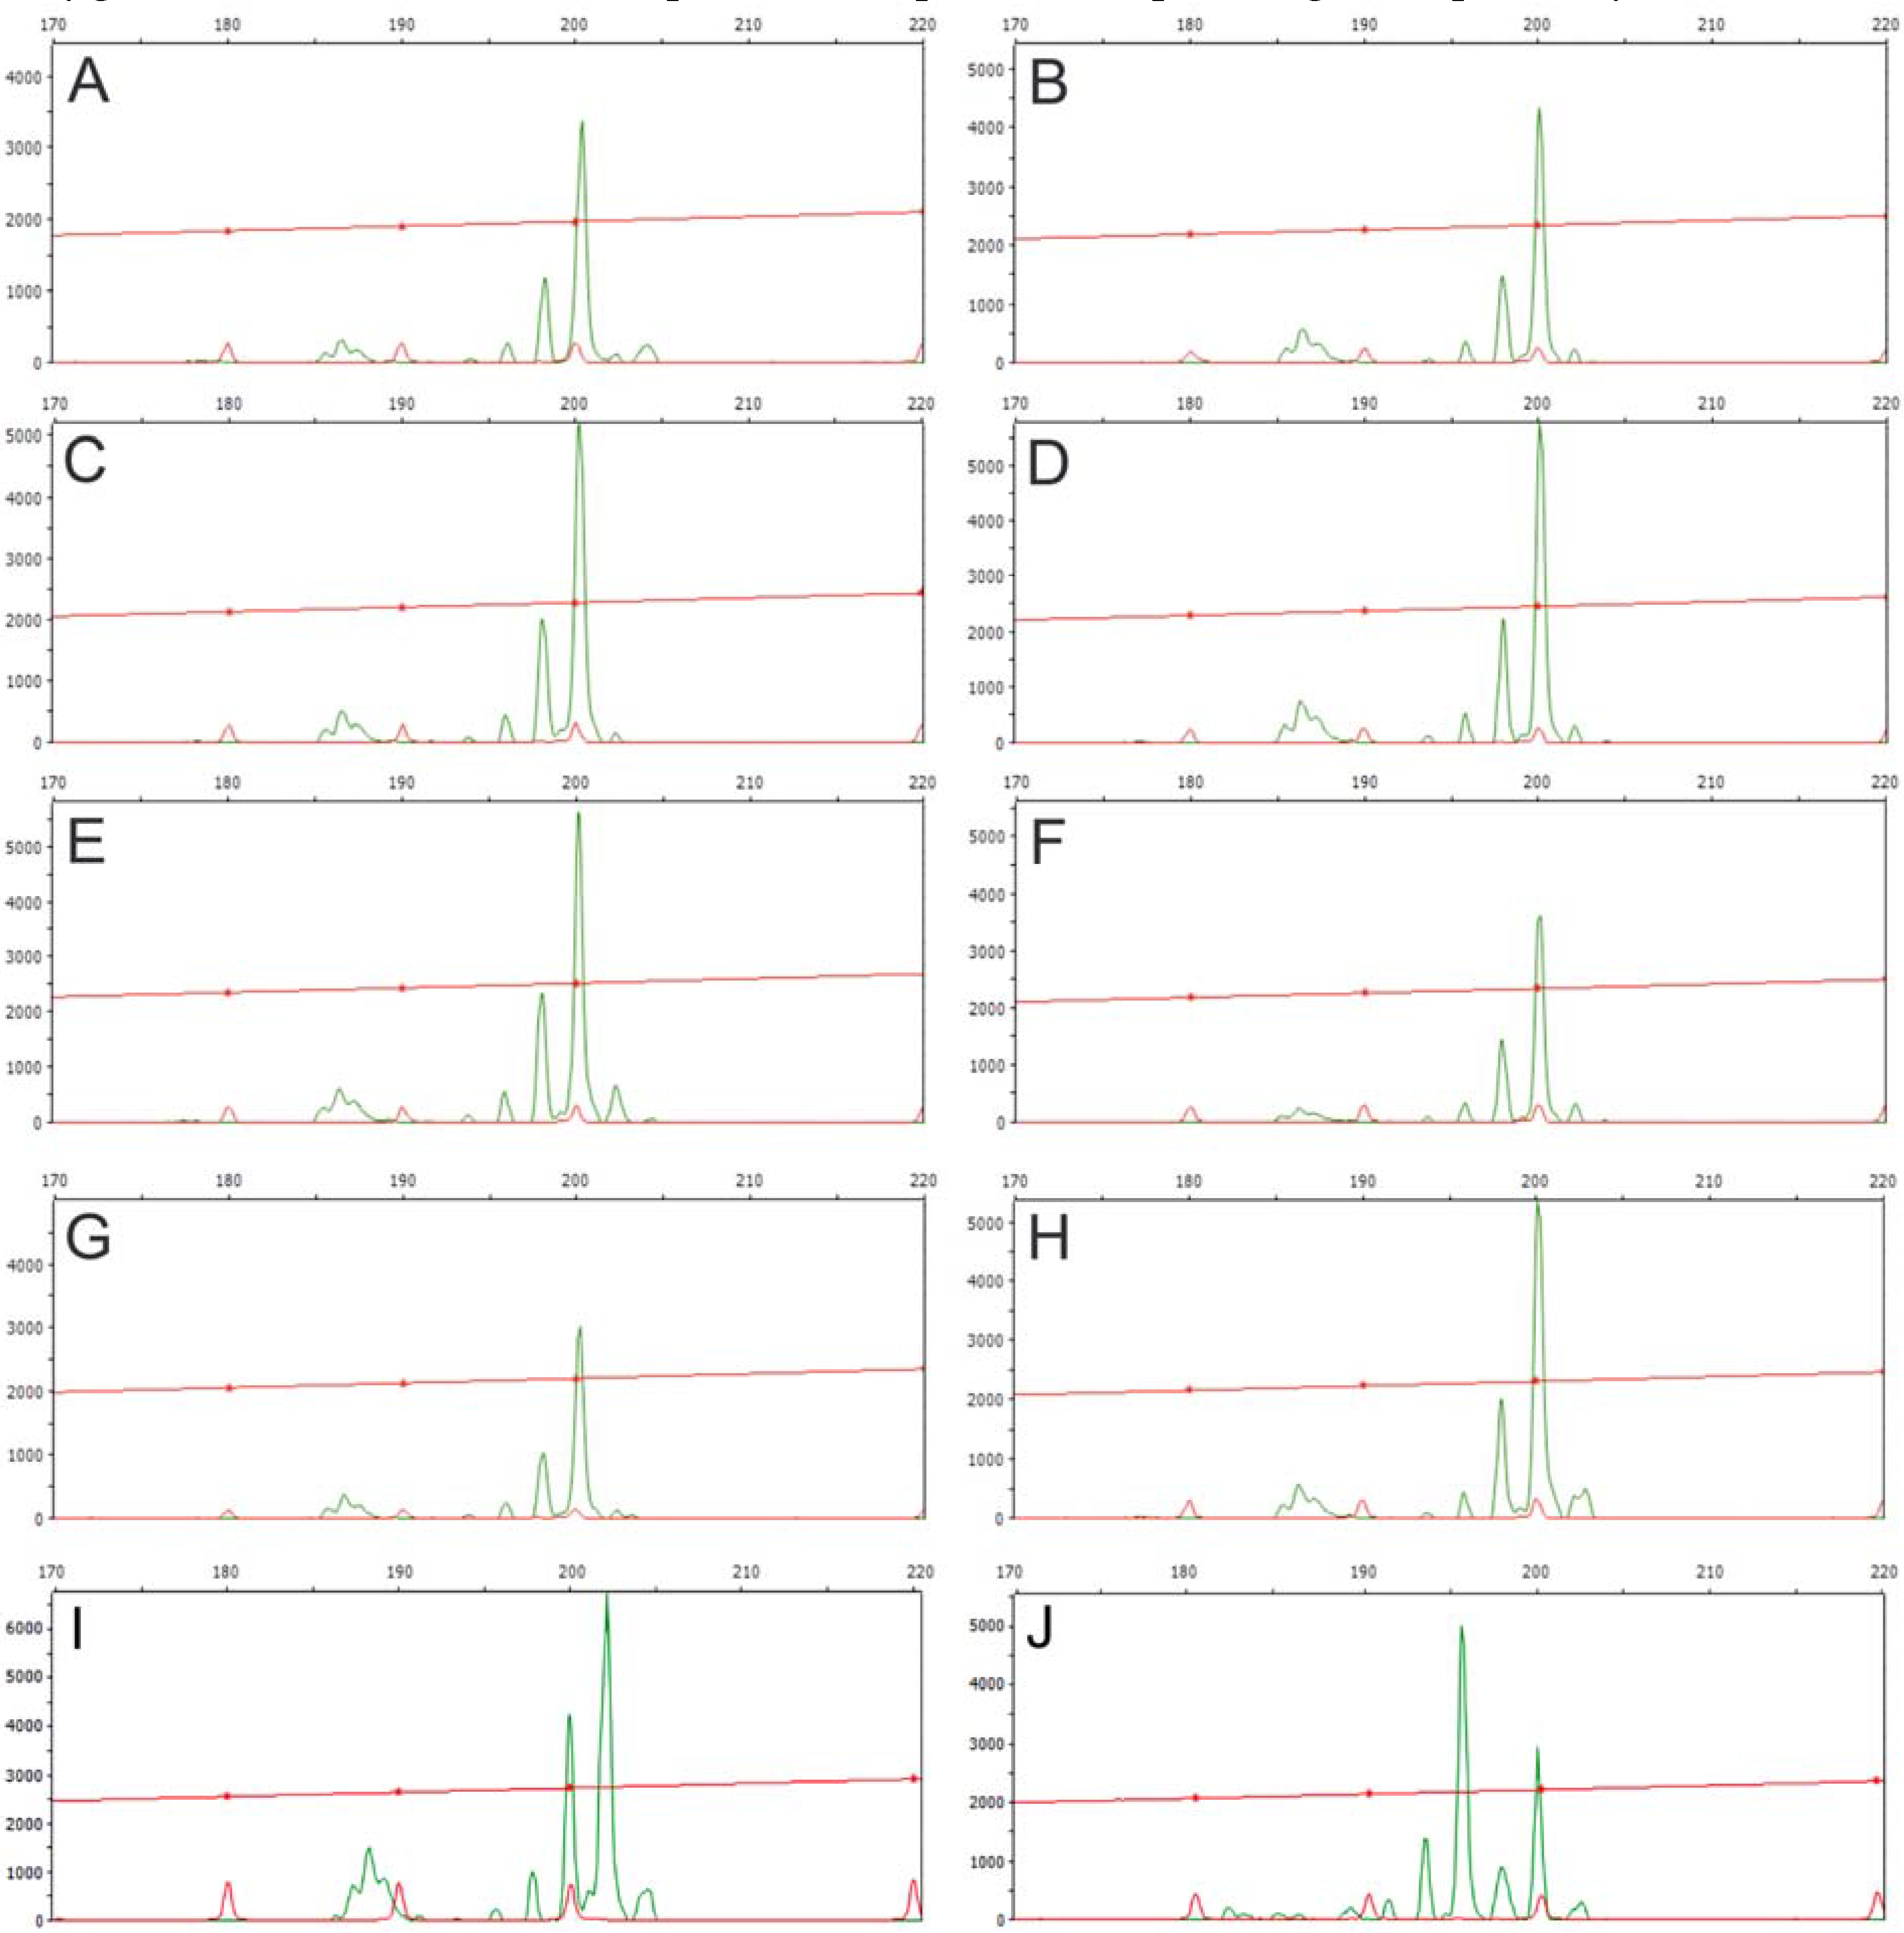
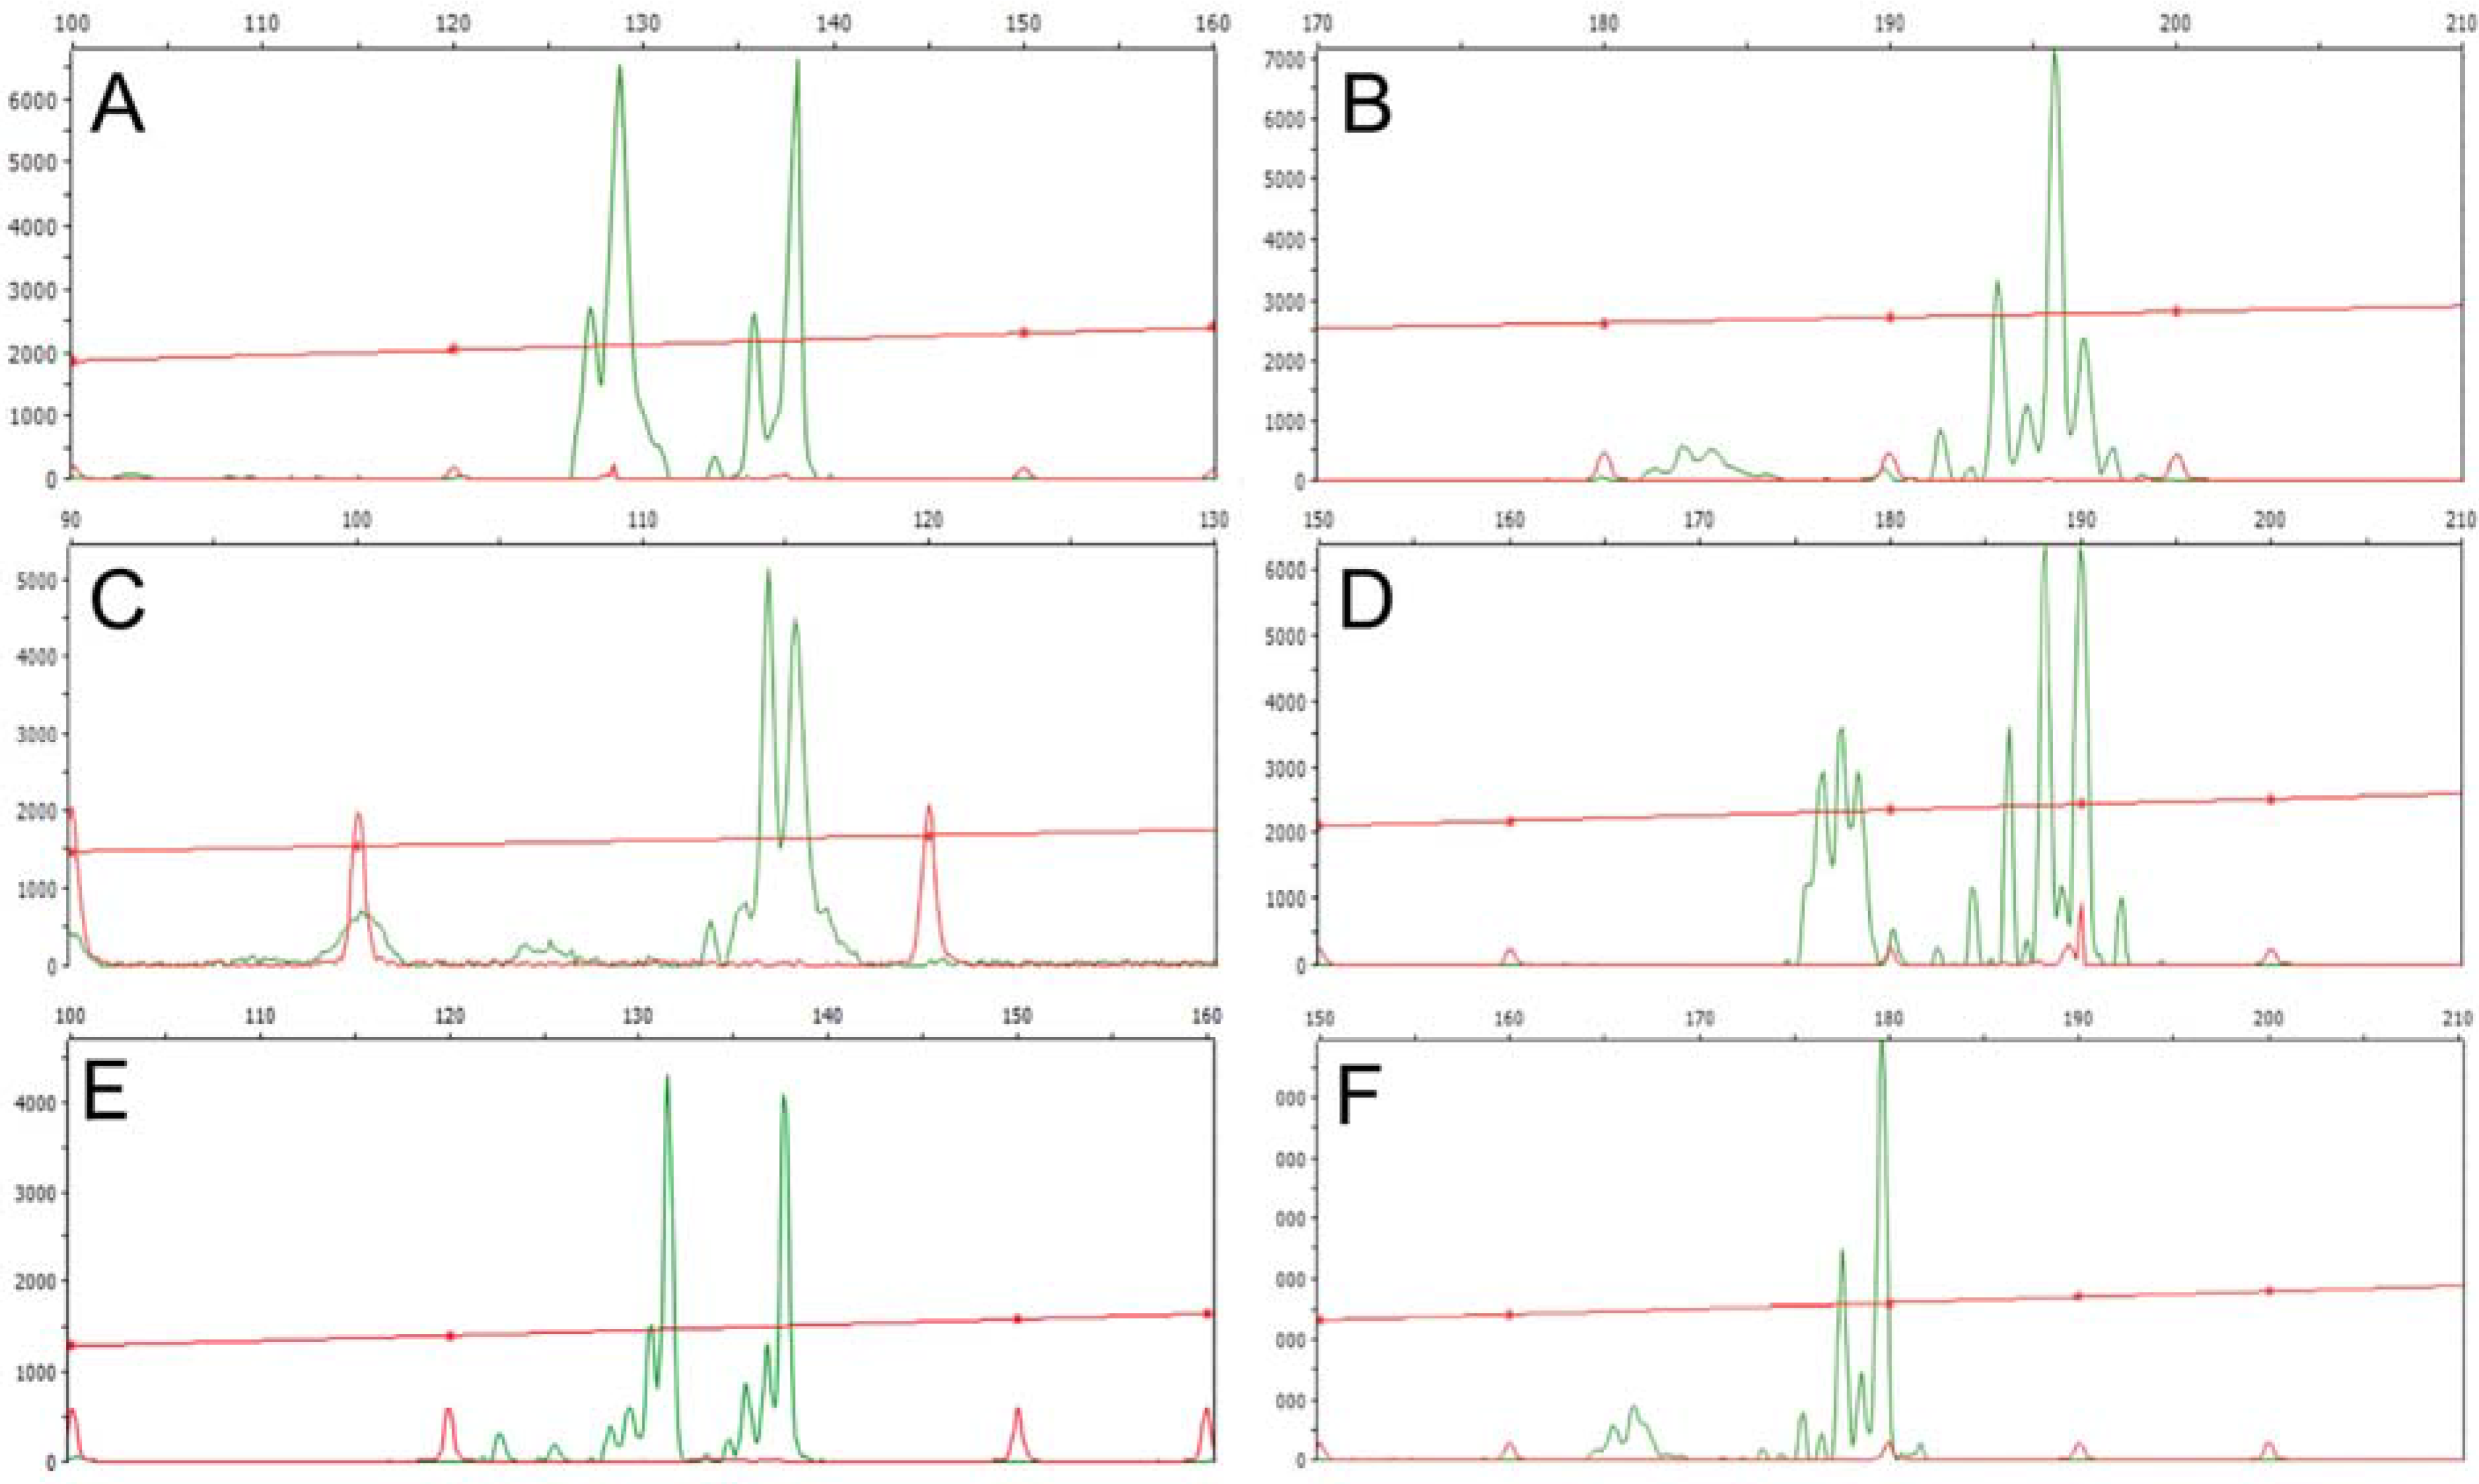
3.2. Genetic Diversity and Differentiation Statistics Based On SSR Markers

Genetic diversity of J. curcas accessions was further investigated using SSR markers with primer pairs designed in order to maximize their specificity and PCR reproducibility. A total of 10 microsatellite loci (see Table 2) were assayed using one to four individual DNA samples per locality/variety, for a total number of 53 plants belonging to American (7), African (15), Asian (22) varietal groups and Mexican landrace accessions (9). Moreover, one DNA sample each of J. malacophylla, J. standleyi and J. plathyphylla, adopted as outgroup standards, was successfully analyzed using heterologous primers. An overview of SSR markers as detected by DNA fragment analysis with a fully automated capillary electrophoresis system is given in Figure 2.
Figure 1. Genomic DNA fingerprints of J. curcas accessions. A, B: Examples of RAPD fingerprints generated using primer OP-P2 (A), and OP-M13 and OP-A1 (B): no polymorphism is detectable either within a population (A) nor between populations (B) of different geographical origin (A, South-East Asia; B, England vs. South-America and Sri Lanka vs. England). C, D: Inter-SSR fingerprints generated using the primer I-15 with genomic DNA templates of three individuals for each of the accession groups: JcSLK, JcBER, JcLOL, JcESM, JcENG (C). Inter-SSR fingerprints generated using primers I-4 (left) and I-19 (right) with genomic DNA templates of four individuals for each of the accession groups JcTOG and JcBRA (D). E, F: RAPD fingerprints generated using primer OP-P2 in three commercial varieties, nine Mexican accessions and three outgroups (E); Inter-SSR fingerprints generated with primer I-15 (left) and I-19 (right) using DNA templates belonging to four varieties and four Mexican accessions (F).
Diversity 02 00810 g001
Figure 2. Representative DNA fragment profiles displayed by each of the 10 analyzed microsatellite loci. A, JcSSR1; B, JcSSR2; C, JcSSR3; D, JcSSR4; E, JcSSR5; F, JcSSR6; G, JcSSR7; H, JcSSR8; I, JcSSR9; and J, JcSSR10 (for details on primers, see Table 2).
Diversity 02 00810 g002
Unexpectedly, the vast majority of these loci showed homozygosity or heterozygosity for the same microsatellite alleles across all accessions from Southern America and Africa: several examples of SSR stuttered patterns for homozygous loci are given in Appendix 1.
The Mexican accessions proved to be genetically differentiated from commercial varieties, showing eight polymorphic SSR loci out of 10 and a total of 29 marker alleles. It is worth mentioning that aspecific amplification products were occasionally recovered for some combinations of primer pairs and accession templates (data not shown).
Furthermore, most of the accessions from India revealed heterozygosity for different microsatellite alleles at some of the loci investigated (see Appendix 2).
The main descriptive statistics of J. curcas germplasm related to SSR markers were determined at single loci and over all accession groups. A total number of 38 marker alleles were detected across the 10 assayed SSR loci, with a mean frequency of the commonest marker allele equal to pi = 0.7372, ranging from 0.3962 to 1 (Table 3).
Table 3. Descriptive statistics of J. curcas germplasm related to SSR markers and accession groups. Sample size of marker alleles (S), frequency of the commonest marker allele (pi), observed number of alleles (no) and expected number of alleles (ne) per locus, and estimates of Shannon’s information index of phenotypic diversity (I) and Nei’s genetic diversity equivalent to the expected heterozygosity (H). The Wright’s inbreeding coefficient (Fis) is also given for single locus, geographical regions and over all accessions. The overall values and standard deviations are reported for each parameter.
Accession Id.SpinoneIHFis
JcSSR11060.896241.23720.42750.19170.7047
JcSSR21060.396243.24741.26560.6921−1.036
JcSSR31060.594362.50691.250.60110.4664
JcSSR41060.547262.72591.24070.63310.255
JcSSR5106111000
JcSSR61040.923141.17060.35120.14570.736
JcSSR7980.94931.10820.2270.09770.791
JcSSR81000.4742.33970.96120.5726−0.5718
JcSSR9104111000
JcSSR101040.596252.09690.89020.5231−0.3234
Mexico170.66112.92.06150.74850.42600.1138
South America140.785721.59490.44070.2663−0.1609
Africa300.83331.61.42410.31150.1978−0.4116
Asia430.7521.67890.4810.29990.0998
Mean1040.73723.81.84330.66130.3457−0.1438
St. Dev.-0.23731.75120.83560.51680.2819-
The observed and expected number of alleles per locus varied from 1 to 6.0000 and 3.2474, respectively, being on average equal to no = 3.8000 and to ne = 1.8433 (Table 3). For these parameters, Mexican accessions scored the highest values (no = 2.9000 and ne = 2.0615). The average estimate of the Shannon’s information index of phenotypic diversity for molecular profiles was I = 0.6613, whereas the mean Nei’s genetic diversity, equivalent to the expected heterozygosity, was as low as H = 0.3457 (Table 3). The estimates of genetic diversity among accessions grouped according to their geographical origin ranged from a minimum of 0.1978 to a maximum of 0.4260. In particular, little genetic variation was found either within or between commercial varieties deriving from different parts of the world, and most of the gene/allele variation and differentiation noticed exist in the landraces from Central America. Moreover, the inbreeding coefficient was on average equal to Fis = −0.1438, with values that suggested a marked deficiency of heterozygosity for varieties from Africa and Southern America, and an excess of heterozygosity for Mexican and Indian materials (Table 3).
Summary of heterozygosity (H), F-statistics and gene flow (Nm) estimates for individual marker loci, accession groups and over all accessions is reported in Table 4. Wright’s inbreeding coefficients Fis and Fit were calculated as measures of heterozygosity excess (+) or deficiency (−) of single individuals compared to accession groups and the total population, respectively. In particular, the average value of Fit = 0.0897 revealed slight variations of individual heterozygosity degrees from the overall population heterozygosity estimate. The very low amount of genetic differentiation Fst = 0.2042, also known as fixation index, indicates that only 20% of the genetic variation was found among accessions and that as much as 80% of the total polymorphism was scored within accession groups. A moderate genetic differentiation among geographical groups was also supported by a relatively low value of Rst = 0.2927. The narrow genetic differentiation among varietal groups over the investigated SSR loci was confirmed by the gene flow estimate that on average resulted Nm = 0.94 (Table 4).
Table 4. Summary of genetic diversity values (H), F-statistics and gene flow (Nm) estimates for individual marker loci and over all accessions. Nei’s genetic diversity estimates were calculated as observed heterozygosity (Ho), expected heterozygosity (He) and average heterozygosity (Hav), whereas Wright’s inbreeding coefficients Fis and Fit were calculated as measures of heterozygote deficiency (−) or excess (+) of single individuals compared to accession groups and the total population, respectively, while Fst is the degree of genetic differentiation, also known as fixation index.
MarkerSampleH-statisticsF-statisticsGene flow
Locus Id.SizeHoHeHavFisFitFstNm
JcSSR11060.05660.19360.16830.50480.65820.30960.56
JcSSR21060.7170.69870.4832−0.42870.03390.32380.52
JcSSR31060.32080.60680.39850.16590.44130.33020.5
JcSSR41060.47170.63920.56840.0670.20160.14431.48
JcSSR51060000000
JcSSR61040.03850.14710.16650.71720.74150.08592.66
JcSSR7980.02040.09870.13540.69230.78080.28770.62
JcSSR81000.90.57840.5753−0.5078−0.48040.018213.52
JcSSR91040000000
JcSSR101040.69230.52820.4794−0.5057−0.27080.1561.35
Mean1040.32170.34910.2975−0.14380.08970.20420.97
St. Dev.-0.34940.28460.22740.42690.35670.13794.08

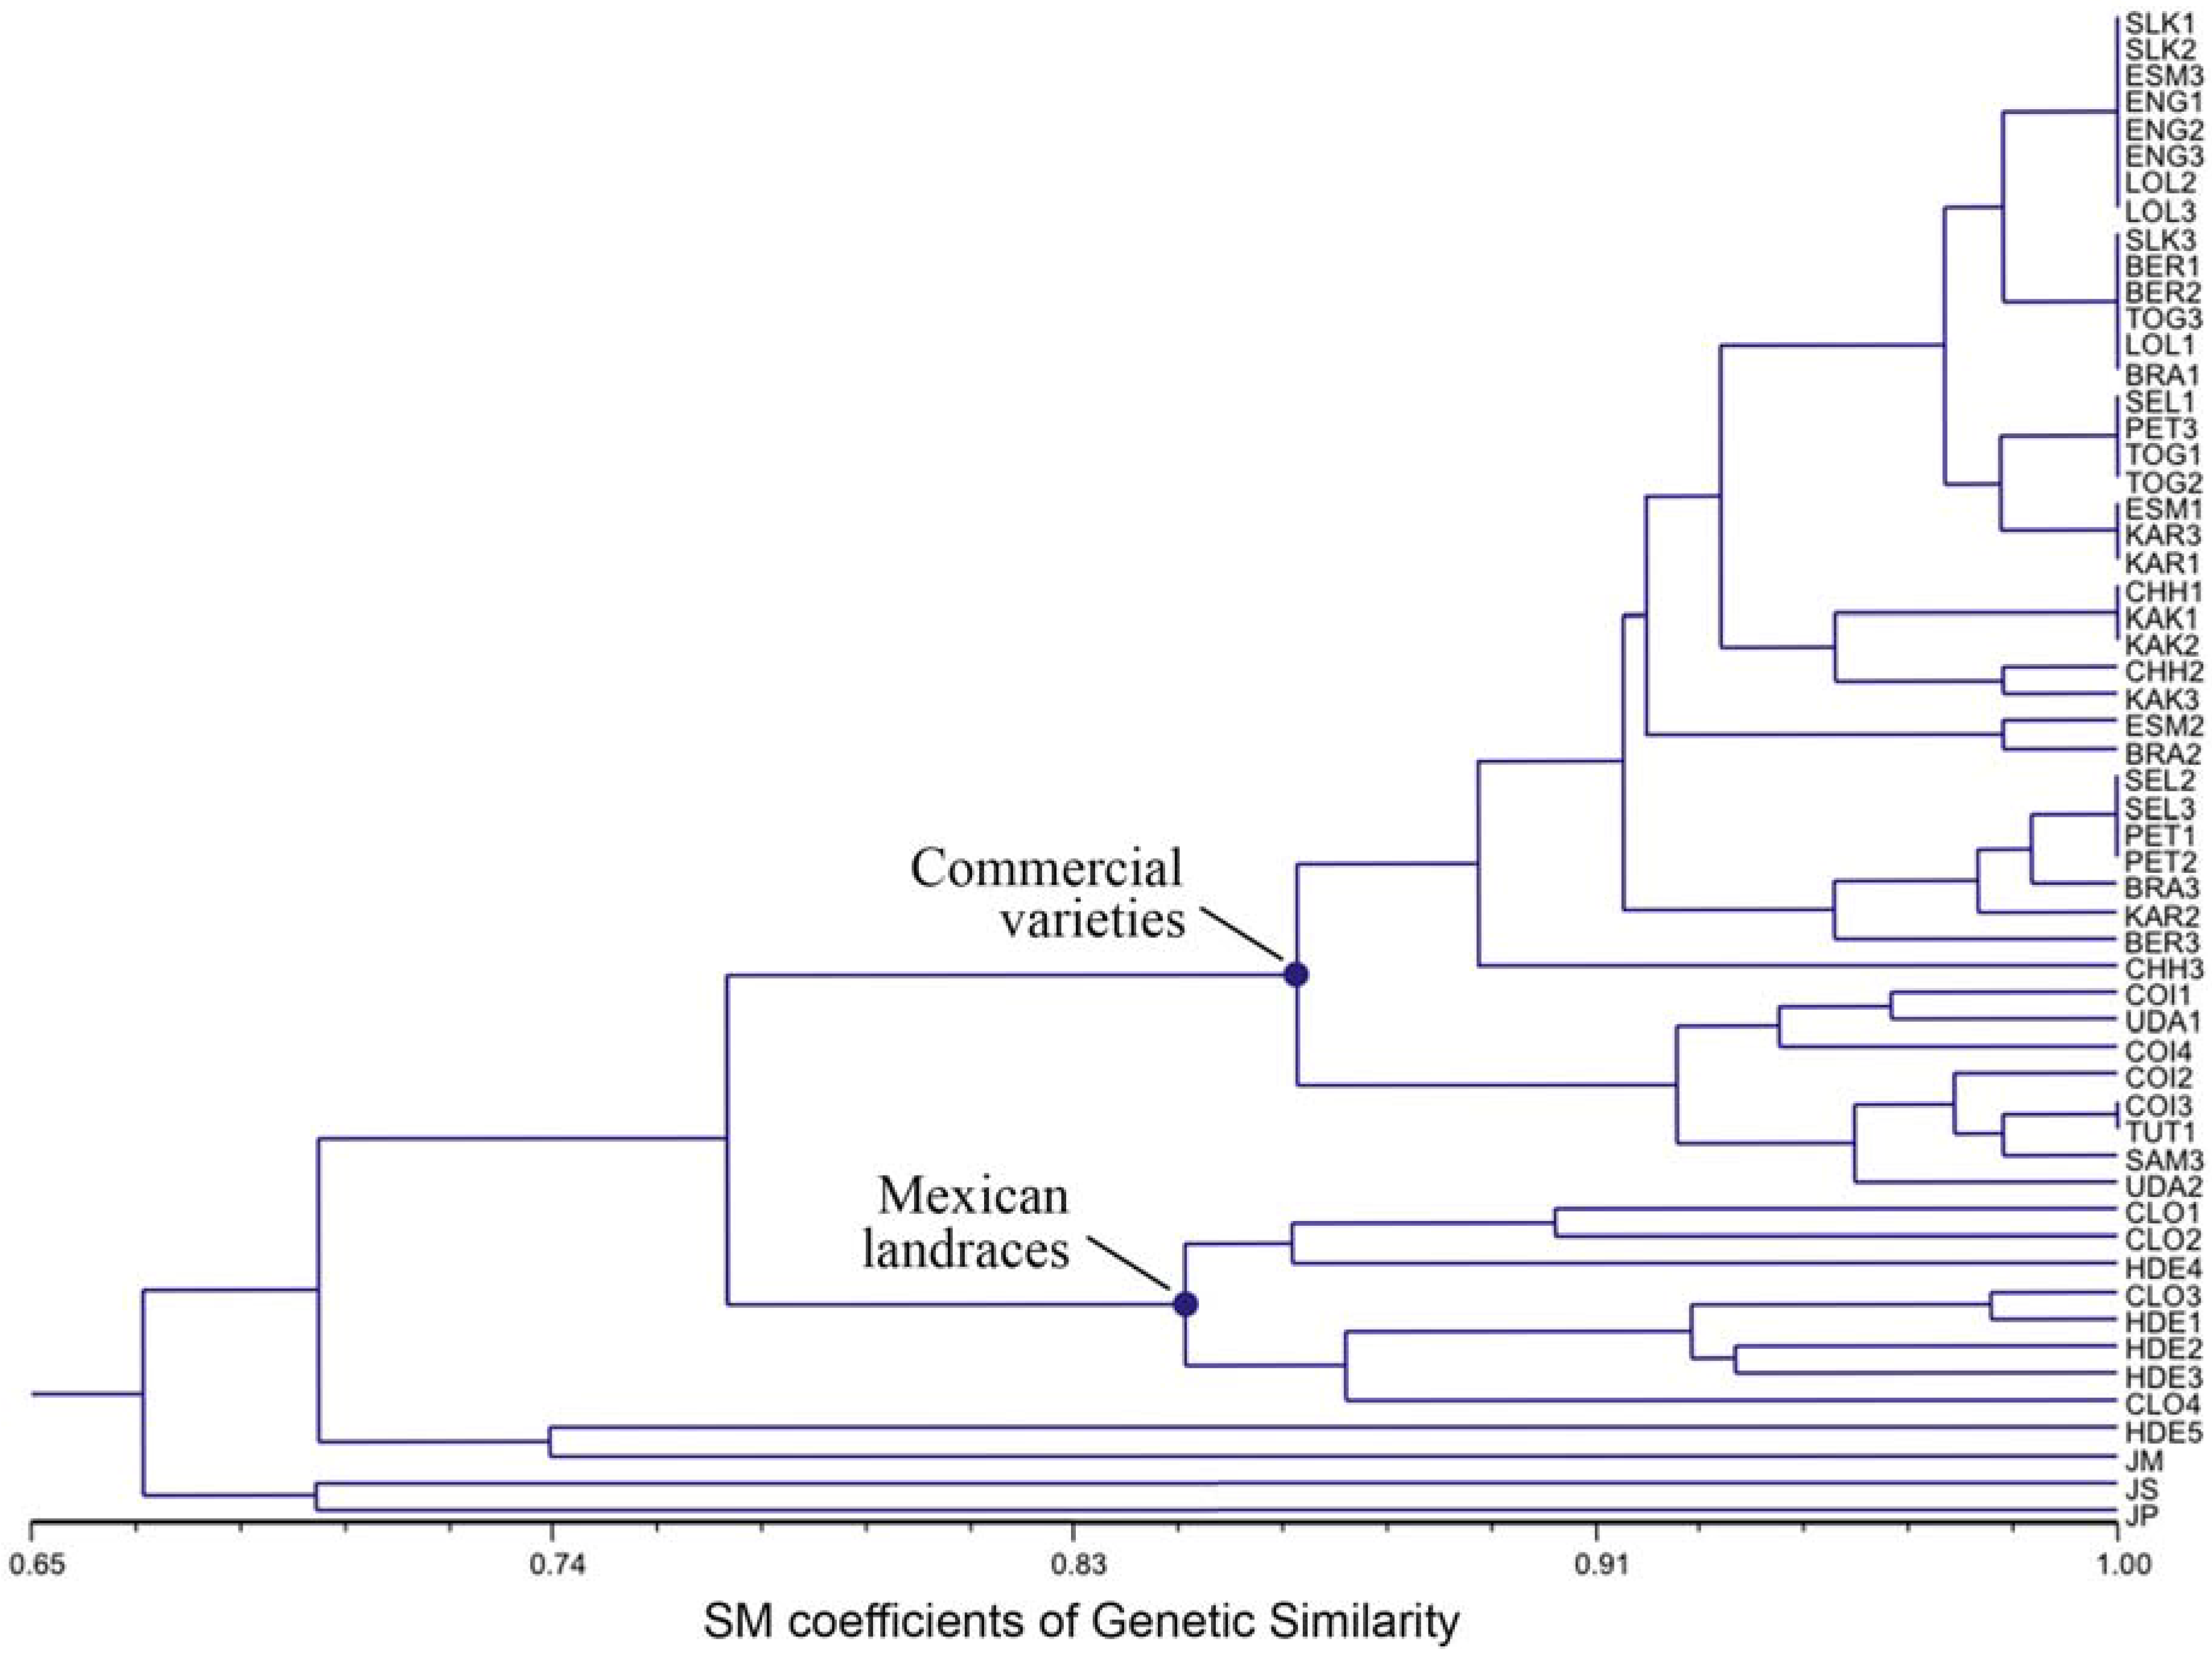
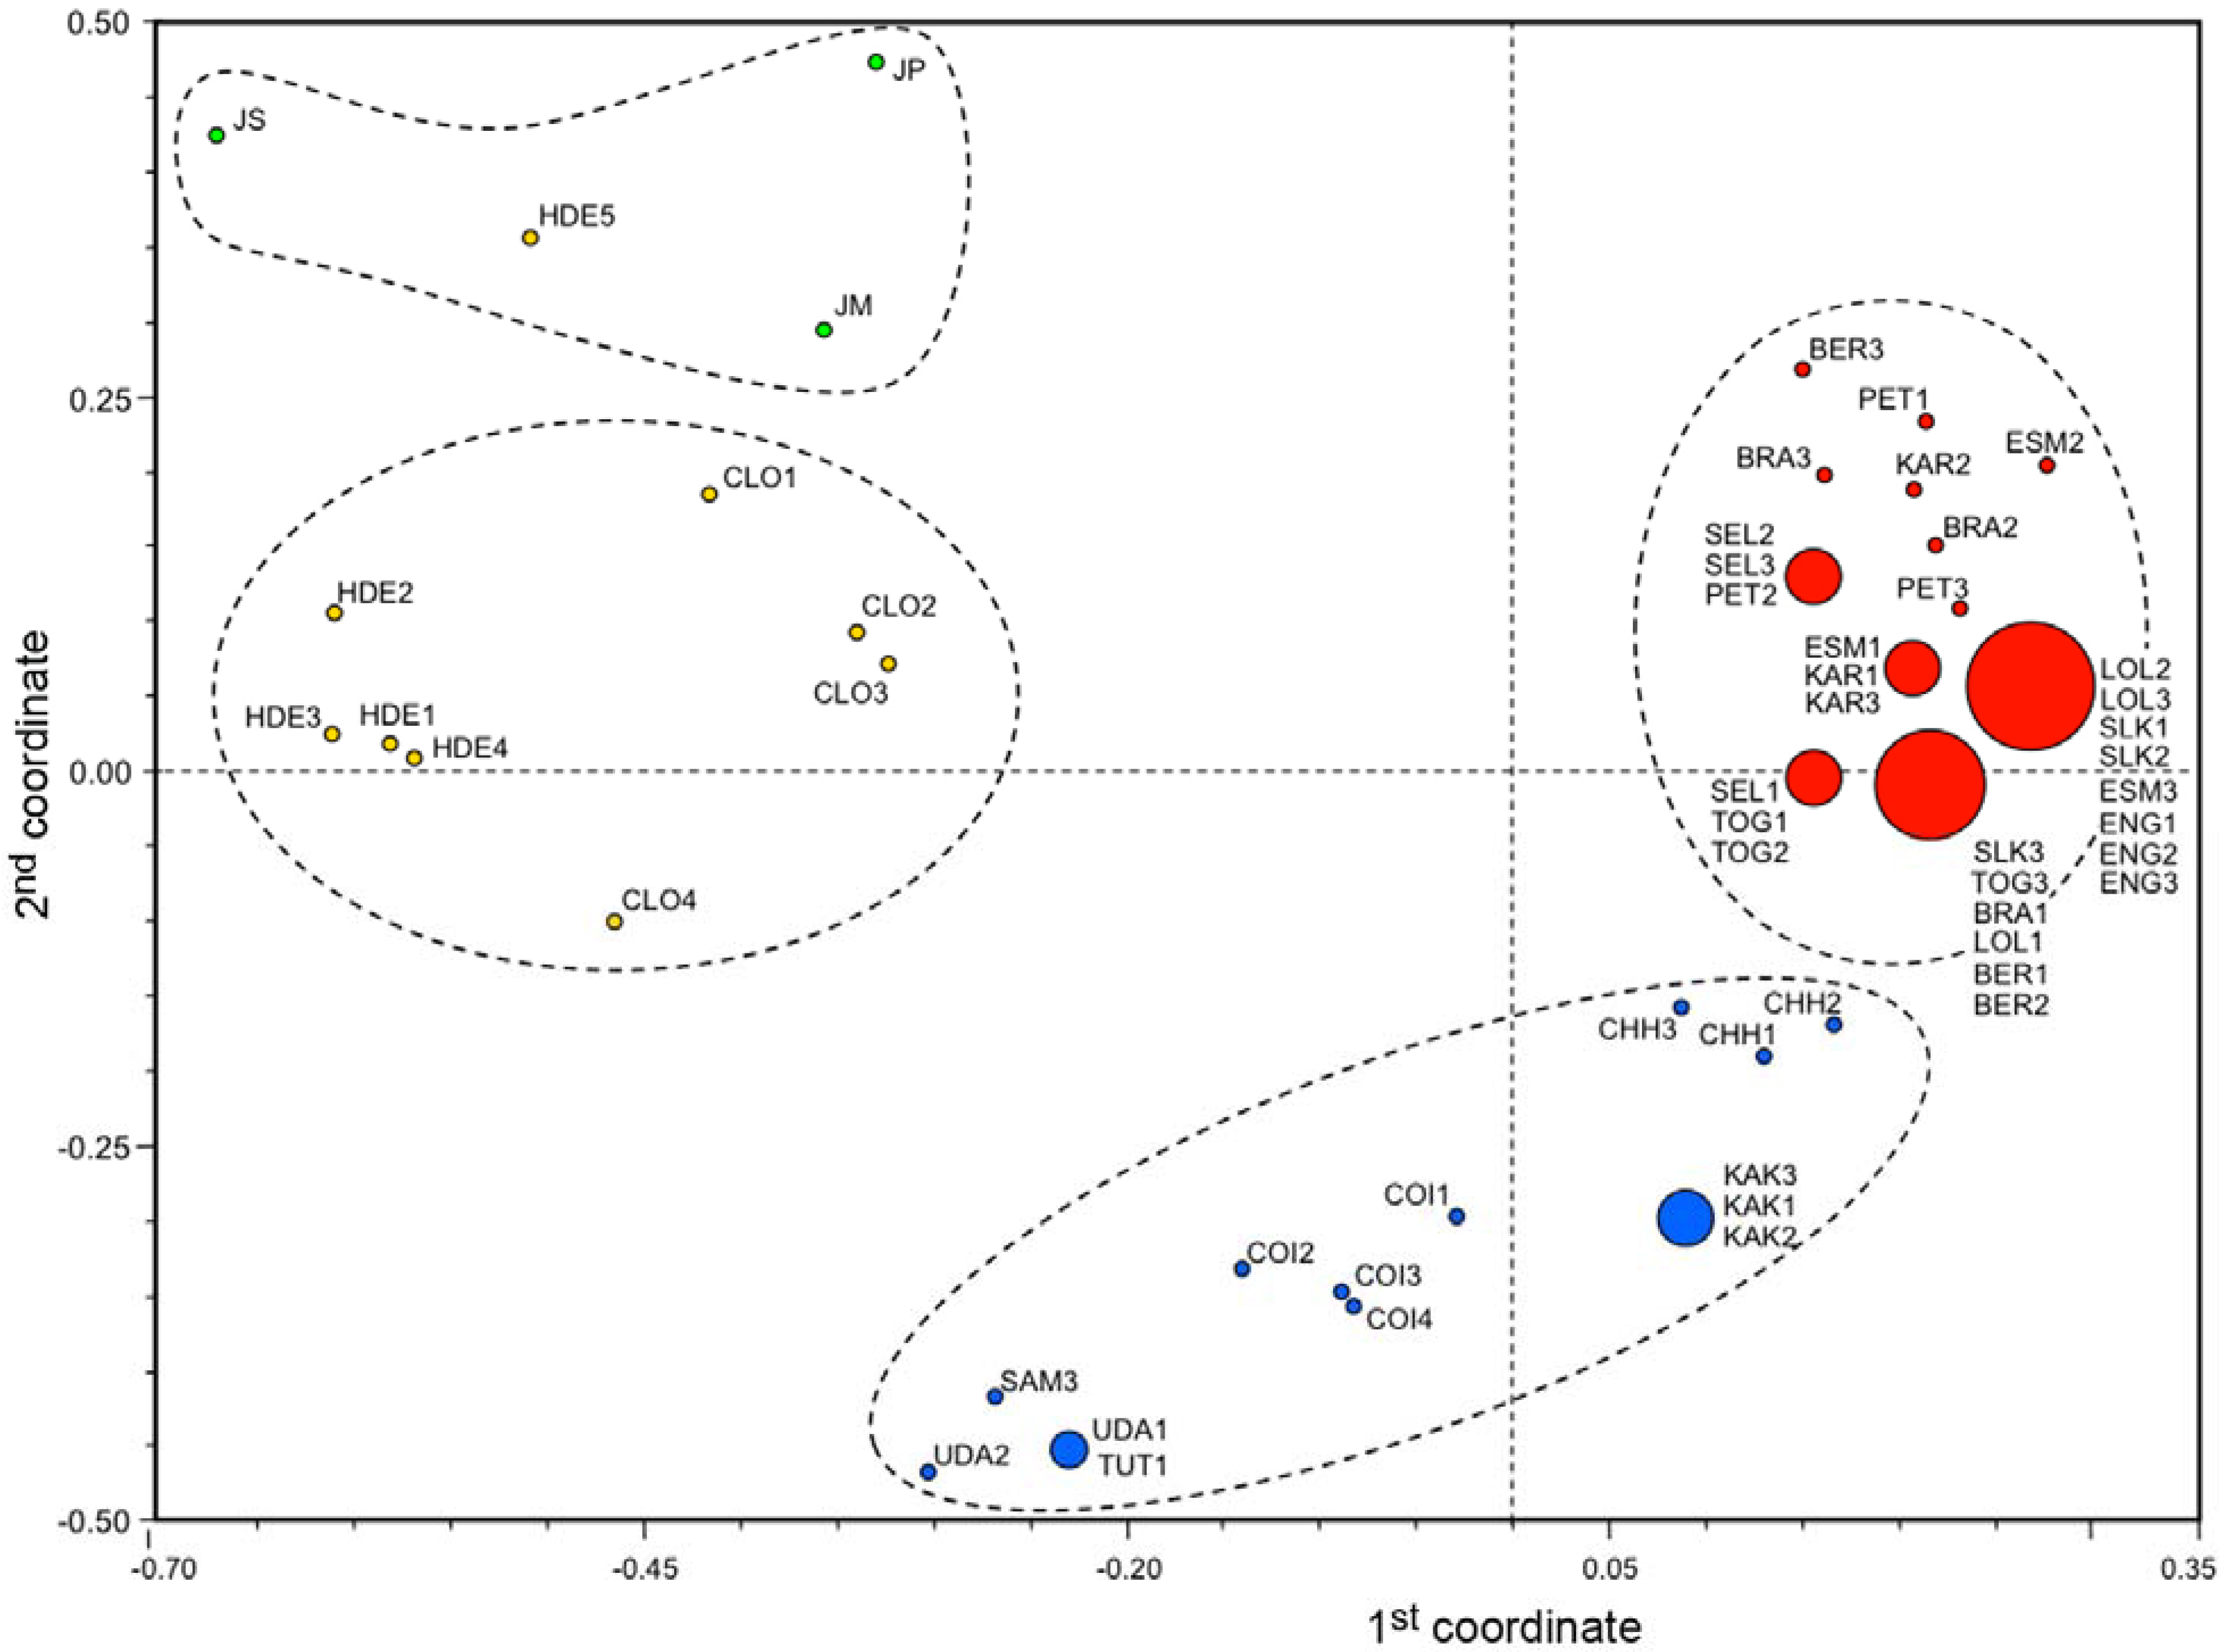
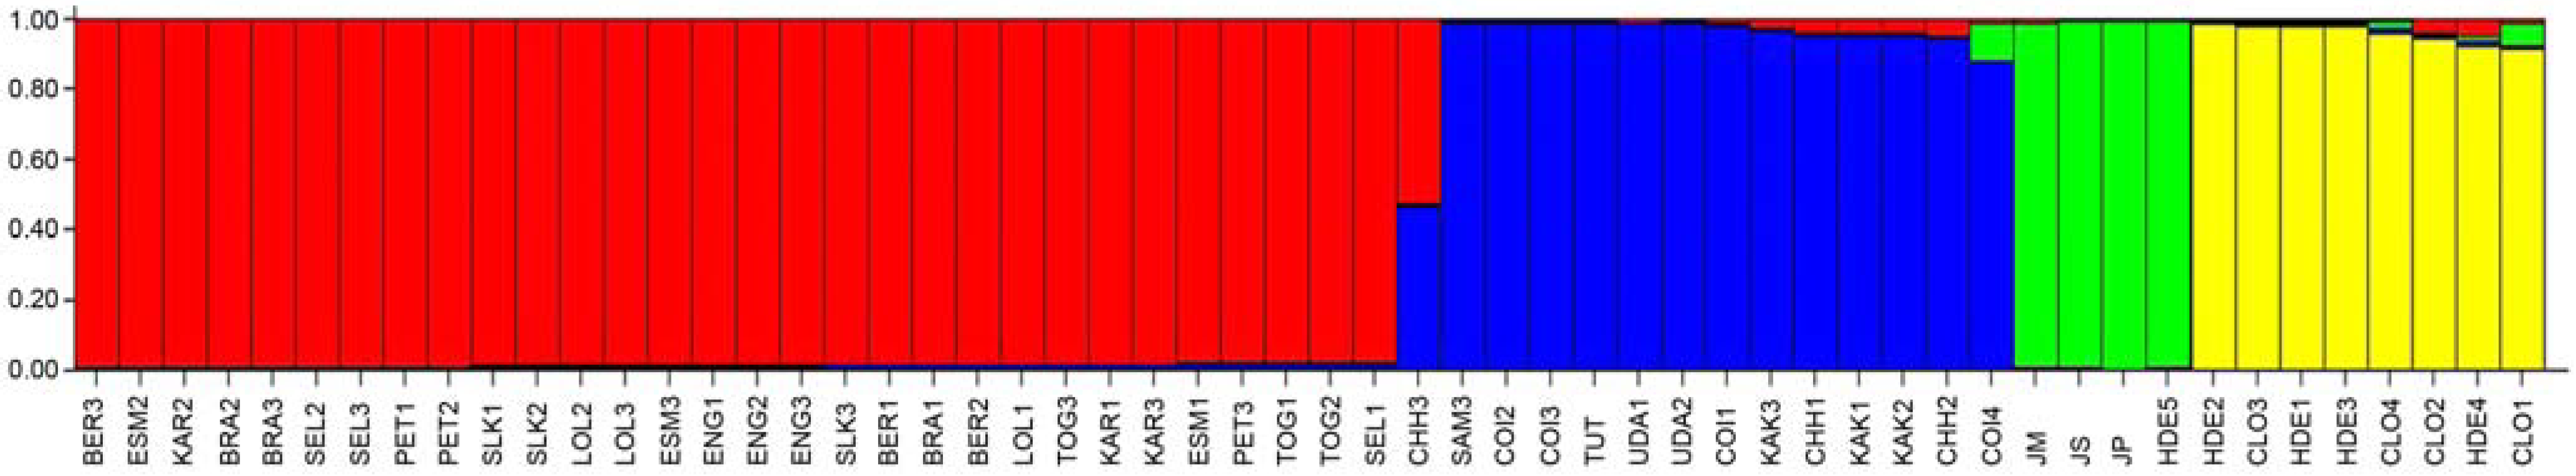
3.3. Ordination Analyses of Accessions and Population Structure Inferences

Cluster analysis was used to construct an UPGMA dendrogram displaying the very high genetic similarity detected among the 44 J. curcas accessions belonging to commercial varieties (Figure 3).
Figure 3. Dendrogram of J. curcas accessions based on SSR marker data using the Simple Matching genetic similarity matrix and the UPGMA clustering method. The two main nodes refer to the subgroups of commercial varieties and Mexican landraces.
Diversity 02 00810 g003
All of them were clustered into two distinct subgroups of 36 and eight accessions each, showing a mean genetic similarity higher than 94%, whereas the remaining accessions that correspond to the eight Mexican landraces were clustered apart with a mean genetic similarity of about 77% (Figure 3). Within the major subgroup, 21 out of the 36 accessions belonging to commercial varieties were tightly clustered into four closely related clonal genotypes, scoring a mean genetic similarity higher than 99%. As expected, the J. platyphylla, J. standleyi and J. malacophylla accessions were grouped separately from J. curcas ones. It is worth mentioning that one of the Mexican accessions proved to be genetically differentiated from the remaining J. curcas ones, being closely clustered with J. malacophylla (73.7%), J. standleyi (70.3%) and J. platyphylla (63.2%). On the whole, a total of 24 highly correlated genotypes were found over all commercial varieties, with a few genotypically distinct subgroups.
A principal coordinate ordination analysis was performed using the whole set of monomorphic and polymorphic SSR marker alleles according to the UPGMA clustering algorithm [41]. Varieties cultivated in India were clustered separately from the remaining ones collected in Sri Lanka, Western Africa and Southern America that in turn were grouped into a few dominant genotypes (Figure 4).
The first two principle components were able to explain 44.2% of the total genetic variation found within the Jatropha germplasm. In particular, the first component, which explains 28.8% of the total genetic diversity, was positively associated with the vast majority of commercial varieties and negatively associated with Mexican materials. The second component, which explains 15.3% of the total genetic diversity, was clearly able to discriminate the J. curcas Mexican landraces from the J. curcas Indian varieties, and also from outgroups of Jatropha spp., with the exception of the accession coded as HDE5 (Figure 4). The most discriminant microsatellite loci between varieties and landraces proved to be JcSSR1 and JcSSR3.
Figure 4. Centroids of J. curcas accessions bi-dimensionally plotted according to the principal coordinates that explain 44.2% of the total genetic variation detected across all SSR marker loci. The first component is positively associated with the vast majority of commercial varieties and negatively associated with Mexican materials and outgroups, whereas the second component discriminates the J. curcas Mexican landraces from either J. curcas Indian varieties and J. platyphylla, J. standleyi and J. malacophylla samples.
Diversity 02 00810 g004
Investigation of the population structure by estimation of ΔK [46] suggested that our core collection of accessions is most likely made up of four genetically distinguishable subgroups (K = 4), as shown in Figure 5.
A secondary peak at K = 2 was also detected (data not shown), suggesting the presence of two hierarchical levels of genetic structure in the Jatropha plant materials. Using K = 2, two main gene pool clusters were identified with all Mexican landrace accessions grouped separately from all the other varietal accessions. Increasing the number of populations to K = 4 led to the identification of two major clusters corresponding to varieties from Western Africa, Sri Lanka and Southern America, and India, respectively, and two additional clusters including, on one side, Mexican landraces, and outgroups (Jatropha spp.), on the other. Despite the steady genetic differentiation among clusters, a high genetic homogeneity was observed within each subgroup (Figure 5).
Figure 5. Population structure of Jatropha spp. germplasm into four major clusters (K = 4) as defined according to individual assignment. Main subgroups represent, from left to right, commercial varieties from Southern America, Sri Lanka and Western Africa (red bars), Indian varieties (blue bars), Jatropha spp. outgroups (green bars) and Mexican landraces (yellow bars).
Diversity 02 00810 g005
It is worth noting that the accession coded as CHH3 proved to be admixed, sharing large fractions of genetic background with the two main subgroups of commercial varieties. Furthermore, the accession coded as SAM3 deriving from Southern America was clustered with Indian accessions (see Figure 5).
Proportions of membership to the four inferred clusters of each of the five Jatropha subgroups pre-defined according to their geographical origin are reported in Table 5. Cultivated accessions were grouped in two distinct varietal clusters with a proportion of membership ranging from a minimum of 84.4% to a maximum of 98.3%. Accessions from Mexico were divided into two main clusters, one including landraces and the other outgroups (Table 5).
Table 5. Proportion of membership to the four inferred clusters of each of the five Jatropha subgroups pre-defined according to their geographical origin.
GeographicalInferred clustersNo.
origin1: varieties2: varieties3: landraces4: outgroupsaccessions
Mexico (1)0.0120.0070.6420.33912
South America (2)0.8440.1490.0040.0047
Africa (3)0.9820.0110.0040.00315
Asia (4)0.9830.010.0040.0049
India (5)0.060.9240.0040.01213

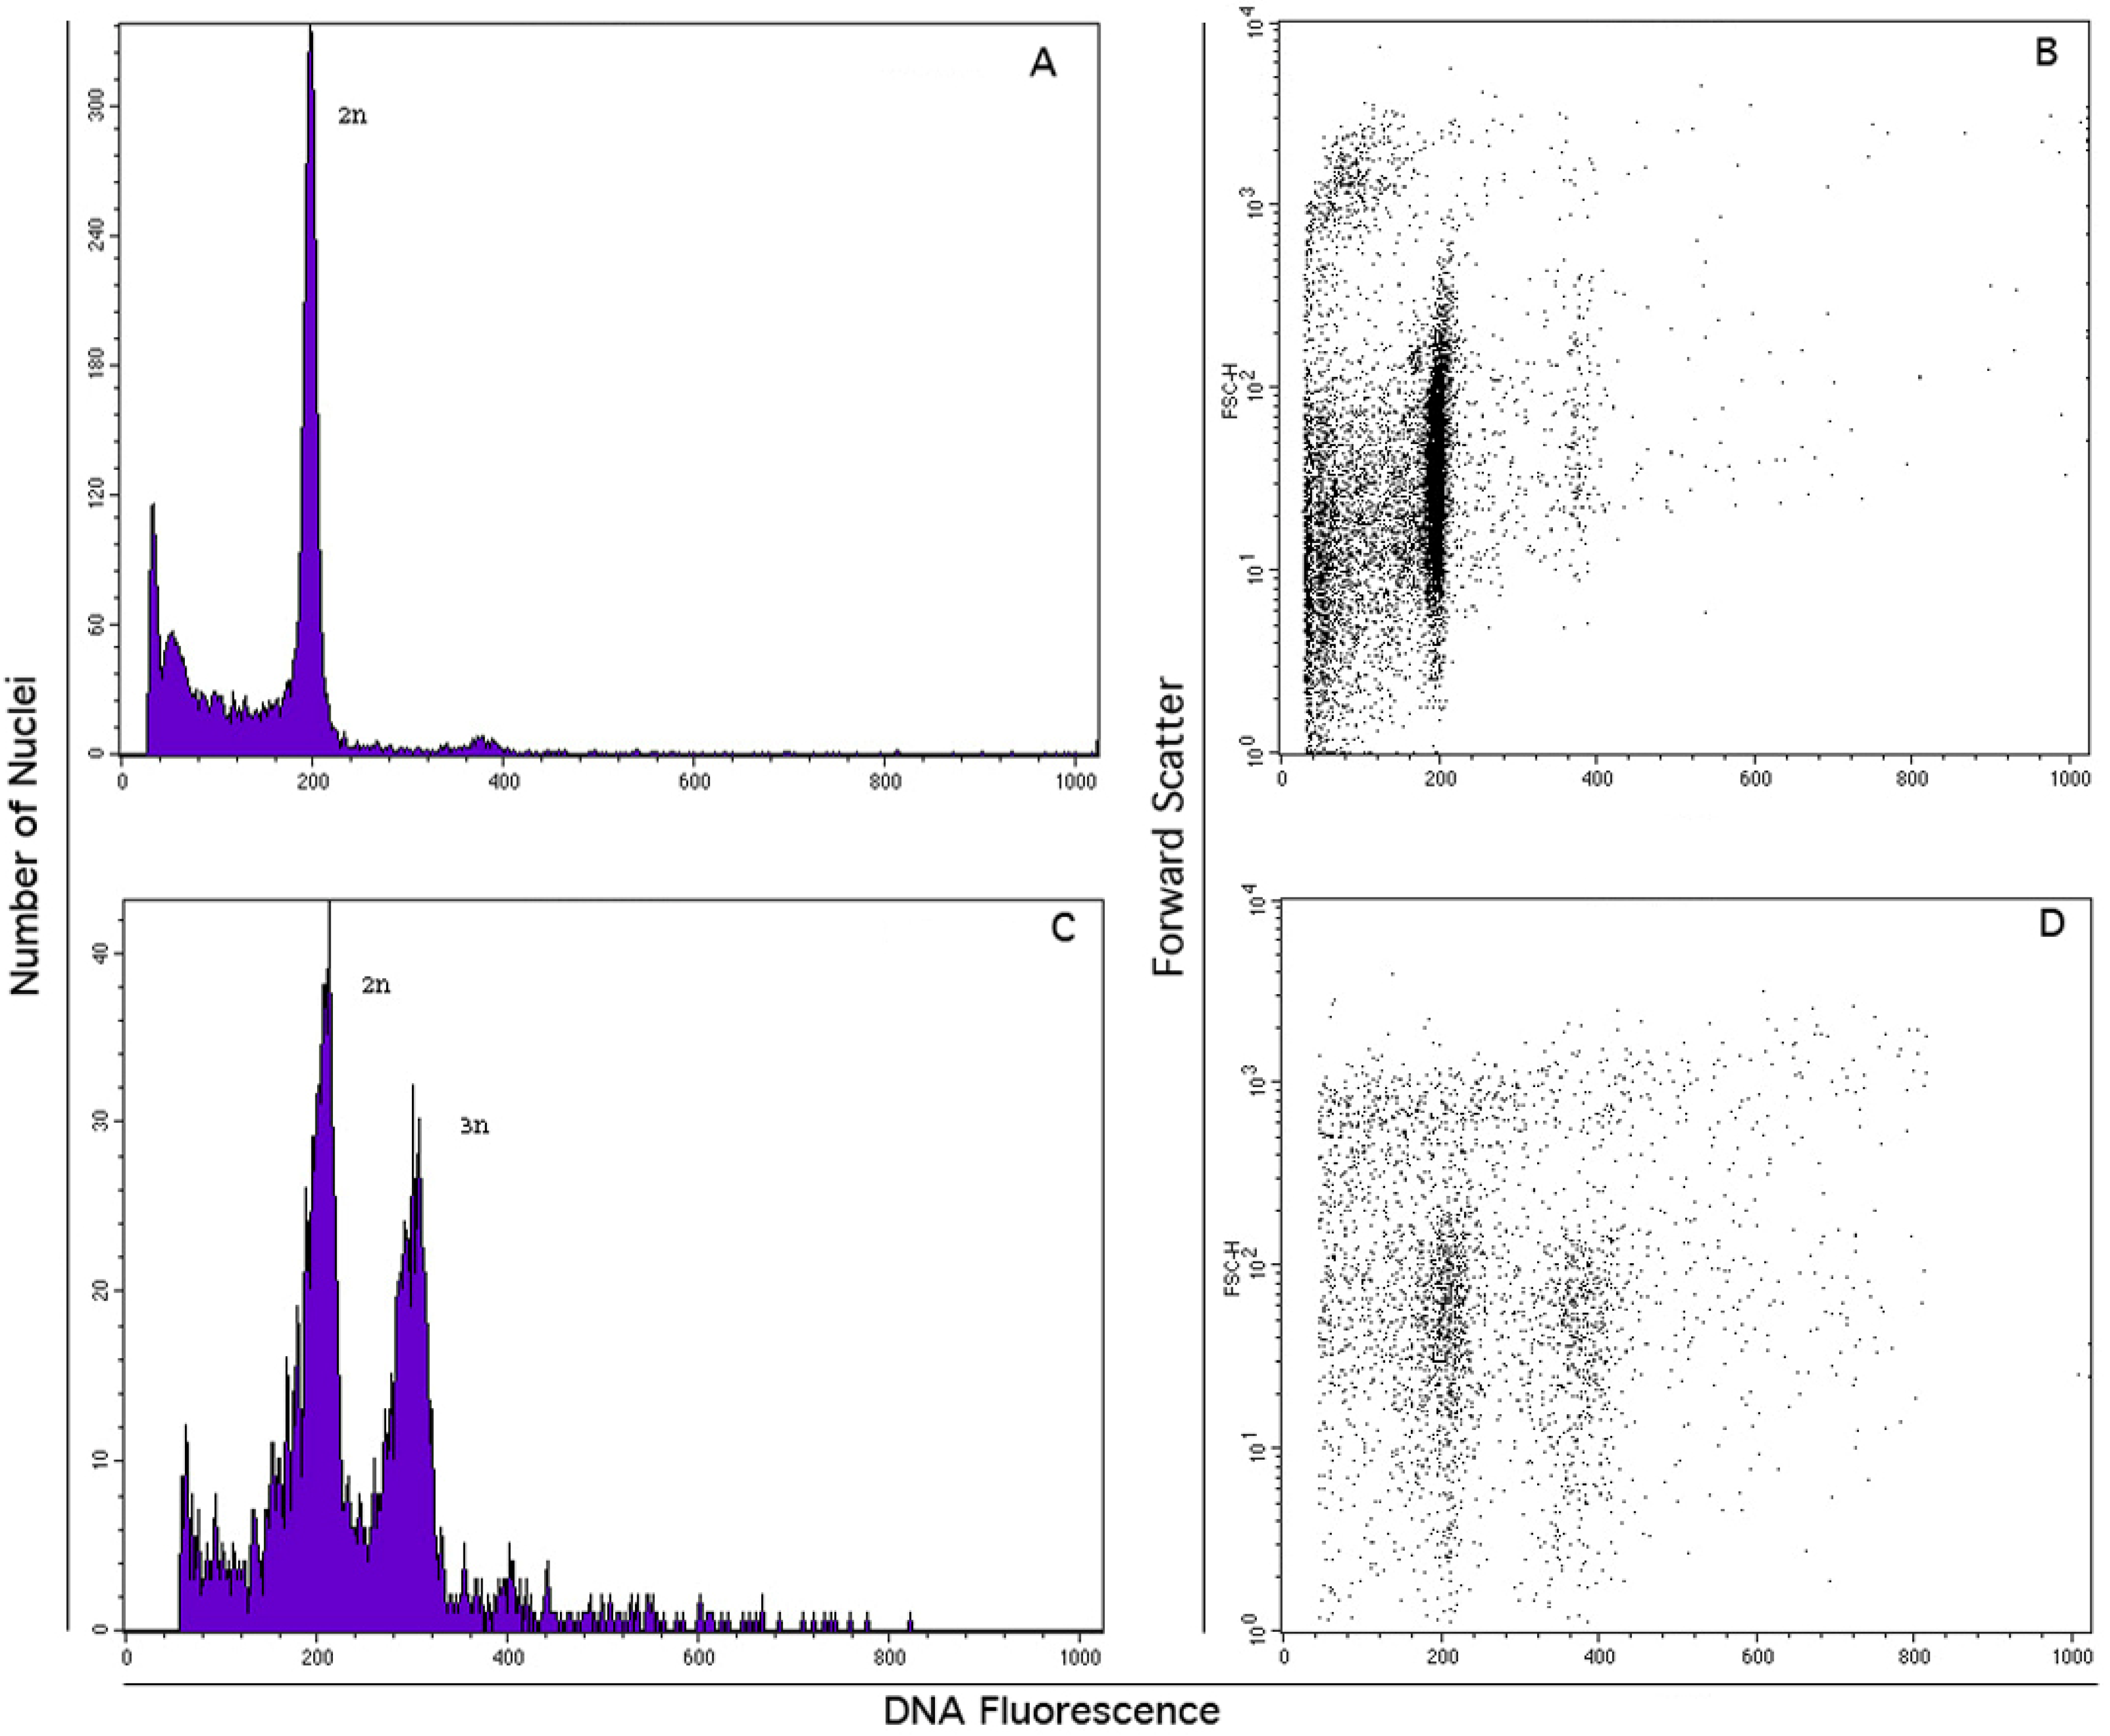
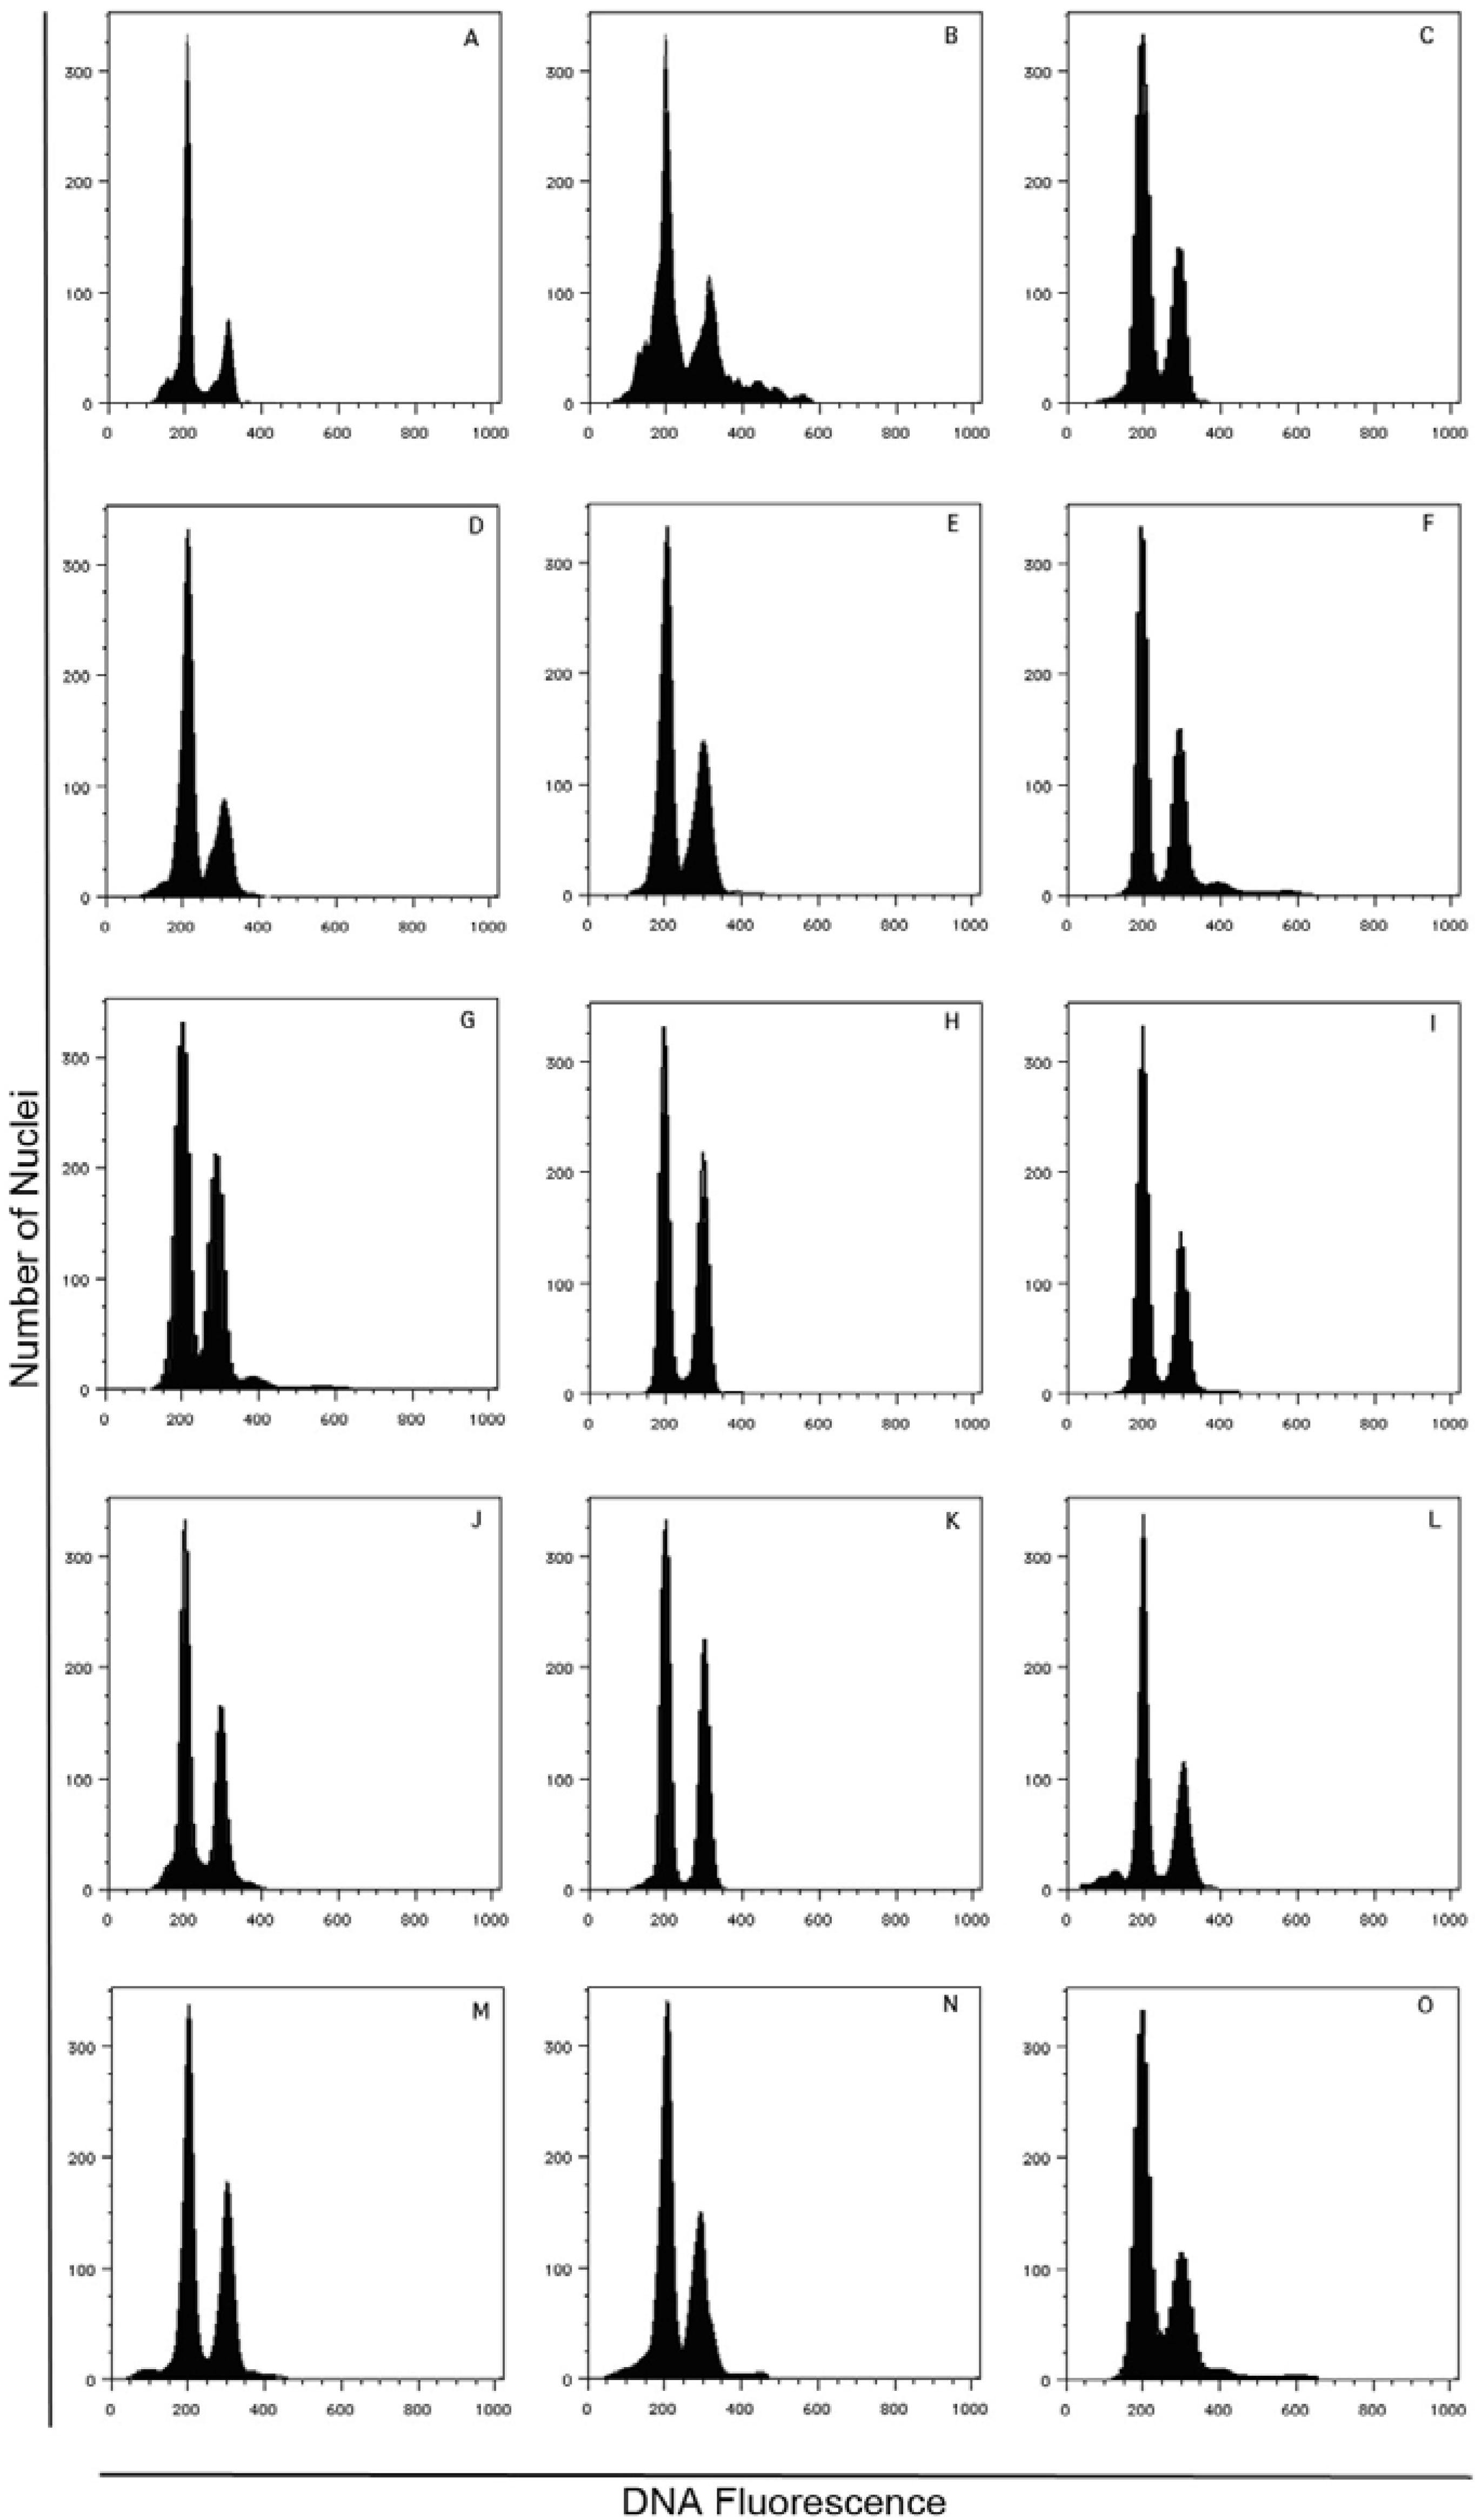
3.4. FCSS Analysis for the Estimation of Seed DNA Contents

The determination of ploidy and the reconstruction of reproductive strategy in the populations of J. curcas were determined by means of FCSS, a method suitable for the discrimination of either pseudogamous or autonomous apomixis from sexuality (i.e., amphimixis) based on the seed DNA contents of embryo and endosperm.
The true DNA content for J. curcas has been already estimated as 0.85 pg DNA per 2C nucleus [44], but no extensive analysis of the ploidy level at the population level has been carried until now for plants and seeds.
The high starch content of endosperm tissue required a careful optimization of the chopping procedure [44] and a fine tuning of the relative amount of cotyledon and endosperm tissues, which otherwise could bring wrong data and mistaken ploidy level estimates. Reliable DNA fluorescence pulse area histograms were obtained for the vast majority of analyzed seeds. In particular, the goodness of flow cytometry data was strongly related to the quantity and relative amount of chopped embryo and endosperm tissues. Moreover, the use of LB01 isolation buffer generated high quality DNA histograms when supplemented with 100 mM citric acid. The beneficial effect of citric acid has been already reported as related to a more homogeneous staining of DNA due to a better accessibility of chromatin structure [44,46].
The vast majority of seeds of this species proved to include diploid (2x) embryos and triploid (3x) endosperms (Figure 6).
Figure 6. Flow cytometry analysis of DAPI stained J. curcas nuclei in suspension. (A) and (C): total DNA fluorescence emission from cotiledonary leaf nuclei alone and together with endosperm released nuclei, respectively; (B) and (D): dual parameter analysis of DNA fluorescence versus nuclear scatter light emission for particle discrimination showing cotiledonary nuclei alone and a dual sample with endosperm ones, respectively.
Diversity 02 00810 g006
The presence of only one high 2C embryo peak and a smaller 3C endosperm peak (ratio 2:3), without the presence of any other DNA ploidy level, is consistent with an obligate sexual reproductive system (Figure 7).
Figure 7. Ploidy evaluation by flow cytometry analysis of DAPI stained nuclei in suspension isolated from single seeds of 15 J. curcas accessions: A, JcTUT; B, JcCOI; C, JcUDA; D, JcESM; E, JcPVL; F, JcTAN; G, JcLOL; H, JcBER; I, JcSLK; J, JcTOG; K, JcKAR; L, JcJOR; M, JcBRA; N, JcPET; and O, JcSEL (for details on accessions, see Table 1).
Diversity 02 00810 g007
Most importantly, neither tetraploid (4x) nor pentaploid (5x) endosperm DNA estimates were scored, as expected in case of autonomous and pseudogamous apomixis, respectively. However, it is worth mentioning that one triploid was found out of 190 seeds analyzed in this study (Table 6).
Table 6. Results of the flow cytometric screening of J. curcas seeds. Information on accessions and number of analyzed seeds per population is given along with the number of embryos and endosperm successfully evaluated for the DNA contents of their nuclei.
Accession Id.No. seeds2x embryo3x endosperm
JcCLO444
JcHDE555
JcBRA211
JcSAM111
JcLOL252112
JcTOG222
JcENG201918
JcBER22198
JcESM23125
JcKAR211
JcSLK22213
JcPET22175
JcSEL221910
JcJOR211
JcCHH211
JcUDP211
JcKAK543
JcTUT444
JcCOI322
19015587

4. Discussion

4.1. Analysis of Plant DNA Markers and Seed DNA Contents Shed Light on the Genetic Diversity and Reproductive Biology of J. curcas

A monoic plant with unisexual flowers, J. curcas shows male and female flowers in the same raceme (diclin inflorescences). As far as the life cycle is concerned, it is a perennial rootstock that may be propagated by cuttings or seeds.
On the basis of available information, about 68% of seeds are thought to be set through amphimixis, mainly by outcrossing, even if the species is characterized by self-compatibility and thus selfing is also possible. It was reported that sexual reproduction occurs only through pollination between different flowers of the same plant or from different plants [12]. The species seems also to show a tendency to promote xenogamy (i.e., union of genetically unrelated organisms) and to minimize geitonogamy (i.e., the pollination of a flower with the pollen from another flower on the same flowering plant), mechanisms that increase diversity [12].
That J. curcas plants might also set seeds through apomixis was also reported. At the population level, the average degree of apomixis was found to be equal to 32% [11]. It is worth mentioning that agamospermy, as a mode of asexual reproduction through seed, leads to clonality.
The remarkable genetic uniformity within populations is not compatible with outcrossing as the main pollination strategy: in this case, each population would have displayed a heterogeneous mixture of highly heterozygous genotypes sharing a common gene pool. Vice versa, the vast majority of microsatellite loci revealed a homozygous state across all investigated plants (the observed homozygosity was equal to 67.8%, on average). Moreover, although low total genetic variation was found, most of that was scored within accession groups (about 80%). As a consequence, J. curcas varieties cultivated worldwide nowadays seem to have been bred from closely related germplasm resources.
To establish the reproductive pathway of J. curcas, the DNA content of nuclei released from seed embryo and endosperm was measured with flow cytometry. In the case of sexuality, seeds showing diploid 2C embryo combined with triploid 3C endosperm DNA contents (EBN 2m:1p) are expected. By contrast, apomictic reproduction can take place by either pseudogamous (frequent) or autonomous (rare) mechanisms of endosperm development, depending on the occurrence or absence of the central cell fertilization [22]. As a consequence, DNA contents of endosperm nuclei may be either tetraploid (EBN 4m:0p) or pentaploid (EBN 4m:1p) (for details, see [22]). Gametophytic apomixis was not found because neither 4C (autogamous) nor 5C (pseudogamous) endosperm DNA values were scored, as instead it was expected in case of apomictically formed seeds [47,48]. As a consequence, the occurrence of asexual reproduction by means of gametophytic apomixis seems unlikely in this diploid species. Additionally, gametophytic apomixis has been shown to be strongly correlated with the occurrence of hybridity and polyploidy. Although numerous apomeiotic mutants and parthenogenic mutants have been described in diploid forms of sexual species, the expression of gametophytic apomixis is restricted mostly to polyploid, highly heterozygous apomictic complexes [49]. However, if it is true that the occurrence of apomixis in diploid J. curcas accessions is unlikely, it is also true that adventitious embryony cannot be ruled out in this species. According to such asexual mode of reproduction, embryos are initiated directly from individual cells in ovule tissues that are external to the sexually derived embryo sac. In fact, adventitious embryony has been described also as sporophytic apomixis [50]. Remarkably, genera with adventitious embryony are commonly diploid [49]. Conclusive results may only be gathered by means of cyto-histological analyses using sectioning or stain-clearing techniques as tools to shed light on sporogenesis, gametogenesis and embryogenesis pathways and its distinctive features in J. curcas.
Strong genomic uniformity among commercial varieties, as revealed by RAPD and Inter-SSR analyses, and a high degree of homozygosity as detected by SSR markers, are consistent with prevalent autogamy, the only reproductive pathway leading to a high degree of homozygosity [51]. As an alternative, an equally likely explanation for the low genetic variation observed over all accessions would be the repeated occurrence of bottlenecks that may have arisen through time and that may have caused the loss of any polymorphism. In accordance with this explanation, the low proportion of polymorphisms observed with all types of DNA markers could also be explained by inbreeding. In fact, marker data proving narrow genetic differentiation among varieties and low genic variation within varieties are in agreement not only with the expression of phenotypic variability for several plant traits because of environmental factors, but also with the evidence of homozygosity for most of the genomic loci over all plants. The very low genetic variation in commercial varieties of J. curcas could also be explained by clonality owing to the use of vegetative cuttings as main strategy of propagation [52,53,54].
The main population genetic parameters support monogenotypic varieties attributable to clonality and prevalent homozygosity in landraces is likely due to a dominant inbreeding strategy of seed formation for J. curcas. As a matter of fact, with reference to commercial varieties, the Nei’s estimate of genetic diversity was as low as H = 0.2597 and the mean genetic similarity estimate as high as SM = 96.5%. Additional co-dominant marker loci (e.g., SSR and SNP markers) and locally dominant ecotypes (e.g., Central America landraces) need to be tested in order to get conclusive results on the organization and distribution of gene polymorphisms at the population level.

5. Conclusions

The main finding is that seeds commercialized worldwide seem to be unrepresentative of the original gene pool, showing very low genetic variation either within or between varieties. Owing to the high degree of homogeneity found for most of the microsatellite loci across all accessions, commercial varieties of J. curcas consist of few genetically identical or closely related clones. Moreover, the clustering of accession groups was not correlated with their geographical area of cultivation and collection. The incontrovertible evidence that only eight dominant highly correlated multi-locus genotypes, tightly grouped into two main clusters, were found out of the 16 commercial varieties (44 accessions) suggests that a given variety can be distributed under different names. This result is explainable taking into account that certain J. curcas genotypes/clones introduced in African and Asian countries during last decades with a given name may have changed their phenotype under different selective environmental and anthropological pressures that most likely led to a variation of their morphological traits and then led final users to rename them. Additionally, misleading local nomenclature and incorrect germplasm recordkeeping may have contributed over the years to an erroneous or confused classification of varieties. The fact that most Indian accessions revealed heterozygosity for different microsatellite alleles at some of the loci investigated may reflect the development of commercial hybrids by controlled crosses between different clonal genotypes.
It is known that J. curcas has never been bred for productivity and/or quality traits and all commercial varieties derive by phenotype-based selections from local germplasm and are propagated by vegetative cuttings. As a consequence, narrow genetic base of J. curcas populations outside the centre of origin could probably be due to limited introductions without further augmentation of the crop, predominant vegetative propagation or occurrence of asexual reproduction (apomixis). Nevertheless, gametophytic apomixis does not seem to take place in J. curcas because all seeds revealed diploid embryo combined with triploid endosperm. Adventitious embryony cannot be discarded in this species because genera showing this reproductive strategy are commonly diploid. Conclusive results may only be gathered by means of cyto-histological analyses using sectioning or stain-clearing techniques as tools to shed light on sporogenesis, gametogenesis and embryogenesis pathways and its distinctive features in J. curcas.
As future perspectives, the genotyping of single plants and haplotyping of candidate genes using a larger J. curcas worldwide collection of local ecotypes will be attempted to find out the most representative and discriminate polymorphisms (SNPs) eventually related with fatty acid biosynthesis and lipid metabolism genes. A major goal will be that of discovering association between specific alleles and seed oil contents and/or patterns. Finally, taking into account the whole set of experimental data, the genotypes showing the best quali-quantitative lipid profile will be propagated and used as materials for breeding new varieties suitable for biomass production by means of in vitro somatic embryogenesis.

References

  1. Zieler, H.; Richardson, T.; Schwartz, A.; Herrgard, M.; Lomelin, D.; Mathur, E.; Cheah, S.C.; Tee, T.S.; Lee, W.W.; Chua, K.L.; Kwan, B.H.; Miller, J.; Koren, S.; Chan, A.P.; Maiti, R.; Amedeo, P.; Ferriera, S.; Rogers, Y.H.; Sutton, G.; Town, C.D.; Venter, J.C. Whole-genome shotgun sequencing of the oil palm and Jatropha genomes. In Proceedings of the Plant and Animal Genomes XVIII Conference; Sherago International, Inc.: San Diego, CA, USA, January 2010; p. W. 360. [Google Scholar]
  2. Nature Editorial. Kill king corn. Nature 2007, 449, 637. [Google Scholar]
  3. Foidl, N.; Foidl, G.; Sanchez, M.; Mitelbach, M.; Heckel, S. Jatropha curcas L. as a source for the production of biofuel in Nicaragua. Bioresource Technol. 1996, 58, 77–82. [Google Scholar] [CrossRef]
  4. Gubitz, G.M.; Mittelbach, M.; Trabi, M. Exploitation of the tropical oil seed plant Jatropha curcas L. Bioresource Technol. 1999, 67, 73–82. [Google Scholar] [CrossRef]
  5. Francis, G.; Edinger, R.; Becker, K. A concept for simultaneous wasteland reclamation, fuel production, and socio- econimic development in degraded areas in India: Need potential and prospectives of Jatropha plantations. Nat. Resour. Forum. 2005, 29, 12–24. [Google Scholar] [CrossRef]
  6. Berchmans, H.J.; Hirata, S. Biodisel production from crude Jatropha curcas L. seed oil with a high content of free fatty acids. Bioresource Technol. 2008, 99, 1716–1721. [Google Scholar] [CrossRef]
  7. Kumar, A.; Sharma, S. An evaluation of multipropose oil seed crop for industrial uses (Jatropha curcas): A review. Ind. Crops Prod. 2008, 28, 1–10. [Google Scholar] [CrossRef]
  8. King, R.D.; Rowland, J.; Oliver, S.G.; Young, M.; Aubrey, W.; Byrne, E.; Liakata, M.; Markham, M.; Pir, P.; Soldatova, L.N.; Sparkes, A.; Whelan, K.E.; Clare, A. The automation of science. Science 2009, 324, 85–89. [Google Scholar] [CrossRef]
  9. Basha, S.D.; Francis, G.; Makkar, H.P.S.; Becker, K.; Sujatha, M. A comparative study of biochemical traits and molecular markers for assessment of genetic relationships between Jatropha curcas L. germplasm from different countries. Plant Sci. 2009, 176, 812–823. [Google Scholar] [CrossRef]
  10. Ambrosi, D.G.; Galla, G; Purelli, M.; Barbi, T; Fabbri, A.; Barcaccia, G. DNA markers and FCSS analyses shed light on the genetic diversity and reproductive biology of Jatropha curcas L. In Proceedings of the Plant and Animal Genomes XVIII Conference; Sherago International, Inc.: San Diego, CA, USA, January 2010; p. 129. [Google Scholar]
  11. Spillane, C.; Curtis, M.D.; Grossniklaus, U. Apomixis technology development. Virgin births in farmers fields. Nat. Biotechnol. 2004, 22, 687–691. [Google Scholar] [CrossRef]
  12. Bhattacharya, A.; Datta, K.; Datta, S.K. Floral biology, floral resource constraints and pollination limitation in Jatropha curcas L. Pakistan J. Biological Sci. 2005, 8, 456–460. [Google Scholar] [CrossRef]
  13. Luo, C-W.; Li, K.; Chen, Y.; Sun, Y.Y. Floral display and breeding system of Jatropha curcas L. Forestry Stud. China 2007, 9, 114–119. [Google Scholar] [CrossRef]
  14. Popluechai, S.; Breviario, D.; Mulpuri, S.; Makkar, H.P.S.; Raorane, M.; Reddy, A.R.; Palchetti, E.; Gatehouse, A.M.R.; Syers, J.K.; O’Donnell, A.G.; Kohli, A. Narrow genetic and apparent phenetic diversity in Jatropha curcas: Initial success with generating low phorbol ester interspecific hybrids. Nature Proceedings 2009. (available at hdl: 10101/npre.2009.2782.1). [Google Scholar]
  15. Pamidimarri, D.V.N.S.; Singh, S.; Mastan, S.G.; Patel, J.; Reddy, M.P. Molecular characterization and identification of markers for toxic and non-toxic varieties of Jatropha curcas L. using RAPD, AFLP, and SSR markers. Mol. Biol. Rep. 2009, 36, 1357–1364. [Google Scholar] [CrossRef]
  16. Basha, S.D.; Sujatha, M. Inter and intra-population variability of Jatropha curcas L. characterized by RAPD and ISSR markers and development of population-specific SCAR markers. Euphytica 2007, 156, 375–386. [Google Scholar] [CrossRef]
  17. Yu, C.; Wu, G.; Peng, J. ISSR-based genetic diversity of Jatropha curcas germplasm in China. In Proceedings of the Plant and Animal Genomes XVIII Conference; Sherago International, Inc.: San Diego, CA, USA, January 2010; p. 212. [Google Scholar]
  18. Pamidimarri, D.V.N.S.; Nirali, P.; Reddy, M.P.; Radhakrishnan, T. Comparative study of interspecific divergence and phylogenic analysis of genus Jatropha by RAPD and AFLP. Mol. Bio. Rep. 2008, 36, 901–907. [Google Scholar]
  19. Doebley, J.F.; Gaut, B.S.; Smith, B.D. The molecular genetics of crop domestication. Cell 2006, 127, 1309–1321. [Google Scholar] [CrossRef]
  20. Kaushik, N.; Kumar, K.; Kumar, S.; Kaushik, N.; Roy, S. Genetic variability and divergence studies in seed traits and oil content of Jatropha (Jatropha curcas L.) accessions. Biomass and Bioenergy 2007, 31, 497–502. [Google Scholar] [CrossRef]
  21. Popluechai, S.; Raorane, M.; Syers, K.J.; O’Donnell, A.G.; Kohli, A. Research needs to make Jatropha a viable alternate oilseed crop. In Proceedings of the International workshop on Feasibility of non-edible oil seed crops for biofuel production, Mae Fah Luang University; Syers, K.J., Wood, D., Eds.; MFLU publication: Chiang Rai, Thailand, May 2007; pp. 23–38. [Google Scholar]
  22. Gressel, J. Transgenics are imperative for biofuel crops. Plant Sci. 2008, 174, 246–263. [Google Scholar] [CrossRef]
  23. Matzk, F.; Meister, A.; Schubert, I. An efficient screen for reproductive pathways using mature seeds of monocots and dicots. Plant J. 2000, 21, 97–108. [Google Scholar] [CrossRef]
  24. Dolezel, J.; Binarova, P.; Lucretti, S. Analysis of nuclear DNA content in plant cells by flow cytometry. Biol. Plant. 1989, 31, 113–120. [Google Scholar] [CrossRef]
  25. Mendonça, M.A.C.; Carvalho, C.R.; Clarindo, R.W. DNA content differences between male and female chicken (Gallus gallus domesticus) nuclei and Z and W chromosomes resolved by image. J. Histochem. Cytochem. 2009, 58, 229–235. [Google Scholar]
  26. Sambrook, J.; Fritsch, E.F.; Maniatis, T. Molecular Cloning: A Laboratory Manual, 2nd ed.; NY Cold Spring Harbor Laboratory, Cold Spring Harbor Laboratory Press: Cold Spring Harbor, NY, USA, 1989; p. 1659. [Google Scholar]
  27. Barcaccia, G.; Mazzucato, A.; Belardinelli, A.; Pezzotti, M.; Lucretti, S.; Falcinelli, M. Inheritance of parental genomes in progenies of Poa pratensis L. from sexual and apomictic genotypes as assessed by RAPD markers and flow cytometry. Theor. Appl. Genet. 1997, 95, 516–524. [Google Scholar] [CrossRef]
  28. Barcaccia, G.; Lucchin, M.; Parrini, P. Characterization of a flint maize (Zea mays var. indurata) Italian landrace: II. Genetic diversity and relatedness assessed by PCR-based molecular markers. Genet. Res. Crop Evol. 2003, 50, 253–271. [Google Scholar] [CrossRef]
  29. Barcaccia, G.; Meneghetti, S.; Albertini, E.; Triest, L.; Lucchin, M. Linkage mapping in tetraploid willows: segregation of molecular markers and estimation of linkage phases support an allotetraploid structure for Salix alba x Salix fragilis interspecific hybrids. Heredity 2003, 90, 169–180. [Google Scholar] [CrossRef]
  30. Hayden, M.J.; Nguyen, T.M.; Watrman, A.; McMichael, G.L.; Chalmers, K.J. Application of multiplex-ready PCR for fluorescence-based SSR genotyping in barley and wheat. Mol. Breeding 2008, 21, 271–281. [Google Scholar] [CrossRef]
  31. Zubieta, C.G.; Ghiselli, L.; Benedettelli, S.; Palchetti, E. Development of novel SSR markers from genomic microsatellite library in Jatropha curcas L. In Proceedings of the 53rd Italian Society of Agricultural Genetics Annual Congress; SIGA publisher: Torino, Italy, September 2009; pp. 7–60. [Google Scholar]
  32. Kimura, M.; Crow, J.F. The number of alleles that can be maintained in a finite population. Genetics 1964, 49, 725–738. [Google Scholar]
  33. Nei, M. Analysis of gene diversity in subdivided populations. Proc. Natl. Acad. Sci. USA 1973, 70, 3321–3323. [Google Scholar] [CrossRef]
  34. Lewontin, R.C. The Genetic Basis of Evolutionary Change; Columbia University Press: New York, NY, USA, 1974. [Google Scholar]
  35. McDermott, J.M.; McDonald, B.A. Gene flow in plant pathosystems. Annu. Rev. Phytopathol. 1993, 31, 353–373. [Google Scholar] [CrossRef]
  36. Wright, S. The interpretation of population structure by F-statistics with special regards to systems of matings. Evolution 1965, 19, 395–420. [Google Scholar] [CrossRef]
  37. Wright, S. Evolution and the Genetics of Populations. Variability Within and Among Natural Populations; University of Chicago Press: Chicago, IL, USA, 1978; vol. 4. [Google Scholar]
  38. Slatkin, M. A measure of population subdivision based on microsatellite allele frequencies. Genetics 1995, 139, 457–462. [Google Scholar]
  39. Goodman, S.J. Rst Calc: a collection of computer programs for calculating estimates of genetic differentiation from microsatellite data and determining their significance. Mol. Ecol. 1997, 6, 881–885. [Google Scholar] [CrossRef]
  40. Yeh, F.C.; Yang, R.C.; Boyle, T. POPGENE version 1.21; CIFOR and University of Alberta: Edmonton, Canada, 1997. [Google Scholar]
  41. Sneath, P.H.A.; Sokal, R.R. Numerical Taxonomy; Freeman W.H. Co: San Francisco, CA, USA, 1973. [Google Scholar]
  42. Gower, J.C. Some distance properties of latent root and vector methods used in multivariate analysis. Biometrika 1996, 53, 325–338. [Google Scholar] [CrossRef]
  43. Rohlf, F.J. NTSYS-pc: Numerical Taxonomy System, (version 2.1); Exeter Publishing, Ltd.: Setauket, NY, USA, 2002. [Google Scholar]
  44. Pritchard, J.K.; Stephens, P.; Donnelly, P. Inference of population structure using multilocus genotype data. Genetics 2000, 155, 945–959. [Google Scholar]
  45. Falush, D.; Stephens, M.; Pritchard, J.K. Inference of population structure using multilocus genotype data: linked loci and correlated allele frequencies. Genetics 2003, 164, 1567–1587. [Google Scholar]
  46. Evanno, G.; Regnaut, S.; Goudet, J. Detecting the number of clusters of individuals using the software STRUCTURE: a simulation study. Mol. Ecol. 2005, 14, 2611–2620. [Google Scholar] [CrossRef]
  47. Carvalho, C.R.; Clarindo, W.R.; Prac, M.M.; Araujo, F.S.; Carels, N. Genome size, base composition and karyotype of Jatropha curcas L., an important biofuel plant. Plant Sci. 2008, 174, 613–617. [Google Scholar] [CrossRef]
  48. Galbraith, D.W.; Harkins, K.R.; Maddox, J.M.; Ayres, N.M.; Sharma, D.P.; Firoozabady, E. Rapid flow cytometric analysis of the cell cycle in intact plant tissues. Science 1983, 220, 1049–1051. [Google Scholar]
  49. Loureiro, J.; Rodriguez, E.; Dolezel, J.; Santos, C. Comparison of four nuclear isolation buffers for plant DNA flow cytometry. Annals Botany 2006, 98, 679–689. [Google Scholar] [CrossRef]
  50. Savidan, Y.H. Apomixis: Genetics and breeding. Plant Breed. 2000, 18, 10–86. [Google Scholar]
  51. Barcaccia, G.; Baumlein, H.; Sharbel, T.F. Apomixis in St. John’s wort: An overview and glimpse towards the future. In Apomixis: Evolution, Mechanisms and Perspectives; Hörandle, E., Grossniklaus, U., Van Dijk, P., Sharbel, T.F., Eds.; Intl. Association of Plant Taxonomy - Koeltz Scientific Books: Vienna, Austria, 2007; Chapter XIV; pp. 259–280. [Google Scholar]
  52. Asker, S.E.; Jerling, L. Apomixis in plants; CRC Press: London, UK, 1992. [Google Scholar]
  53. Nogler, G.A. Gametophytic apomixis. In Embryology of Angiosperms; Johri, B.M., Ed.; Springer-Verlag: Berlin, Germany, 1984; pp. 475–518. [Google Scholar]
  54. Allard, R.W. History of plant population genetics. Annu. Rev. Genet. 1999, 33, 1–27. [Google Scholar] [CrossRef]
  55. Heller, J. Physic Nut. Jatropha curcas L. Promoting the Conservation and Use of Underutilized and Neglected Crops; Institute of Plant Genetics and Crop Plant Research (IPK), International Plant Genetic Resources Institute (IPGRI): Gatersleben, Germany, Rome, Italy, 1996; p. 65. [Google Scholar]
  56. Jongshaap, R.E.E.; Corré, W.J.; Bindraban, P.S.; Brandenburg, W.A. Claims and Facts on Jatropha curcas L. Global Jatropha curcas Evaluation, Breeding and Propagation Programme. Report 158; Plant Research International B.V., Wageningen Stichting Het Groene Woudt: Laren, The Netherlands, 2007. [Google Scholar]
  57. Montes Osorio, L.R.; Van Loo, E.N.R.; Jongshaap, R.E.E.; Visser, R.G.H.; Azurdia, C. Global Jatropha curcas Genetic Diversity Study and its Application in Breeding Programs. In JatrophaWorld 2008: An OUTSTANDING Event – Two Thumbs Up, Miami, FL, USA, June 2008.

Appendix 1. DNA fragment profiles showing microsatellite loci assayed with primer JcSSR7 using eight different J. curcas accessions as genomic DNA templates. A, SLK2; B, BRA1; C, BER1; D, TOG3; E, LOL1; F, SEL2; G, ENG3; H, PET1; I, CLO4; and J, HDE4. All varieties proved to be homozygous for a 200 bp long allele, whereas the Mexican accessions revealed both homozygous and heterozygous loci for alleles of 202 bp, and 196 bp and 200 bp in length, respectively.
Diversity 02 00810 g008
Appendix 2. DNA fragment profiles showing two different alleles in each of the heterozygous loci investigated. A, JcSSR2; B, JcSSR4; C, JcSSR9; D, JcSSR3; E, JcSSR2, and F, JcSSR10.
Diversity 02 00810 g009

