Article

Molecular Characterization of the Archaeal Community in an Amazonian Wetland Soil and Culture-Dependent Isolation of Methanogenic Archaea

Cell and Molecular Biology Laboratory, Centro de Energia Nuclear na Agricultura, Universidade de São Paulo, Av. Centenário–303, CEP. 13.416–000, Piracicaba, SP, Brazil
*
Author to whom correspondence should be addressed.
Diversity 2010, 2(7), 1026-1047; https://doi.org/10.3390/d2071026
Submission received: 10 June 2010 / Revised: 14 July 2010 / Accepted: 15 July 2010 / Published: 22 July 2010
(This article belongs to the Special Issue Microbial Diversity: From the Biosphere to the Human Microbiome)

Abstract

:
Tropical wetlands are the major natural source of methane released into the atmosphere, producing about 60% of all natural emissions. The great wetland areas of the Amazon basin are the largest source of methane in this region, contributing an estimated 5% of the total emissions from the world’s flooded areas. However, despite the important role that methanogenic archaea play in these environments, there have been few studies on the composition of their archaeal communities. In this survey, four 16S rRNA archaeal clone libraries from different depths were constructed to examine the archaeal community in an Amazon wetland soil. A total of 599 clones were used to perform diversity and phylogenetic analyses. A broad, diverse archaeal community was found at the site, with the diversity decreasing as the depth increased (Shannon index range: 2.40–1.94). Phylogenetic analysis revealed sequences belonging to two archaeal phyla, with 65% classified as Crenarchaeota and 35% classified as Euryarchaeota. Within the Euryarchaeota group, most sequences were clustered into the Methanococci and Methanomicrobia classes, two groups of methanogens. Based on the abundance of methanogenic organisms, culture–dependent isolation was used to isolate these organisms. To enhance the growth of methanogenic archaea, a modified atmosphere (H2:CO2 = 80:20) was established combined with an anoxic environment for 18 months. Among the isolates, the genera Methanosarcina and Methanobacterium were detected throughout the anaerobic in vitro cultivation, indicating a possible role for these organisms in methane production. In conclusion, these exploratory molecular and culture–dependent approaches enhance our understanding of the archaeal community and methanogenic archaea living in wetland soils of the eastern Amazon and their role in methane production.

1. Introduction

The Amazon has two main types of ecosystems: várzea and terra firme. The flooded forests occupy about 20% of the Amazon biome, their main feature being the cyclical fluctuation of rivers, which can reach a difference of up to 14 m between the drought and flood seasons. The periodic flooding of large areas along the riverbank has resulted in significant adaptations by the plants and animals living in these ecosystems (várzeas and igapós). Wetland soils (várzea) are located on the banks of whitewater rivers and are seasonally flooded (Figure 1). Tropical wetlands are the major natural source of methane for the atmosphere, producing about 60% of all natural emissions [1]. The Amazon River basin covers a large portion of the humid tropics, and the drainage network of this river spans over one million square kilometers [2]. The wetlands of the Amazon basin are the largest natural source of methane in this region, contributing an estimated 5% of the total emissions from the world’s flooded areas [3]. Amazonian wetland soils are seasonally flooded, and the annual flood deposits a new layer of fertile sediment, leaving the land free of invaders and pests at least once a year when the waters recede [4].
Figure 1. Amazonian wetlands.
Diversity 02 01026 g001
In these flooded areas, the soil microbiota contributes to the generation and release of the gases carbon dioxide (CO2) and methane (CH4) into the atmosphere through the processes of aerobic and anaerobic decomposition of organic matter [1]. Methane is produced by methanogenic archaea by the anaerobic degradation of organic matter. Methanogenic archaea are obligate anaerobic microorganisms that require anoxic and highly reducing growth conditions. They convert a relatively limited number of simple substrates into methane; thus, in habitats with complex organic substrates, they interact with other anaerobic microorganisms that catabolize complex substrates into simple substrates [5]. Methane, like carbon dioxide and nitrous oxide, is an important atmospheric trace gas. The ability of methane to absorb infrared radiation makes it 20 to 30 times more efficient than carbon dioxide as a greenhouse gas [6]. Wetlands are one of the major sources of atmospheric methane, contributing around 70% of the total emissions, or about 100 Tg CH4 year−1. Globally, wetlands are concentrated in the high latitude regions of the Northern Hemisphere and in tropical regions, between 20° N and 30° S. Although only 35% of wetlands are found in tropical areas, their annual contribution of methane is estimated at 42 Tg CH4 year−1 [1], or 36.5% of total emissions from this source, with the remainder split between wetlands in subtropical, temperate and boreal regions. Thus, tropical wetlands play an important role in the global balance of this gas [7].
Due to its large wetland areas, the Amazon plain plays a key role in the flow of methane. However, while several studies have been conducted on methane emissions in this region [8,9,10,11], none have determined whether these emissions are due to the burning of biomass and fossil fuels or whether they could have a microbial origin. Thus, the aim of this study was to increase our understanding of the diversity of archaeal communities in an Amazon floodplain using molecular and culture techniques.

2. Materials and Methods

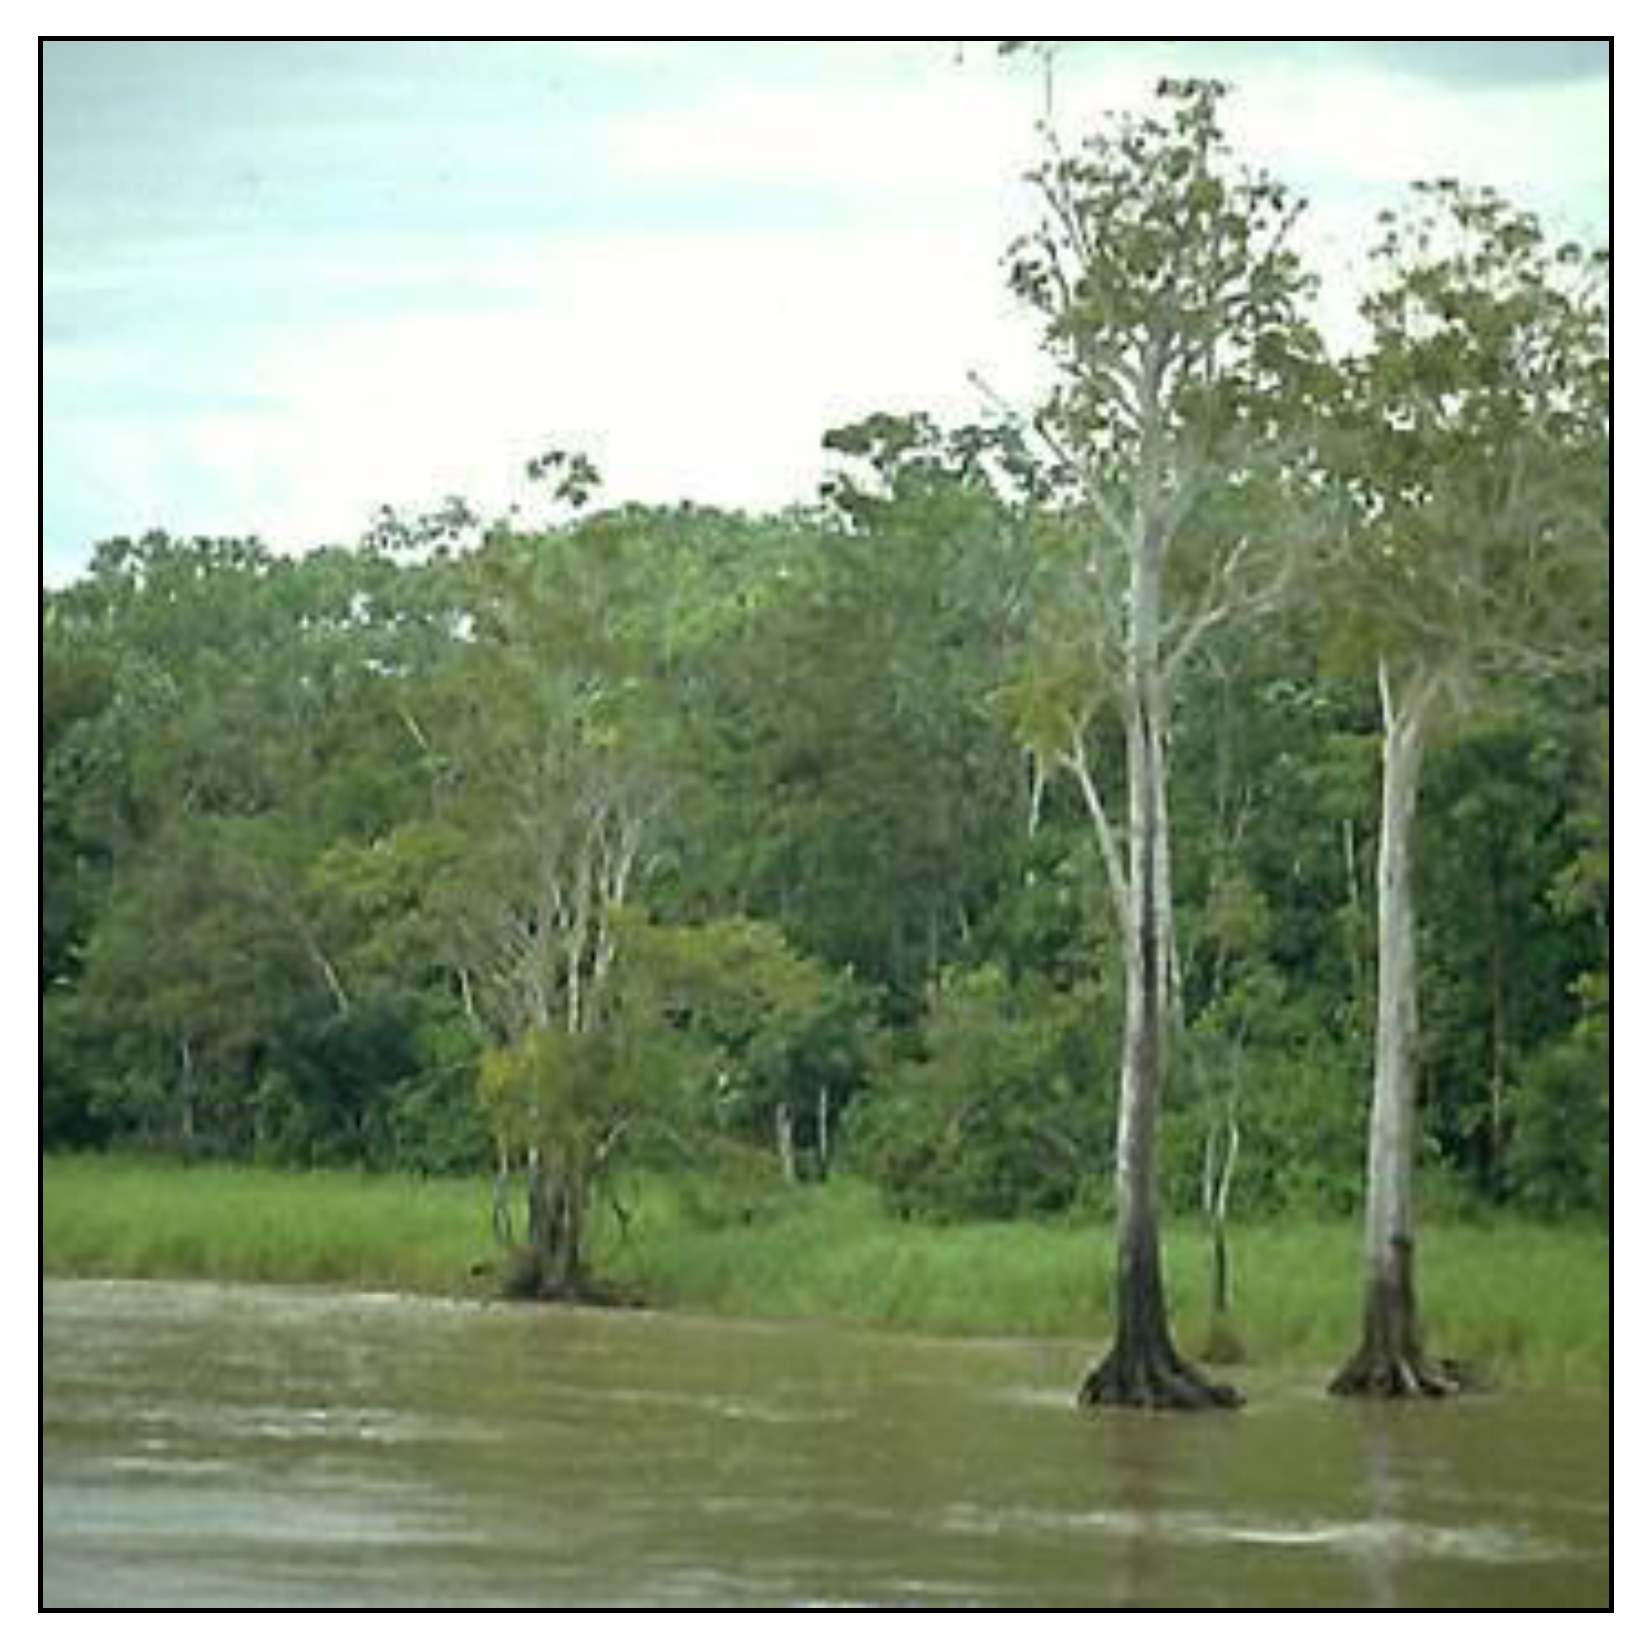
2.1. Study Sites and Soil Samples

The study areas were located in central-western Pará, in the middle region of the Lower Amazon, in the Santarém municipality. The region has the general characteristics of a hot humid climate, with average temperatures between 25–26 °C, and maximum and minimum annual temperatures between 30–31 °C and 21–23 °C, respectively. The annual rainfall figures oscillate around 2,000 mm, with an uneven distribution throughout the year due to two distinct rainy periods. Seventy percent of the annual precipitation falls during the rainiest period between December and June [12]. Various types of land relief can be found in the region, each with different degrees of dissection, soil and vegetation cover [13]. The main types of soil identified on the Belterra Plateau are Yellow Latosols, Yellow Ultisols, Quartzarenic Entisols, Fluvisol Entisols and Gleysols [13].
Wetland soil samples were collected at the EMBRAPA (Empresa Brasileira de Pesquisa Agropecuária) farm in Cacoal Grande, Oriental Amazon, Santarém municipality (02° 23' 20" S and 54° 19' 39.5" W). The soil is not being cultivated, although it is occasionally used for raising buffalo livestock. Twelve samples of wetland soil were collected at four depths: 0–20, 20–40, 40–70 and 70–100 cm, each with four samples in triplicate. The samples were collected in 1 m3 trenches using PVC pipes 1 inch in diameter and 25 cm in length (Figure 2). The tubes were inserted horizontally into the trench and subsequently capped and sealed with tape. The samples were packed in coolers with ice and taken to the laboratory for the microbiological analyses.
Figure 2. Sampling methodology (left) and PCV pipes (right).
Diversity 02 01026 g002

2.2. Construction of Archaeal 16S rRNA Gene Clone Libraries

For this study, four archaeal 16S rRNA gene libraries were constructed from wetland soil sampled at each of the four depths: 00–20, 20–40, 40–70 and 70–100 cm, respectively called VZ 0–20, VZ 20–40, VZ 40–70 and VZ 40–100. Soil genomic DNA was extracted in triplicate using PowerSoil DNA Isolation Kits (Mobio Laboratories, Carlsbad, USA) and then pooled. DNA quality was then verified on 1% agarose gels. The primers ARCH21f and ARCH958r [14] were used to construct archaeal 16S rRNA sequence libraries, which generate fragments of approximately 937 base pairs (bp). The amplified fragments were purified and cloned into the vector pGEM–T Easy (Promega) according to the manufacturer’s instructions. After cloning the fragments, 3 μL of the ligation product were transformed by electroporation into 40 μL aliquots of E. coli JM109 competent cells. For the electroporation, the mixture was transferred to a pre-chilled 0.2-cm electroporation cuvette (BioRad) and placed in the electroporation chamber. The samples were subjected to an electric shock of 1.8 kV using a GenePulser II electroporator (BioRad). The transformed competent cells were grown in Petri dishes containing solid LB medium plus ampicillin, X-gal and IPTG and incubated at 37 °C for 16 h. Clones were selected based on blue-white screening and ampicillin resistance and then on the isolation of plasmids with an appropriately sized insert. For clone sequencing, a 200 ng aliquot of plasmid DNA, 5 pmoles μL−1 T7 primer, 2 μL DYEnamic ET Terminator (Amersham Biosciences), 2 μL reaction buffer (200 mM Tris-HCl [pH 9.0] and 5 mM MgCl2.6H2O) and ultrapure water were added to a final volume of 10 μL. Sequencing was performed on an ABI PRISM 3100 Genetic Analyzer (Applied Biosystems, USA).

2.3. Data Analysis

The chromatograms generated from the archaeal 16S rRNA sequencing were analyzed using the programs Phred, Phrap and Consed on a Linux operating system [15,16,17]. Vector sequence and low quality bases were removed, and only sequences with a quality >20 (1 error per 100 bases read) were considered for subsequent analysis. The RDP Classifier software (http://rdp.cme.msu.edu/Classifier/classifier.jsp) were used to determine the taxonomic affiliation of the sequences by comparing the retrieved 16S rRNA sequences with sequences deposited in the Ribosomal Database Project (http://rdp.cme.msu.edu). The number of operational taxonomic units (OTUs) was determined using DOTUR (distance-based OTU and richness determination) software [18]. For this purpose, the sequences were aligned using the site GreenGenes (http://greengenes.lbl.gov/cgi–bin/nph–index.cgi) and a matrix of evolutionary distance was calculated with the program PHYLIP 3.63 DNAdist (Jukes-Cantor algorithm) [19]. Considering an evolutionary distance of 0.03 to define an OTU, the richness of OTUs was estimated with DOTUR while employing the nonparametric methods Chao1 and Jackknife. It was also determined the Shannon diversity index, the Simpson reciprocal index and the sampling coverage index using DOTUR. The libraries were compared using the program ∫-Libshuff [20], which determines the probability of two libraries being different from each other based on homologous and heterologous coverage curves.

2.4. Culture-Dependent Isolation of Methanogenic Archaea

To isolate methanogenic microorganisms, sample enrichment, serial dilution and roll-tube technique colony isolation experiments were used. Additional details about these techniques are described in Deevong et al. [21]. Methanogenic archaea were cultured using a variation of the simultaneous gas distribution system [22] for culturing anaerobes, as proposed by Vazoller [23]. The simultaneous gas distribution system contains pure nitrogen and mixtures of nitrogen:carbon dioxide (70:30) and hydrogen:carbon dioxide (80:20). For the enrichment of cultures, a 10% sodium bicarbonate and vitamin solutions were used, and sodium acetate, formate and methanol was used as a carbon source. A 0.025% vancomycin hydrochloride solution was used to aid the purification of methanogenic archaea cultures. Methane produced by the cultures was monitored using gas chromatography (GC) by determining the percentage of methane gas produced in the free atmosphere of the system. The GC analyses were performed in a gas chromatograph model HP6850A with a flame ionization detector (FID). Microbial characterizations were performed over the course of the enrichment and purification experiment using phase and fluorescence microscopy to observe the predominant cellular morphologies and the presence of methanogenic archaea, as described in Schneider et al. [24]. After growing the culture, genomic DNA was extracted from the methanogenic archaea according to Massana et al. [25]. The amplification of 16S rDNA gene was performed on these samples with the primers ARCH21f and ARCH958r [14]. Cloning, transformation and plasmid DNA extraction were performed as described in Section 2.2. To verify the purity of the methanogenic archaeal cultures, clone libraries were constructed for analysis using the ARDRA (amplified ribosomal DNA restriction analysis) technique. After reamplifying the plasmid DNA with primers ARCH21f and ARCH958r, PCR products were subjected to individual restriction analysis with two different endonucleases, a frequent cutter (HaeIII) and a rare cutter (HindIII). After picking clones based on the ARDRA reaction, 16S rRNA gene sequencing was performed to identify and classify the isolated organisms. Representative clones from each restriction pattern were sequenced and used to query the NCBI database. Taxonomic classification of the sequences was performed with RDP Classifier using the maximum level of restriction (confidence threshold: 95%).

2.5. Morphological Characterization of Methanogenic Cultures

Microbial characterization was performed over the course of the enrichment and purification experiment, using phase and fluorescence microscopy to observe the predominant cellular morphologies and the presence of methanogenic archaea, which exhibit fluorescence under UV light due to the F420 enzyme and emit a bluish light when exposed to wavelengths in the ultraviolet range.
Optical microscopy: The slides used to detect autofluorescence and observe cellular morphology were prepared under aseptic conditions. The slides were observed using a Zeiss Axiovert S100 microscope with a CCD Hamamatsu camera, and the images were processed using KS400 Imaging System 3.0 software. The slides were first examined under phase contrast to observe the cellular morphologies. To visualize sample autofluorescence, UV light and the DAPI filter (365 nm emission and 397 nm excitation) were used, which makes the autofluorescent cells appear blue.
Scanning electron microscopy: A protocol adapted from Schneider et al. [24] was used to observe cells by scanning electron microscopy (DSM 940A, Zeiss). To collect the cells, aliquots of the culture medium were removed with the aid of 1 mL sterile syringes and filtered through a 0.22-µm cellulose acetate membrane. The cells were fixed with 2% glutaraldehyde in 0.05 M cacodylate buffer, pH 7.2 for 10 minutes, then washed and treated twice with a 1% OsO4 buffer for 1 hour. The cells were dehydrated in a graded ethanol series (25, 50, 75, 95 and 100%), washed once with hexamethyldisilazane and dried overnight at room temperature. The cells were subsequently coated with gold and carbon and observed under an electron microscope.

3. Results and Discussion

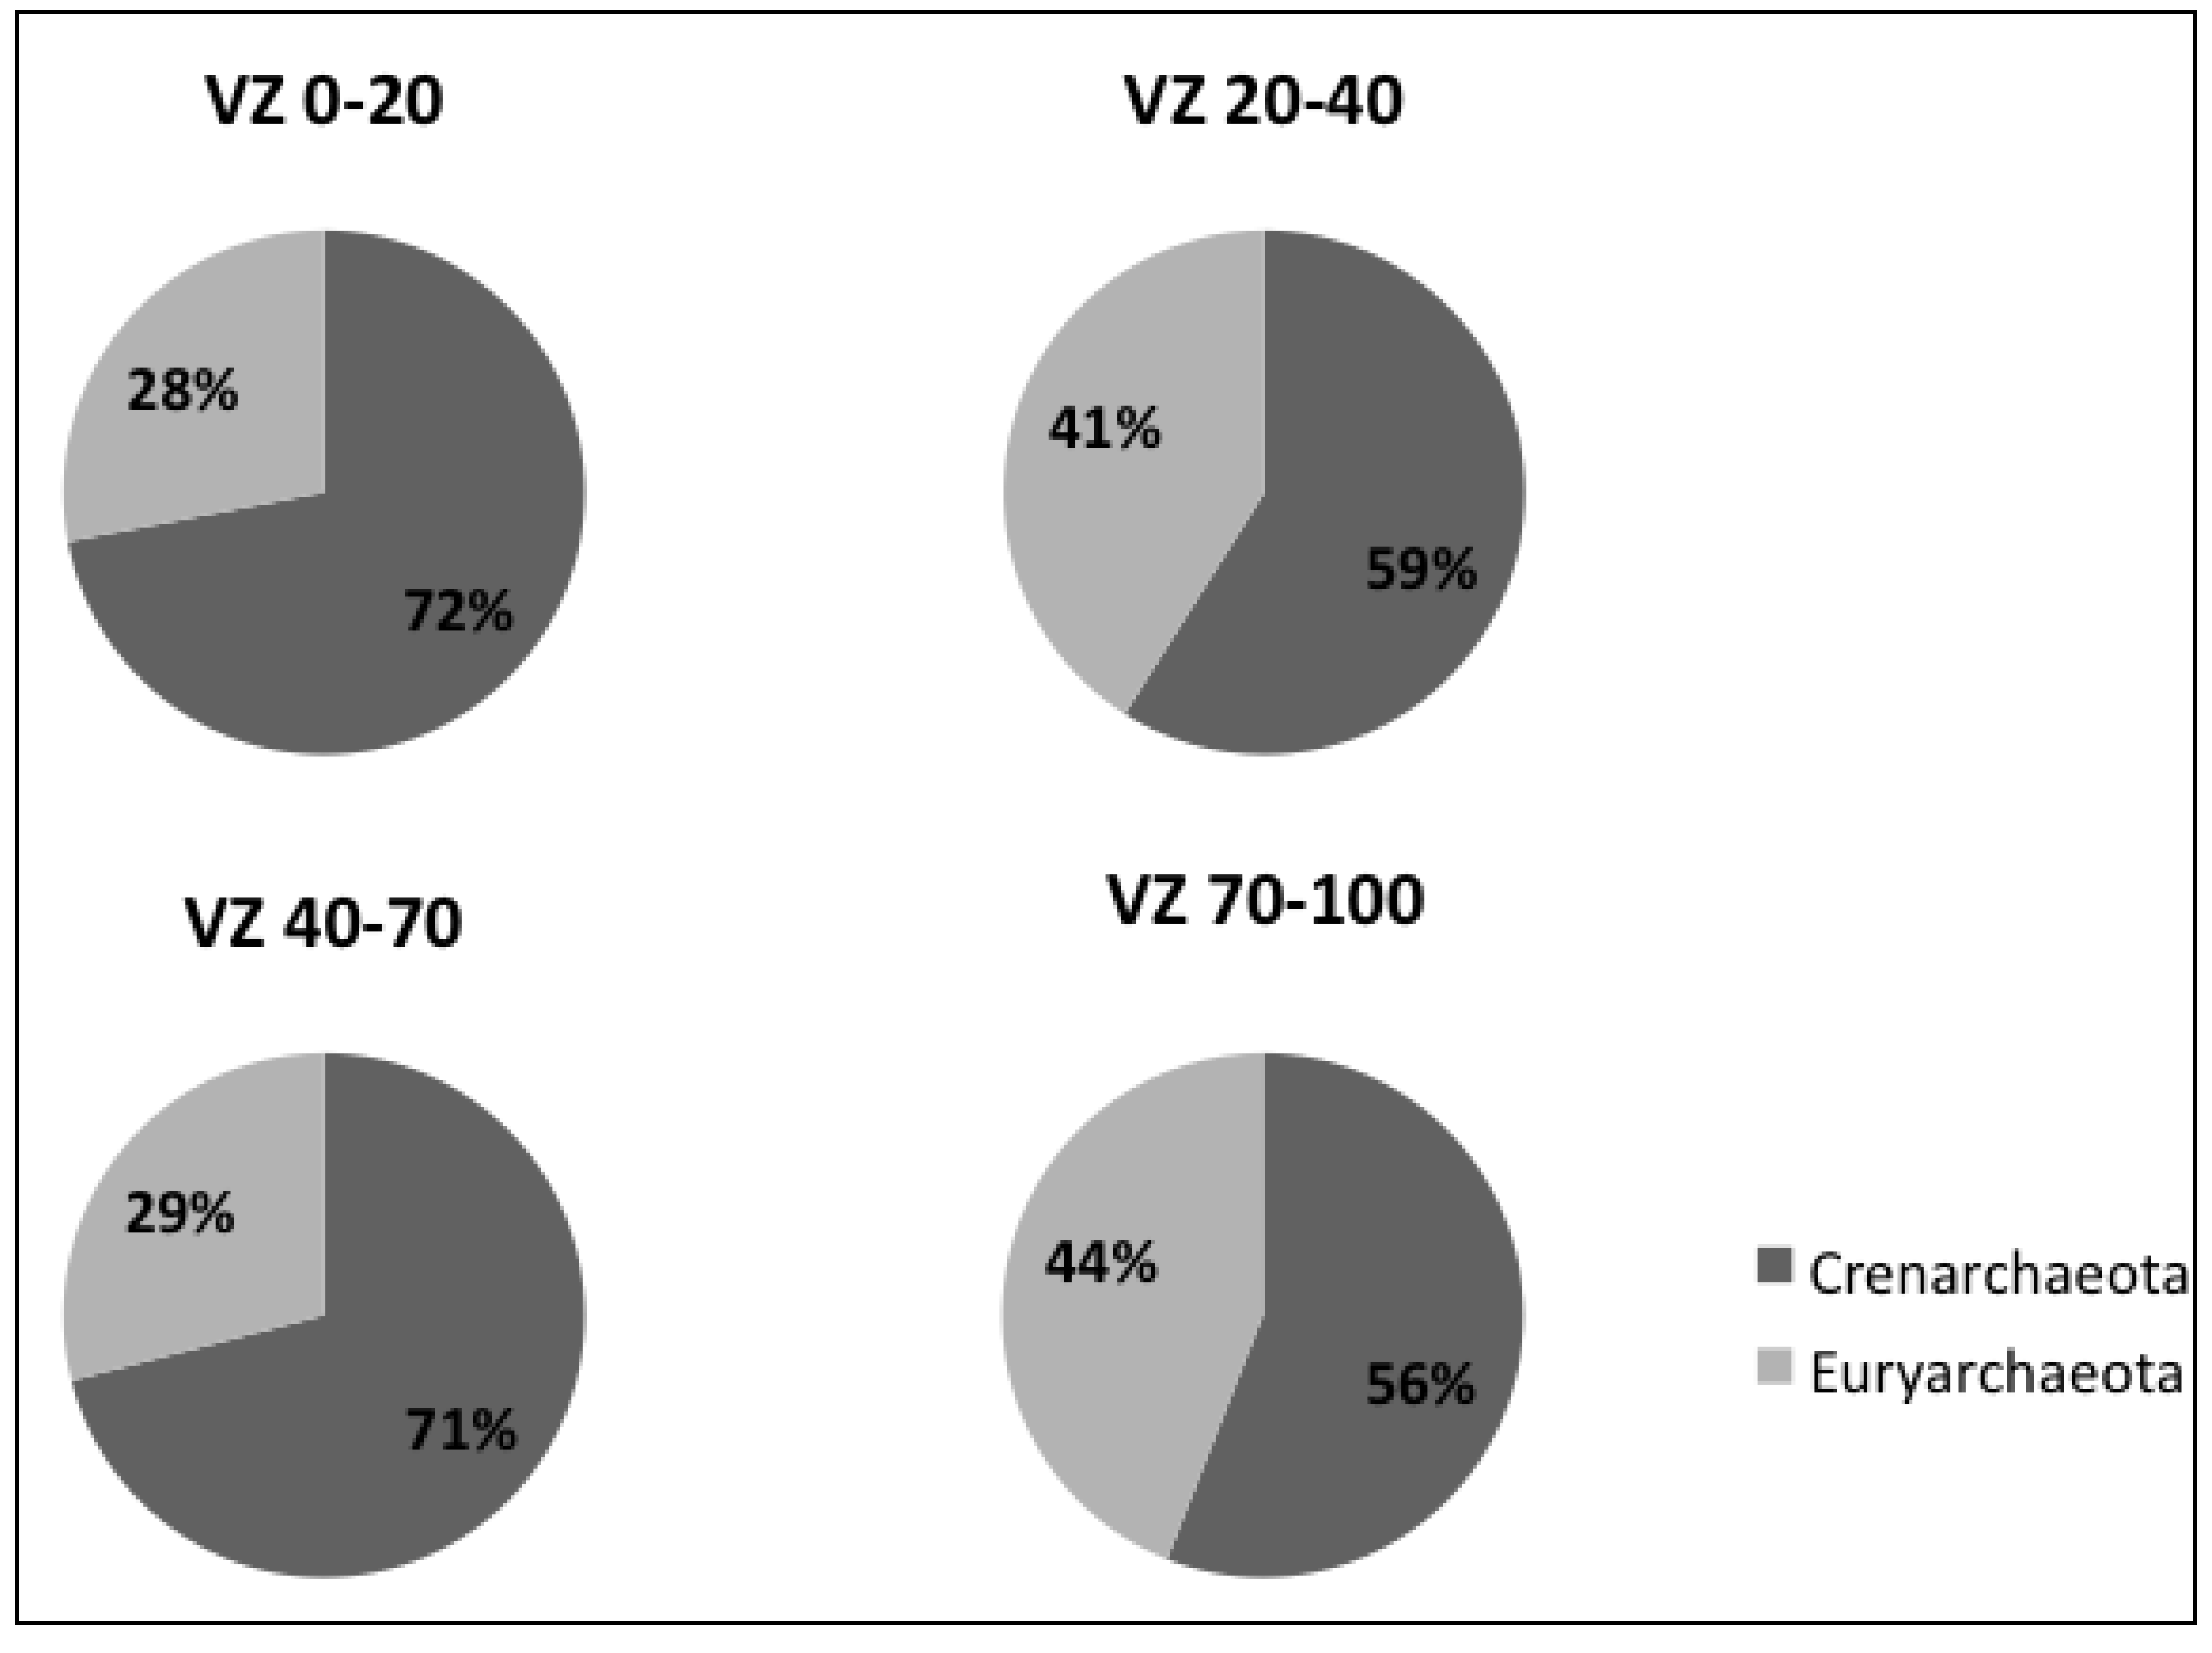
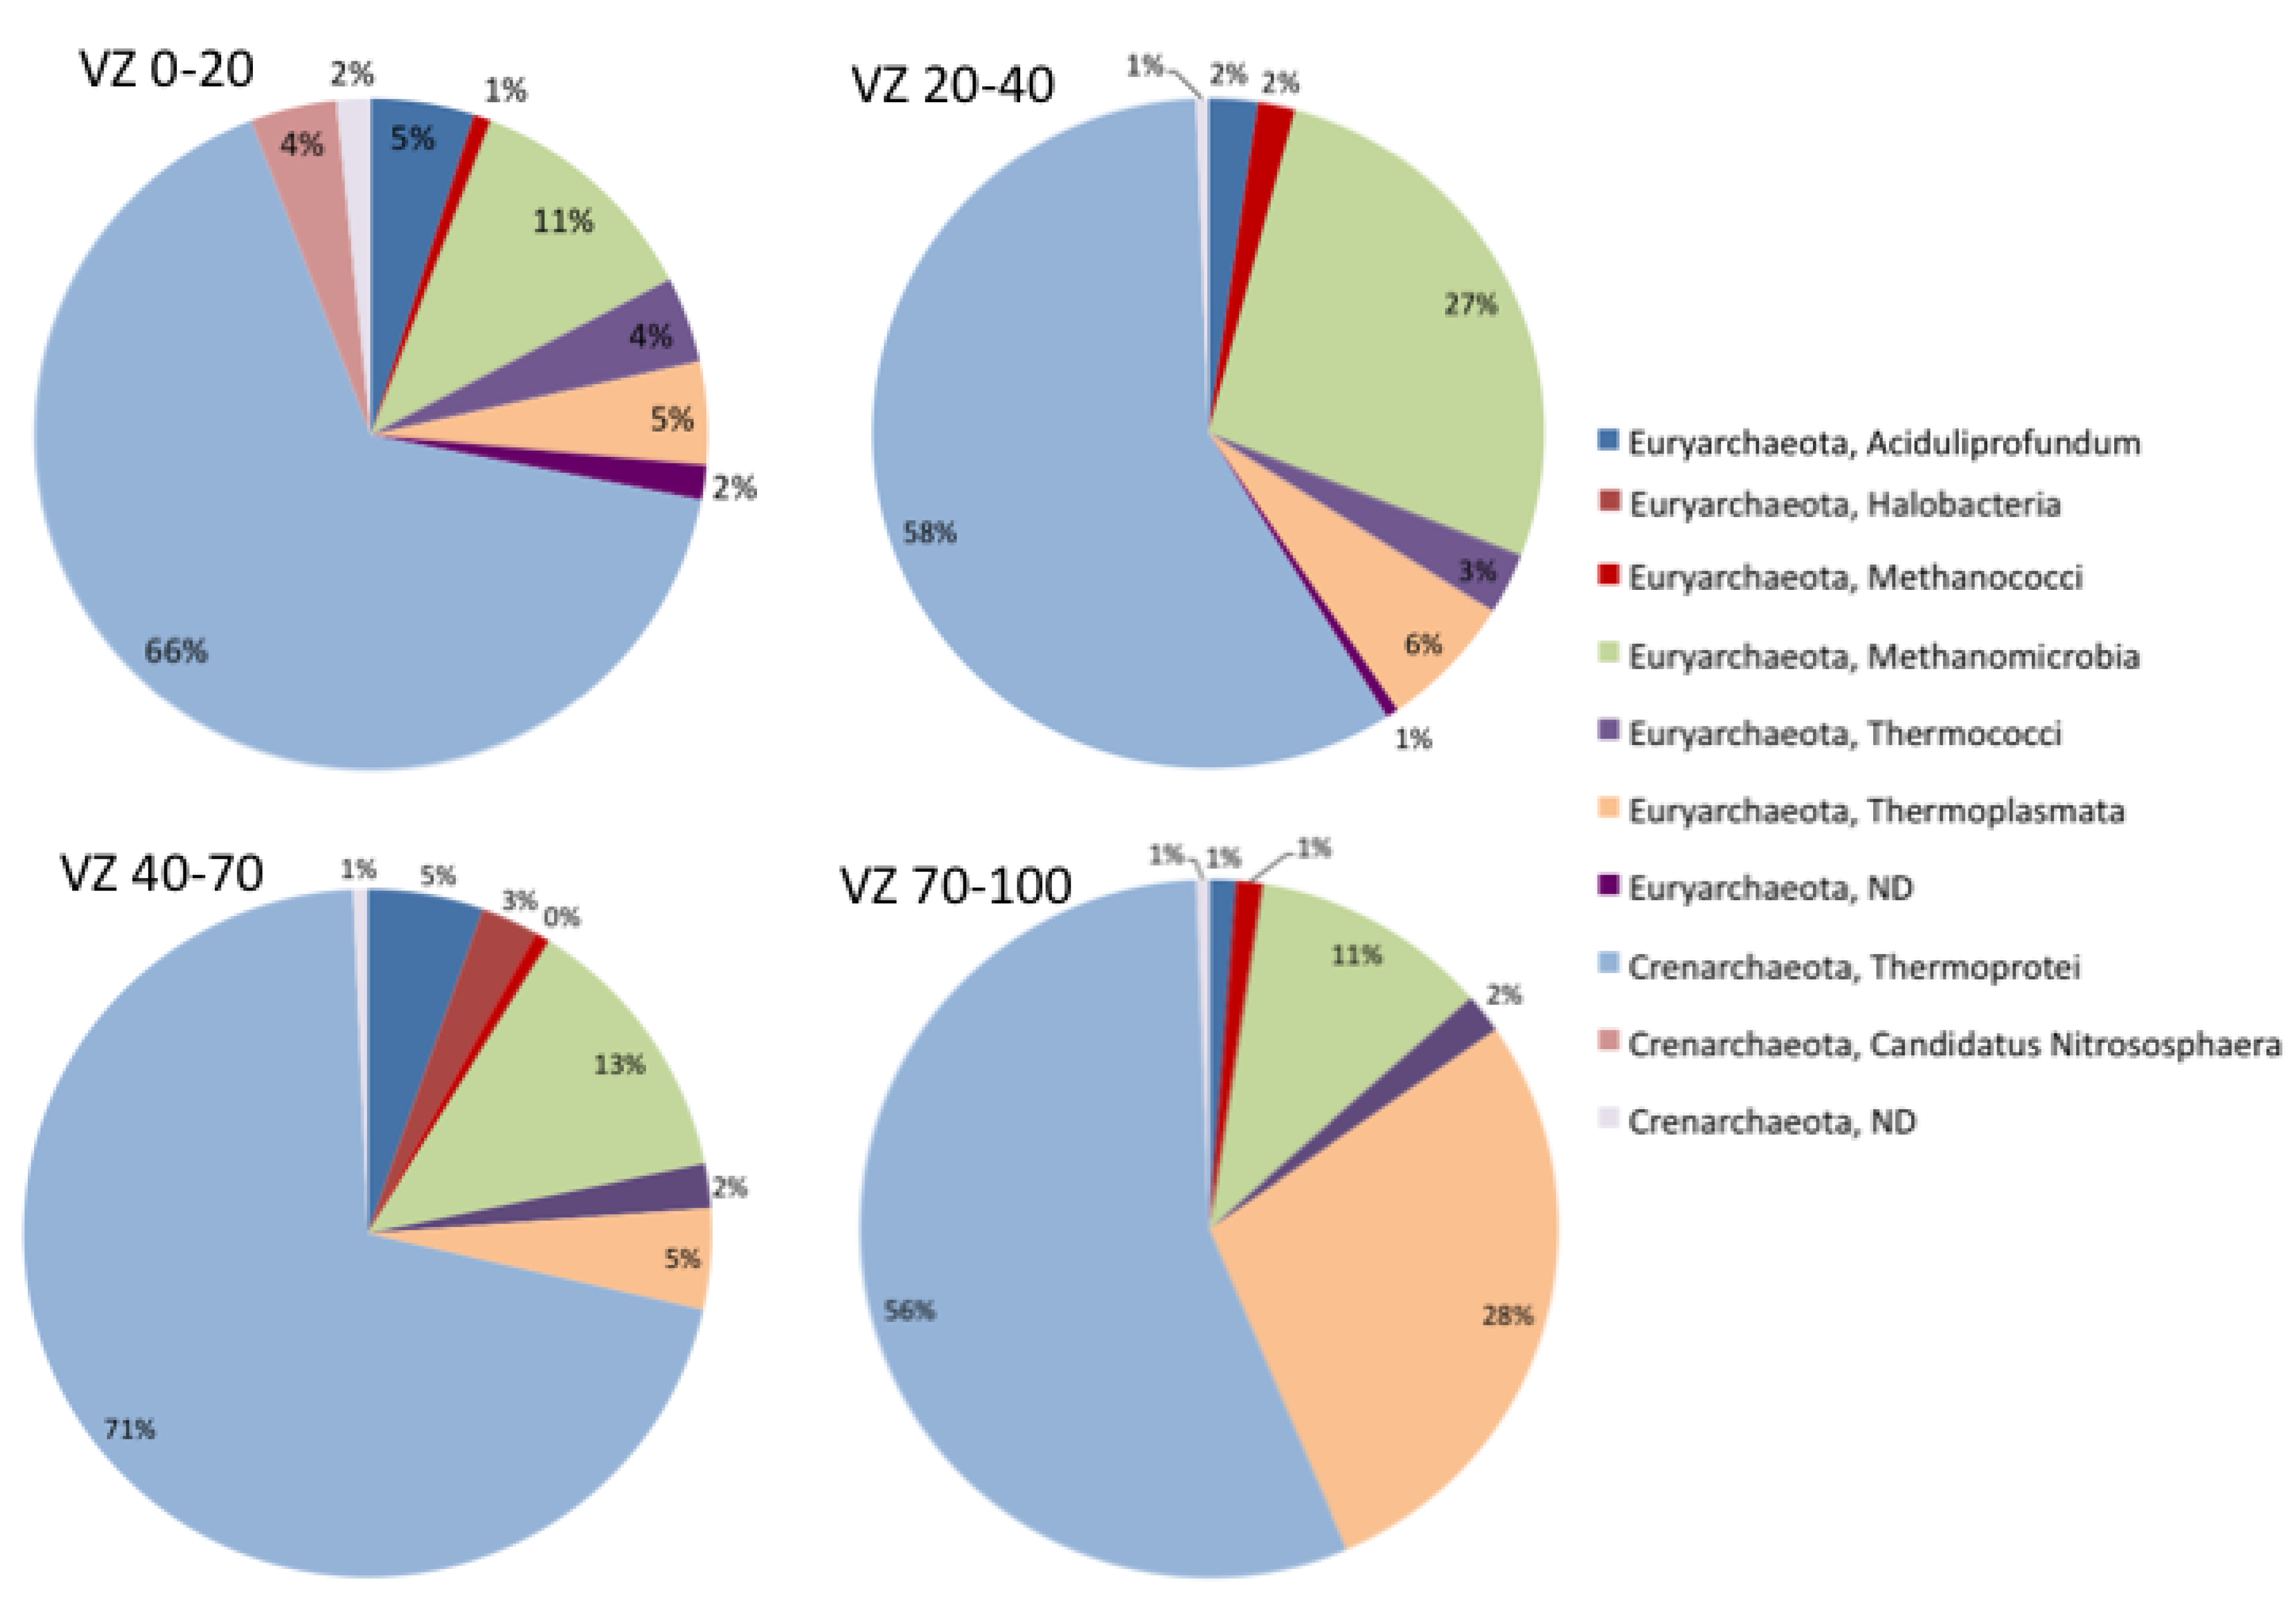
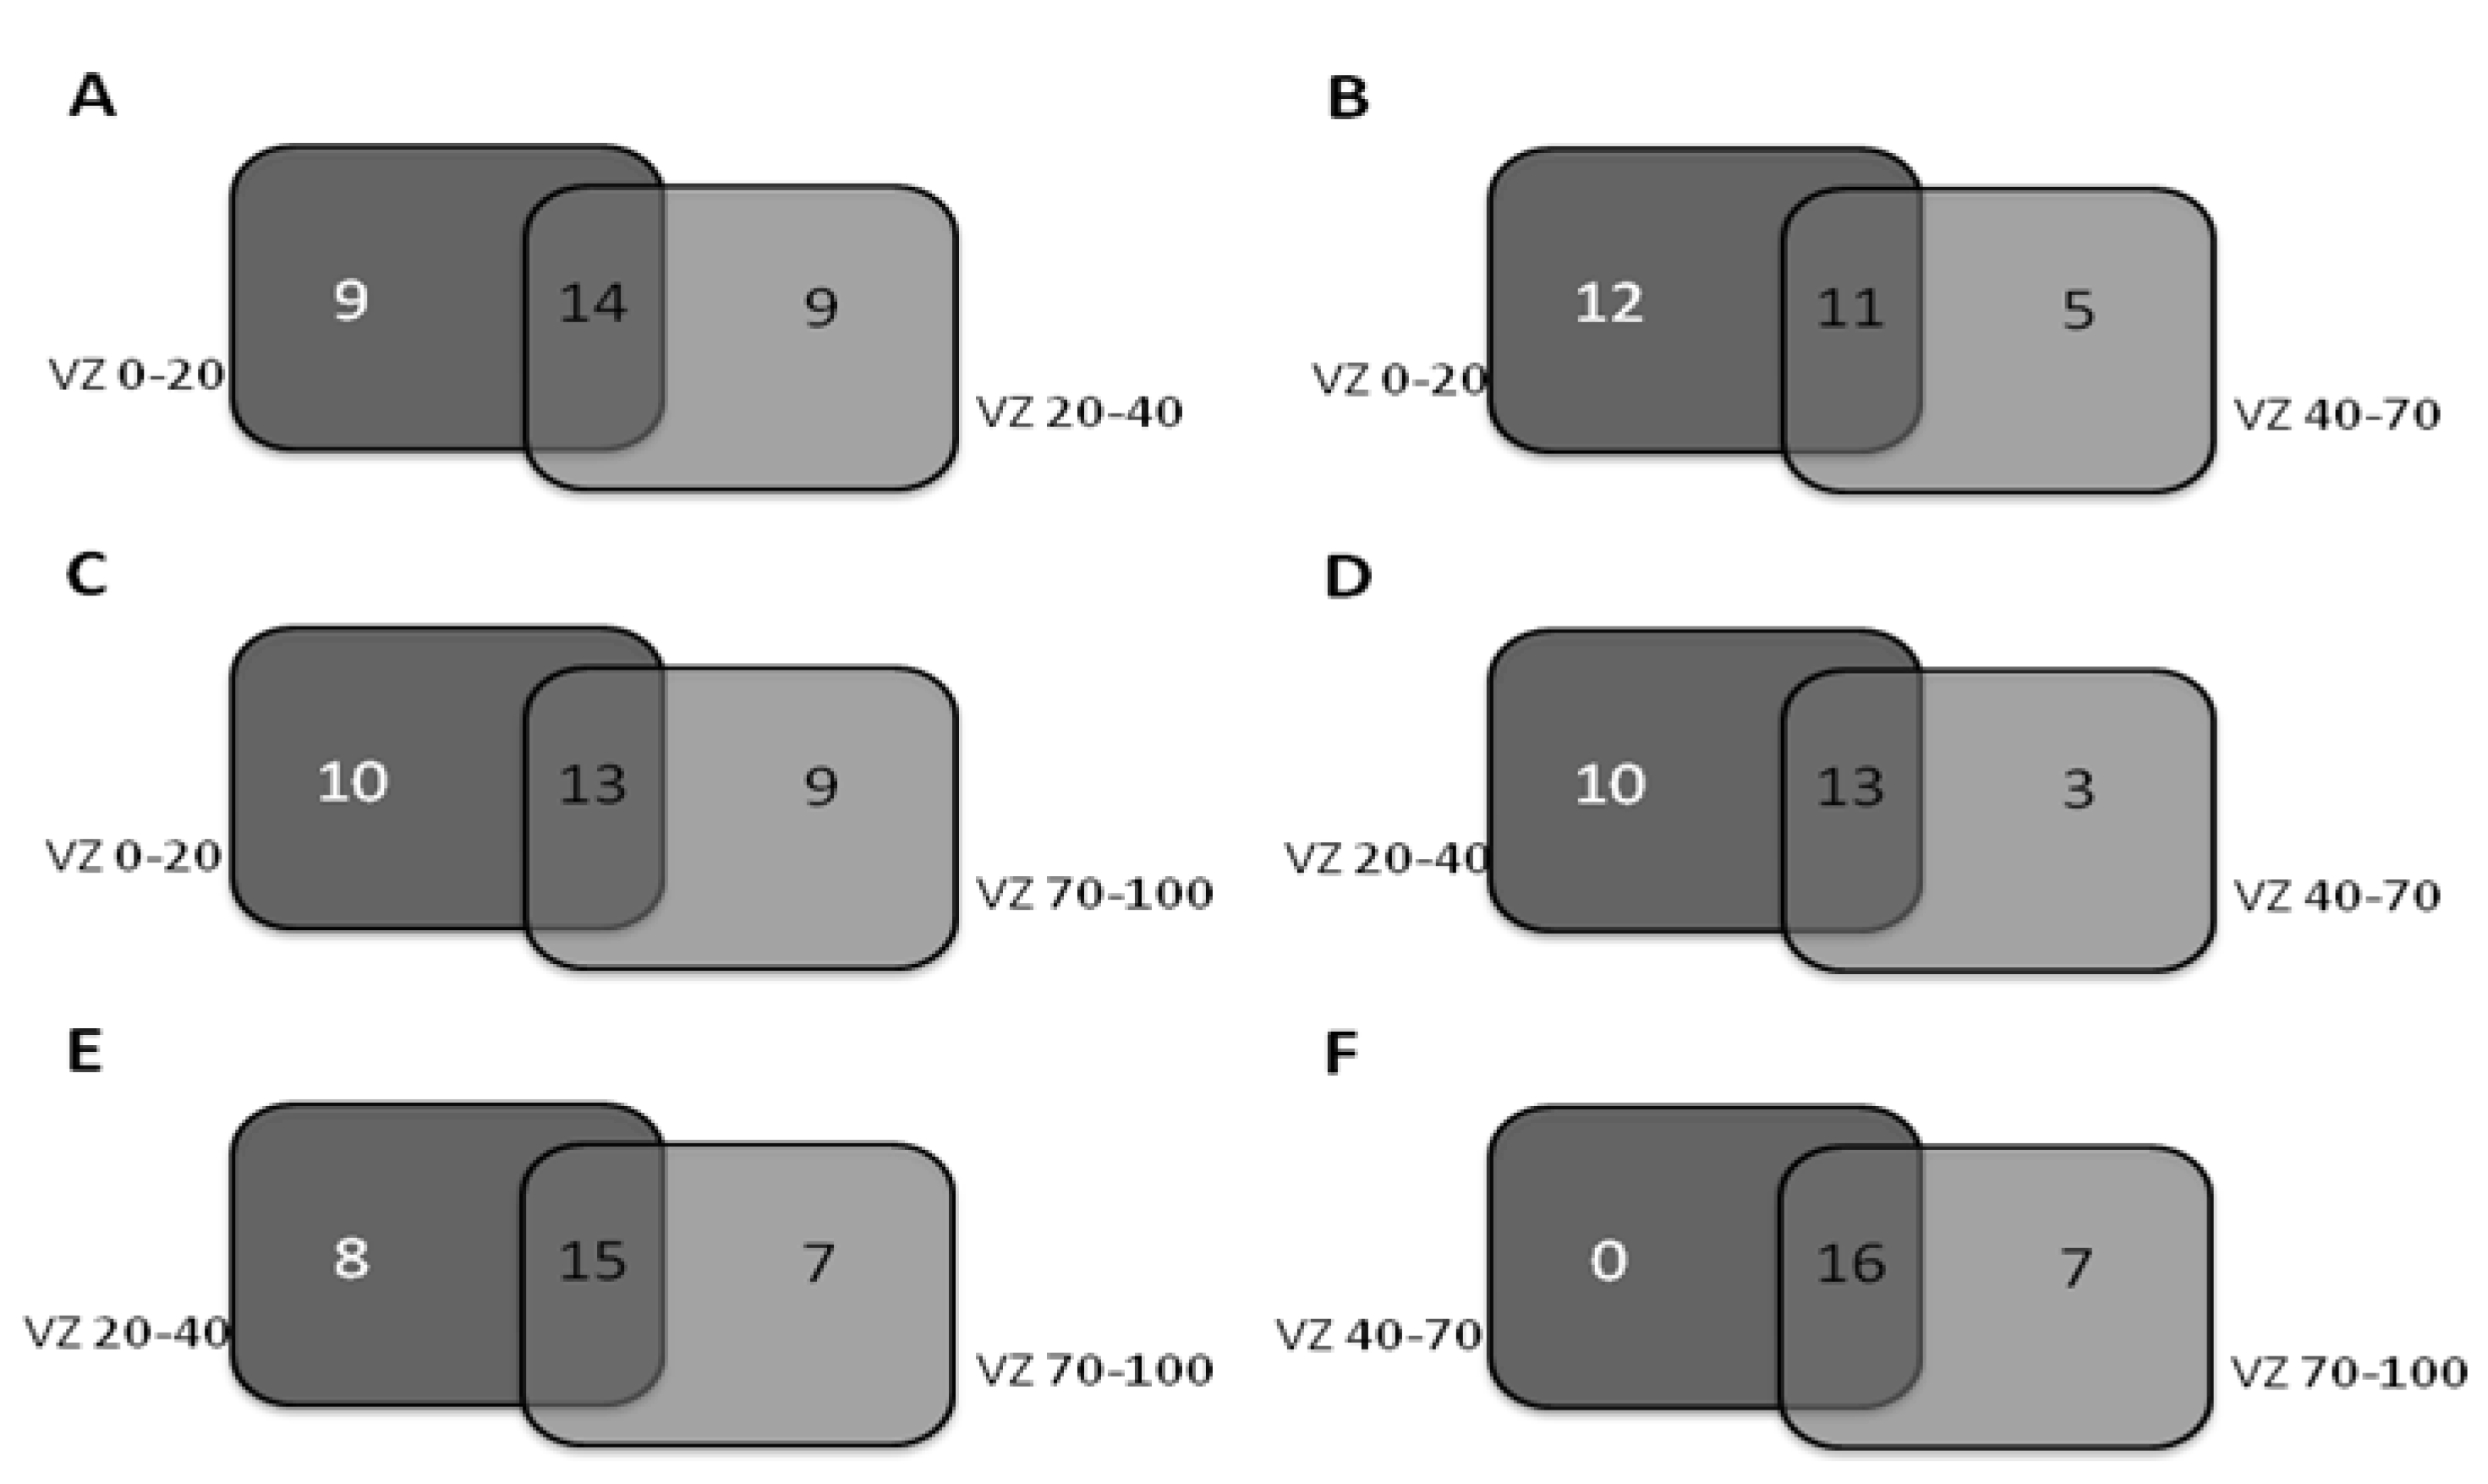
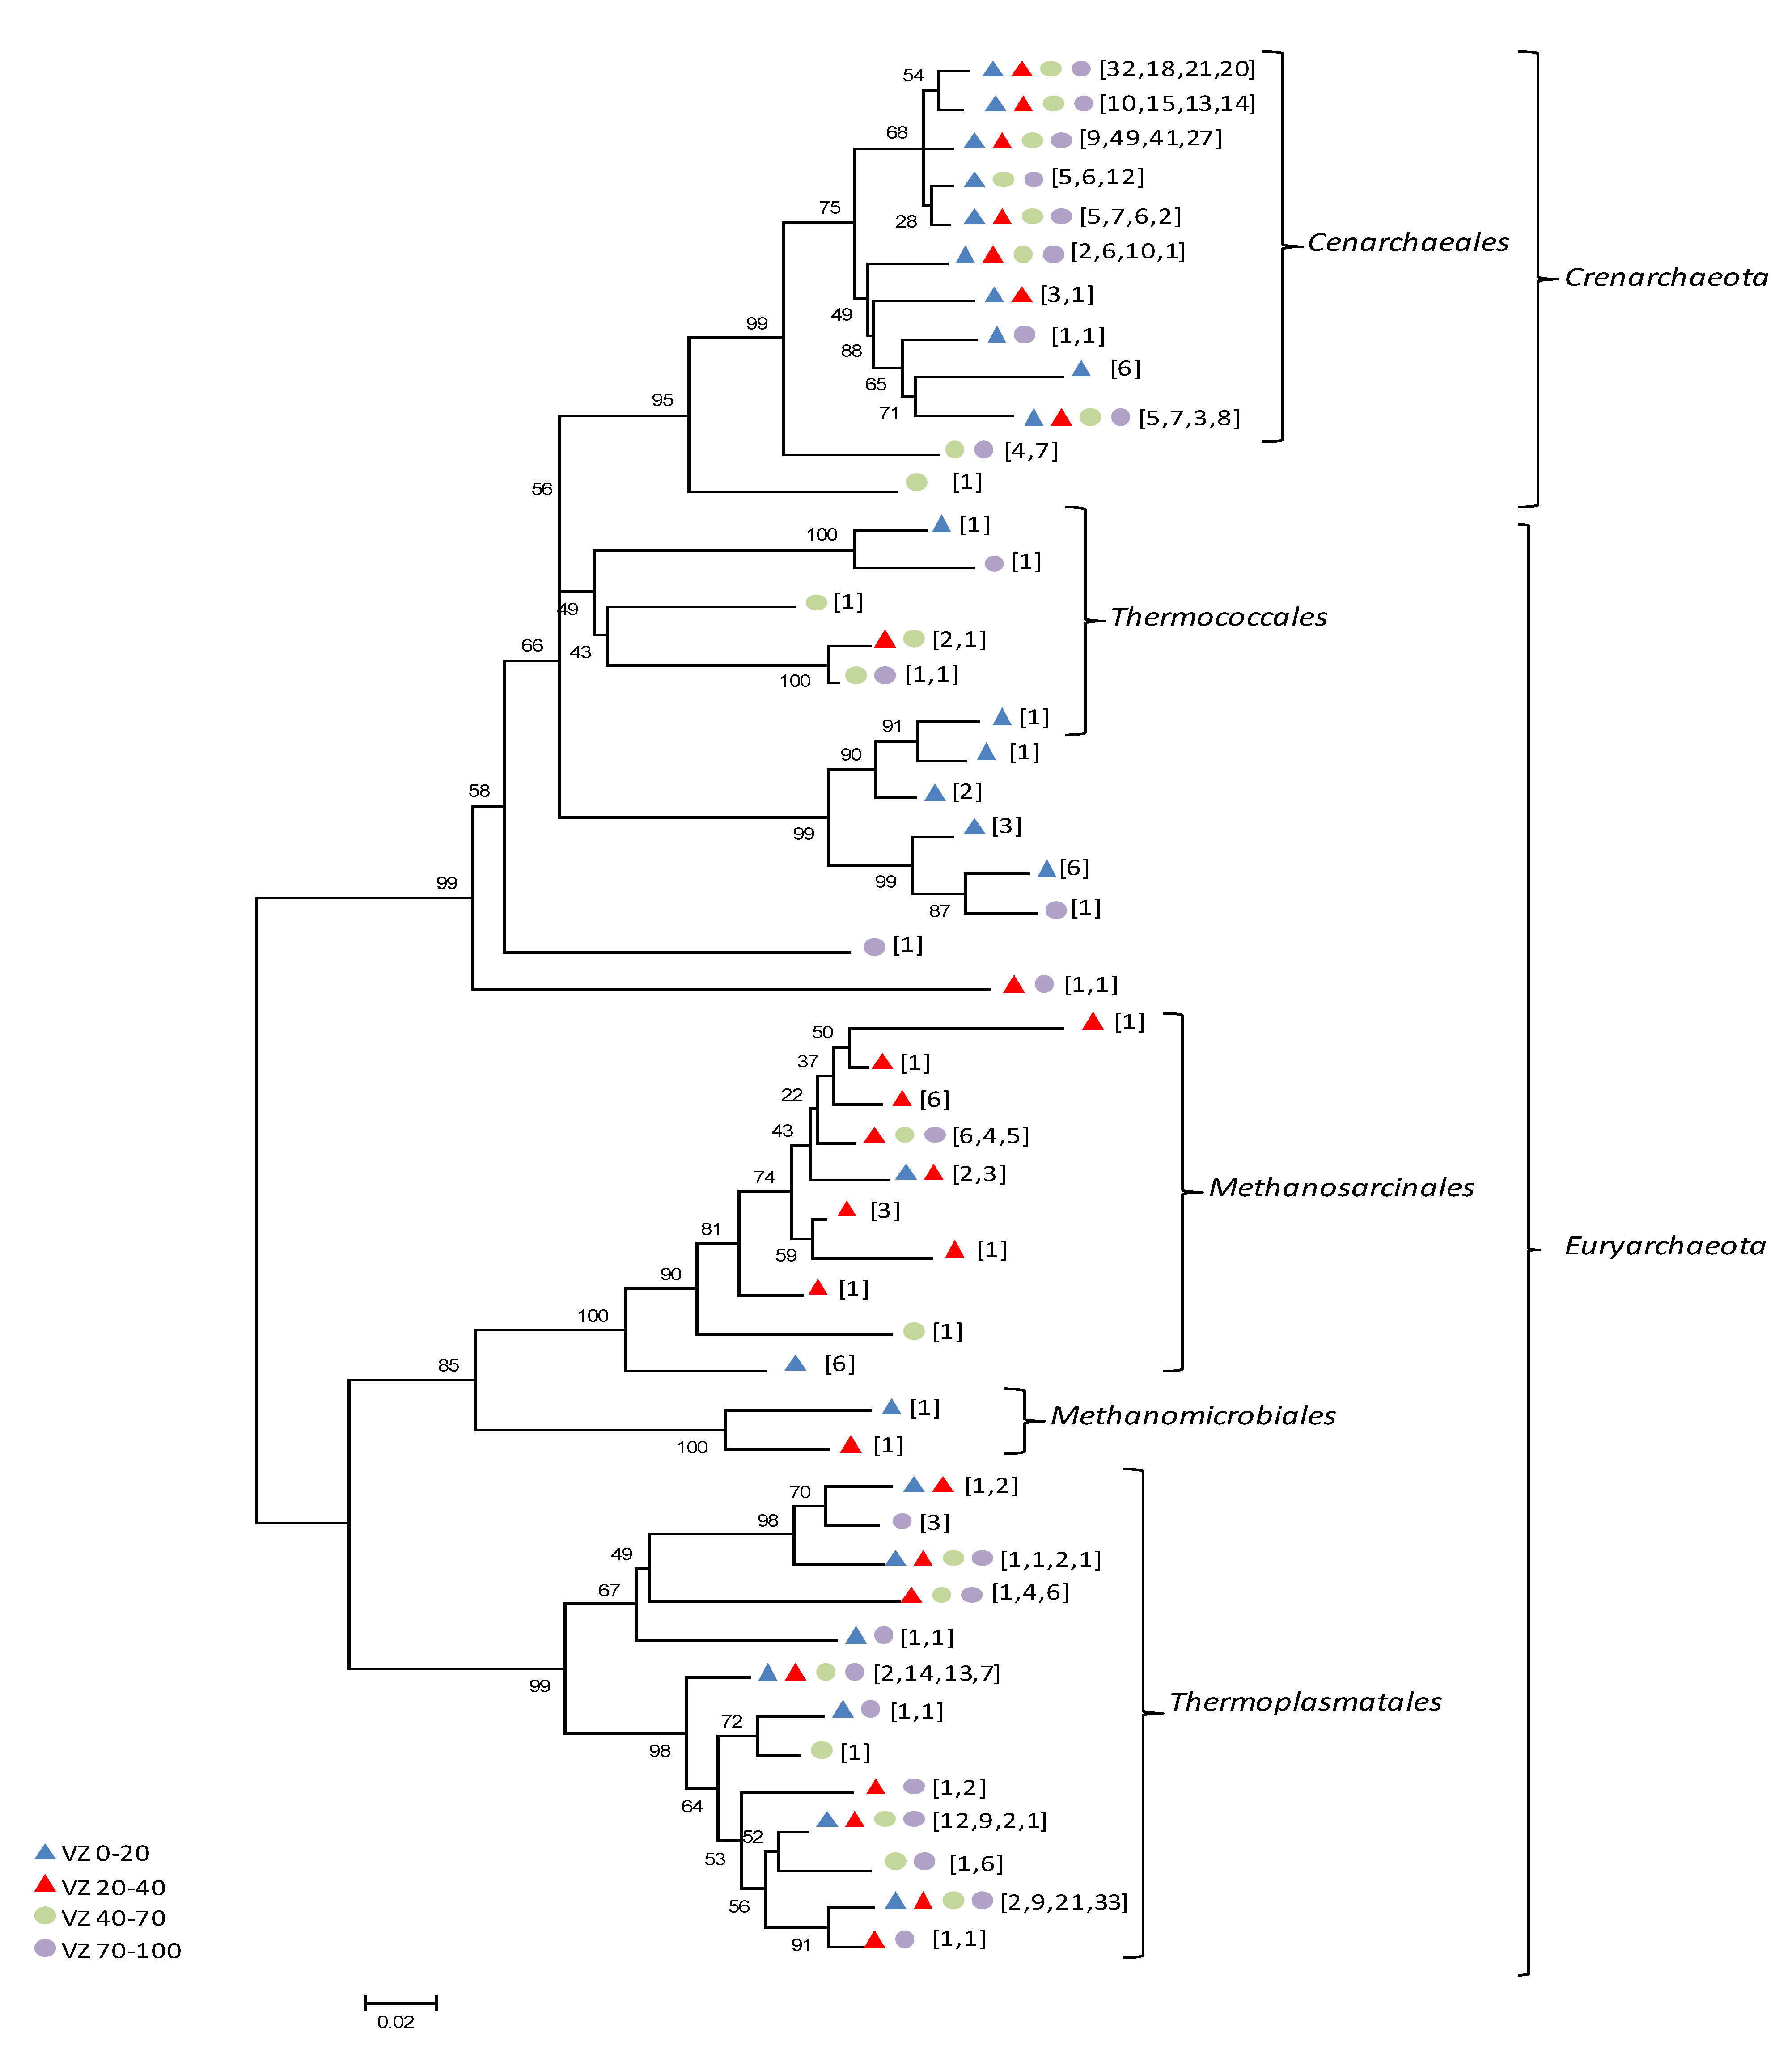
3.1. Diversity of the Archaeal Community

The domain Archaea is characterized by prokaryotic microorganisms that are evolutionarily distinct from the microorganisms in the domain Bacteria in their genome organization, gene expression, cellular composition and phylogeny [26]. The first archaea were isolated from inhospitable environments and specialized ecological niches [27]. These extreme environments lack oxygen and exhibit high temperatures (close to 100 °C), extreme acidity (pH 2.0) and high salinity (10–15%). For many years it was believed that archaea lived exclusively in those environments; however, recent studies based on culture-independent methods have shown that archaea are much more diverse and more widely distributed than previously thought [28].
The chemical and physical analysis of soil samples indicate the variation in values according to the depth sampled (Table 1).
In this study, four clone libraries were constructed to characterize the archaeal communities at different depths of wetland soil. The libraries were constructed from composite samples collected at depths of 0–20, 20–40, 40–70 and 70–100 cm, considering 121, 168, 147 and 163 clones for each library, respectively. This way, a total of 599 clones were used from the four libraries in the phylogeny and diversity analyses.
The domain Archaea is divided into four phyla: Crenarchaeota, Euryarchaeota, Korarchaeota and Nanoarchaeota. The majority of sequences identified in all the libraries were from uncultured microorganisms. Phylogenetic analyses showed that all of the clones belonged to the phyla Euryarchaeota and Crenarchaeota. No Korarchaeota or Nanoarchaeota sequences were found, which is understandable because organisms in these groups have only been isolated from high-temperature environments (Figure 3). Figure 4 shows a representation of classification at class level.
Table 1. Physical and chemical attributes of soil samples from different depths at várzea site.
AttributesSite
VZ 0–20VZ 20–40VZ 40–70VZ 70–100
Physical
Sand (%)2220177
Silt (%)58606565
Clay (%)20201828
Chemical
pH (CaCl2)5.76.05.76.1
O.M. (g.dm−3)1210911
P (mg.dm−3)11131111
K (mmolc.dm−3)10.91.20.80.8
Ca (mmolc.dm−3)71757670
Mg (mmolc.dm−3)30333231
H+Al (mmolc.dm−3)12101011
SB (mmolc.dm−3)111.9109.2108.8101.8
CEC (mmolc.dm−3)123.9119.2118.8112.8
BS (%)90929290
B (mg.dm−3)0.480.210.440.43
Cu (mg.dm−3)2.41.72.02.0
Fe (mg.dm−3)57272730
Mn (mg.dm−3)15.18.46.67.7
Zn (mg.dm−3)1.30.90.80.9
SB = Sum of Base; CEC = Cation Exchange Capacity; BS = Base Saturation.
At all depths, most sequences (56% to 72%) were classified as Crenarchaeota. Members of this phylum are commonly found in environmental samples. It is estimated that this phylum represents 0.5% to 3% of the entire prokaryotic community present in soil [29,30]. The phylum Crenarchaeota includes sulfur-reducing hyperthermophiles represented by organisms from the genera Dessulfurococcus, Pyrodictium, Sulfolobus, Thermococcus, Thermofilum and Thermoproteus. These genera include organisms capable of growing at the highest known temperatures, although they have also been isolated in cold environments such as the ocean [31].
Figure 3. Phylogenetic classification of the archaeal clones sequenced in this study. Samples are classified to the phylum level.
Diversity 02 01026 g003
Figure 4. Phylogenetic classification of the archaeal clones sequenced in this study. Samples are classified to the level of class. ND: Not Classified.
Diversity 02 01026 g004
Using the classification performed by RDP Classifier, almost all of the microorganisms in our survey were from the class Thermoprotei, again indicating the dominance of the phylum Crenarchaeota. The exception was the VZ 0–20 sample, in which Candidatus nitrososphaera was also detected. However, this genus was found in much lower numbers, making up only 6% of the population, while Thermoprotei made up 66%. Thus, there was a low diversity of the phylum Crenarchaeota in this sample. Also, in sample VZ 0–20 and within the class Thermoprotei, the orders Cenarchaeales, Desulfurococcales, marine archaeal group 1, Sulfolobales and Thermoproteales were identified. In the other samples (VZ 20–40, VZ 40–70 and VZ 70–100), all of the microorganisms belonging to the phylum Crenarchaeota were classified as Thermoprotei, family Cenarchaeales. This group is closely related to a mesophilic member of Crenarchaeota, Cenarchaeum symbiosum, which has been found associated with a marine sponge and has genes for ammonia monooxygenase [32].
Crenarchaeota have been detected in various terrestrial environments. Based on 16S rRNA gene surveys, the phylogenetic groups I.1b and I.1c seem to be the dominant groups in soils [33,34]. 16S rRNA gene sequence and T-RFLP analysis showed that group I.1c Crenarchaeota was found in high abundance in an acidic forest soil [35]. According to the authors, this abundance of group I.1c Crenarchaeota suggests that they may play a crucial functional role in forest soils.
Although found in smaller numbers, microorganisms belonging to the phylum Euryarchaeota showed greater diversity when compared to those of the phylum Crenarchaeota, which dominate this wetland environment. The phylum Euryarchaeota includes a great diversity of extreme halophilic, hyperthermophilic and methanogenic organisms. At the shallowest depth sampled (0–20 VZ), Euryarchaeota microorganisms were classified into five classes: Aciduliprofundum, Methanococci, Methanomicrobia, Thermococci and Thermoplasmata. The highest diversity was observed among methanogenic microorganisms, in which the class Methanomicrobia was dominant. It was particularly noted the presence of the genera Methanosarcina and Methanosaeta.
The high frequency of sequences classified as Methanomicrobia, primarily Methanosarcina and Methanosaeta, at shallower depths indicates that this group is the dominant methanogen in this environment. Although physiology cannot necessarily be assumed by phylogeny, in many cases the physiology of an organism can be cautiously inferred by phylogeny. If a sequence groups with those of cultured organisms known to have common properties, one can expect that the organism sampled only at the DNA sequence level from the environment may also exhibit those properties [36]. Thus, the sequences related to Methanosarcina and Methanosaeta could represent methanogens involved in the production of methane from acetate in the analyzed soil. These groups of methanogenic archaea belong to a specialized clade that produces methane from acetate, which is split into a methyl and a CO2 group, being subsequently oxidized to provide electrons [37]. The methyl group derived from the degradation of acetate is bound to methanopterin (or sarcinapterin for Methanosarcina) before being reduced to methane in two enzymatic reactions.
In sedimentary ecosystems or wetlands, as is the case in the Amazon floodplains, methane is produced mainly by the fermentation of acetate and the reduction of carbon dioxide with hydrogen as the electron donor. In freshwater ecosystems, H2:CO2, formate and acetate are the main methanogenic precursors [38]. In these ecosystems, as in floodplains, lake sediments and flooded rice fields, approximately 60–80% of methane is produced from acetate [39]. The isotopic composition of methane reflects the combination of different substrate fractionations. Depending on the methane production pathway (acetoclastic or hydrogenotrophic), the resulting methane will have a different δ13C value [40]. Higher δ13C values are indicative methane production via acetate fermentation, while lower values are indicative of CO2 reduction. While studying the isotopic composition of methane in the wetlands of the Santarém municipality—PA (the same location as this study), Moura [41] found high δ13C values found in the floodplain, indicating that the greatest contribution came from the acetoclastic pathway of methane formation.
In freshwater environments, the production of methane at the surface of the sediment via acetate fermentation occurs due to the greater availability of acetate, which is derived from the decomposition of labile organic matter from plant root exudates in the rhizosphere. The production of acetate and its subsequent use are generally highest in the upper portion of the sediment when compared to deeper layers [42]. In our study, with sample depth increasing, the abundance of the genera Methanosaeta and Methanospirillum increased, while Methanosarcina decreased. At the greatest depth evaluated, the VZ 70–100 sample, the genus Methanosarcina disappeared completely. Methanosarcina was also barely detected by Conrad et al. [11] in sediments from Amazon whitewater lakes. These authors suggested that the predominance of Methanosaeta reflects their adaptation to the low concentrations of acetate when compared to Methanosarcina because the former is an obligate acetotroph. For the purposes of this study, the absence of Methanosarcina at greater sample depths (VZ 70–100) can be explained due to the lower concentration of acetate at this depth. The genus Methanospirillum uses formate and/or hydrogen and carbon dioxide as an energy source.
The depth factor also significantly changed the population of the class Thermoplasmatales, which belongs to the phylum Euryarchaeota. Most members of Thermotoplasmata are thermophilic and all are acidophilic, exhibiting optimal growth at pH levels below 2. Species related to Thermoplasmales have generally been described as thermophilic organisms. However, studies by Kemnitz et al. [35] and Pesaro and Widmer [34] support the hypothesis that Thermoplasmales-related archaea are also mesophiles; for example, Thermoplasmales-related archaea (Rice Cluster III) were detected in an anoxic soil, an enrichment that grew optimally at moderate temperatures [43]. Picrophilus is currently the most acidophilic of all known organisms. It can grow at a minimal pH of −0.06.
Rarefaction curves (Figure 5) revealed that the shallowest sample had the greatest diversity, and diversity decreased with increasing depth (except for the library VZ 70–100, which had a similar pattern to the library VZ 20–40). Curves representing the sample libraries indicated that these deeper sampling sites required fewer sequences for a comprehensive sampling compared to the shallower samples, indicating that the diversity in the shallower samples was greater than in the deeper samples.
Table 2 summarizes the data obtained by using diversity indices and richness estimators for the libraries. These data support the results shown by the rarefaction curve; i.e., the diversity decreases as the depth increases, except for library VZ 70–100, which had diversity similar to library VZ 20–40.
Venn diagrams (Figure 6) were constructed from the sequences obtained in wetland soil libraries, and the clones were grouped into OTUs based on a 97% similarity cutoff using the program SONS [44]. The diagrams show the unique OTUs for each sample and the overlap between the depths (intersections). In general, the majority of OTUs overlap between close depths, but it is also possible to find unique OTUs at each depth, revealing the existence of a community structure pattern of archaea at different depths in the wetland soil studied. These results are similar to those from other studies, which found more diversity in microbial communities in the top layers of soil [45,46,47].
Figure 5. Rarefaction curves generated for 16S rRNA genes in the clone library from samples collected from mangrove soil. Clones were grouped into phylotypes based on sequence similarities of >97%.
Diversity 02 01026 g005
Table 2. Comparison of diversity estimates for 16S rRNA gene libraries.
SampleReadsOTU aChao1 bJackknifeShannonSimpson
VZ 0–20 1212330.2 ± 5.632.0 ± 8.32.40 ± 0.220.142
VZ 20–40 1682341.3 ± 13.845.2 ± 17.72.24 ± 0.190.167
VZ 40–70 1471621.0 ± 4.221.0 ± 6.21.94 ± 0.180.207
VZ 70–100 1632244.5 ± 17.251.4 ± 23.32.36 ± 0.170.132
Values represent estimated average ± 95% confidence intervalsa Operational taxonomic units (OTU) were determined using a 97% similarity cutoff.b Richness estimators (Chao1 and Jackknife) and diversity indices (Shannon and Simpson) were calculated using DOTUR [18].
Figure 6. Venn diagrams based on the OTUs of 16S rRNA archaea libraries from Amazon wetland soil at the four depths sampled. The intersections show the number of OTU overlaps.
Diversity 02 01026 g006
Figure 7 shows the phylogenetic tree generated with the program MEGA4 [48] and using the neighbor-joining method [49]. Confidence values for the branches of the tree were determined using a bootstrap analysis based on 1000 resamplings. The tree was constructed based on 50 OTUs determined by the DOTUR program [18] and classified on the site GreenGen (http://greengenes.lbl.gov/cgi–bin/nph–index.cgi).
Figure 7. 16S rRNA gene tree for the domain Archaea based on representative sequences for each OTU retrieved from four libraries of Amazon wetland soil. The tree was generated using the neighbor-joining method and bootstrap values are displayed on the branch nodes. Numbers after symbols represent the number of sequences for each OTU in each respective sample.
Diversity 02 01026 g007
According to the phylogenetic tree, most of the sequences obtained for all depths were classified in the phylum Crenarchaeota. The sequences classified as belonging to the phylum Euryarchaeota, although smaller in number, showed a greater diversity. In general, there was no clear difference between the depths sampled at the phylum level, but it was noted some few OTUs exclusively at different depths.
The phylogenetic tree shown in Figure 7 includes a large group that is closely related to the species Cenarchaeum symbiosum, which is found in oceans [32]. Some samples also clustered within clades of methanogenic organisms; for example, the orders Methanosarcinales, Methanomicrobiales and Thermoplasmatales.
The sequences analyzed in this study were compared to sequences deposited in the NCBI database using the BLAST tool. The majority were similar to sequences deposited and identified as soil-derived Crenarchaeota. Several studies have demonstrated the wide distribution of Crenarchaeota in soil [27,50]. Some sequences also showed similarity to two Crenarchaeota sequences found by Borneman and Triplett [46] in two different Amazonian soils (forest and pasture), which were the first reported sequences of archaea from Amazonian soils. Similarities to sequences derived from tropical agricultural soils have also been found [51].
Sequence BLAST analyses showed that several sequences were similar to Euryarchaeota found in sediment from Wind Cave National Park (AY217535.1), a limestone cave formed by the dissolution of limestone. The sequences classified by RDP Classifier as members of the class Methanosarcinales, showed similarity by BLAST to sequences found in freshwater sediments, namely AY652476.1 [52], AF293016.1 and AF293017.1 [53].
However, the majority were similar to soil sequences, including the following sequences: clones AM114193.2 and AB196288.1 from rhizosphere soil and AF225644.1 from rice soil [54,55]; clone AF226268.1 from maize rhizosphere [56]; clone EF125517.1 from mangrove soil [57]; clones AB161329.1 and AB161346.1, from soil contaminated with oil [58]; clone AY457661.1, found in a Pântano region wetland [38]; and clone AY652476.1, from a swamp [52].
Similarities were also observed with sequences obtained from inhospitable environments, such as bitumen storage (EF420187.1), volcanic sediment (EF032793.1, AY917222.1) and water contaminated with heavy metals (EF464061.1). Coincidentally, Clementino et al. [51] also found sequences similar to those found in volcanic sediments in tropical agricultural soils.
Studies on the diversity of archaea in tropical wetland environments are still scarce [59,60]. Cury [61] analyzed 279 16S rDNA sequences from an estuarine environment located on the southern coast of São Paulo, on the island of Cardoso. Another study examined archaeal diversity in four different environments: seawater, agricultural soil, marine sediment and a sewage treatment plant, all located in the state of Rio de Janeiro. A total of 123 16S rDNA sequences and sequences from the 16S–23S intergenic region [51] were analyzed. In the Amazon region, data on microbial diversity is even scarcer, and despite the presence of several types of soil, few Amazonian soils have been characterized at the microbiological level.

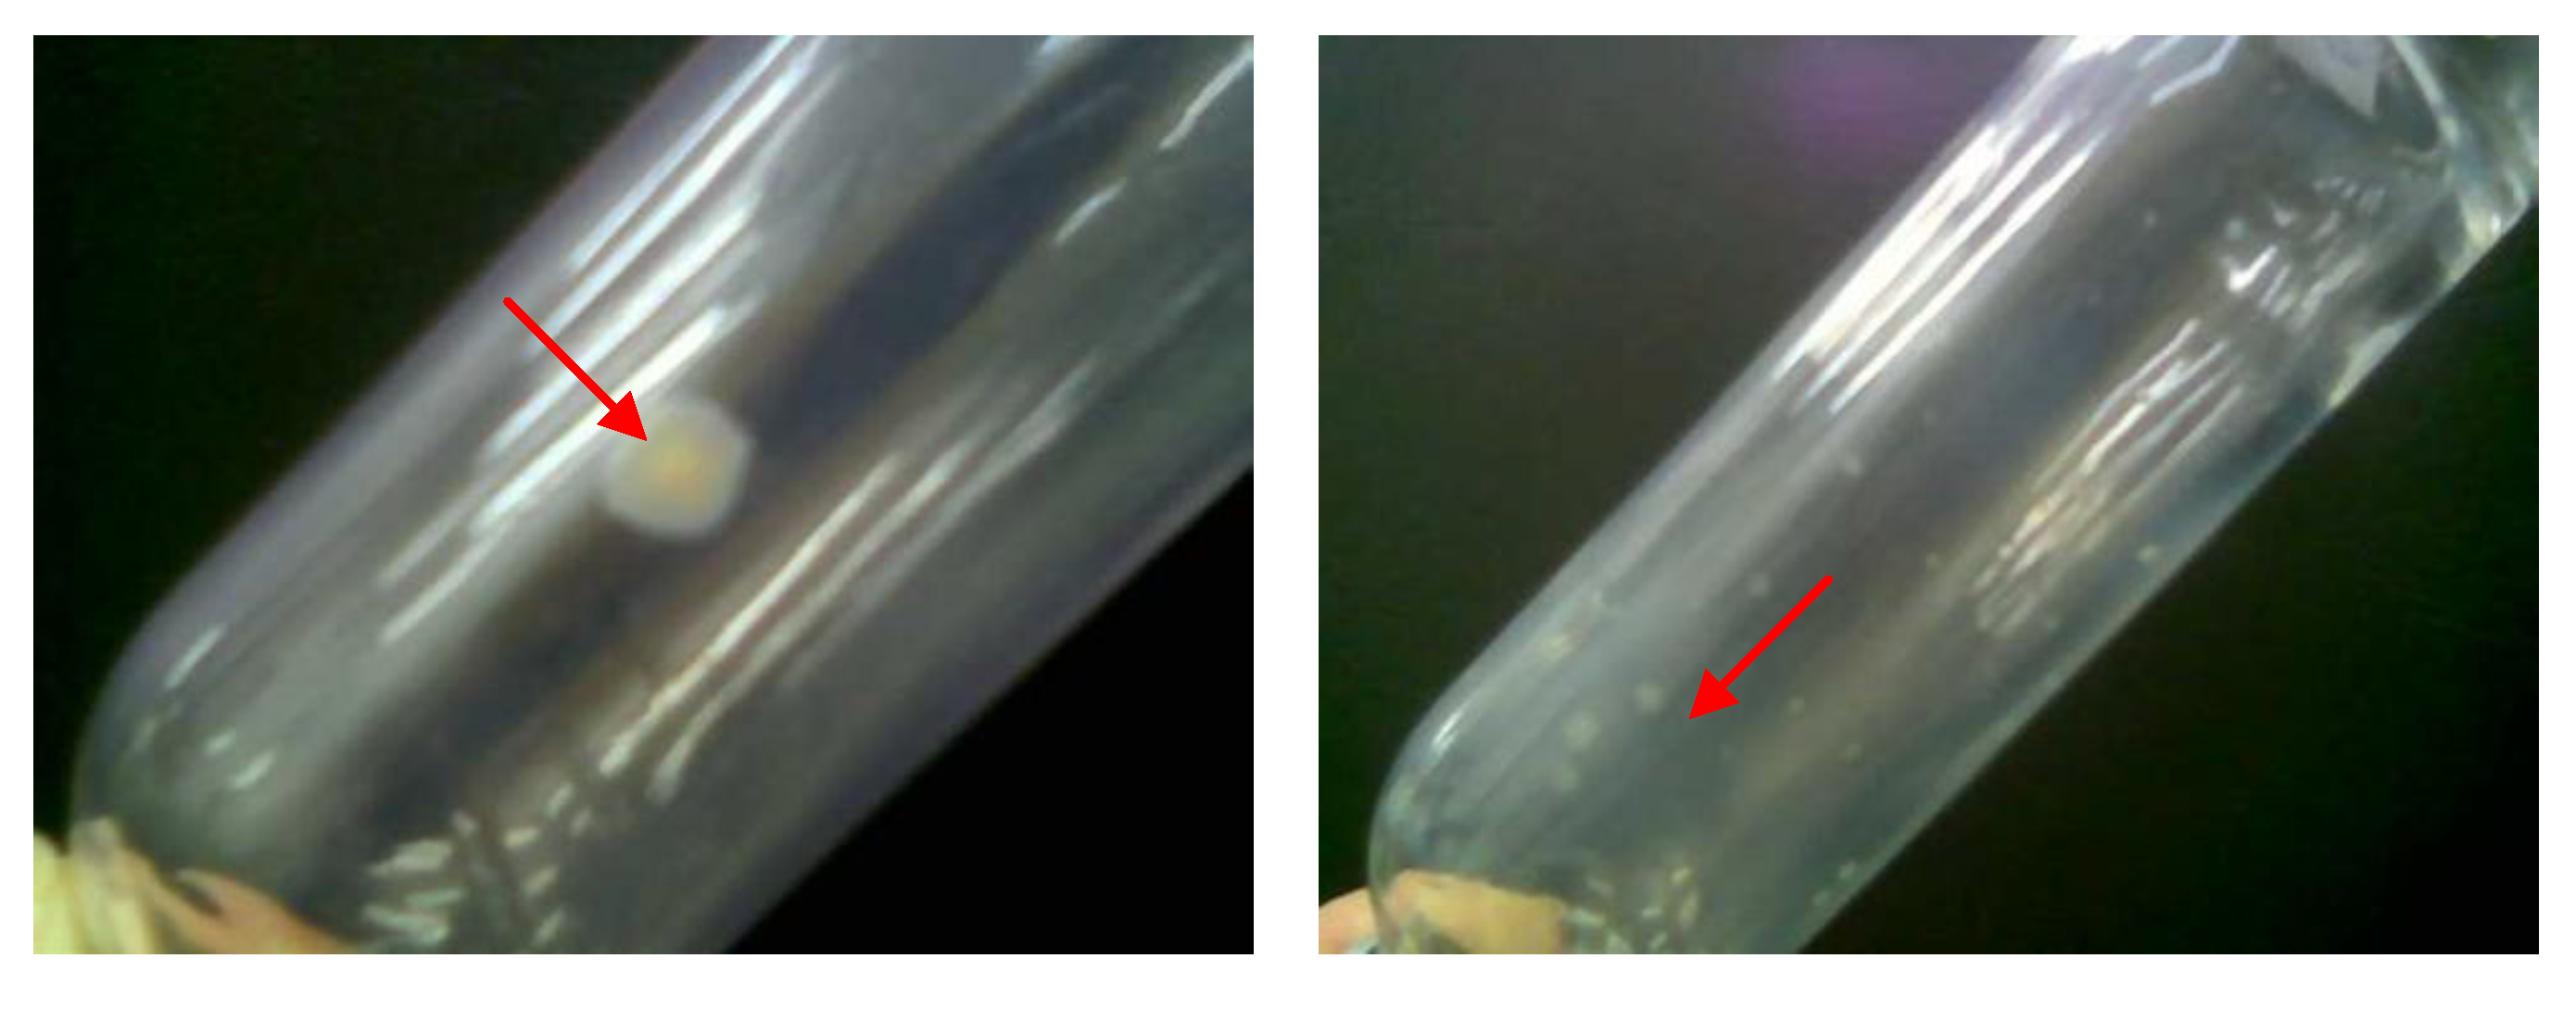
3.2. Culture-Dependent Isolation of Methanogenic Archaea

Soil enrichment experiments were performed to stimulate the growth of methanogenic microbes. Supplementation with micronutrients and other growth factors was optimized for the growth of methanogens. Methanogenic organisms require a number of vitamins, minerals and sulfur sources that are quite specific; however, they are not stringent in regards to carbon source, generally requiring one-carbon compounds [62,63]. In this study, acetotrophic and hydrogenotrophic sources were used in combination during the culture enrichment stage to promote the growth of most methanogenic groups [37,62,64].
Enrichment experiments resulted in low levels of methane production until the 40th day of incubation (DI), particularly for the samples collected at 20–40 cm and 70–100 cm depths. However, when the atmosphere in those two flasks was changed on the 50th DI, they had a higher methane gas atmospheric composition on the 90th DI, at around 80%. The methane production data show that the atmospheric exchange from N2:CO2 to H2:CO2 was essential for methanogenic growth. Methanogens utilize a limited number of substrates, of which a mixture of hydrogen and carbon dioxide is the main substrate that can be assimilated by all methanogens in all methanogenic environments [39,64,65].
Although most hydrogenotrophic species can also utilize formate to form methane [5,62], several methanogenic species are autotrophic; that is, they grow only under hydrogen and carbon dioxide and their growth is not stimulated by the addition of growth factors or by the supplementation of nutrients such as vitamins, yeast extract and fatty acids [66]. Thus, the inclusion of hydrogen and carbon dioxide in the enrichment medium favored the growth of all types of methanogens.
The roll-tube technique, as mentioned above, was developed by Hungate [67] for the growth and isolation of colonies of cellulolytic strict anaerobes on solid media. The cultures that produced methane in ten-fold serial dilution assays were selected for the roll-tube technique, giving preference to cultures at higher dilutions and in the presence of vancomycin. Dilutions of enriched wetland soil samples were inoculated onto solid media after 15 days of incubation and the presence of methane gas was determined. After seven days of culture, colonies were found in some roll-tubes containing samples derived from wetland soil. The first quantification of methane was performed on the 30th DI, when the development of isolated colonies was clear (Figure 8). The process was repeated several times to isolate pure cultures.
Figure 8. Two photographs of the roll-tube flasks. Red arrows indicate examples of colonies.
Diversity 02 01026 g008
After growth and measurement of methane production, the colonies were observed to evaluate their color and shape. Morphological analysis revealed numerous colony morphotypes; however, most were circular in shape and yellow or white. Culture growth was assayed by visualizing the turbidity of the culture, and methane in the tube atmosphere was quantified by gas chromatography.
To verify the purity of the methanogenic archaeal cultures, clone libraries were constructed for ARDRA analysis (amplified ribosomal DNA restriction analysis). ARDRA is a high-resolution technique based on PCR products that is capable of producing genotype-specific characterizations that may be used to identify unknown samples. The method does not require any primary sequence data or an elaborate profile database and, therefore, is very applicable in preliminary analyses of unknown material [68]. After re-amplification of plasmid DNA with the primers ARCH21f and ARCH958r, PCR products were used in individual restriction analysis with two different endonucleases: a high-frequency cutter (HaeIII) and a rare cutter (HindIII). These enzymes were selected because they have the potential to differentiate between the major groups of methanogenic species based on their specific restriction sites [69,70].
Representative clones from each restriction pattern were sequenced and compared to the NCBI database. To confirm the results obtained with the ARDRA technique, an in silico restriction analysis was conducted with the NEBcutter tool from the REBASE website (http://tools.neb.com/NEBcutter2/index.php).
Only two clones had a clear cleavage pattern different from all the other clones analyzed for both enzymes. The restriction pattern for these clones are related to the genus Methanosarcina, while the pattern of the other clones is more related to the genus Methanobacterium, according to classification supported by BLAST analysis. While the rest of the clones had restriction patterns characteristic of Methanobacterium, with three well-defined bands (≈350, 200 and 150 bp), these clones showed fragments of approximately 200, 180 and 150 bp. Nevertheless, based on the NCBI BLAST analysis, these clones are related to the genus Methanosarcina. From this analyze, the culture samples are predominantly representatives of the genus Methanobacterium.
The genera found in this study, Methanobacterium and Methanosarcina, were found to be the dominant genera in rice fields studied by Joulian et al. [71]. The authors evaluated 13 wetland rice fields using the MPN (most probable number) method. In eight of the fields, hydrogenotrophic methanogens were dominant. However, when acetate or methanol was the carbon source, the Methanosarcina population prevailed. Based on these results, the authors concluded that in wetland rice fields, methanogenic organisms of the genus Methanobacterium are mostly responsible for methane production from H2:CO2, while methanogens of the genus Methanosarcina are mostly responsible for methane production from acetate, and both genera are ubiquitous in this environment.
The representatives of the genus Methanosarcina found in this study were similar to methanogenic organisms isolated from cold terrestrial environments [72]. Methanosarcina mazei was isolated from flooded tundra soils at a depth of 30–40 cm and a temperature of 5–6 °C. Methanosarcina lacustris was isolated from anoxic lake sediment at a depth of 5–10 cm and a temperature of 4–6 °C. The organisms of the genus Methanosarcina obtained in this study were isolated from wetland soil at depths of 20–40 cm and 40–70 cm. Although sequences from our study, which was conducted in tropical wetlands, shared similarity with sequences isolated from cold environments, both share the commonality of being from terrestrial environments that are periodically or permanently flooded.
The genus Methanosarcina includes nine species: Methanosarcina acetovorans, Methanosarcina barkeri, Methanosarcina mazei, Methanosarcina semesiase, Methanosarcina siciliae, Methanosarcina thermophila, Methanosarcina vacuolata, Methanosarcina baltica and Methanosarcina lacustris. All of these species are sessile and able to catabolize acetate, methanol, methylamines and CO. Some species are able to obtain energy by reducing CO2 with H2 [73].
Most studies of methanogenic organisms use rice wetlands as their reference soil, and few data are available on other soil types. The soils studied are often flooded and aquatic sediments. Several genera of methanogenic organisms have been isolated from wetland rice soils, including Methanobacterium, Methanosarcina, Methanobrevibacter, Methanoculleus, Methanogenium, Methanosaeta and Methanospirillum [74]. However, the archaeal populations from these soils are composed primarily of hydrogen-consuming microorganisms belonging to the genus Methanobacterium and the acetate-utilizing genera Methanosaeta and Methanosarcina [39,75].

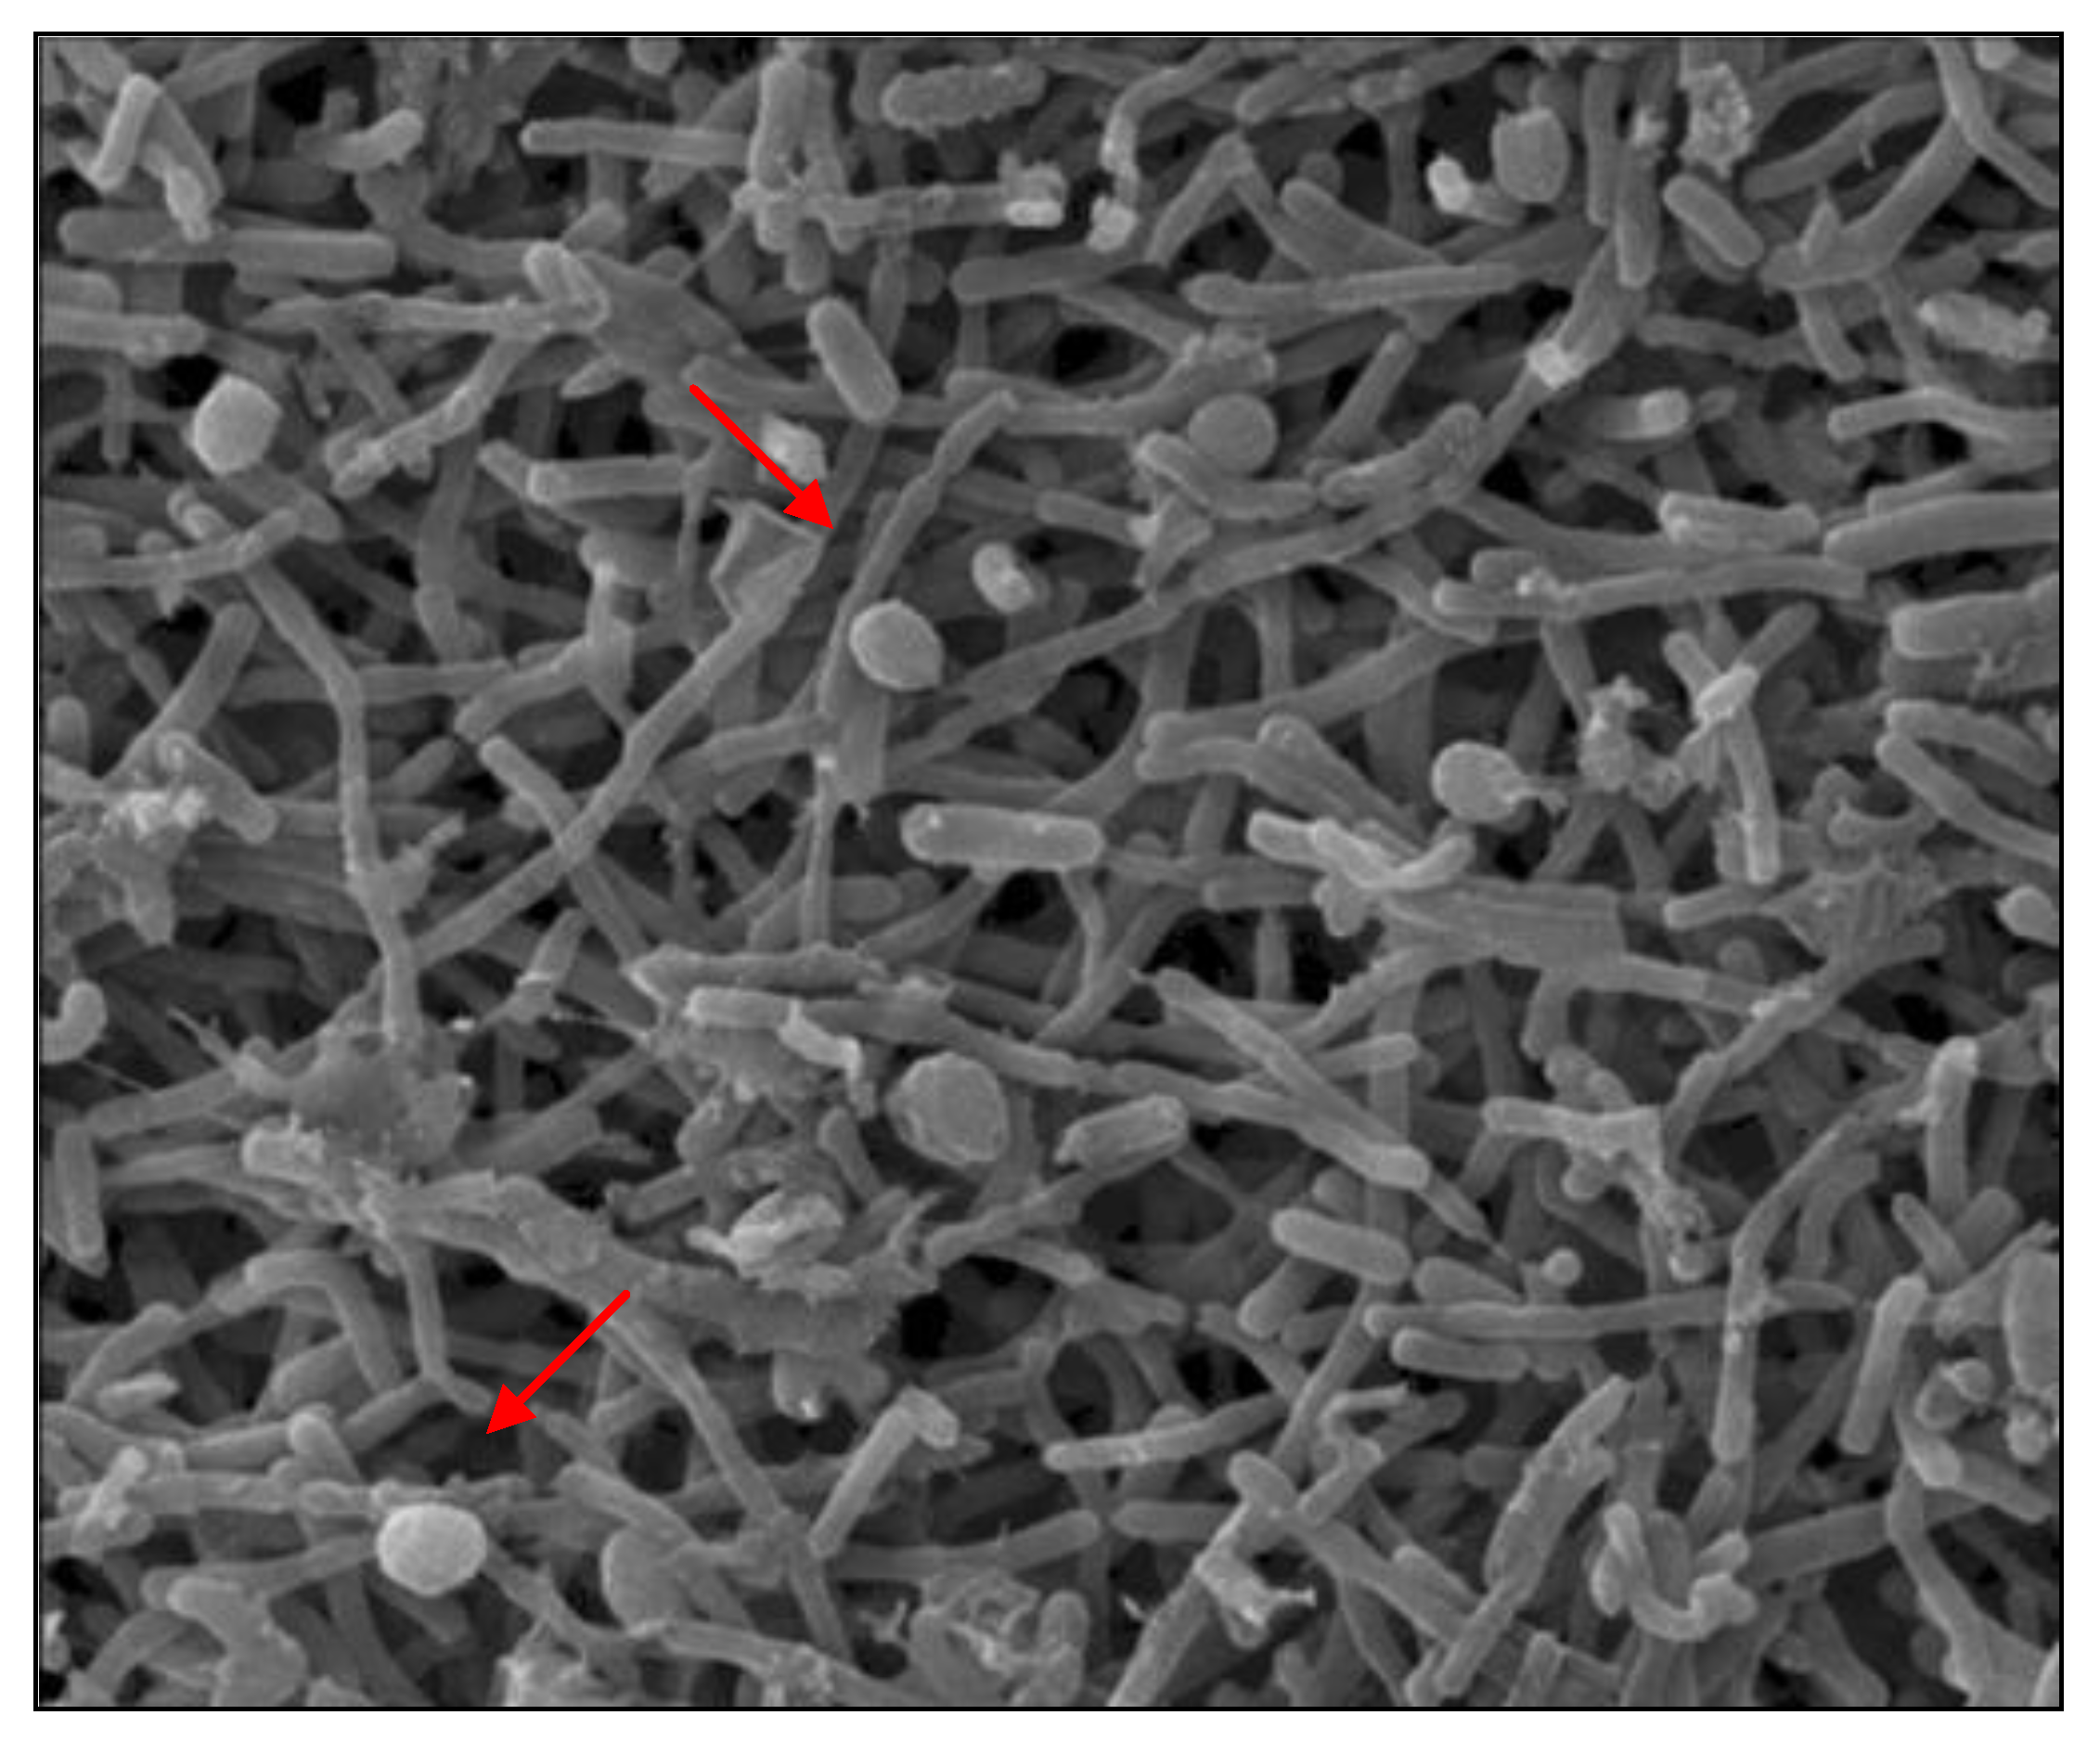
3.3. Morphological Characterization of Methanogenic Cultures

A phase contrast microscopy was used on the colonies collected to observe the predominant cellular morphologies and assess the purity of the cultures (Figure 9). Figure 10 shows a scanning electron microscopy image of growing cells in culture. Large numbers of bacilli and some cocci can be observed in the image. The image was taken at 4,000X magnification.
Figure 9. Phase contrast photomicrograph of a purified methanogenic culture from VZ 70–100 cm (1,250X magnification). The arrow indicates a chain of bacilli.
Diversity 02 01026 g009
With the advent of culture-independent molecular biology techniques, a large amount of important information has been generated on the structure and diversity of microorganisms in various environments. However, these methods alone do not provide functional data for the community. Currently, one of the biggest challenges in microbiology is determining how to culture microorganisms considered to be recalcitrant or non-culturable and even microorganisms that are difficult to culture, such as methanogenic archaea.
Figure 10. Scanning electron microscopy (SEM) photomicrograph of a purified methanogenic culture, showing mostly bacilli (up arrow) and some cocci (arrow down). (4,000X magnification).
Diversity 02 01026 g010
Thus, the isolation of methanogenic organisms from Amazon soils is of great ecological importance. It is well known that flooded areas are a major source of methane found in the earth’s atmosphere, contributing about 70% of total emissions [1]. Due to its large expanse of over one million square kilometers, the Amazon basin plays a fundamental role with regards to methane emission into the atmosphere and its relevance to global warming [2]. Despite the existence of several studies on the emission of methane in the Amazon, this work is the first to isolate methanogenic archaea from Amazonian soils.

4. Conclusions

The study of microbial communities using molecular techniques has proven to be useful in characterizing the soil microbiota of the most diverse tropical environments, including wetlands. In this study, the diversity of archaea found in wetland soils at different depths was analyzed, thereby increasing our understanding of the microbial communities in wetland soils of the Amazon basin. Our results suggest that there is a complex and highly diverse community of these organisms. In addition, a significant number of clones related to methanogenic activity were detected. Two methanogenic species were also isolated, suggesting that there is intense methane production activity in this environment. Recently, microbial methanogenic activity has become the focus of intense research because it is responsible for the emission of methane gas into the atmosphere, an aggravating factor in global climate change. Nevertheless, future research using genomic studies and chemical measurements is needed to help us better understand the functions of these microorganisms in environmental samples. In conclusion, the data presented here increase our understanding of archaea in wetland soils, adding important information that will help future studies in these environments.

Acknowledgements

The group would to sincerely express their thanks and gratitude to CNPq-Conselho Nacional de Pesquisa e Desenvolvimento Tecnológico (Projects Nº 504130/2008–0 and Nº 474455/2007–6), FAPESP—Fundação de Amparo à Pesquisa do Estado de São Paulo (Project Nº 2006/06700–0). We also would like to thank the fellowships given by FAPESP (JMP, ENP, LWM) and CNPq (SMT). The group also is in debt to José Elias Gomes and Fábio R.S. Duarte for their assistance on the molecular analyses.

References

  1. Bartlett, K.B.; Harris, R.C. Review and Assessment of Methane Emission from Wetlands. Chemosphere 1993, 26, 261–320. [Google Scholar] [CrossRef]
  2. Junk, W.J. The Central Amazon Floodpalin: Ecology of a Pulsing System; Springer: Berlin, Germany, 1997. [Google Scholar]
  3. Devol, A.H.; Richey, J.E.; Forsberg, B.R.; Martinelli, L.A. Seasonal Dynamics in Methane Emissions from the Amazon River Floodplain to the Troposphere. J. Geophys. Res. 1990, 95, 16417–16426. [Google Scholar] [CrossRef]
  4. Fearnside, P.M. Agriculture in Amazonia. In Key Environments: Amazonia; Prance, G.T., Lovejoy, T.E., Eds.; Pergam Press: Oxford, UK, 1985. [Google Scholar]
  5. Zinder, S.H. Physiological Ecology of Methanogens. In Methanogenesis: Ecology, Physiology, Biochemistry & Genetics; Ferry, J.G., Ed.; Chapman & Hall: New York, NY, USA, 1983. [Google Scholar]
  6. Houghton, J. The Climate and the Latest Scientific Understanding of Climate Change. Renewable Energy 1994, 5, 1–4. [Google Scholar] [CrossRef]
  7. Alvalá, P.C.; Kirchhoff, W.V.J.H.; Pavão, H.G. Metano na Atmosfera. Biotecnol. Ciência e Desenv. 1999, 7, 40–43. [Google Scholar]
  8. Koschorreck, M. Methane Tournover in Exposed Sediments of an Amazon Floodplain Lake. Biogeochemistry 2000, 50, 195–206. [Google Scholar] [CrossRef]
  9. Melack, J.M.; Hess, L.L.; Gastil, M.; Forsberf, B.R.; Hamilton, S.K.; Lima, I.B.T.; Novo, E.M.L.M. Regionalization of Methane Emissions in the Amazon Basin with Microwave Remote Sensing. Glob. Change Biol. 2004, 10, 530–544. [Google Scholar] [CrossRef]
  10. Davidson, E.A.; Ishida, F.Y.; Nepstad, D.C. Effects of an Experimental Drought on Soil Emissions of Carbon Dioxide, Methane, Nitrous Oxide, and Nitric Oxide in a Moist Tropical Forest. Glob. Change Biol. 2004, 10, 718–730. [Google Scholar] [CrossRef]
  11. Conrad, R.; Klose, M.; Claus, P.; Enrich-Prast, A. Methanogenic Pathway, 13C Isotope Fractionation, and Archaeal Community Composition in the Sediment of Two Clear–Water Lakes of Amazonia. Limnol. Oceanogr. 2010, 55, 689–702. [Google Scholar] [CrossRef]
  12. de Oliveira Júnior, R.C.; Corrêa, J.R.V. Caracterização dos Solos do Município de Belterra, Estado do Pará; Boletim De Pesquisa E Desenvolvimento, Embrapa Amazônia Oriental: Belém, Brazil, 2001. [Google Scholar]
  13. Rodrigues, T.E.; Santos, P.L., dos; de Oliveira Júnior, R.C.; Valente, M.A.; Silva, J.M.L., da; Cardoso Júnior, E.Q. Caracterização dos Solos da Área do Planalto de Belterra, Município de Santarém, Estado do Pará; Embrapa Amazônia Oriental, Boletim De Pesquisa E Desenvolvimento: Belém, Brazil, 2001. [Google Scholar]
  14. Moyer, C.L.; Tiedje, J.M.; Dobbs, F.C.; Karl, D.M. Diversity of Deep-sea Hydrothermal Vent Archaea from Loihi Seamount, Hawaii. Deep-Sea Res. 1998, 45, 303–317. [Google Scholar] [CrossRef]
  15. Ewing, B.; Green, P. Base-Calling of Automated Sequencer Traces Using Phred. II Error Probabilities. Genome Res. 1998, 8, 186–194. [Google Scholar]
  16. Ewing, B.; Hillier, L.; Wendl, M.C.; Green, P. Base-Calling of Automated Sequencer Traces Using Phred. I. Accuracy Assessment. Genome Res. 1998, 8, 175–185. [Google Scholar] [CrossRef]
  17. Gordon, D.; Abajian, C.; Green, P. Consed: A Geographical Tool for Sequence Finishing. Genome Res. 1998, 8, 195–202. [Google Scholar] [CrossRef]
  18. Schloss, P.D.; Handelsman, J. Introducing to DOTUR, a Computer Program for Defining Operacional Taxonomic Units and Estimating Species Richness. Appl. Environ. Microbiol. 2005, 71, 1501–1506. [Google Scholar] [CrossRef]
  19. Felsenstein, J. PHYLIP—Phylogeny Inference Package (Version 3.2). Cladistics 1989, 5, 164–166. [Google Scholar]
  20. Singleton, D.R.; Furlong, M.A.; Rathbun, S.L.; Whitman, W.B. Quantitative Comparisons of 16S rRNA Gene Sequence Libraries from Environmental Samples. Appl. Environ. Microbiol. 2001, 67, 4374–4376. [Google Scholar] [CrossRef]
  21. Deevong, P.; Hattori, S.; Yamada, A.; Trakulnaleamsai, S.; Ohkuma, M.; Noparatnaraporn, N.; Kudo, T. Isolation and Detection of Methanogens from the Gut of Higher Térmites. Microbes Environ. 2004, 19, 221–226. [Google Scholar] [CrossRef]
  22. Edwards, T.; McBridge, B.C. New Method for the Isolation and Identification of Methanogenic Bacteria. Appl. Environ. Microbiol. 1975, 29, 540–545. [Google Scholar]
  23. Vazoller, R.F. Avaliação do Ecossistema Microbiano de um Biodigestor Anaeróbio de Fluxo Ascendente e Manta de Lodo, Operado com Vinhaça sob Condições Termofílicas; (Tese Doutorado em Hidráulica e Saneamento); Escola de Engenharia de São Carlos, Universidade de São Paulo: São Paulo, Brazil, 1995; p. 295. [Google Scholar]
  24. Schneider, R.P.; Ferreira, L.M.; Binder, P.; Bejarano, E.M.; Goes, K.P.; Slongo, E.; Machado, C.R.; Rosa, G.M.Z. Dynamics of Organic Carbon and of Bacterial Populations in a Conventional Pretreatment Train of a Reverse Osmosis Unit Experiencing Severe Biofouling. J. Membr. Sci. 2005, 266, 18–29. [Google Scholar] [CrossRef]
  25. Massana, R.; Murray, A.E.; Preston, C.M.; DeLong, E.F. Vertical Distribution and Phylogenetic Characterization of Marine Planktonic Archaea in the Santa Barbara Channel. Appl. Environ. Microbiol. 1997, 63, 50–56. [Google Scholar]
  26. Canhos, V.P.; Vazoller, R.F. Microrganismos & Vírus. In Biodiversidade do estado de São Paulo.; Fundacão de Amparo à Pesquisa do Estado de São Paulo: São Paulo, Brazil, 1999; pp. 3–23. [Google Scholar]
  27. Bintrin, S.B.; Donohue, T.J.; Handelsman, J.; Roberts, G.P.; Goodman, R.M. Molecular Phylogeny of Archaea from Soil. PNAS 1997, 94, 277–282. [Google Scholar] [CrossRef]
  28. Chaban, B.; Ng, S.Y.M.; Jarrel, K.F. Archaeal Habitats from the Extreme to the Ordinary. Can. J. Microbiol. 2006, 52, 73–116. [Google Scholar] [CrossRef]
  29. Ayton, J.; Aislabie, J.; Barker, G.M.; Saul, D.; Turner, S.S. Crenarchaeota Affiliated with Group 1.1b are Prevalent in Coastal Mineral Soils of the Ross Sea Region of Antartica. Environ. Microbiol. 2010, 12, 689–703. [Google Scholar] [CrossRef]
  30. Nicol, G.W.; Tscherko, D.; Chang, L.; Hammesfahr, U.; Prosser, J.I. Crenarchaeal Community Assembly and Microdiversity in Developing Soils at Two Sites Associated with Deglaciation. Environ. Microbiol. 2006, 8, 1382–1393. [Google Scholar] [CrossRef]
  31. Könneke, M.; Bernhard, A.E.; de la Torre, J.R.; Walker, C.B.; Waterbury, J.B.; Stahl, D.A. Isolation of an Autotrophic Ammonia–Oxidizing Marine Archaeon. Nature 2005, 437, 543–546. [Google Scholar] [CrossRef]
  32. Preston, C.M.; Wu, K.Y.; Molinski, T.F.; DeLong, E.F. A Psychrophilic Crenarchaeon Inhabits a Marine Sponge: Cenarchaeum Symbiosum gen. nov., sp. nov. PNAS 1996, 93, 6241–6246. [Google Scholar] [CrossRef]
  33. Jurgens, G.; Lindstrom, K.; Saano, A. Novel Group within the Kingdom Crenarchaeota from Boreal Forest Soil. Appl. Environ. Microbiol. 1997, 63, 803–805. [Google Scholar]
  34. Pesaro, M.; Widmer, F. Identification of Novel Crenarchaeota and Euryarchaeota Clusters Associated with Different Depth Layers of a Forest Soil. FEMS Microbiol. Ecol. 2002, 42, 89–98. [Google Scholar] [CrossRef]
  35. Kemnitz, D.; Kolb, S.; Conrad, R. High Abundance of Crenarchaeota in a Temperate Acidic Forest Soil. FEMS Microbiol. Ecol. 2007, 60, 447–448. [Google Scholar]
  36. Kim, B.S.; Oh, H.M.; Kang, H.; Chun, J. Archaeal Diversity in Tidal Flat Sediment as Revealed by 16S rDNA Analysis. J. Microbiol. 2005, 43, 144–151. [Google Scholar]
  37. Meuer, J.; Kuettner, H.C.; Zhang, J.K.; Hedderich, R.; Metcalf, W.W. Genetic Analysis of the Archaeon Methanosarcina Barkeri FUSARO Reveals a Central Role for Ech Hydrogenase and Ferredoxin in Methanogenesis and Carbon Fixation. PNAS 2002, 99, 5632–5637. [Google Scholar] [CrossRef]
  38. Castro, H.; Ogram, A.; Reddy, K.R. Phylogenetic Characterization of Methanogenic Assemblages in Eutrophic and Oligotrophic Areas of the Florida Everglades. Appl. Environ. Microbiol. 2004, 70, 6559–6568. [Google Scholar] [CrossRef]
  39. Conrad, R. Contribution of Hydrogen to Methane Production and Control of Hydrogen Concentrations in Methanogenic Soils and Sediments. FEMS Microbiol. Ecol. 1999, 28, 193–202. [Google Scholar] [CrossRef]
  40. Marick, T.; Fischer, H.; Conen, F.; Smith, K. Seasonal Variations in Stable Carbon and Hydrogen Isotope Ratio in Methane from Rice Fields. Global Biogeochem. Cycles 2002, 16, 41–52. [Google Scholar]
  41. Moura, J.M.S. Variação na Composição Isotópica do Metano (CH4) em Sedimentos de Igarapés na Amazônia Oriental.; (Dissertação Mestrado em Ecologia de Agroecossistemas); Escola Superior de Agricultura “Luiz de Queiroz”; Universidade de São Paulo: Piracicaba, Brazil, 2005; p. 82. [Google Scholar]
  42. Whiticar, M.J. Carbon and Hydrogen Isotope Systematic of Bacterial Formation and Oxidation of Methane. Chem. Geol. 1999, 161, 291–314. [Google Scholar] [CrossRef]
  43. Kemnitz, D.; Kolb, S.; Conrad, R. Phenotypic Characterization of Rice Cluster III Archaea Without Prior Isolation by Applying Quantitative Polymerase Chain Reaction to an Enrichment Culture. Environ. Microbiol. 2005, 7, 553–565. [Google Scholar] [CrossRef]
  44. Schloss, P.D.; Handelsman, J. Introducing SONS, a Tool for Operational Taxonomic Unit–based Comparisons of Microbial Community Memberships and Structures. Appl. Environ. Microbiol. 2006, 72, 6773–6779. [Google Scholar] [CrossRef]
  45. Torsvik, V.; Goksoyr, J.; Daae, F.L. High Diversity in DNA of Soil Bacteria. Appl. Environ. Microbiol. 1990, 56, 782. [Google Scholar]
  46. Bornerman, J.; Triplett, E.W. Molecular Diversity in Soils from Eastern Amazonia: Evidence for Unusual Microorganisms and Microbial Population Shifts Associated with Deforestation. Appl. Environ. Microbiol. 1997, 63, 2647–2653. [Google Scholar]
  47. Fierer, N.; Jackson, R.B. The Diversity and Biogeography of Soil Bacterial Communities. PNAS 2006, 103, 626–631. [Google Scholar] [CrossRef]
  48. Tamura, K.; Dudley, J.; Nei, M.; Kumar, S. MEGA4: Molecular Evolutionary Genetics Analysis (MEGA) Software Version 4.0. Mol. Biol. Evol. 2007, 24, 1596–1599. [Google Scholar] [CrossRef]
  49. Saitou, N.; Nei, M. The Neighbor–Joining Method: A New Method for Reconstructing Phylogenetic Trees. Mol. Biol. Evol. 1987, 4, 406–425. [Google Scholar]
  50. Buckley, D.H.; Graber, J.R.; Schmidt, T.M. Phylogenetic Analysis of Nonthermophilic Members of the Kingdom Crenarchaeota and their Diversity and Abundance in Soils. Appl. Environ. Microbiol. 1998, 64, 4333–4339. [Google Scholar]
  51. Clementino, M.M.; Fernandes, C.C.; Vieira, R.P.; Cardoso, A.M.; Polycarpo, C.R.; Martins, O.B. Archaeal Diversity in Naturally Occurring and Impacted Environments from a Tropical Region. J. Appl. Microbiol. 2006, 103, 141–151. [Google Scholar]
  52. Chauhan, A.; Reddy, K.R.; Ogram, A.V. Syntrophic-Archaeal Associations in a Nutrient–Impacted Freshwater Marsh. J. Appl. Microbiol. 2006, 100, 73–84. [Google Scholar] [CrossRef]
  53. Stein, L.Y.; La Duc, M.T.; Grundl, T.J.; Nealson, K.H. Bacterial and Archaeal Populations Associated with Freshwater Ferromanganous Micronodules and Sediments. Environ. Microbiol. 2001, 3, 10–18. [Google Scholar] [CrossRef]
  54. Erkel, C.; Kube, M.; Reinhardt, R.; Liesack, W. Genome of Rice Cluster I Archaea—The Key Methane Producers in the Rice Rhizosphere. Science 2006, 313, 370–372. [Google Scholar] [CrossRef]
  55. Lueders, T.; Friedrich, M.W. Archaeal Population Dynamics during Sequential Reduction Processes in Rice Field Soil. Appl. Environ. Microbiol. 2000, 66, 2732–2742. [Google Scholar] [CrossRef]
  56. Chelius, M.K.; Triplett, E.W. The Diversity of Archaea and Bacteria in Association with the Roots of Zea Mays L. Microb. Ecol. 2001, 41, 252–263. [Google Scholar]
  57. Yan, B.; Hong, K.; Yu, Z.N. Archaeal Communities in Mangrove Soil Characterized by 16S rRNA Gene Clones. J. Microbiol. 2006, 44, 566–571. [Google Scholar]
  58. Kasai, Y.; Takahata, Y.; Hoaki, T.; Watanabe, K. Physiological and Molecular Characterization of a Microbial Community Established in Unsaturated, Petroleum-Contaminated Soil. Environ. Microbiol. 2005, 7, 806–818. [Google Scholar] [CrossRef]
  59. Donovan, S.E.; Purdy, K.J.; Kane, M.D.; Eggleton, P. Comparison of Euryarchaea Strains in the Guts and Food-soil of the Soil–feeding Termite Cubitermes Fungifaber across Different Soil Types. Appl. Environ. Microbiol. 2004, 70, 3884–3892. [Google Scholar] [CrossRef]
  60. Winter, C.; Smit, A.; Herndl, G.L.; Weinbauer, M.G. Impact of Virioplankton on Archaeal and Bacterial Community Richness as Assessed in Seawater Batch Cultures. Appl. Environ. Microbiol. 2004, 70, 804–813. [Google Scholar] [CrossRef]
  61. Cury, J.C. Diversidade de Bacteria e Archaea em Solos de Mangue e Marisma.; (Tese Doutorado em Solos e Nutrição de Plantas); Escola Superior de Agricultura “Luiz de Queiroz”; Universidade de São Paulo: Piracicaba, Brazil, 2006; p. 147. [Google Scholar]
  62. Garcia, J.L.; Patel, B.K.C.; Ollivier, B. Taxonomic Phylogentic and Ecological Diversity of Methanogenic Archaea. Anaerobe 2000, 6, 205–226. [Google Scholar] [CrossRef]
  63. Madigan, M.T.; Martinko, J.M.; Parker, J. Microbiologia de Brock, 10th ed.; Editora Pearson Education do Brasil: São Paulo, Brasil, 2004. [Google Scholar]
  64. Reeve, J.N.; Nölling, J.; Morgan, R.M.; Smith, D.R. Methanogenesis: Genes, Genomes, and Who’s on First? J. Bacteriol. 1997, 179, 5975–5986. [Google Scholar]
  65. Balch, W.E.; Fox, G.E.; Magrum, L.J.; Woese, C.R.; Wolfe, R.S. Methanogens: Reevaluation of a Unique Biological Group. Microbiol. Rev. 1979, 43, 260–296. [Google Scholar]
  66. Oremland, R.S. Biogeochemistry of Methanogenic Bacteria. In Biology of Anaerobic Microorganisms; Zehnder, A.J.B., Ed.; John Wiley & Sons: Wageningen, Netherlands, 1988. [Google Scholar]
  67. Hungate, R.E. A Roll-Tube Method for Cultivation of Strict Anaerobes. Methods Microbiol. 1969, 3, 117–132. [Google Scholar] [CrossRef]
  68. Thórsson, A.E.; Sverrisson, H.; Anamthawat-Jónsson, K. Genotyping Icelandic Isolates of Rhizobia Based on rDNA-RFLP. Icel. Agric. Sci. 2000, 13, 17–25. [Google Scholar]
  69. Wright, A.D.G.; Pimm, C. Improved Strategy for Presumptive Identification of Methanogens Using 16S Riboprinting. J. Microbiol. Methods 2003, 55, 337–349. [Google Scholar] [CrossRef]
  70. Whitby, C.; Earl, J.; Lanyon, C.; Gray, S.; Robinson, J.; Meadows, J.; Edwards, C. The Molecular Diversity of the Methanogenic Community in a Hypereutrophic Freshwater Lake Determined by PCR-RFLP. J. Appl. Microbiol. 2004, 97, 973–984. [Google Scholar] [CrossRef]
  71. Joulian, C.; Ollivier, B.; Patel, B.K.C.; Roger, P.A. Phenotypic and Phylogenetic Characterization of Dominant Culturable Methanogens Isolated from Ricefield Soils. FEMS Microbiol. Ecol. 1998, 25, 135–145. [Google Scholar] [CrossRef]
  72. Simankova, M.V.; Kotsyurbenko, O.R.; Lueders, T.; Nozhevnikova, A.N.; Wagner, B.; Conrad, R.; Friedrich, M.W. Isolation and Characterization of New Strains of Methanogens from Cold Terrestrial Habitats. Syst. Appl. Microbiol. 2003, 26, 312–318. [Google Scholar] [CrossRef]
  73. Garrity, G.M.; Holt, J.H. A Road Map to the Manual. In Bergey’s Manual of Systematic Bacteriology, 2nd ed.; Boone, D.R., Castenholz, G.M., Garrity, G.M., Eds.; Springer Verlag: Berlin, Germany, 2001. [Google Scholar]
  74. Le Mer, J.; Roger, P. Production, Oxidation, Emission and Consumption of Methane by Soils: A review. Eur. J. Soil Sci. 2001, 37, 25–50. [Google Scholar]
  75. Adashi, K. Isolation of Hydrogenotrophic Methanogenic Archaea from a Subtropical Paddy Field. FEMS Microbiol. Ecol. 1999, 30, 77–85. [Google Scholar] [CrossRef]

