Nucleotide Diversities and Genetic Relationship in the Three Japanese Pine Species; Pinus thunbergii, Pinus densiflora, and Pinus luchuensis

Abstract
: The nucleotide diversities and genetic relationship in the three Japanese pine species, P. thunbergii, P. densiflora, and P. luchuensis, were measured using low-copy anchor loci in Pinaceae. The average nucleotide diversity among these three Japanese pines revealed that P. thunbergii was the highest (6.05 × 10⁻³), followed by P. densiflora (5.27 × 10⁻³) and P. luchuensis (5.02 × 10⁻³). In comparison to other conifer species, it was concluded that the pines possessed an intermediate level of nucleotide diversity. The Heat shock protein (HSP) gene in P. thunbergii, Phenylalanine tRNA synthetase, RuBP carboxylase, and Disease resistance response protein 206 genes in P. densiflora were significantly deviated from standard neutral models. Some of these genes were related to stress or pathogen/defense response. As the samples used in this study were collected from natural populations that showed specific characteristics of being resistant to pine wilt nematode, it was hypothesized that the initial selection was an important factor in discriminating the deviation from neutrality models. Phylogenetic reconstruction revealed that the three Japanese pines were split into two lineages corresponding to P. densiflora and P. thunbergii–P. luchuensis. The latter lineage was differentiated further into two clades; P. thunbergii and P. luchuensis. The result concludes that the three Japanese pines are closely related and P. thunbergii is genetically closer to P. luchuensis, than P. densiflora.1. Introduction
Analyzing the amounts and patterns of nucleotide diversity within and between species is important to comprehend the mechanisms of evolution by which genetic diversity is maintained and the processes of genetic polymorphisms within species become transformed into genetic divergence between species [1]. Such diversities are influenced by evolutionary processes, such as mutation, recombination, selection, and population structures.
Single nucleotide polymorphisms (SNPs) are co-dominant, typically bi-allelic markers with high abundance and stability in many eukaryotic organisms [2,3]. In several model species, such as Drosophila [4], Arabidopsis [5,6], and maize [7], studies of nucleotide diversities using SNPs have been conducted. However, studies of the amounts and patterns of genetic diversities in non-model and higher plants, such as forest tree species are still relatively scarce [8]. Hamrick and Godt [9] reported that nucleotide diversity in higher plants is strongly affected by life history traits, such as generation time, pollination mechanisms, and mating systems. Therefore, there is a need to conduct investigations of the nucleotide diversity on higher plants which possess different life history traits from the annual selfing Arabidopsis and the annual outcrossing maize.
Based on morphological and molecular data, Pinus has been divided into two monophyletic subgenera: Haploxylon (subgenus Strobus, with one fibrovascular bundle in a needle) and Diploxylon (subgenus Pinus, with two fibrovascular bundles in a needle) [10,11]. These subgenera have been further divided into sections and subsections [12]. In this study, we focused on the Japanese species of subgenus Pinus, Pinus thunbergii Parl., P. densiflora Sieb. and Zucc., and P. luchuensis Mayr. These three Japanese pine species were grouped into the same subsection of Pinus [13]. P. thunbergii and P. densiflora were widely distributed across the Japanese archipelago excepting the Hokkaido and Ryukyu Islands. P. luchuensis, however, was naturally distributed specifically in coastal forests on the Ryukyu Islands [14,15]. These three Japanese pines are considered an attractive model of forest trees with respect of its nucleotide diversities and its phylogenetic relationship.
A recent study using low-copy anchor loci [16,17] exposed the usefulness of multiple markers for unraveling the nucleotide diversity and phylogenetic analysis at low taxonomic levels. These studies suggest that independent markers that sample a range of substitution rates and patterns can provide a greater resolution than chloroplast and nuclear-ribosomal DNA for resolving relationship analysis among closely related species. The large genome size of pines (22–37 pg/2C; [18]) hinders the development and application of low-copy anchor loci for nucleotide diversity and phylogenetic analysis [19]. However, despite this problem, efforts to develop low-copy anchor loci have been directed toward P. taeda L. and P. pinaster Aiton which revealed a large number of low-copy anchor loci that show orthology across pine species [20-23]. Because these conifer anchor loci show strong evidence for positional orthology, they are promising candidates for nucleotide diversity and phylogenetic analysis in other pine species [21].
In this study, we investigated the potential of fifteen conifer anchor loci to resolve nucleotide diversities and phylogenetic relationship among the three Japanese pine species of P. thunbergii, P. densiflora, and P. luchuensis.
2. Materials and Methods
2.1. Sample and DNA Extraction
Sixteen individuals in each of the P. thunbergii, P. densiflora, and P. luchuensis species were used in this study (Table 1). P. thunbergii and P. densiflora samples were selected from germplasm collection of Kyushu Regional Breeding Office, the Forest Tree Breeding Center (FTBC), Japan. P. luchuensis samples were collected from the Okinawa Prefectural Forest Resources Research Center, Japan. These samples were initially collected from natural populations that showed favorable characteristics of resistance to pine wilt nematode (PWN). Additionally, we also collected two samples each of P. taeda and P. palustris Mill. as an out-group. In comparison to the three Japanese pine species, P. taeda and P. palustris were classified into different subsections of Australes [13]. P. taeda were obtained from Kyushu Regional Breeding Office, FTBC, whereas P. palustris were sampled from the arboretum of Kyushu University, Japan.
Total genomic DNA from each individual sample was extracted from needle tissue using the modified cetyltrimethyl ammonium bromide (CTAB) method [24] from those of Murray and Thompson [25]. The extracted DNA was further purified by MagneSil-Red (Promega) based on the manufacturer's instructions. Based on previously published low-copy anchored loci in Pinaceae [20-22,26], 21 loci were initially screened. PCR reactions were performed in a total volume of 10 μL containing 1 × PCR buffer (Invitrogen), 1.5 mM MgCl2, 0.2 mM each dNTP, approximately 20 ng of template DNA and 0.25 U Platinum Taq DNA polymerase (Invitrogen).
PCR amplifications were conducted in a Biometra T1 thermocycler (Biometra) using the modified ‘touchdown’ PCR [27] as follows: 94 °C for 1 min, followed by 10 cycles touchdown of 94 °C for 30 s, 60 to 55 °C (decreasing 0.5 °C per cycle) or 56–50 °C (decreasing 0.6 °C per cycle) for 30 s, and 72 °C for 1 min, followed by 25 cycles of 94 °C for 30 s, 55 °C or 50 °C for 30 s and 72 °C for 1 min, with a final extension of 2 min at 72 °C. Annealing temperatures were specifically optimized for the respective primer pair (Table 2). The sequences of the primer pairs used in PCR reactions are given in Table 2. Five microliters of PCR products were electrophoresed on a 1.2% agarose gel to check the successfulness of PCR amplification.
Primers which produced single and clear PCR amplifications in all 52 samples were used for direct-sequencing (Table 2). PCR products of 15 primer pairs selected through preliminary screening were purified using 2.0 U exonuclease-I (Exo-I; New England Biolabs) and 2.0 U antarctic phosphatase (AP; New England Biolabs) to remove the excess of primers and dNTPs. Exo-AP treated PCR products were directly sequenced by using the BigDye Terminator Sequencing v3.1 kit (Applied Biosystems). Capillary electrophoresis was conducted on ABI 3130 automated sequencer (Applied Biosystems). All samples were sequenced in both directions at least once. For each locus, the forward and reverse reads were analyzed using the Sequencher v4.2 (GeneCodes Corp). A putative SNP was accepted as a genuine polymorphism if all chromatograms were unambiguous and all quality scores exceed 25 at that site. Resequencing was performed when necessary to maintain these criteria. Only sequences that matched the criteria were used for further analysis. The confounding effect of indels which produce overlapping phase shifts under condition of direct sequencing was overcome by resequencing the megagametophytic DNA of the corresponding sample. Four to eight megagametophytes were used to identify the indels. We also designed an additional primer pair (Pt_2763 2F and 2R in Table 2) for sequencing reaction in locus Pt_2763 because of its longer PCR product. All sequences obtained were deposited in the DNA Data Bank of Japan database (Accession numbers AB605617 - AB605618, AB605666 - AB605707, AB605731 - AB605761).
2.2. Data Analyses
Nucleotide diversity (π) at the level of the gene fragment represents the proportion of nucleotides that differ between two sequences, averaged over all available pairs of sample comparison was computed from the number of polymorphic SNP sites on a base pair basis [28]. Insertions and deletions were excluded from this analysis. To test for the departures from the standard neutral model of evolution, three models of Tajima's D [29], Fu and Li's F*, and D* [30] statistics were computed to obtain insights into the hypothesis of selective neutrality. Non-significant value indicates no evidence for evolutionary selection. The above analyses were performed using DnaSP v5 [31]. To control for an elevated rate of false positives resulting from multiple testing, the standard Bonferroni correction was applied.
The distribution of SNP along gene fragments was examined to understand if nucleotide diversity was distributed randomly or organized in haplotypes. Since the diploid samples were used for sequencing, direct determination of the allelic haplotypes were complicated. Thus, haplotypes were inferred using PHASE v.2.1.1 [32,33] that included in DnaSP v5. A similar situation was experienced with grapevine [34] and cassava [35]. Haplotype based gene diversity (Hd) was estimated for each polymorphic gene fragment using DnaSP v5.
Polymorphic information content (PIC) value for each identified SNP site was calculated as described by Botstein et al. [36]. Observed heterozygosity (Ho) was calculated as the proportion of heterozygous individuals at each polymorphic site. PIC, Ho, and expected heterozygosity (He) were calculated using Cervus v3.0.3 [37].
In order to construct a large phylogenetic data set, all locus sequences were concatenated in each individual case. Sequence alignment was carried out using ClustalW with gaps opening and extension penalties of 15, and 6.66, respectively. Phylogenetic relationship analysis was conducted according to maximum likelihood method [38] with the Tamura-Nei model and 1,000 bootstrap replications. The analysis was conducted using PhyML v3.0 [39]. P. taeda and P. palustris sequences were included for concatenation and used as an out-group in the analysis.
3. Results
The approach used here was based on the direct-sequencing of low copy anchored loci in Pinaceae. PCR amplification was performed using primer pairs designed from these loci [20-22,26], which targeted the intron and/or 3′ un-translated region [20] of the selected gene fragments. Of the screened 21 primer pairs, 15 (71%) produced single and clear PCR products ranging from 211 to 918 bp (Table 2); while the remaining 6 (29%) were produced multiple PCR products or no PCR amplifications. In total 5,825 bp sequences were obtained from 15 loci in each pine species or 275,552 bp (5,825 bp × 32 samples, and 5,822 bp × 16 samples; excluding the out-group samples). Every amplicon was sequenced from all 16 samples of each pine species.
A total of 122 SNPs in P. thunbergii; 140 SNPs in P. densiflora; and 115 SNPs in P. luchuensis were identified from the sequences, giving a frequency of one SNP per 48 bp, 42 bp, and 51 bp, respectively (Table 3). The number of SNPs per locus in P. thunbergii varied from 2 (PtIFG_2358) to 20 (PtIFG_2274). In P. densiflora, SNPs were spanned from 3 (PtIFG_9151) to 21 (PtIFG_2274). In P. luchuensis, SNPs were varied from zero (PtIFG_2358) to 17 (Pt_2763).
The estimated nucleotide diversity within each species was varied among loci (Table 3). Nucleotide diversity (π) in P. thunbergii spanned from 0.44 × 10⁻³ in PtIFG_2358 to 16.26 × 10⁻³ in PpINR_AS01C7 (average of 6.05 ×10⁻³). Nucleotide diversities in P. densiflora and P. luchuensis were varied from 1.78 × 10⁻³ in PtIFG_1643 to 9.62 × 10⁻³ in PtIFG_1584 (average of 5.27 × 10⁻³), and from 0.00 in PtIFG_2358 to 9.95 × 10⁻³ in PtIFG_2274 (average of 5.02 × 10⁻³), respectively.
The number of haplotypes varied among loci in each species. In P. thunbergii, the number of haplotypes of each locus varied from 2 in PtIFG_2358 to 9 in PtIFG_2274, with an average of 5.1 haplotypes per locus. In P. densiflora and P. luchuensis, the number of haplotypes per locus ranged from 3 in PtIFG_606 and PtIFG_9151 to 13 in PtIFG_2274, with an average of 6.3; and from 1 in PtIFG_2358 to 7 in Pt_2763, with an average of 4.5 (Table 3), respectively. Haplotype diversity (Hd) in P. thunbergii and P. densiflora was highest in locus PtIFG_2274 (0.891 and 0.897, respectively) and lowest in locus PtIFG_2358 (0.063 and 0.236, respectively). In P. luchuensis however, the highest Hd was observed in locus PtIFG_606 (0.776) and lowest in locus PtIFG_2358 (0.000). Average haplotype diversities (Hd; 0.586, 0.586, and 0.521 in P. thunbergii, P. densiflora, and P. luchuensis, respectively) were found to be roughly similar in the three pines species, in which an intermediate diversity level was concluded.
According to Clarke et al. [40], the maximum number of expected haplotypes from segregation sites (s) is s + 1. In our results, however, only five loci, PtIFG_1643 (in P. densiflora), PtIFG_2358 (in P. luchuensis), PtIFG_8702 (in P. densiflora and P. luchuensis), PtIFG_9151 (in P. thunbergii and P. luchuensis), and PpINR_AS01H04 (in P. thunbergii) were consistent with this rule (Table 3). In most loci, the major haplotypes are accompanied by a series of low frequency haplotypes (data not shown). The frequency of the minor allele (q in Supplementary Data) varied from 0.031 to 0.500 in P. thunbergii and P. densiflora, and 0.031 to 0.469 in P. luchuensis. Even though variations were observed between numbers of discovered SNPs and haplotypes among the loci, positive correlations (r = 0.831 in P. thunbergii, r = 0.925 in P. densiflora, and r = 0.886 in P. luchuensis) were evidenced between the number of SNP sites identified for a locus and its number of inferred haplotypes.
The observed heterozygosity (Ho) of each SNP locus in P. thunbergii, P. densiflora and P. luchuensis were spanned from 0.000 to 0.563; 0.000 to 0.625; and 0.000 to 0.688, respectively (see Supplementary Data). Accordingly, the expected heterozygosity (He) in P. thunbergii and P. densiflora showed the same results, ranging from 0.063 to 0.516. In P. luchuensis however, it ranged from 0.063 to 0.514. The same range of PIC (0.059 to 0.375) was revealed in P. thunbergii and P. densiflora, whereas in P. luchuensis, it ranged from 0.059 to 0.374.
We employed three neutrality tests (Tajima's D, Fu and Li's D*, and Fu and Li's F*) to assess whether signatures of selection were present in the loci. The results of these tests are shown in Table 4. In P. thunbergii, all loci had non-significant deviation from the three models of neutrality tests with the exception of locus PpINR_AS01C7 (Fu and Li's D* = 1.499; Fu and Li's F* = 1.687). Significant deviations were also detected in loci PtIFG_2358 (Tajima's D = −2.068; Fu and Li's D* = −3.371; Fu and Li's F* = −3.474), PpINR_AS01H04 (Tajima's D = 2.393; Fu and Li's F* = 1.880), and Pt_3113 (Tajima's D = −1.838) in P. densiflora, although almost all of the significant deviations had disappeared (except in loci PtIFG_2358 (Fu and Li's D* and F*), and PpINR_AS01H04 (Fu and Li's F*)) after Bonferroni correction. The significantly positive values from the neutrality tests are indicative of balancing or diversifying selection for two or more alleles, whereas significant negative values are indicative of negative or purifying selection against genotypes carrying the less frequent alleles, and/or are indicative of a recent population bottleneck eliminating less frequent alleles [1,29].
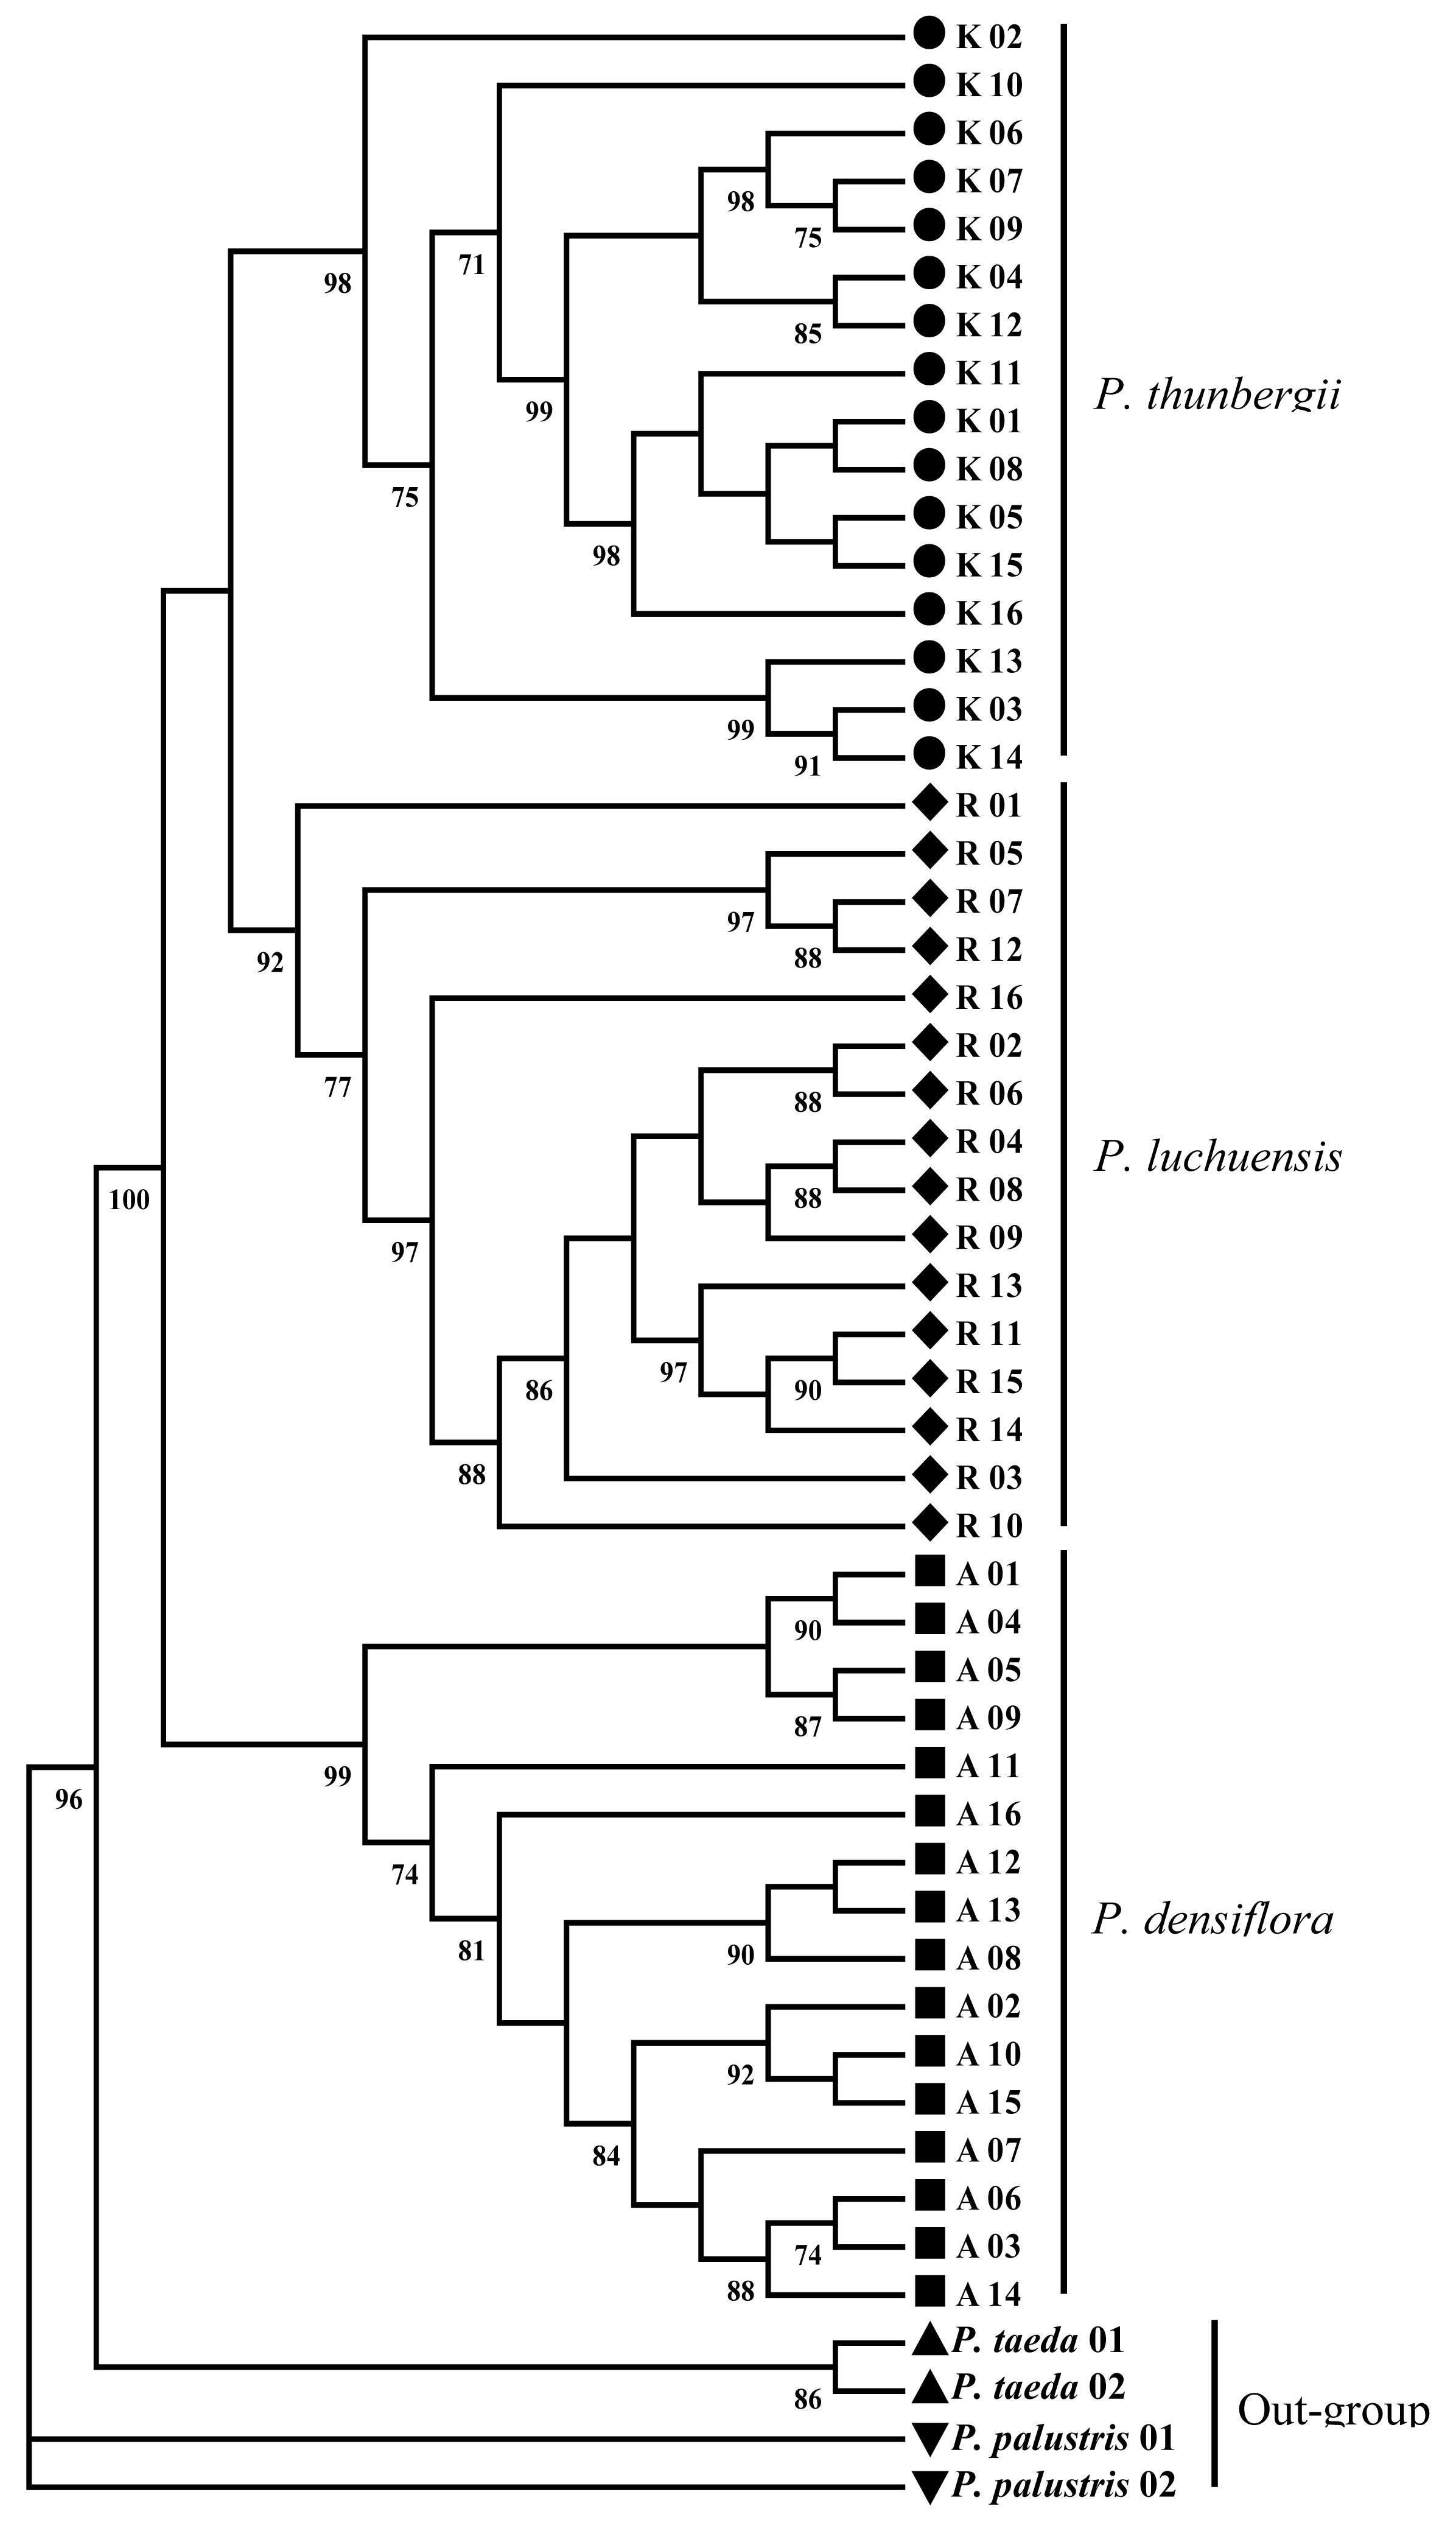
Phylogenetic reconstruction revealed that the three Japanese pines were split into two lineages corresponding to P. densiflora with high bootstrap support (BS > 85%), and P. thunbergii–P. luchuensis, however, with low (BS < 50%; Figure 1). The lineage P. thunbergii–P. luchuensis was differentiated further into two clades; one included P. thunbergii (BS = 98%), and P. luchuensis (BS = 92%) in another clades (Figure 1). The low bootstrap of the lineage P. thunbergii–P. luchuensis was consistent with the result of the neighbor-joining method (data not shown).
4. Discussion
The major objective of this study was to assess the nucleotide diversities and to construct phylogenetic relationship in P. thunbergii, P. densiflora, and P. luchuensis using the characterized SNPs in selected loci of low-copy gene fragments. This study identified 122 SNPs (an average of one SNP per 48 bp), 140 SNPs (an average of one SNP per 42 bp), and 115 SNPs (an average of one SNP per 51 bp) in P. thunbergii, P. densiflora, and P. luchuensis, respectively. In comparison to other conifer species, SNP frequencies discovered in P. thunbergii and P. densiflora were roughly similar to that found in Pseudotsuga menziesii Mirb. (one SNP per 46 bp) [41]. In P. luchuensis, the SNP frequency was found to be similar to that found in P. taeda (one SNP per 50 bp) [42]. Populus tremula L. was shown lower SNP frequency, in which one SNP was found in every 60 bp [43]. In Populus nigra L. however, SNP frequency was detected in a higher frequency, in which one SNP was found in every 26 bp over the nine sequenced genes [44].
Average nucleotide diversities among the three Japanese pines revealed that P. thunbergii possessed the highest value (6.05 ×1 0−3), followed by P. densiflora (5.27 × 10⁻³), and P. luchuensis (5.02 × 10⁻³) (Table 3). In comparison to P. menziesii [41], P. nigra [44], Arabidopsis [45], and Drosophila [46] as compiled in [47], the nucleotide diversities in these Japanese pine species were 1.1–1.3 folds lower. However, in comparison with P. taeda [42], the nucleotide diversities were similar. These values were 2.5–3.0 fold higher than in Cryptomeria japonica D.Don [48,41], P. pinaster, and Pinus radiata D.Don [49]. Based on these comparisons, we concluded that the level of nucleotide diversities in the three Japanese pines species were intermediate in the range of published conifer values. This difference in diversity level of some species is not surprising as distinct genetic backgrounds are generally present among species. Further investigation of nucleotide diversity in more diverse populations, including the P. thunbergii and P. densiflora from Korean peninsula, P. densiflora from Shandong and eastern Manchuria in China, and southern Ussuriland in Russia, or P. luchuensis from Taiwan and a wider area of the Ryukyu Islands would be useful to achieve a better understanding on overall genetic diversity.
In general, the total nucleotide diversities in conifers are somewhat similar or lower than that of Arabidopsis (total nucleotide diversity = 7.0 × 10⁻³ [45]) and Zea mays L. (total nucleotide diversity = 9.60 × 10⁻³ [7]). The mutation rates per generation in conifers are expected to be high because of their long generation time, if mutation rates per year are constant. Therefore, the conifer population size may be smaller than those in Arabidopsis and Z. mays. However, estimated mutation rates per year in angiosperms are generally higher than those in conifer [50]. The mutation rates per year are estimated to be 1.5 × 10⁻⁸ in Arabidopsis [5], and 5.99–7.00 × 10⁻⁹ in Z. mays [51], while corresponding estimates in Pinus spp. are 0.70–1.31 × 10⁻⁹ [52], and in Cupressaseae, 1.9 × 10⁻⁹ [53]. By assuming that divergence time is, for example 100 mya, the effect of the long generation time in conifers may be balanced by the low mutation rate.
Although values of nucleotide diversity were found to be higher in P. thunbergii than in P. densiflora, haplotype diversity in P. thunbergii was similar to that in P. densiflora. (Table 3). This discrepancy seems to be due to deviations from the standard neutral models (which assumes neutrality and random mating) in P. thunbergii, as detected in PpINR_AS01C7 (Heat shock protein (HSP) gene), and in P. densiflora, as indicated in PtIFG_2358 (Phenylalanine tRNA synthetase gene), PpINR_AS01H04 (RuBP carboxylase gene), and Pt_3113 (Disease resistance response protein 206 gene) (Table 4). These deviations from the standard neutral model may be due to either the effect of past population structure or selection [29,54]. The Heat shock protein (HSP) and Disease resistance response protein 206 genes were suspected to be genes related to stress-related or pathogen/defense responses [55,56]. As previously stated (see Experimental Section), the currently used pine samples were initially collected from natural populations that showed special resistance characteristics to PWN. The initial selection might have affected the deviation from neutrality model. However, we bore in mind that the deviation could also have been due to an artifact of breeding. Therefore, a further investigation on resistant genes to PWN is necessary.
The informativeness of a genetic marker depends on the number of detected allele frequencies; accordingly this is quantified by the polymorphic information content (PIC). The highest PIC value of individual SNP in P. thunbergii was 0.375 at polymorphic sites 441 bp, 456 bp, 466 bp and 471 bp of Pt_3113. In P. densiflora, the highest individual PIC value was 0.375 at polymorphic sites 48 bp of PtIFG_1584), 182 bp and 237 bp of PpINR_AS01H04. The highest PIC value of individual SNP in P. luchuensis was 0.374, detected at polymorphic sites 403 bp, 414 bp, 459 bp, 464 bp of PtIFG_2274, 34 bp, 164 bp of PpINR_Pp.ap9, and 441 bp, 456 bp, 466 bp and 471 bp of Pt_3113.
The inferred phylogeny using low copy anchor loci clearly showed that the three Japanese pines split into two lineages, one comprising P. densiflora, and the other P. thunbergii–P. luchuensis (Figure 1). The result concludes that the three Japanese pines were closely related, in which P. thunbergii seems to be genetically closer to P. luchuensis, than P. densiflora. The result was in accordance with the previously published karyotype study of P. thunbergii, P. densiflora, and P. luchuensis which revealed that the karyotype of P. luchuensis resembled that of P. thunbergii more than P. densiflora [57]. Hizume et al. [14] compared fluorescent banding patterns of these three Japanese pines, and also suggested that P. thunbergii, P. densiflora, and P. luchuensis were closely related, and that P. luchuensis was more closely related to P. thunbergii than P. densiflora. Our result was in accordance with these previous cytogenetical researches.
5. Conclusions
We presented the first analysis of the amount and patterns of nucleotide diversity in the three Japanese pines, P. thunbergii, P. densiflora, and P. luchuensis. By using the low copy anchor loci in Pinaceae, the nucleotide diversity in the three Japanese pines was at an intermediate level compared with the published nucleotide diversities in conifers. Phylogenetic reconstruction showed that two lineages corresponding to P. densiflora and P. thunbergii–P. luchuensis were assumed. In conclusion, the three Japanese pines were genetically close-related, in which P. thunbergii was genetically closer to P. luchuensis than P. densiflora.

| P. thunbergii | P. densiflora | P. luchuensis | ||||||
|---|---|---|---|---|---|---|---|---|
| ID | Island | Individual | ID | Island | Individual | ID | Island | Individual |
| K01 | Shikoku | Namikata-37 | A01 | Honshu | Akasaka-88 | R01 | Ryukyu | Arashiyama-2 |
| K02 | Shikoku | Nakimata-73 | A02 | Honshu | Bizen-40 | R02 | Ryukyu | Arashiyama-3 |
| K03 | Kyushu | Ooseto-12 | A03 | Honshu | Kasaoka-124 | R03 | Ryukyu | Arashiyama-11 |
| K04 | Kyushu | Ei-425 | A04 | Honshu | Kibi-70 | R04 | Ryukyu | Arashiyama-24 |
| K05 | Shikoku | Misaki-90 | A05 | Honshu | Miyajima-54 | R05 | Ryukyu | Arashiyama-33 |
| K06 | Shikoku | Mitoyo-103 | A06 | Kyushu | Arita-49 | R06 | Ryukyu | Arashiyama-37 |
| K07 | Kyushu | Obama-30 | A07 | Kyushu | Kumamoto-63 | R07 | Ryukyu | Arashiyama-41 |
| K08 | Kyushu | Oita-8 | A08 | Kyushu | Kunimi-31 | R08 | Ryukyu | Arashiyama-67 |
| K09 | Kyushu | Ooseto-12 | A09 | Kyushu | Kurume-142 | R09 | Ryukyu | Arashiyama-106 |
| K10 | Kyushu | Shima-64 | A10 | Kyushu | Oita-204 | R10 | Ryukyu | Arashiyama-107 |
| K11 | Kyushu | Sendai-290 | A11 | Kyushu | Matsushima-58 | R11 | Ryukyu | Arashiyama-108 |
| K12 | Honshu | Tanabe-54 | A12 | Shikoku | Anan-55 | R12 | Ryukyu | Arashiyama-126 |
| K13 | Shikoku | Tosashimizu-63 | A13 | Shikoku | Niihama-7 | R13 | Ryukyu | Unknown 1 |
| K14 | Kyushu | Tsuyazaki-50 | A14 | Shikoku | Takamatsu-1 | R14 | Ryukyu | Unknown 2 |
| K15 | Shikoku | Yasu-37 | A15 | Shikoku | Tsuyaki-31 | R15 | Ryukyu | Unknown 3 |
| K16 | Shikoku | Yoshida-2 | A16 | Shikoku | Uwajima-18 | R16 | Ryukyu | Unknown 4 |
| Locus | Sequence (5′-3′) | Annealing temp (°C) a | PCR product (bp) | Best possible protein similarity b | Primer source |
|---|---|---|---|---|---|
| PtIFG_1643 | F: AATGGAGGATGCCGTTACAG R: AACCACTCTCGAATCCCCAC | 60–55 | 617 | ABI1 gene product | Temesgen et al. [20] |
| PtIFG_2274 | F: TGATCAGAGAGCTGGTGCAG R: AGATGAGCATCAGGTCAGCC | 60–55 | 534 | Adenylyl cyclase | Temesgen et al. [20] |
| PtIFG_2358 | F: GTTAACCCTCGAGGAGACATG R: GCTTCCACAGTCCACAATCTG | 60–55 | 286 | Phenylalanine tRNA synthetase | Temesgen et al. [20] |
| PtIFG_606 | F: TCATGAGGGGAGAAAGTTGG R: GGGCAGTCACTTGAACTTCG | 60–55 | 512 | RepJ/entE gene | Temesgen et al. [20] |
| PtIFG_8702 | F: GTTGCAGAAAAGGGTGGC R: AGTCGCACTTGCTCCAGTTC | 60–55 | 244 | Thioredoxin | Temesgen et al. [20] |
| PtIFG_8939 | F: ACGTGGACGAGCAGTCAAAG R: AACCACGAGCTTGGCATG | 60–55 | 276 | Ribosomal protein 40S S16 | Temesgen et al. [20] |
| PtIFG_9044 | F: AACTGGAGGAAAAGCACGAC R: CATCGCATCAGTCATACTCACC | 60–55 | 224 | Ribosomal protein 40S S27 | Temesgen et al. [20] |
| PtIFG_9151 | F: TAGTGAGCCCTGGAGCGTAC R: GCAGAATCTCAGCAGCAATG | 56–50 | 253 | Cucumber basic protein | Temesgen et al. [20] |
| PtIFG_8429 | F: GAGGCATTTATGAGGGAACG R: GTTGAAAGCGACTCCAAAGG | 56–50 | 211 | 3-DMOcytidylyl transferase | Brown et al. [21] |
| PtIFG_1584 | F: CGAAGCAAAGGATGTCACG R: TGTTGAGGTGGGGATTGG | 60–55 | 298 | Deoxychalcone synthase | Chagne et al. [22] |
| PpINR_AS01C7 | F: ACGCAGAGTAGAAACCAACA R: TCCCAGACAAGACAAACAAT | 56–50 | 278 | Heat Shock Protein (HSP) | Chagne et al. [22] |
| PpINR_AS01H04 | F: TAGCTGCTCCCCTCAAGACC R: GGCACCCACTTGTTCCTCA | 60–55 | 354 | RuBP carboxylase | Chagne et al. [22] |
| PpINR_Pp.ap9 | F: GCAGCGTTCGTCTTCATAAT R: GCGGTCACATGGAAAAACT | 56–50 | 289 | Hypothetical zinc finger protein | Chagne et al. [22] |
| Pt_2763 | 1F: AAAGAAAGAGGAAGAAGGCACTGTTG 1R: AGAATATCCTTGATAACTTTGCAGAGAC 2F: GGGATTCATGAGGATAGCCAGAA 2R: CTTAGTAGAGTGGTACCTGAGCAAGTCA | 56–50 | 918 (916)* | Heat shock protein | Mitsugi & Shiraishi [26] |
| Pt_3113 | F: TCCAAGAATTTCACAACAATGAAG R: TCTTTAAATATACTGCCCTAGACAGC | 56–50 | 531 (530)* | Disease resistance response protein 206 | Mitsugi & Shiraishi [26] |
atouchdown PCR protocol (see Experimental Section);bas reported in previously published paper of primer source;*number in parentheses indicates PCR product length detected in Pinus densiflora.
| Locus | Total SNP sites (Haplotype) | Hd | π | ||||||
|---|---|---|---|---|---|---|---|---|---|
| P. thu | P. den | P. luc | P. thu | P. den | P. luc | P. thu | P. den | P. luc | |
| PtIFG_1643 | 8 (6) | 4 (5) | 7 (5) | 0.681 | 0.599 | 0.472 | 3.60 | 1.78 | 1.95 |
| PtIFG_2274 | 20 (9) | 21 (13) | 16 (6) | 0.891 | 0.897 | 0.673 | 9.79 | 6.89 | 9.95 |
| PtIFG_2358 | 2 (2) | 9 (4) | 0 (1) | 0.063 | 0.236 | 0.000 | 0.44 | 2.54 | 0.00 |
| PtIFG_606 | 7 (3) | 4 (3) | 10 (6) | 0.232 | 0.419 | 0.776 | 2.18 | 2.39 | 4.96 |
| PtIFG_8702 | 5 (5) | 6 (7) | 2 (3) | 0.627 | 0.702 | 0.377 | 5.63 | 6.78 | 1.64 |
| PtIFG_8939 | 4 (3) | 7 (4) | 3 (2) | 0.331 | 0.500 | 0.444 | 3.09 | 4.47 | 5.16 |
| PtIFG 9044 | 7 (5) | 4 (4) | 8 (5) | 0.645 | 0.667 | 0.698 | 5.67 | 5.81 | 6.42 |
| PtIFG_9151 | 3 (4) | 3 (3) | 2 (3) | 0.236 | 0.280 | 0.232 | 0.98 | 2.03 | 1.01 |
| PtIFG_8429 | 11 (6) | 9 (6) | 8 (5) | 0.726 | 0.714 | 0.341 | 12.04 | 8.57 | 5.92 |
| PtIFG_1584 | 9 (4) | 12 (8) | 8 (6) | 0.700 | 0.778 | 0.583 | 10.63 | 9.62 | 8.77 |
| PpINR_AS01C7 | 13 (8) | 11 (6) | 9 (4) | 0.839 | 0.343 | 0.337 | 16.26 | 7.30 | 5.44 |
| PpINR_AS01H04 | 3 (4) | 7 (4) | 7 (5) | 0.698 | 0.663 | 0.655 | 2.49 | 9.10 | 4.61 |
| PpINR_Pp.ap9 | 6 (3) | 8 (6) | 6 (4) | 0.476 | 0.583 | 0.700 | 5.66 | 3.34 | 8.22 |
| Pt_2763 | 10 (8) | 17 (11) | 17 (7) | 0.861 | 0.831 | 0.774 | 2.80 | 4.56 | 4.10 |
| Pt 3113 | 14 (6) | 18 (10) | 12 (6) | 0.784 | 0.573 | 0.760 | 9.50 | 3.88 | 7.14 |
| Total/Average | 122 (5.1) | 140 (6.3) | 115 (4.5) | 0.586 | 0.586 | 0.521 | 6.05 | 5.27 | 5.02 |
P. thu, P. den, P. luc represent Pinus thunbergii, Pinus densiflora, and Pinus luchuensis, respectively. Hd, haplotype diversity; π, nucleotide diversity. Nucleotide diversity value is × 103. Numbers in parentheses indicate the number of haplotypes.
| Loci | Tajima's D | Fu and Li's D* | Fuand Li's F* | ||||||
|---|---|---|---|---|---|---|---|---|---|
| P. thu | P. den | P. luc | P. thu | P. den | P. luc | P. thu | P. den | P. luc | |
| PtIFG_1643 | 0.352 | 0.268 | −0.895 | −0.612 | −0.999 | −0.146 | −0.370 | −0.728 | −0.436 |
| PtIFG_2274 | 0.167 | −1.139 | 1.131 | 1.317 | −1.877 | 0.421 | 1.114 | −1.929 | 0.761 |
| PtIFG_2358 | −1.504 | −2.068* | N/A | −2.315 | −3.371* | N/A | −2.409 | −3.474* | N/A |
| PtIFG_606 | −1.043 | 0.591 | 0.069 | 0.562 | 1.051 | 0.309 | 0.087 | 1.064 | 0.275 |
| PtIFG_8702 | 0.284 | 0.308 | −0.386 | 1.138 | 0.423 | 0.798 | 1.028 | 0.453 | 0.533 |
| PtIFG_8939 | −0.495 | −0.844 | 1.817 | 1.051 | 1.269 | 0.942 | 0.693 | 0.732 | 1.385 |
| PtIFG_9044 | −0.784 | 0.786 | −0.827 | −0.146 | 0.026 | −0.612 | −0.396 | 0.290 | −0.792 |
| PtIFG_9151 | −1.548 | −0.716 | −1.047 | −1.508 | −0.283 | −0.759 | −1.761 | −0.473 | −0.971 |
| PtIFG_8429 | −0.222 | −0.595 | −1.110 | −0.092 | 0.182 | −0.612 | −0.156 | −0.068 | v0.893 |
| PtIFG_1584 | 1.278 | −0.122 | 0.518 | 1.366 | −0.920 | −0.410 | 1.566 | −0.786 | −0.145 |
| PpINR_AS01C7 | 1.304 | −0.817 | −0.991 | 1.499 * | 0.419 | 0.774 | 1.687 * | 0.039 | 0.269 |
| PpINR_AS01H04 | 0.422 | 2.393 * | −0.176 | 0.942 | 1.269 | −0.146 | 0.917 | 1.880 * | −0.181 |
| PpINR_Pp.ap9 | 0.278 | −1.538 | 1.673 | 1.209 | −1.256 | 1.209 | 1.083 | −1.569 | 1.572 |
| Pt_2763 | 0.110 | −0.035 | −0.364 | −0.239 | 0.859 | −0.963 | −0.153 | 0.674 | −0.907 |
| Pt_3113 | 1.815 | −1.838 * | 0.876 | 1.049 | −0.830 | 0.993 | 1.514 | −1.357 | 1.121 |
P. thu, P. den, P. luc represent Pinus thunbergii, Pinus densiflora, and Pinus luchuensis, respectively. Significant deviation from neutrality tests are indicated in bold;*significant at P < 0.05. N/A, not applicable.
Acknowledgments
We thank Mineko Ohira (Forest Tree Breeding Center, Kyushu Regional Breeding Office, Japan) and Yasuko Sakai (Okinawa Prefectural Forest Resources Research Center, Japan) for their help in collecting samples.
References
- Hartl, D.L. A Primer of Population Genetics, 3rd ed.; Sinauer: Sunderland, UK, 1999. [Google Scholar]
- Gupta, P.K.; Roy, J.K.; Prasad, M. Single nucleotide polymorphisms: A new paradigm for molecular marker technology and DNA polymorphism detection with emphasis in their use in plants. Curr. Sci. 2001, 80, 524–535. [Google Scholar]
- Rafalski, J.A. Novel genetic mapping tools in plants: SNPs and LD-based approaches. Plant Sci. 2002, 162, 329–333. [Google Scholar]
- Kreitman, M. Nucleotide polymorphism at the alcohol dehydrogenase locus of Drosophila melanogaster. Nature 1983, 304, 412–417. [Google Scholar]
- Koch, M.A.; Haubold, B.; Mitchell-Olds, T. Comparative evolutionary analysis of chalcone synthase and alcohol dehydrogenase loci in Arabidopsis, Arabis, and related genera (Brassicaceae). Mol. Biol. Evol. 2000, 17, 1483–1498. [Google Scholar]
- Nordborg, M.; Hu, T.T.; Ishino, Y.; Jhaveri, J.; Toomajian, C; Zheng, H.; Bakker, E. The pattern of polymorphism in Arabidopsis thaliana. PLoS Biol. 2005, 3, 1289–1299. [Google Scholar]
- Tenaillon, M.I.; Sawkins, M.C.; Long, A.D.; Gaut, R.L.; Doebley, J.F.; Gaut, B.S. Patterns of DNA sequence polymorphism along chromosome 1 of maize (Zea mays ssp. mays L.). Proc. Natl. Acad. Sci. USA 2001, 98, 9161–9166. [Google Scholar]
- Savolainen, O.; Pyhäjärvi, T. Genomic diversity in forest trees. Curr. Opin. Plant Biol. 2007, 10, 162–167. [Google Scholar]
- Hamrick, J.L.; Godt, M.J.W. Effects of life history traits on genetic diversity in plant species. Phil. Trans. R. Soc. Lond. B 1996, 351, 1291–1298. [Google Scholar]
- Mirov, N.T. The Genus Pinus; Ronald: New York, NY, USA, 1967. [Google Scholar]
- Wang, X-Q.; Tank, D.C.; Sang, T. Phylogeny and divergence times in Pinaceae: evidence from three genomes. Mol. Biol. Evol. 2000, 17, 773–781. [Google Scholar]
- Farjon, A. Pines: Drawings and Descriptions of the Genus; Brill & Backhuys: Leiden, The Netherlands, 1984. [Google Scholar]
- Price, R.A.; Liston, A.; Strauss, S.H. Phylogeny and Systematics of Pinus. In Ecology and Biogeography of Pinus; Richardson, D.M, Ed.; Cambridge University Press: Cambridge, UK, 1998; pp. 49–68. [Google Scholar]
- Hizume, M.; Arai, M.; Tanaka, A. Chromosome banding in the genus Pinus III. Fluorescent banding pattern of P. luchuensis and its relationship among the Japanese diploxylon pines. J. Plant Res. 1990, 103, 103–111. [Google Scholar]
- Chiang, Y.-C.; Hung, K.-H.; Schaal, B.A.; Ge, X.-J.; Hsu, T.-W.; Chiang, T.-Y. Contrasting phylogeographical patterns between mainland and island taxa of the Pinus luchuensis complex. Mol. Ecol. 2006, 15, 765–779. [Google Scholar]
- Harris, E.E.; Disotell, T.R. Nuclear gene trees and the phylogenetic relationships of the mangabeys (Primates: Papionini). Mol. Biol. Evol. 1998, 15, 892–900. [Google Scholar]
- Springer, M.S.; Debry, R.W.; Douady, C.; Amrine, H.M.; Madsen, O.; De Jong, W.W.; Stanhope, M.J. Mitochondrial versus nuclear gene sequences in deep-level mammalian phylogeny reconstruction. Mol. Biol. Evol. 2001, 18, 132–143. [Google Scholar]
- Grotkopp, E.; Rejmanek, M.; Sanderson, M.J.; Rost, T.L. Evolution of genome size in pines (Pinus) and its life-history correlates: supertree analyses. Evolution 2004, 58, 1705–1729. [Google Scholar]
- Kinlaw, C.S.; Neale, D.B. Complex gene families in pine genomes. Trends Plant Sci. 1997, 2, 356–359. [Google Scholar]
- Temesgen, B.; Brown, G.R.; Harry, D.E.; Kinlaw, C.S.; Sewell, M.M.; Neale, D.B. Genetic mapping of expressed sequence tag polymorphism (ESTP) markers in loblolly pine (Pinus taeda). Theor. Appl. Genet. 2001, 102, 664–675. [Google Scholar]
- Brown, G.R.; Kadel, E.E., III.; Bassoni, D.L.; Kiehne, K.L.; Temesgen, B.; van Buijtenen, J.P.; Sewell, M.M.; Marshall, K.A.; Neale, D.B. Anchored reference loci in loblolly pine (Pinus taeda L.) for integrating pine genomics. Genetics 2001, 159, 799–809. [Google Scholar]
- Chagné, D.; Brown, G.R.; Lalanne, C.; Madur, D.; Pot, D.; Neale, D.B.; Plomion, C. Comparative Genome and QTL mapping between maritime and loblolly pines. Mol. Breeding 2003, 12, 185–195. [Google Scholar]
- Krutovsky, K.V.; Troggio, M.; Brown, G.R.; Jermstad, K.D.; Neale, D.B. Comparative mapping in the Pinaceae. Genetics 2004, 168, 447–461. [Google Scholar]
- Shiraishi, S.; Watanabe, A. Identification of chloroplast genome between Pinus densiflora Sieb. et Zucc. and P. thunbergii Parl. based on the polymorphism in rbcL gene. J. Jpn. For. Soc. 1995, 77, 429–236. [Google Scholar]
- Murray, M.G.; Thomson, W.F. Rapid isolation of high molecular weight plant DNA. Nucleic Acid Res. 1980, 8, 4321–4325. [Google Scholar]
- Mitsugi, Y.; Shiraishi, S. Identification of nematode resistant clones of Japanese black pine (Pinus thunbergii Parl.) using a multiplex SNP (Single Nucleotide Polymorphism) analysis. J. Jpn. For. Soc. 2008, 90, 111–115. [Google Scholar]
- Don, R.H.; Cox, P.T.; Wainwright, B.J.; Baker, K.; Mattick, J.S. Touchdown PCR to circumvent spurious priming during gene amplification. Nucleic Acids Res. 1991, 19, 4008. [Google Scholar]
- Nei, M. Molecular Evolutionary Genetics; Columbia University Press: New York, NY, USA, 1987; p. 512. [Google Scholar]
- Tajima, F. Statistical method for testing the neutral mutation hypothesis by DNA polymorphism. Genetics 1989, 123, 585–595. [Google Scholar]
- Fu, Y.X.; Li, W.H. Statistical Tests of Neutrality of Mutations. Genetics 1993, 133, 693–709. [Google Scholar]
- Librado, P.; Rozas, J. DnaSP v5: A software for comprehensive analysis of DNA polymorphism data. Bioinformatics 2009, 25, 1451–1452. [Google Scholar]
- Stephens, M.; Smith, N.J.; Donnelly, P. A new statistical method for haplotype reconstruction from population data. Am. J. Hum. Genet. 2001, 68, 978–989. [Google Scholar]
- Stephens, M.; Donnelly, P. A comparison of Bayesian methods for haplotype reconstruction. Am. J. Hum. Genet. 2003, 73, 1162–1169. [Google Scholar]
- Salmaso, M.; Faes, G.; Segala, C.; Stefanini, M.; Salakhutdinov, I.; Zyprian, E.; Toepfer, R.; Grando, M.S.; Velasco, R. Genome diversity and gene haplotypes in the grapevine (Vitis vinifera L) as revealed by single nucleotide polymorphisms. Mol. Breeding 2004, 14, 385–395. [Google Scholar]
- Kawuki, R.S.; Ferguson, M.; Labuschagne, M.; Herselman, L.; Kim, D.J. Identification, characterization and application of single nucleotide polymorphisms for diversity assessment in cassava (Manihot esculenta Crantz). Mol. Breeding 2009, 23, 669–684. [Google Scholar]
- Botstein, D.; White, R.L.; Skolnick, M.; Davis, R.W. Construction of a genetic linkage map in man using restriction fragment length polymorphism. Am. J. Hum. Genet. 1980, 32, 314–331. [Google Scholar]
- Kalinowski, S.T.; Taper, M.L.; Marshall, T.C. Revising how the computer program CERVUS accommodates genotyping error increases success in paternity assignment. Mol. Ecol. 2007, 16, 1099–1006. [Google Scholar]
- Felsenstein, J. Evolutionary trees from DNA sequences: A maximum likelihood approach. J. Mol. Evol. 1981, 17, 368–376. [Google Scholar]
- Guindon, S.; Gascuel, O. A simple, fast, and accurate algorithm to estimate large phylogenies by maximum likelihood. Syst. Biol. 2003, 52, 696–704. [Google Scholar]
- Clarke, A.G.; Weiss, K.M.; Nickerson, D.A.; Taylor, S.L.; Buchanan, A.; Stengard, J.; Salomaa, V.; Vartiainen, E.; Perola, M.; Boerwinkle, E.; Sing, C.F. Haplotype structure and population genetic inferences from nucleotide-sequence variation in human lipoprotein lipase. Am. J. Hum. Genet. 1998, 63, 595–612. [Google Scholar]
- Krutovsky, K.V.; Neale, D.B. Nucleotide diversity and linkage disequilibrium in cold hardiness and wood quality related genes in Douglas-fir. Genetics 2005, 171, 2029–2041. [Google Scholar]
- González-Martínez, S.C.; Ersoz, E.; Brown, G.R.; Wheeler, N.C.; Neale, D.B. DNA sequence variation and selection of tag single nucleotide polymorphisms at candidate genes for drought—stress response in Pinus taeda L. Genetics 2006, 172, 1915–1926. [Google Scholar]
- Ingvarsson, P.K. Nucleotide polymorphism and linkage disequilibrium within among natural populations of European aspen (Populus tremula L., Salicaceae). Genetics 2005, 169, 945–953. [Google Scholar]
- Chu, Y.; Su, X.; Huang, Q.; Zhang, X. Pattern of DNA sequence variation at candidate gene loci in black poplar (Populus nigra L.) as revealed by single nucleotide polymorphisms. Genetica 2009, 137, 141–150. [Google Scholar]
- Schmid, K.J.; Ramos-Onsins, S.; Ringys-Beckstein, H.; Weisshaar, B.; Mitchell-Olds, T. A multilocus sequence survey in Arabidopsis thaliana reveals a genome-wide departure from a neutral model of DNA sequence polymorphism. Genetics 2005, 169, 1601–1615. [Google Scholar]
- Moriyama, E.N.; Powell, J.R. Intraspecific nuclear DNA variation in Drosophila. Mol. Biol. Evol. 1996, 13, 261–277. [Google Scholar]
- Zwick, M.E.; Cutler, D.J.; Chakravarti, A. Patterns of genetic variation in Mendelian and complex traits. Annu. Rev. Genomics. Hum. Genet. 2000, 1, 387–407. [Google Scholar]
- Kado, T.; Yoshimaru, H.; Tsumura, Y.; Tachida, H. Nucleotide variation in a Conifer, Cryptomeria japonica (Cupressaceae sensu lato). Genetics 2003, 164, 1547–1559. [Google Scholar]
- Pot, D.; McMillan, L.; Echt, C.; Le Provost, G.; Garnier-Gere, P.; Cato, S.; Plomion, C. Nucleotide variation in genes involved in wood formation in two pine species. New Phytol. 2005, 167, 101–112. [Google Scholar]
- Kado, Y.; Matsumoto, A.; Ujino-Ihara, T.; Tsumura, Y. Amounts and patterns of nucleotide variation within and between two Japanese conifers, sugi (Cryptomeria japonica) and hinoki (Chamaecyparis obtusa) (Cupressaceae sensu lato). Tree Genet. Genomes. 2008, 4, 133–141. [Google Scholar]
- Gaut, B.S.; Morton, B.R.; McCaig, B.C.; Clegg, M.T. Substitution rate comparisons between grasses and palms: synonymous rate differences at the nuclear gene Adh parallel rate differences at the plastid gene rbcL. Proc. Natl. Acad. Sci. USA 1996, 93, 10274–10279. [Google Scholar]
- Willyard, A.; Syring, J.; Gernandt, D.; Liston, A.; Cronn, R. Fossil calibration of molecular divergence infers a moderate mutation rate and recent radiations for Pinus. Mol. Biol. Evol. 2007, 24, 90–101. [Google Scholar]
- Kusumi, J.; Tsumura, Y.; Yoshimaru, H.; Tachida, H. Molecular evolution of nuclear genes in Cupressaceae, a group of conifer trees. Mol. Biol. Evol. 2002, 19, 736–747. [Google Scholar]
- Fay, J.C.; Wu, C.I. Hitchhiking under positive Darwinian selection. Genetics 2000, 155, 1405–1413. [Google Scholar]
- Duan, Y.H.; Guo, J.; Ding, K.; Wang, S.J.; Zhang, H.; Dai, X.W.; Chen, Y.Y.; Govers, F.; Huang, L.L.; Kang, Z.S. Characterization of a wheat HSP70 gene and its expression in response to stripe rust infection and abiotic stresses. Mol. Biol. Rep. 2010, 38, 301–307. [Google Scholar]
- Culley, D.E.; Horovitz, D.; Hadwiger, L.A. Molecular characterization of disease-resistance response gene DRR206-d from Pisum sativum. Plant Physiol. 1995, 107, 301–302. [Google Scholar]
- Kuroki, Y. Karyotype studies on important conifers. Bull. Miyazaki Univ. Forests 1969, 5, 1–103. [Google Scholar]
© 2011 by the authors; licensee MDPI, Basel, Switzerland. This article is an open access article distributed under the terms and conditions of the Creative Commons Attribution license (http://creativecommons.org/licenses/by/3.0/).
Share and Cite
Suharyanto; Shiraishi, S. Nucleotide Diversities and Genetic Relationship in the Three Japanese Pine Species; Pinus thunbergii, Pinus densiflora, and Pinus luchuensis. Diversity 2011, 3, 121-135. https://doi.org/10.3390/d3010121
Suharyanto, Shiraishi S. Nucleotide Diversities and Genetic Relationship in the Three Japanese Pine Species; Pinus thunbergii, Pinus densiflora, and Pinus luchuensis. Diversity. 2011; 3(1):121-135. https://doi.org/10.3390/d3010121
Chicago/Turabian StyleSuharyanto, and Susumu Shiraishi. 2011. "Nucleotide Diversities and Genetic Relationship in the Three Japanese Pine Species; Pinus thunbergii, Pinus densiflora, and Pinus luchuensis" Diversity 3, no. 1: 121-135. https://doi.org/10.3390/d3010121