Spatial Identification of Statewide Areas for Conservation Focus in New Mexico: Implications for State Conservation Efforts

Abstract
: Landscape scale conservation planning efforts have been in place for the past several decades to maintain biodiversity. Objectives of past efforts have been to identify areas to create reserves based on species diversity, land ownership, and landscape context. Risk analysis has not often been included in these spatial analyses. Datasets such as the Southwest Regional Gap Analysis (SWReGAP) are now available as are processes that allow risk analysis to be viewed in a spatial context in relations to factors that affect habitats over broad scales. We describe a method to include four spatial datasets to provide coarse scale delineation on areas to focus conservation including species numbers, key habitats, land management and factors that influence habitats. We used the SWReGAP management status dataset to identify management categories for long-term intent of management for biodiversity. The New Mexico Department of Game and Fish identified a set of 290 Species of Greatest Conservation Need (SGCN). Species occurrences for these species were associated with hydrologic unit codes from the National Hydrography Dataset (NHD). Key habitats were identified by using the SWReGAP land cover dataset and NHD derivatives. Factors that influence habitats were identified and scored for 89 land cover types and 23 aquatic habitats identified by the NMDGF. Our final model prioritizes landscapes that are within key habitats, have high numbers of terrestrial and aquatic Species of Greatest Conservation Need taxa, may be potentially altered by multiple effects that influence habitats, and lack long-term legally-binding management plans protecting them from anthropogenic degradation. Similar to other efforts, riparian and aquatic habitats were identified as the most important for conservation. This information may be displayed spatially, allowing land managers and decision makers to understand the ecological context where multiple effects of potential factors may influence some habitats greater than others, and repeat process with CWCS revisions.1. Introduction
Resource agencies' statutory mandate to manage, protect, and conserve wildlife and wildlife resources, creates a need to assess factors that influence these species and habitats. This process requires basic biological knowledge of species' life histories, habitat requirements, and population demographics. Understanding the interaction and ecological role that a species, population, or assemblage may play in any given ecosystem relative to resource management (past, current, and future) is also required. Assessments of such factors are generally broadly-based and intuitively-derived perceptions of outcomes [1]. These perceptions may be documented by direct experience or by drawing from past examples at various spatial scales [2].
Landscape scale conservation of biodiversity has been a focus of state and federal agencies and organizations. Recently each US state completed a Comprehensive Wildlife Conservation Strategy/State Wildlife Action Plan (CWCS/SWAP), for their key habitats and Species of Greatest Conservation Need (SGCN) [3]. Likewise, regional gap analysis projects [4], and The Nature Conservancy's Ecoregional Assessments [5] have applied conservation planning efforts to groups of states. Objectives of these efforts were to identify areas for conservation action at local and landscape scales to conserve biodiversity and assist in ecosystem management. These efforts have been legislatively based (e.g., CWCS) or programmatically based (e.g., gap analysis).
Federal legislation mandated that each state's CWCS process adhere to eight elements for successful strategy completion [3,6]. This included five elements associated with species and habitats including (1) identification of the distribution and abundance of wildlife; (2) identification of the location and relative condition of key habitats; (3) identification of the problems that may affect these species; (4) identification of conservation actions; and (5) proposed plans for monitoring these species and their habitats and monitoring the effectiveness of the conservation actions proposed. Three additional elements focused on reviewing and revising the strategy; coordinating with federal, state, and local agencies and Native American tribes that manage significant land and water areas within the state; and incorporating public participation.
The Gap Analysis Program (GAP) of the United States Geological Survey (USGS) is a program that estimates gaps in management status of elements of biodiversity [7]. GAP evaluates biodiversity elements (i.e., land cover and terrestrial vertebrate species) and provides products that are intended to provide managers with information to “keep common species common” [4]. The GAP process identifies species that are underrepresented in lands managed for biodiversity maintenance [4,7]. However, GAP does not include factors influencing species and habitats (landscape stressors).
Classification of management intent has often been used to analyze conservation potential (e.g., TNC Ecoregional analyses and state and regional gap analyses). Because of the difficulty in assessing actual management on the ground over broad landscapes, efforts (e.g., GAP) have used documented long-term intent of these parcels [8,9]. GAP uses a scale of 1 to 4 to categorize the degree of maintenance of biodiversity [8,9]. Examples of these categories include research natural areas (Status 1), wilderness areas (Status 2), multiple use lands (Status 3), and unknown or undocumented management (Status 4) [8,9]. A status category of “1” identifies the highest, most permanent level of maintenance, with a “4” representing the least legally restricted level of biodiversity management or unknown status where information was not available to assign a different rating [7-9].
Individual causal factors that influence habitats or SGCN particularly at broad landscape scales are difficult to separate. Multiple factors are linked in cause and effect relationships across spatial and temporal scales. Adverse effects from multiple ecosystem stressors can have cumulative or compensatory effects that are more significant than the additive effects alone, with one or more stressors predisposing biotic organisms to additional stressors [10]. For example, reduced fire frequency from a century of fire suppression is partially responsible for conditions that have allowed major outbreaks of several phytophagous insects [11]. Further, unusually dry periods and/or climate changes reduce available soil moisture causing water associated stress, reduced xylem pressure, and pitch production in trees. These conditions allow insects to bore into and kill trees. Stands with high tree mortality accumulate dead standing and downed woody fuels. In turn, these conditions greatly increase the risk of stand-replacing wildfire and subsequent insect attack on trees injured or weakened by the fire [12].
New Mexico's landscapes have changed dramatically over the past century [3]. Natural flows of aquatic systems have been altered by development and dams [3]. Terrestrial ecosystems have been altered by development and other human activities [3]. All of these changes influence New Mexico's habitat and the wildlife that use that habitat.
The objectives of this research were to identify areas of conservation focus in New Mexico for use within the context of the CWCS for New Mexico. Areas of conservation focus should include areas with high numbers of species of greatest conservation concern, occur within identified key habitats, be managed in a manner that allows conservation actions to be easily put into practice, and include areas that have the greatest threat from factors that modify habitats. Using these datasets, we identified a method that could spatially depict areas for conservation focus to assist land managers in making informed decisions, and facilitate CWCS/SWAP revisions.
2. Methods
2.1. Management Category
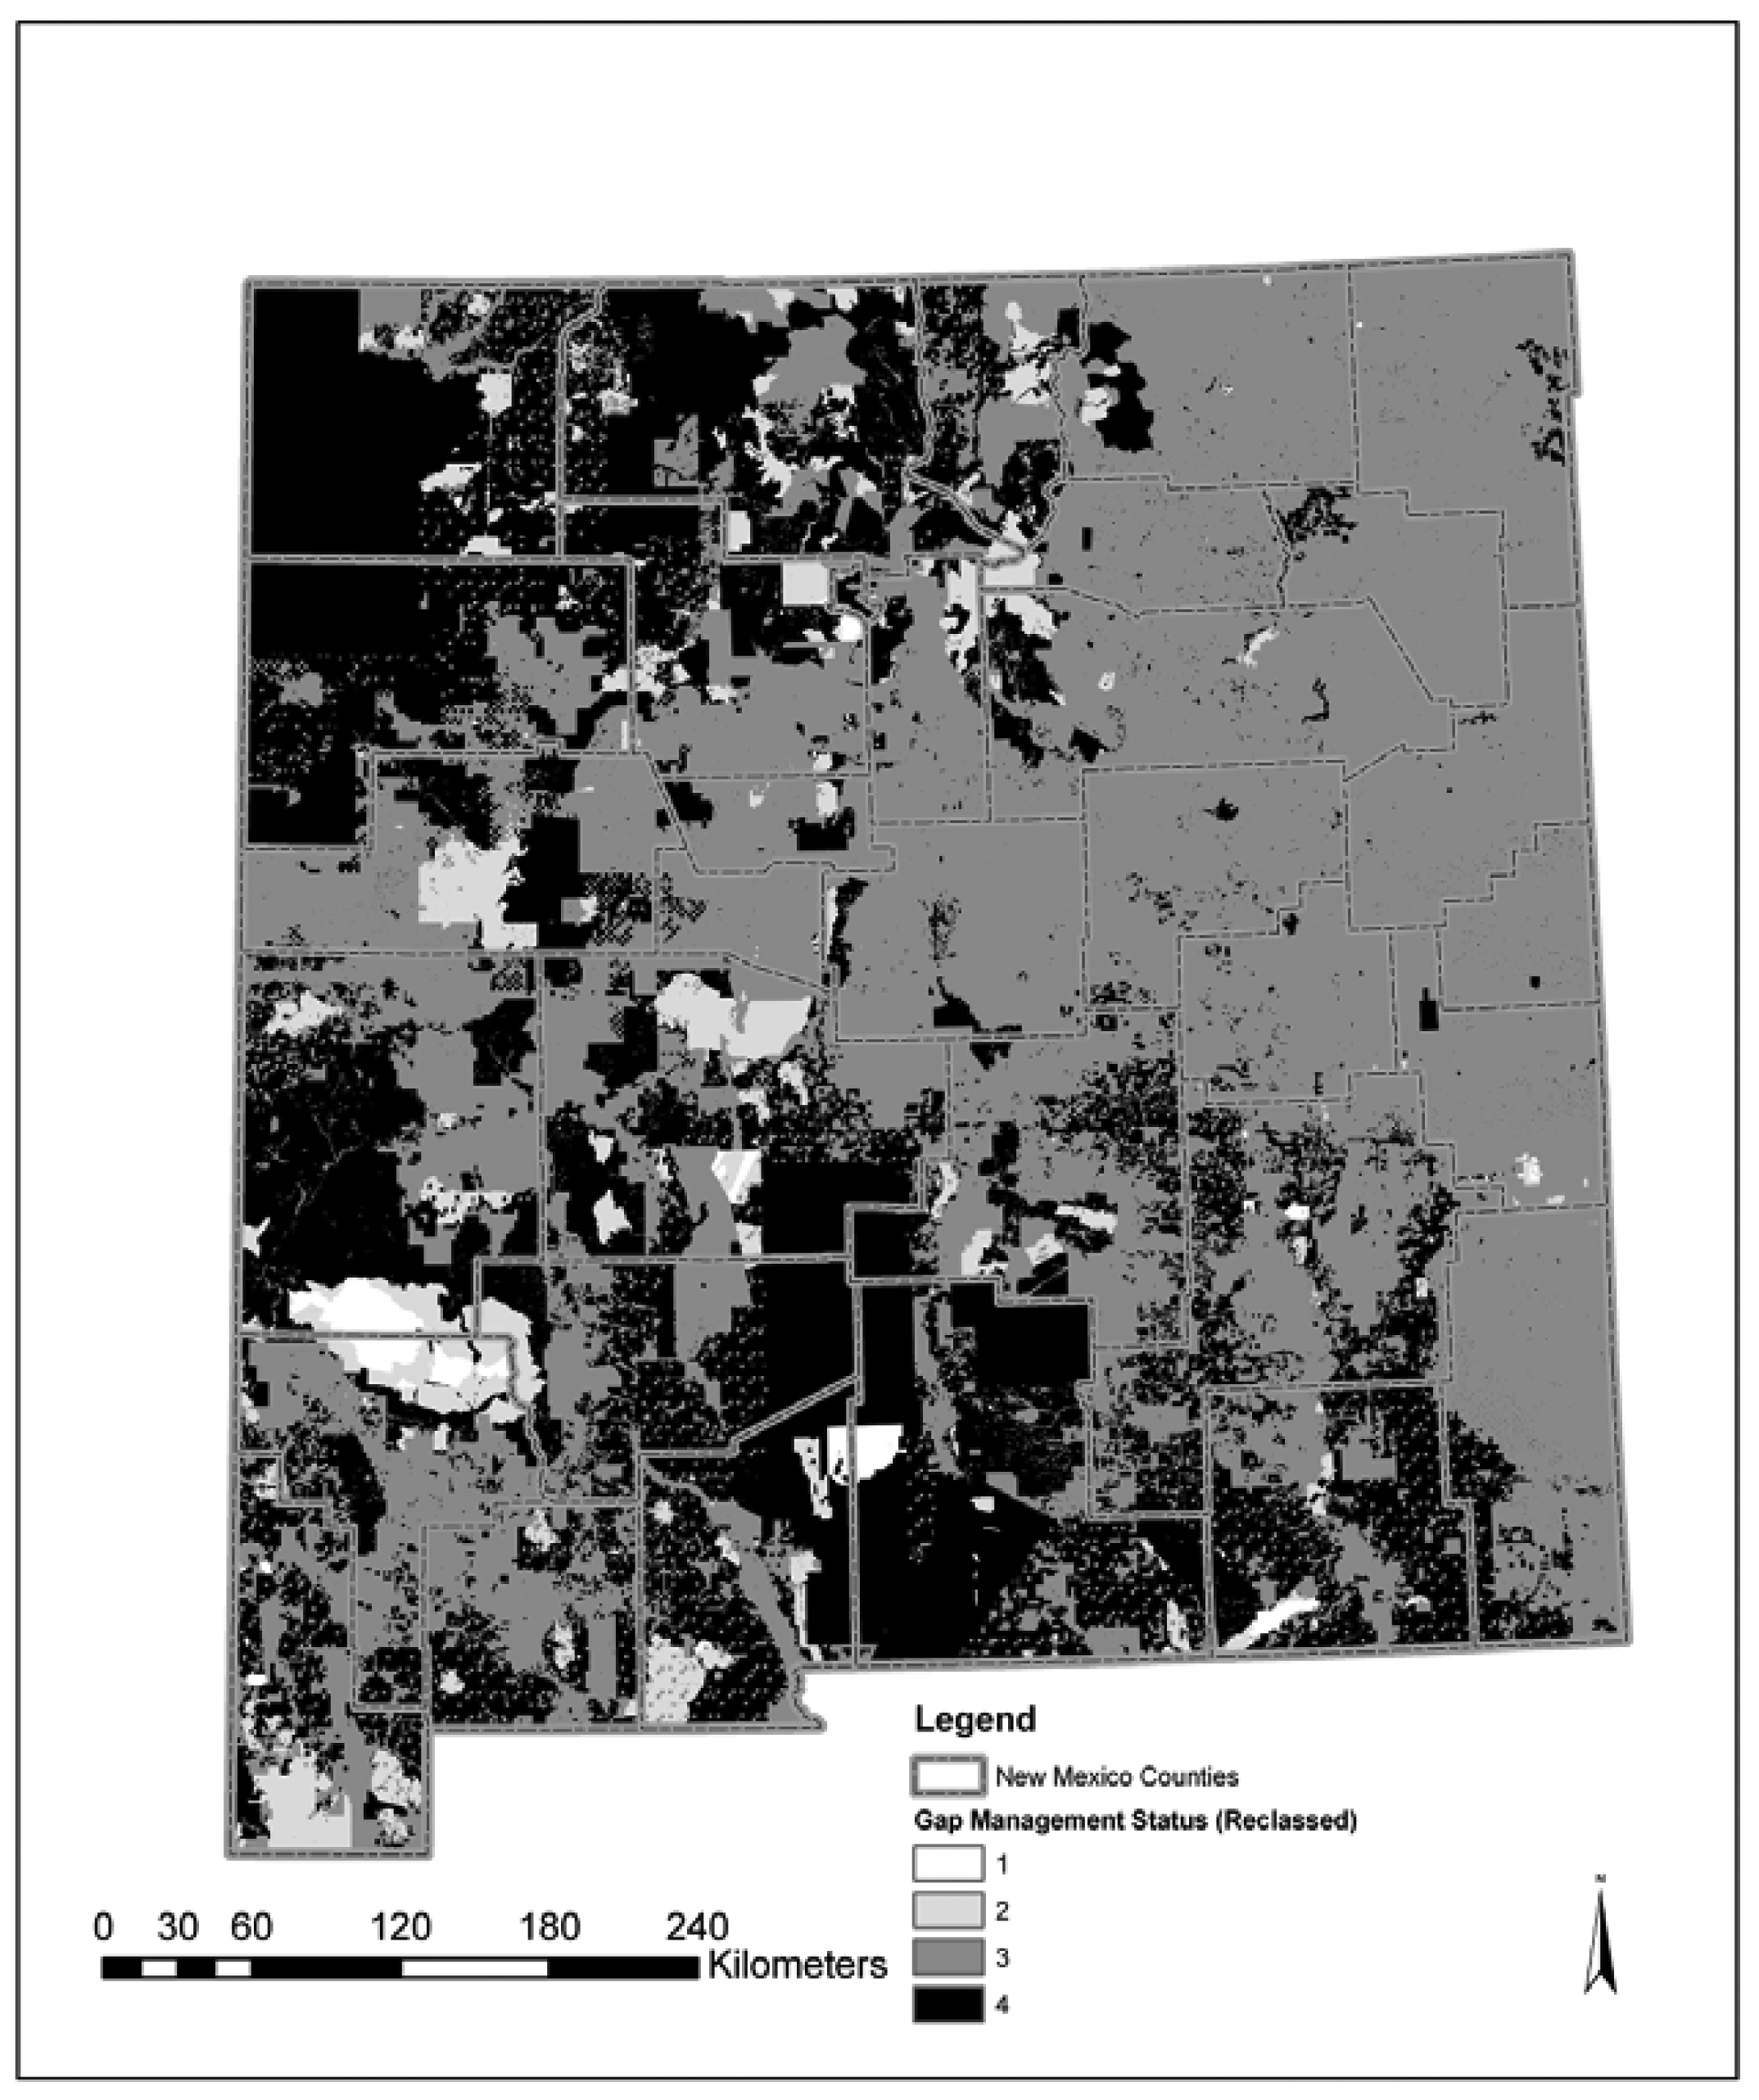
We used the SWReGAP management status dataset to identify the long-term intent of management for biodiversity. The original GAP status categories were reclassified to management categories (Table 1) to reflect the ability of New Mexico Department of Game and Fish (NMDGF) to work over large areas and collaborate with land managers. GAP Status 3 lands were identified as the highest priority because multiple use lands typically have long-term legally binding management plans and are areas that have high opportunity for broad scale collaboration between federal, state, and local land managers. As such, Status 3 (Category 4) lands were provided a numeric weight of 4.0 (Table 1). Status 4 (Category 3) lands were provided a weight of 3.0 because although private land owners are often willing conservation partners in New Mexico, often many land owners are necessary for broad scale implementation. Status 1 (Category 1) and 2 (Category 2) lands are already conserved and have management plans in place for protection of biodiversity. These management plans can restrict active management (e.g., prescribed fires) in some cases and were given numeric weights of 1.0 and 2.0 respectively.
2.2. Key Habitats
Identification and condition of key habitats that were necessary for conservation of New Mexico's biodiversity were needed to focus conservation actions. We considered key habitats as habitats that were important to threatened or scarce species; hosted endemics or obligate species; was a functional habitat that yielded a large ecological value; supported species that are wide-ranging but not found in other habitats; was limited in extent, or significantly reduced, or threatened by land management practices [3].
Ten key aquatic habitats and nine key terrestrial habitats were identified for New Mexico (Table 2). Spatial representations of key aquatic habitats were identified from the National Hydrography Dataset (NHD) ( http://nhd.usgs.gov) dataset. These habitats included points (springs), polygons (lakes and reservoirs), and polylines (streams). Streams were classified by stream order using the Strahler Stream Order system [13]. Spatial representations of key terrestrial habitats were identified from the SWReGAP land cover dataset [14], which mapped a total of 89 land cover types in New Mexico. Key aquatic habitats ranged from Perennial Large Reservoirs to Ephemeral Marsh/Cienegas and key terrestrial habitats included riparian, forest and woodland, shrubland, and grassland communities. Terrestrial and aquatic habitat datasets were combined in ArcGIS 9.0 with key habitats attributed. We then reclassed this dataset to provide key habitats a weight 4.0 and all other habitats in the state a weight of 1.0 (Table 1).
2.3. Species of Greatest Conservation Need
NMDGF identified a set of 346 mammals, birds, fish, reptiles, amphibians, molluscs, and crustaceans considered to be indicative of the diversity and health of New Mexico's wildlife [3]. These included state and federally listed species, candidate species of concern, game species with high recreational value, species with documented population declines, and other species of high conservation interest because of endemism or vulnerability [3]. The indicative wildlife species were then linked with New Mexico's key habitats to identify SGCN. This resulted in 290 vertebrate, mollusc, and crustacean species identified as SGCN within key habitats. There were an additional eight indicative species of conservation concern that were not associated with key habitats [3], but included as SGCN. An additional 154 arthropods were designated as SGCN, but not used in this analysis because these species lacked sufficient spatial data.
For analysis, species occurrences were associated with 8-digit hydrologic unit codes (HUCs) from the NHD. HUCs are a nested hierarchical system for classifying and naming hydrologic units based on size and location. As such 4-digit HUCs are larger than 8-digit HUCs. We used species ranges obtained by the Southwest Regional Gap Analysis Project (SWReGAP) [15] for terrestrial vertebrate SGCN species at the 8-digit HUC level. Fish species and invertebrates were identified to 8-digit HUC based on NMDGF occurrence data and known distribution of the species. Thus, each 8-digit HUC identified the number of SGCN likely to occur within the HUC polygon. The total number was then normalized to other datasets by reclassifying values to 1.0–4.0 based on equal intervals of the data (Table 1). We then aggregated the data to the 4-digit subregion HUC level because of the ambiguity in invertebrate species locations.
2.4. Factors Influencing Species and Habitats
Identification of factors that influence species or habitats was focused at the aggregated land cover and aquatic habitat scale, as these factors directly influence wildlife communities and SGCN populations. Thus factors identified as affecting a particular land cover habitat were associated with that habitat wherever it was mapped within the land cover dataset. The assessment was based on review of peer-reviewed and technical literature, professional knowledge, reviews by species experts, and information obtained in public forums [3].
Factors that influence habitats were identified for all 89 land cover types mapped by SWReGAP and the 23 aquatic habitats identified by the NMDGF to allow for statewide spatial analyses. We identified 43 possible factors that may negatively influence habitats or species. These factors were grouped into eight categories similar to Salafsky et al. [16] and TNC [17] (Table 3; Table 4). Categories for influential factors included abiotic resource use, consumptive biological use, habitat-conversion, invasive species, modification of natural processes and ecological drivers, non-consumptive biological use, pollution, climate change, and transportation infrastructure.
The spatial scope and severity of each factor by habitat type was given a numeric score between 1–4 using the framework provided by Salafsky et al. [16] and TNC [17] (Table 5). Scope referred to the spatial extent threatened by the factor (e.g., 50% of ecological system). A factor was considered to have a “Very High” (4.0) spatial scope if it was widespread or pervasive and affected the ecological system throughout the systems entire distribution. “High” (3.0) spatial scope was considered for factors that were likely to be widespread and affected the ecological system at many of its locations. Factors that were considered to have a “Medium” (2.0) spatial scope were likely to be localized in its spatial extent and affected the ecological system at some of the locations. Factors that were considered to be localized in spatial extent and affecting only a limited portion of the ecological system were considered to have a “Low” (1.0) spatial scope.
Severity referred to the damage that a factor placed on the ecological system. Factors that influence habitats or species that were likely to destroy or eliminate the ecological system over some portion of the occurrence were considered to have a “Very High” (4.0) severity. Likewise, factors that were likely to seriously degrade the ecological system over some portion of the occurrence were considered to have a “High” (3.0) severity. “Medium” (2.0) severity factors were defined as those disturbances that were likely to moderately degrade the ecological system over some portion of the occurrence, and “Low” (1.0) severity factors were likely to only slightly impair the ecological system over some portion of the occurrence.
We calculated the magnitude (scope + severity) of each factor that may negatively influence habitats (FIH) and species to provide an index of these two inputs, thus, total magnitude scores for each factor ranged from 2.0-8.0. Magnitude scores of all factors were summed within categories to facilitate analyses of factors that affect habitats across the state. Further, we summed magnitude scores of each of the 43 factors within each key habitat in New Mexico to provide a baseline of the possible synergistic effects. We mapped these cumulative magnitude scores for each landscape habitat type (89 land cover types and 23 Aquatic types) in ArcGIS 9.0 to provide a coarse perspective of FIH in New Mexico, and to provide spatial context of geographic areas where the multiple effects of potential factors may influence some habitats more than others.
2.5. Associations between Model Variable
To assist in the interpretation of the key areas for conservation action model, we summarized the percent of key habitats areas that were within the FIH and management categories described in Table 1. We also summarized the percent of each FIH category within each management category.
2.6. Key Areas for Conservation Action
We combined key habitats, SGCN richness, land management, and factors that influence habitats datasets to identify potential key areas for focusing biodiversity conservation efforts. We created a spatial model indicating potential key areas for conservation efforts by combining the four model input variables based on the previously described values (Table 2). These datasets were combined in a simple additive Boolean overlay such where each grid cell was the sum of the values of the four input datasets. The analysis produced a spatial dataset with values ranging from 4 to 16. No differentiation or weightings were given to any one dataset in the process.
3. Results and Discussion
3.1. Management Category
Management category identified areas in southern and western New Mexico as having the greatest potential to work with federal and state land managers (Figure 1). The eastern portion of New Mexico is largely in private ownership. Private landowners may be willing participants in conservation and may have exceptional habitat. However, we chose to emphasize multiple use lands because the objective was a broad landscape scale effort to identify large areas to focus conservation efforts. In theory, it would be easier to implement conservation working with several federal partners as compared to many private landowners. However, this may not always be the case.
Conservation on some key habitats will have to focus with private landowners. The Western Great Plains Shortgrass Prairie key habitat is largely on privately owned lands. State and federal agencies that want to implement conservation actions must work with private land owners within this key habitat to implement any significant broad scale conservation effort.
3.2. Key Habitats
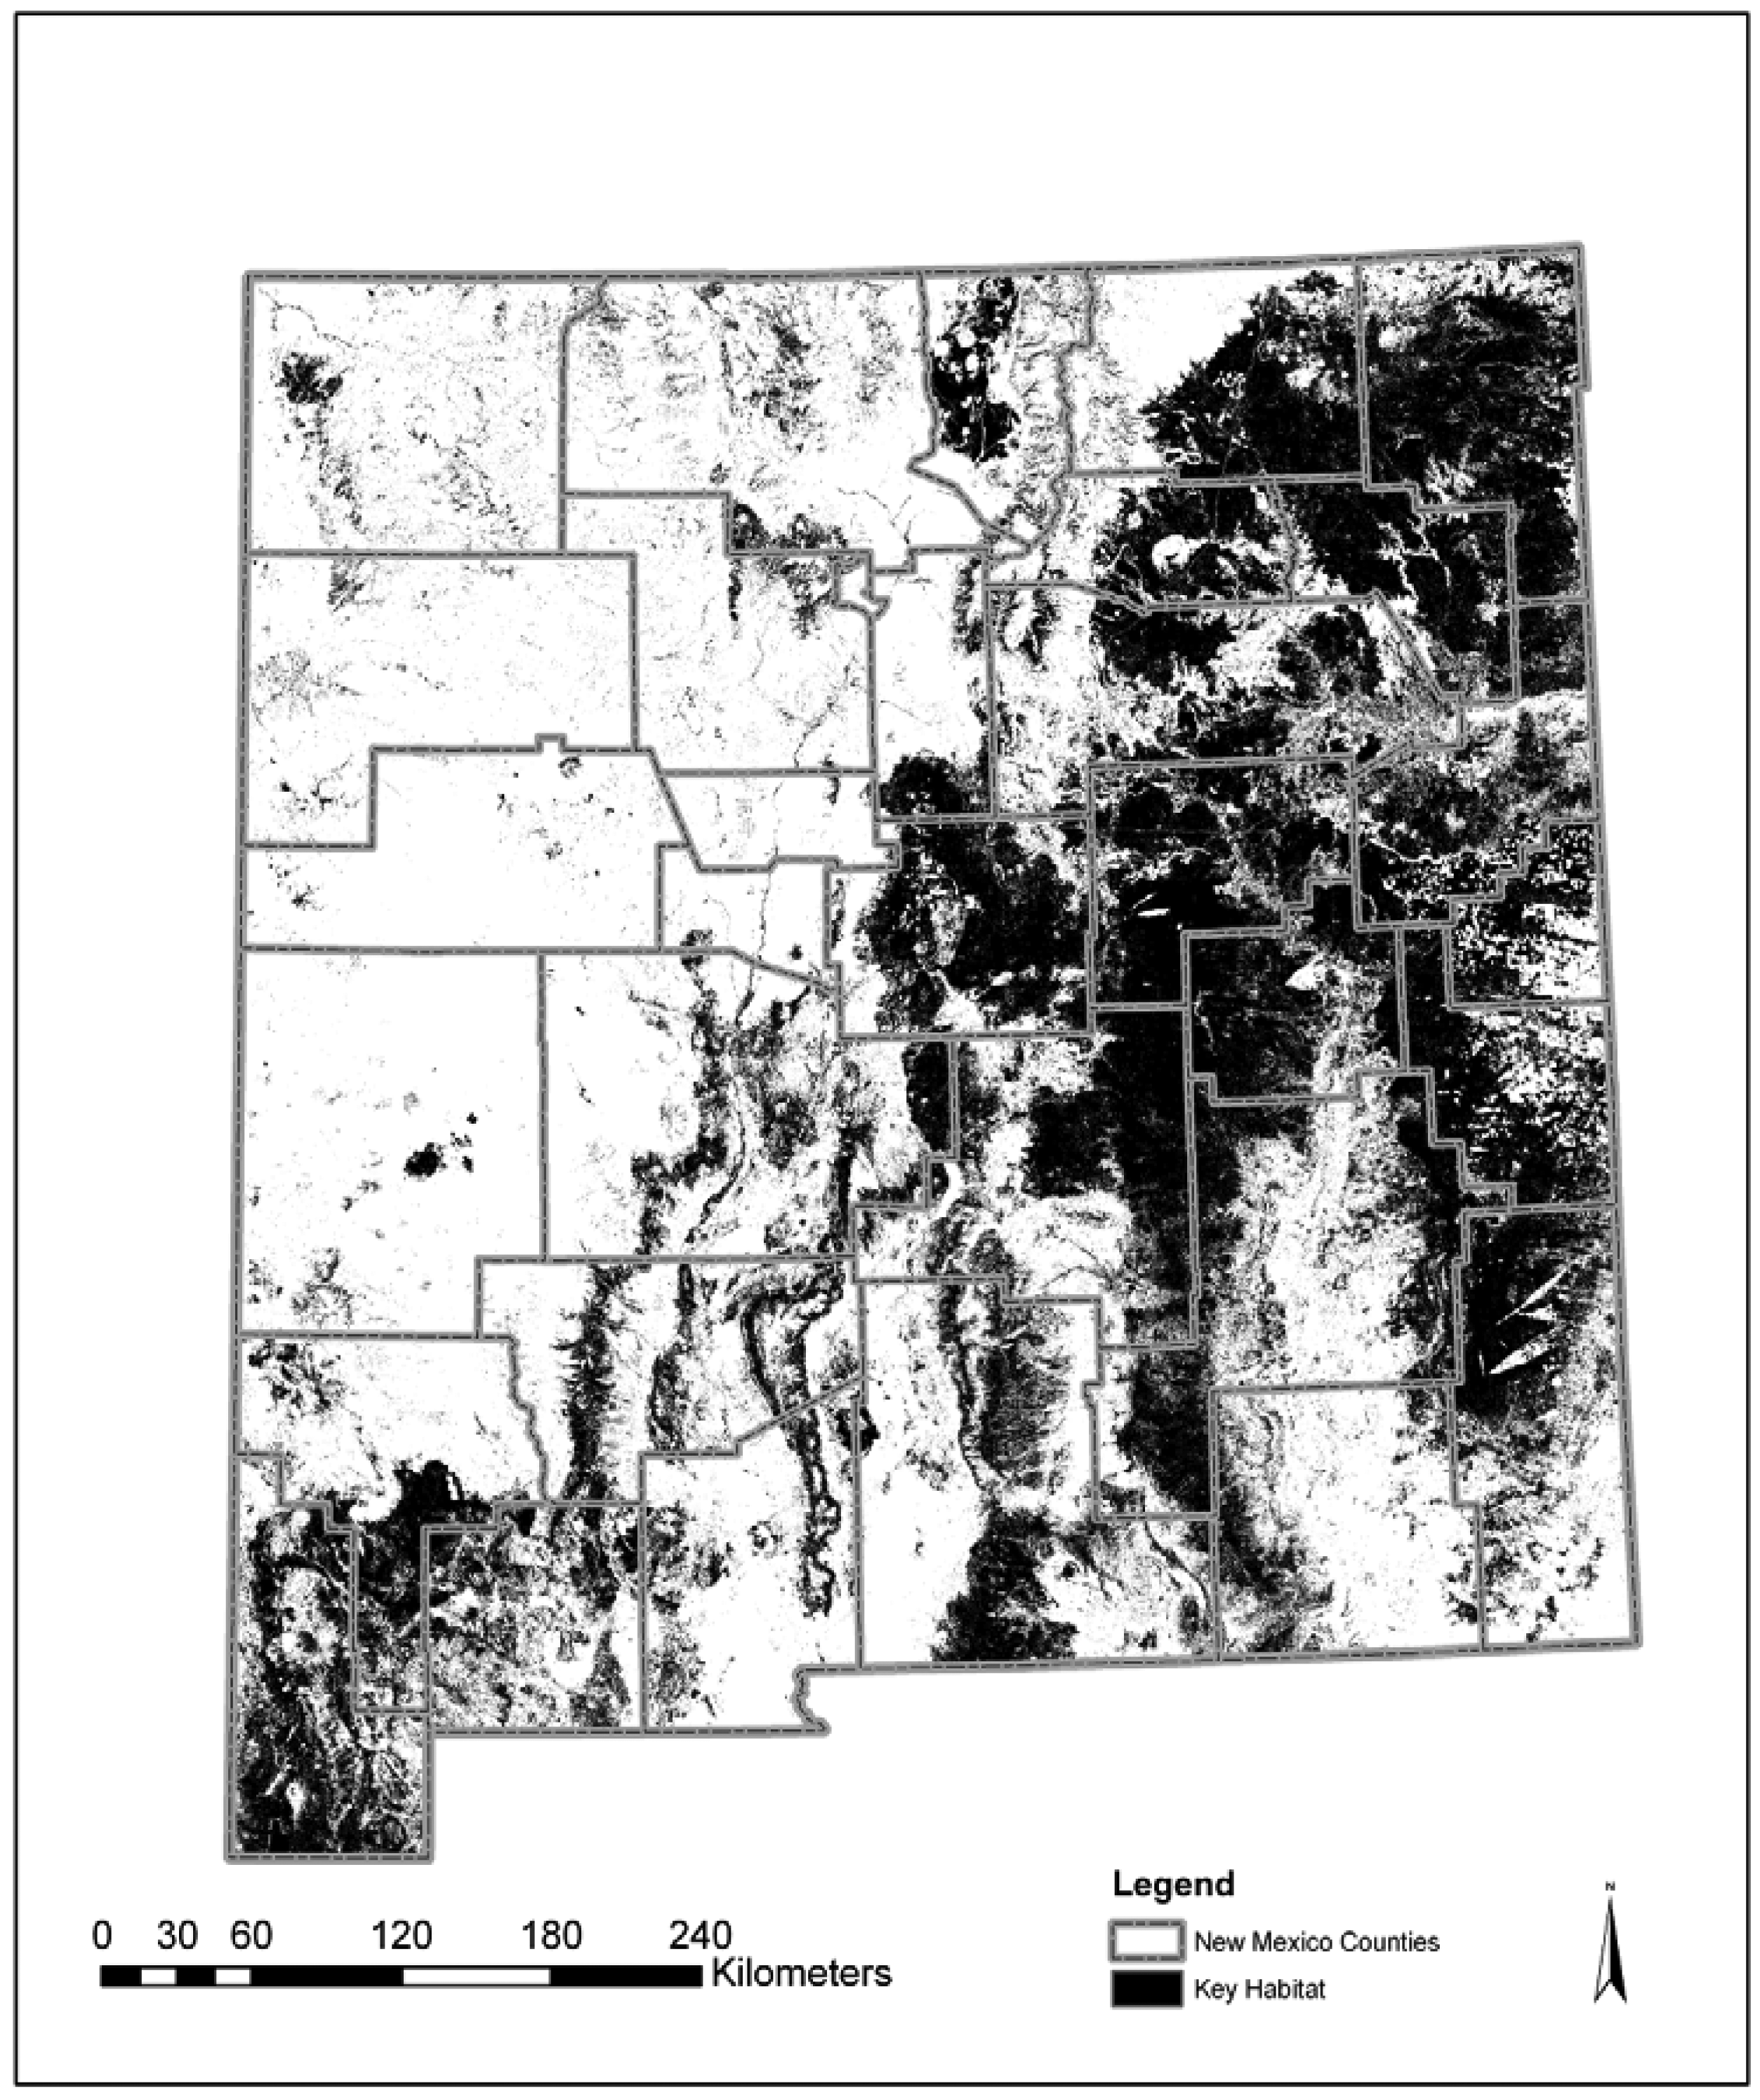
Locations of key habitats within New Mexico vary from small spatially restricted areas (e.g., springs) to large expanses covering much of the eastern part of New Mexico (e.g., Western Great Plains Shortgrass Prairie) (Figure 2). The land cover dataset was based on satellite imagery from 1999–2002 [14], and consideration for changes over time should be taken into account. For example, broad areas of pinyon dominated vegetation community types throughout the state have suffered mortality due to drought and pest infestations. These changes over time may not cause this habitat to be elevated to key habitat, but should be considered in conservation action planning.
Key habitat analysis considered each habitat equally and did not place importance to any one key habitat. Several areas are likely of higher ecological importance including the aquatic and riparian types. New Mexico is a semi-arid state and these aquatic and riparian areas have been identified as important habitats for many species [18-20]. However, many aquatic features (seeps, springs, marsh, cienega, and small waterbodies) and riparian areas typically are under-represented with broad scale mapping endeavors.
3.3. Species of Greatest Conservation Need
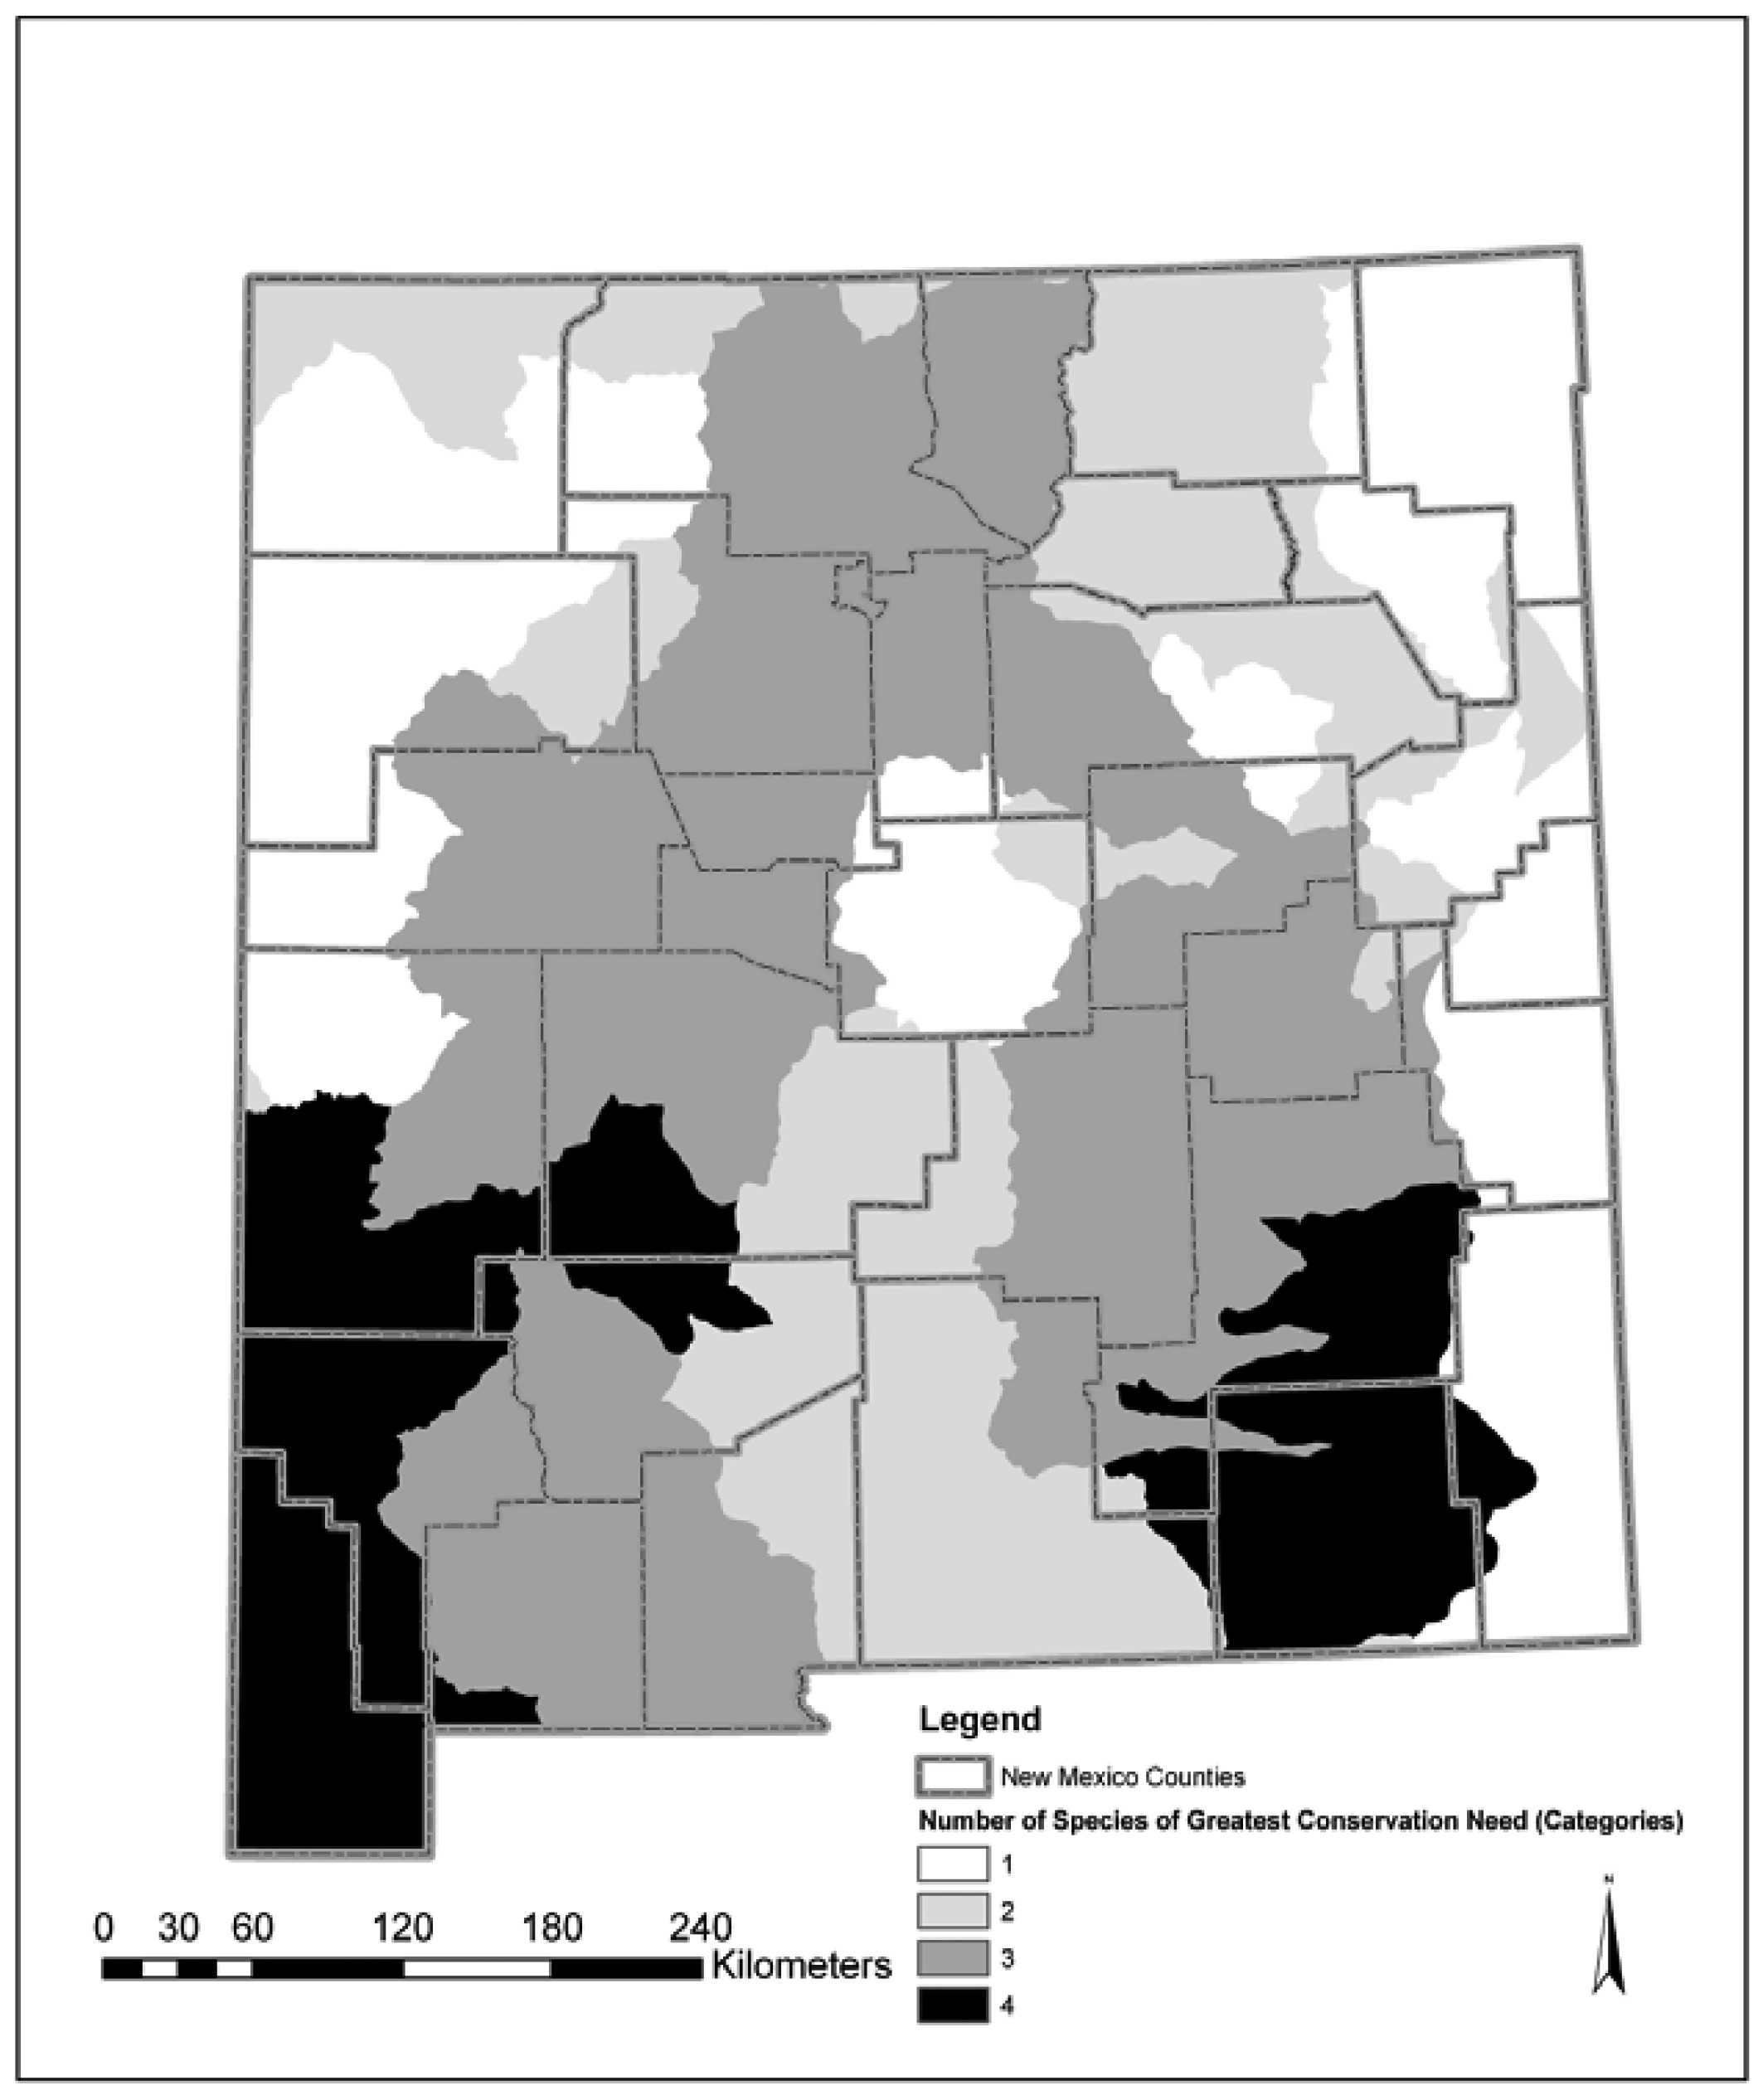
Areas within New Mexico that host the greatest predicted number of terrestrial and aquatic SGCN occur where multiple ecoregions and habitat types converge (Figure 3). For example, the “boot heel” region of southwestern New Mexico has the highest predicted number of terrestrial and aquatic SGCN taxa. This area reflects the variation in elevations and the merging of the northern Rocky Mountains, the Madrean Archipelago, neotropical regions of Mexico, the Chihuahuan Desert, and influences from the Sonoran Desert. Another SGCN rich area in New Mexico is in the southeastern part of the state where habitats from the Pecos River, Guadalupe and Sacramento Mountains, the shortgrass prairie and the Chihuahuan Desert converge. Further, the Rio Grande and Pecos drainages in New Mexico traverse many ecoregions and habitat types, and have a high number of SGCNs.
Limited knowledge and number of species for invertebrates precluded us from modeling habitat effectively for these species. The 4-digit HUC approach aggregates information into a much coarser level than habitat models found with SWReGAP and limits the comparisons that can be drawn. Ideally, more refined habitat models for all species would be used. However these datasets were not available for invertebrate species.
3.4. Factors Influencing Species and Habitats
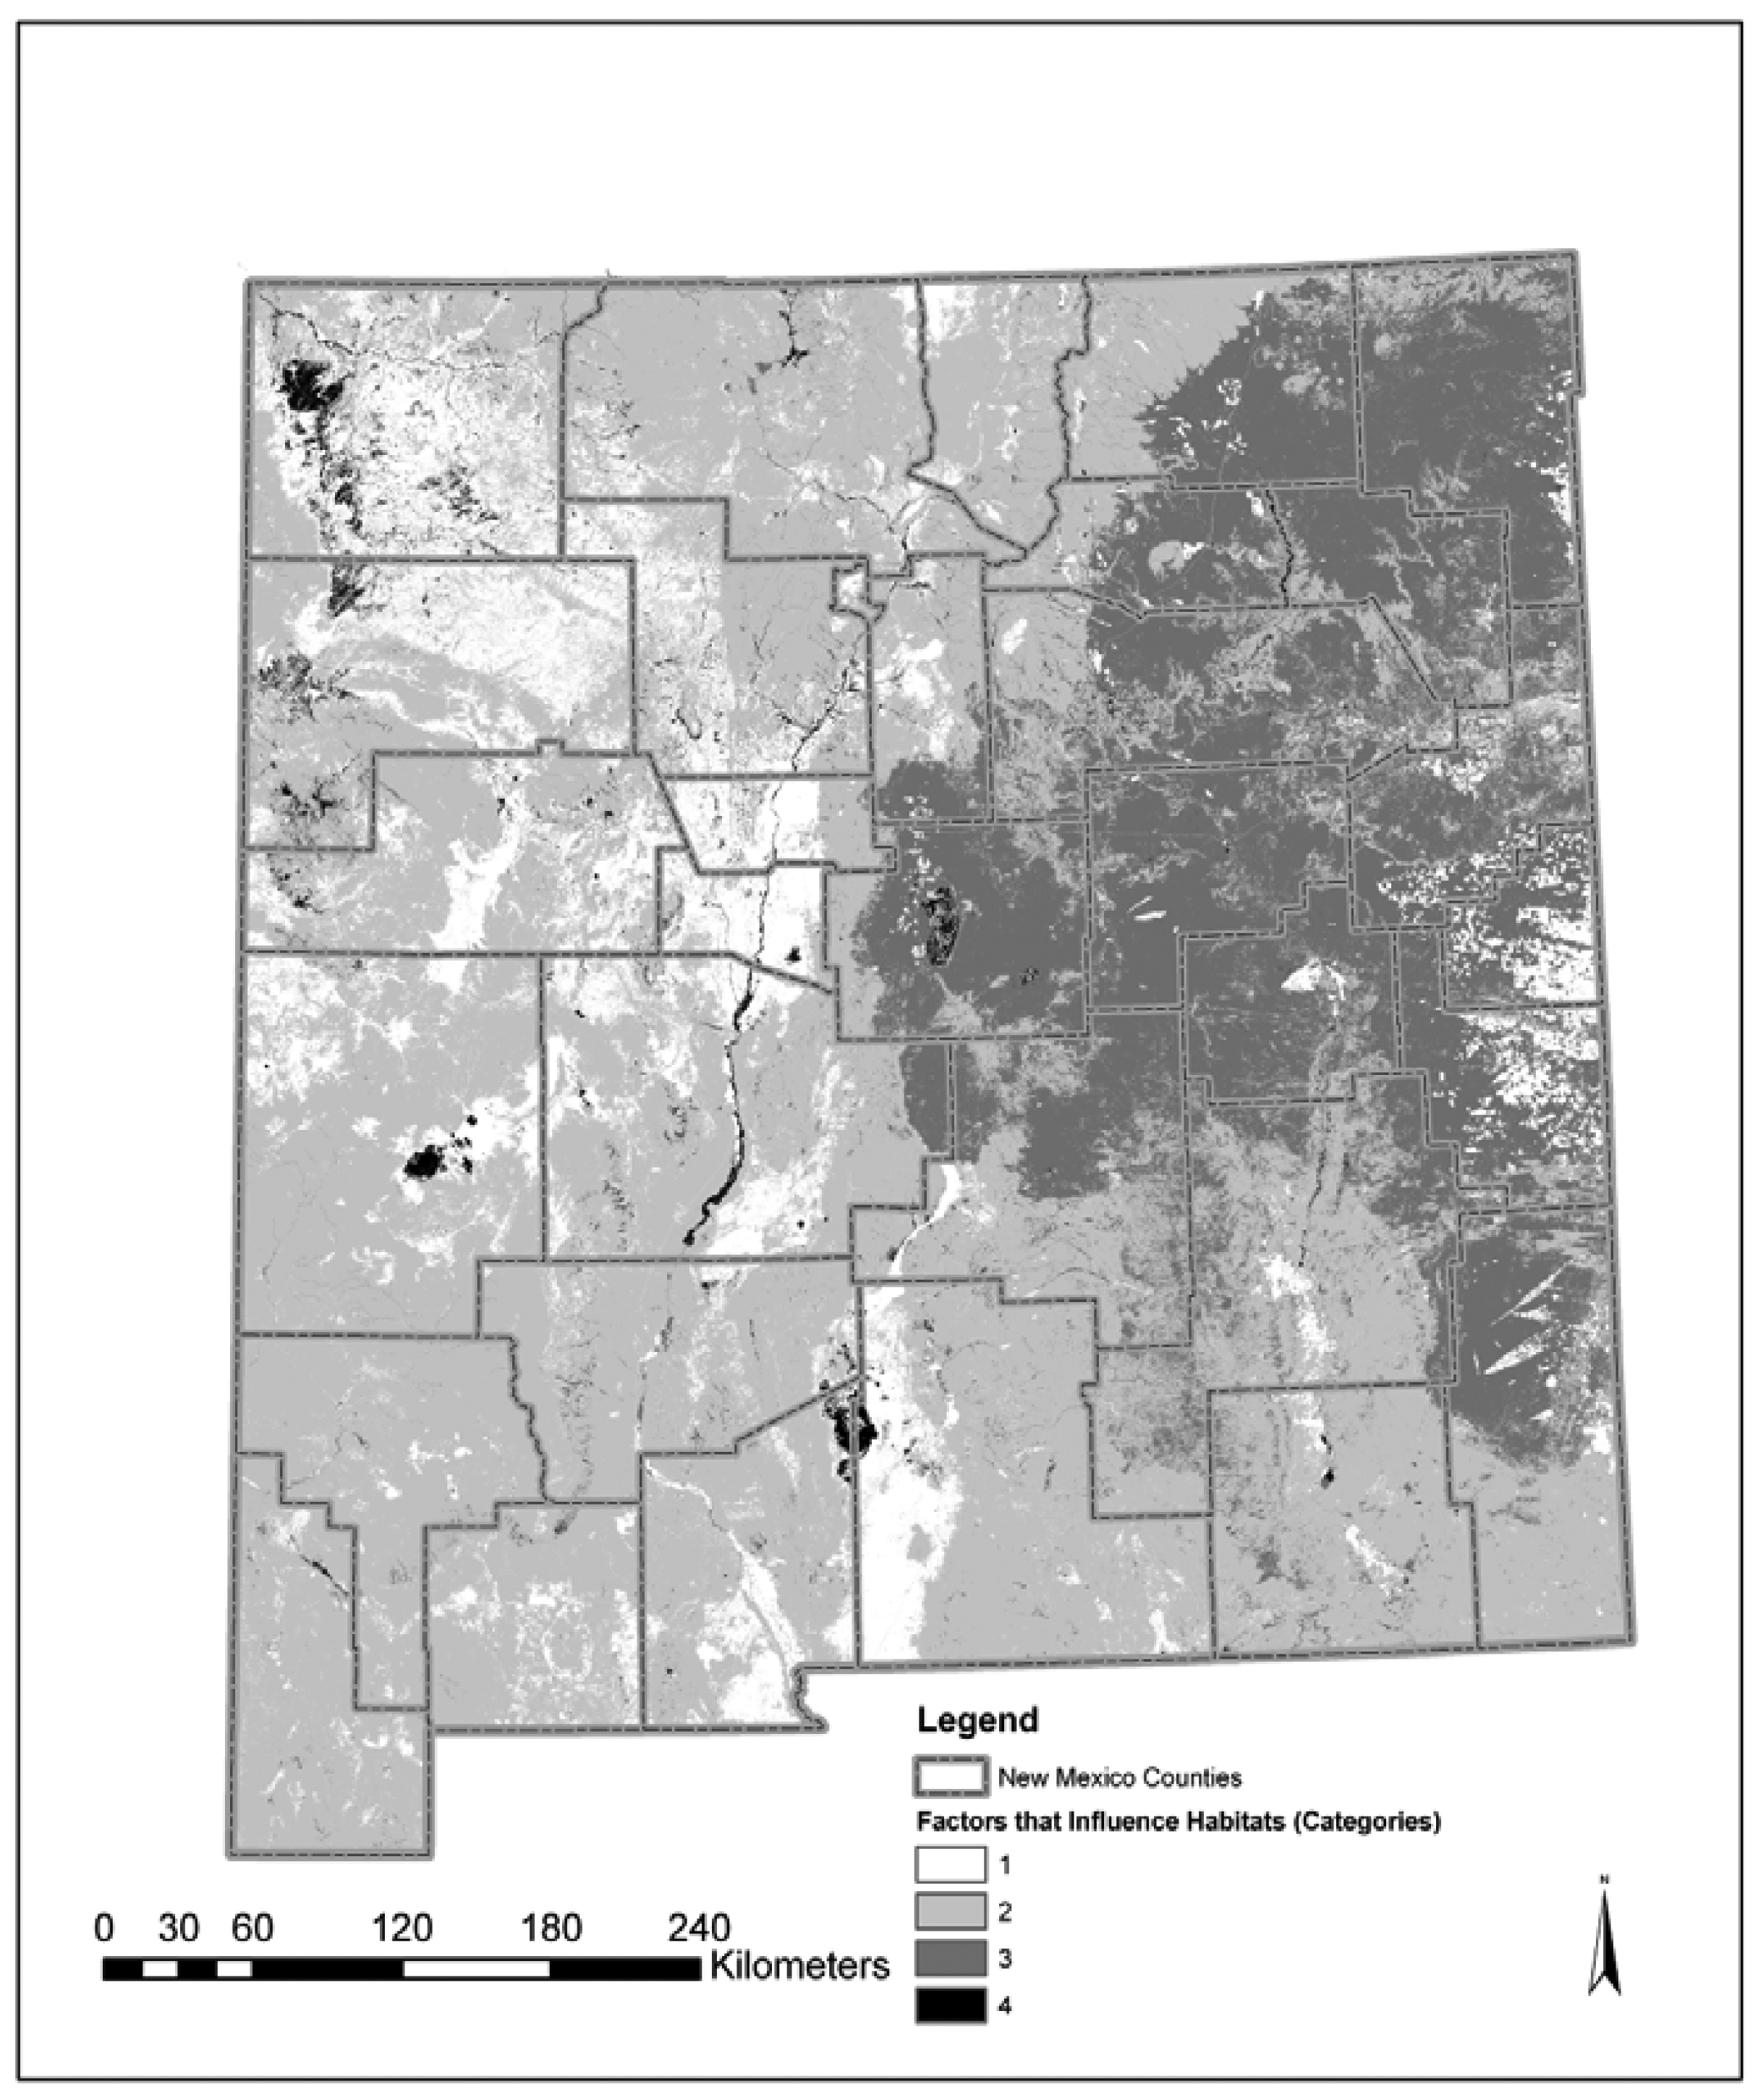
Many of the FIH occur in the same geographic area. Given the synergistic effects of multiple factors, it is difficult to understand the overall impact these factors may have on New Mexico landscapes, habitats, or SGCN. In addition, it is difficult to understand which habitats may have higher risk of being altered by multiple factors. However, we conducted a simple analysis by summing magnitude scores of each of the 43 factors within each key habitat. This approach provides a basis for understanding the possible synergistic effects, and where we might need further clarification on the outcomes of these factors.
The highest possible cumulative magnitude score for any habitat was 344 (43 factors multiplied by a high magnitude score of 8). However, the highest FIH score of any key habitat was 165 (ephemeral natural catchments). Perennial marsh/cienega/spring/seeps and riparian habitats also yielded high cumulative magnitude scores (158 and 156, respectively) (Figure 4). Using cumulative magnitude scores as an indicator of the potential synergistic effects of all factors, these three key habitats may be at a higher risk of alteration by multiple factors than other habitat types in New Mexico. Likewise, aquatic habitats may be more likely to be altered than terrestrial habitats, with the exception of riparian habitats.
Although the spatial representation of aquatic and riparian ecosystems are under-represented (Figure 5), they were identified as having the greatest amount of factors that may influence their integrity (Figure 4). Any perturbation that occurs within the watershed has a likelihood of disturbing or modifying both the aquatic and riparian systems. Ephemeral natural catchments, perennial marsh/cienega/spring/seep types, and riparian areas had the highest magnitude scores. Rocky Mountain Alpine-Montane Wet Meadow, Intermountain Basins Big Sagebrush Shrubland, Chihuahuan Semi-Desert Grasslands had the lowest cumulative scores for key habitats in New Mexico. Rocky Mountain Alpine-Montane Wet Meadows occur in higher elevations within New Mexico and likely occur in protected areas.
Many human activities have the potential to be either beneficial or detrimental to wildlife. For example, livestock grazing can be a valuable tool to improve wildlife habitat. However, if livestock grazing is applied improperly, it can be detrimental to plant communities and wildlife. Additionally, some practices may affect SGCNs differently.
The effects of climate change on ecosystems and species are likely to be exacerbated in areas that have already been substantially affected by human activities such as habitat loss and fragmentation, air and water pollution, and the establishment of invasive species. Habitat fragmentation decreases the ability of plant and animal species to migrate in response to changing conditions or species requirements. Invasive species are most successful in ecosystems already disturbed by anthropogenic activities [21]. Climate change may act as a form of disturbance creating opportunities for invasive species to colonize and displace native species [22]. When suitable habitat conditions disappear or shift faster than populations can adjust the likelihood of species extirpation or extinction increases [23].
This information may be displayed spatially, allowing land managers and decision makers to understand the geographic areas where multiple effects of potential factors may influence some habitats greater than other habitats. Given this spatial representation, aquatic and riparian habitats statewide, areas in the shortgrass prairie in eastern New Mexico, and Madrean systems in the Gila National Forest may have several factors that when placed together influence the integrity of these habitats. These are key areas to further investigate regarding factors that influence habitats.
3.5. Association of Model Variables
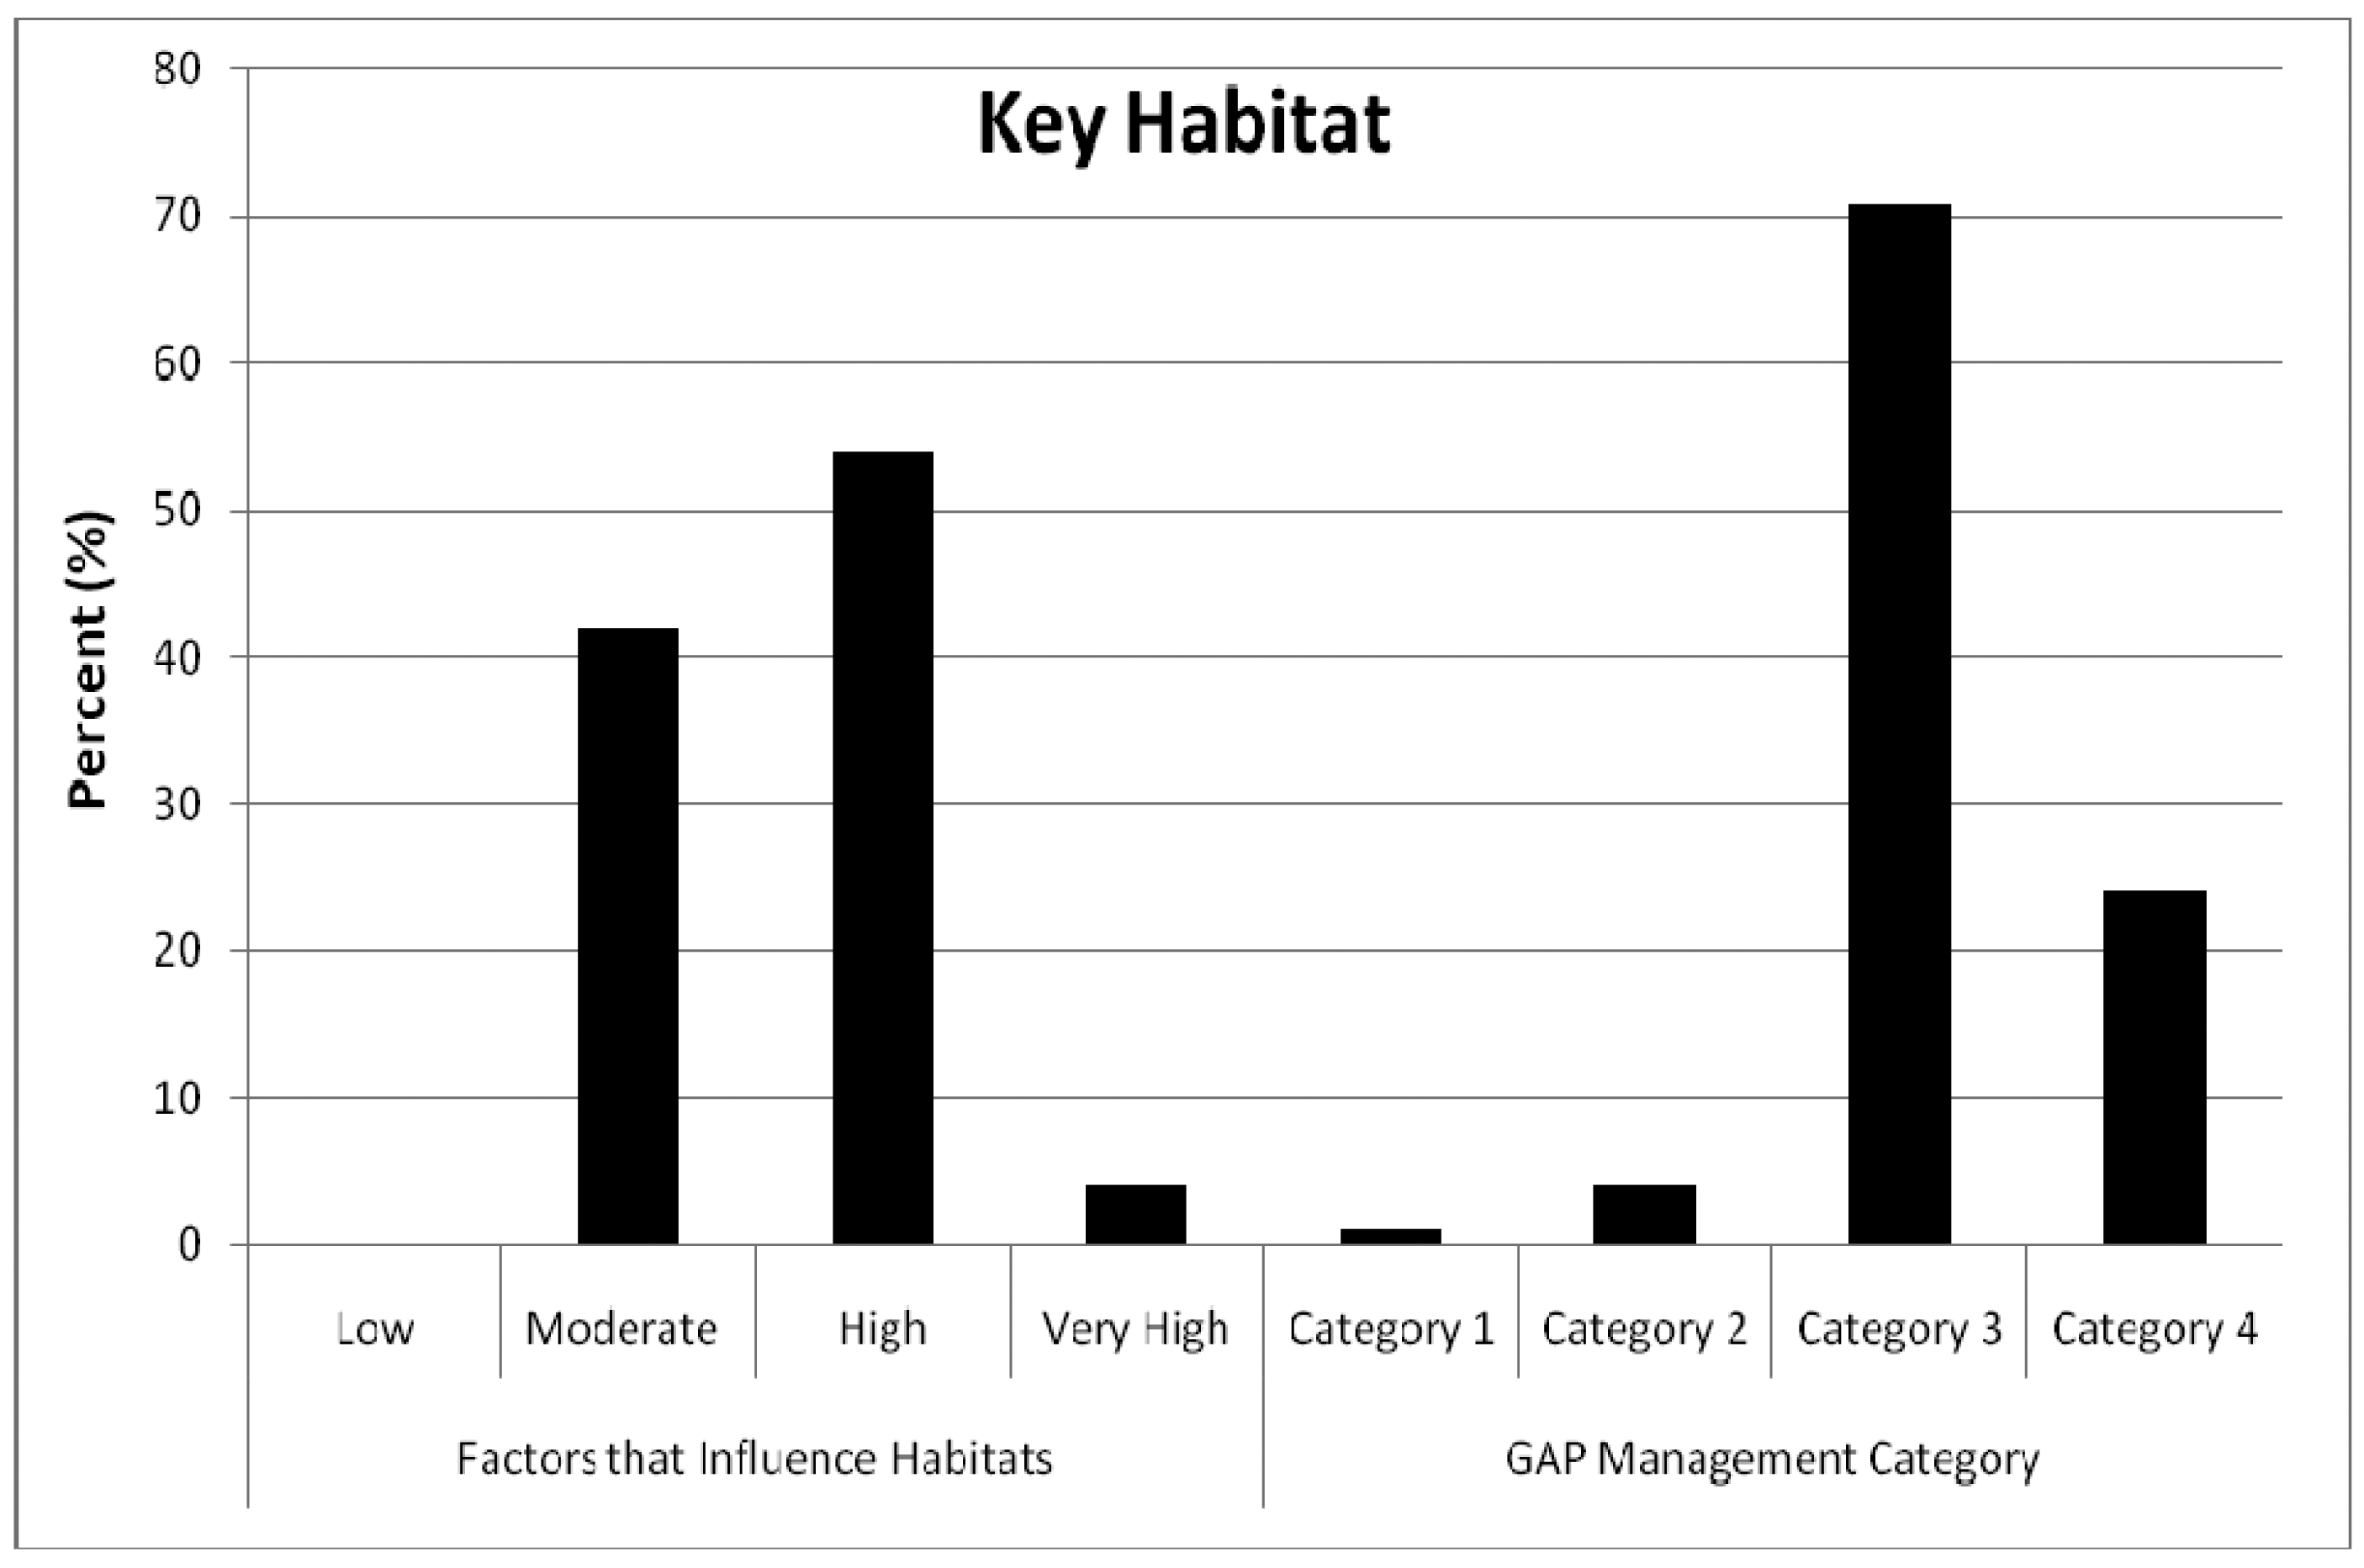
In New Mexico, habitats that are important for New Mexico's biodiversity are distributed across a variety of habitat stressors and management intent categories. Approximately 58% of the area associated with key habitats were estimated as having high to very high FIH, with an additional 42% of key habitats exhibiting moderate FIH (Figure 6). Although the percentage of key habitat areas influenced by very high stressors (4%), these areas are often associated with riparian habitats, which are extremely important to New Mexico's biodiversity [3].
Likewise, approximately 71% of areas associated with key habitats are potentially under private management (Category 3), with approximately 24% in multiple use lands (Category 4).
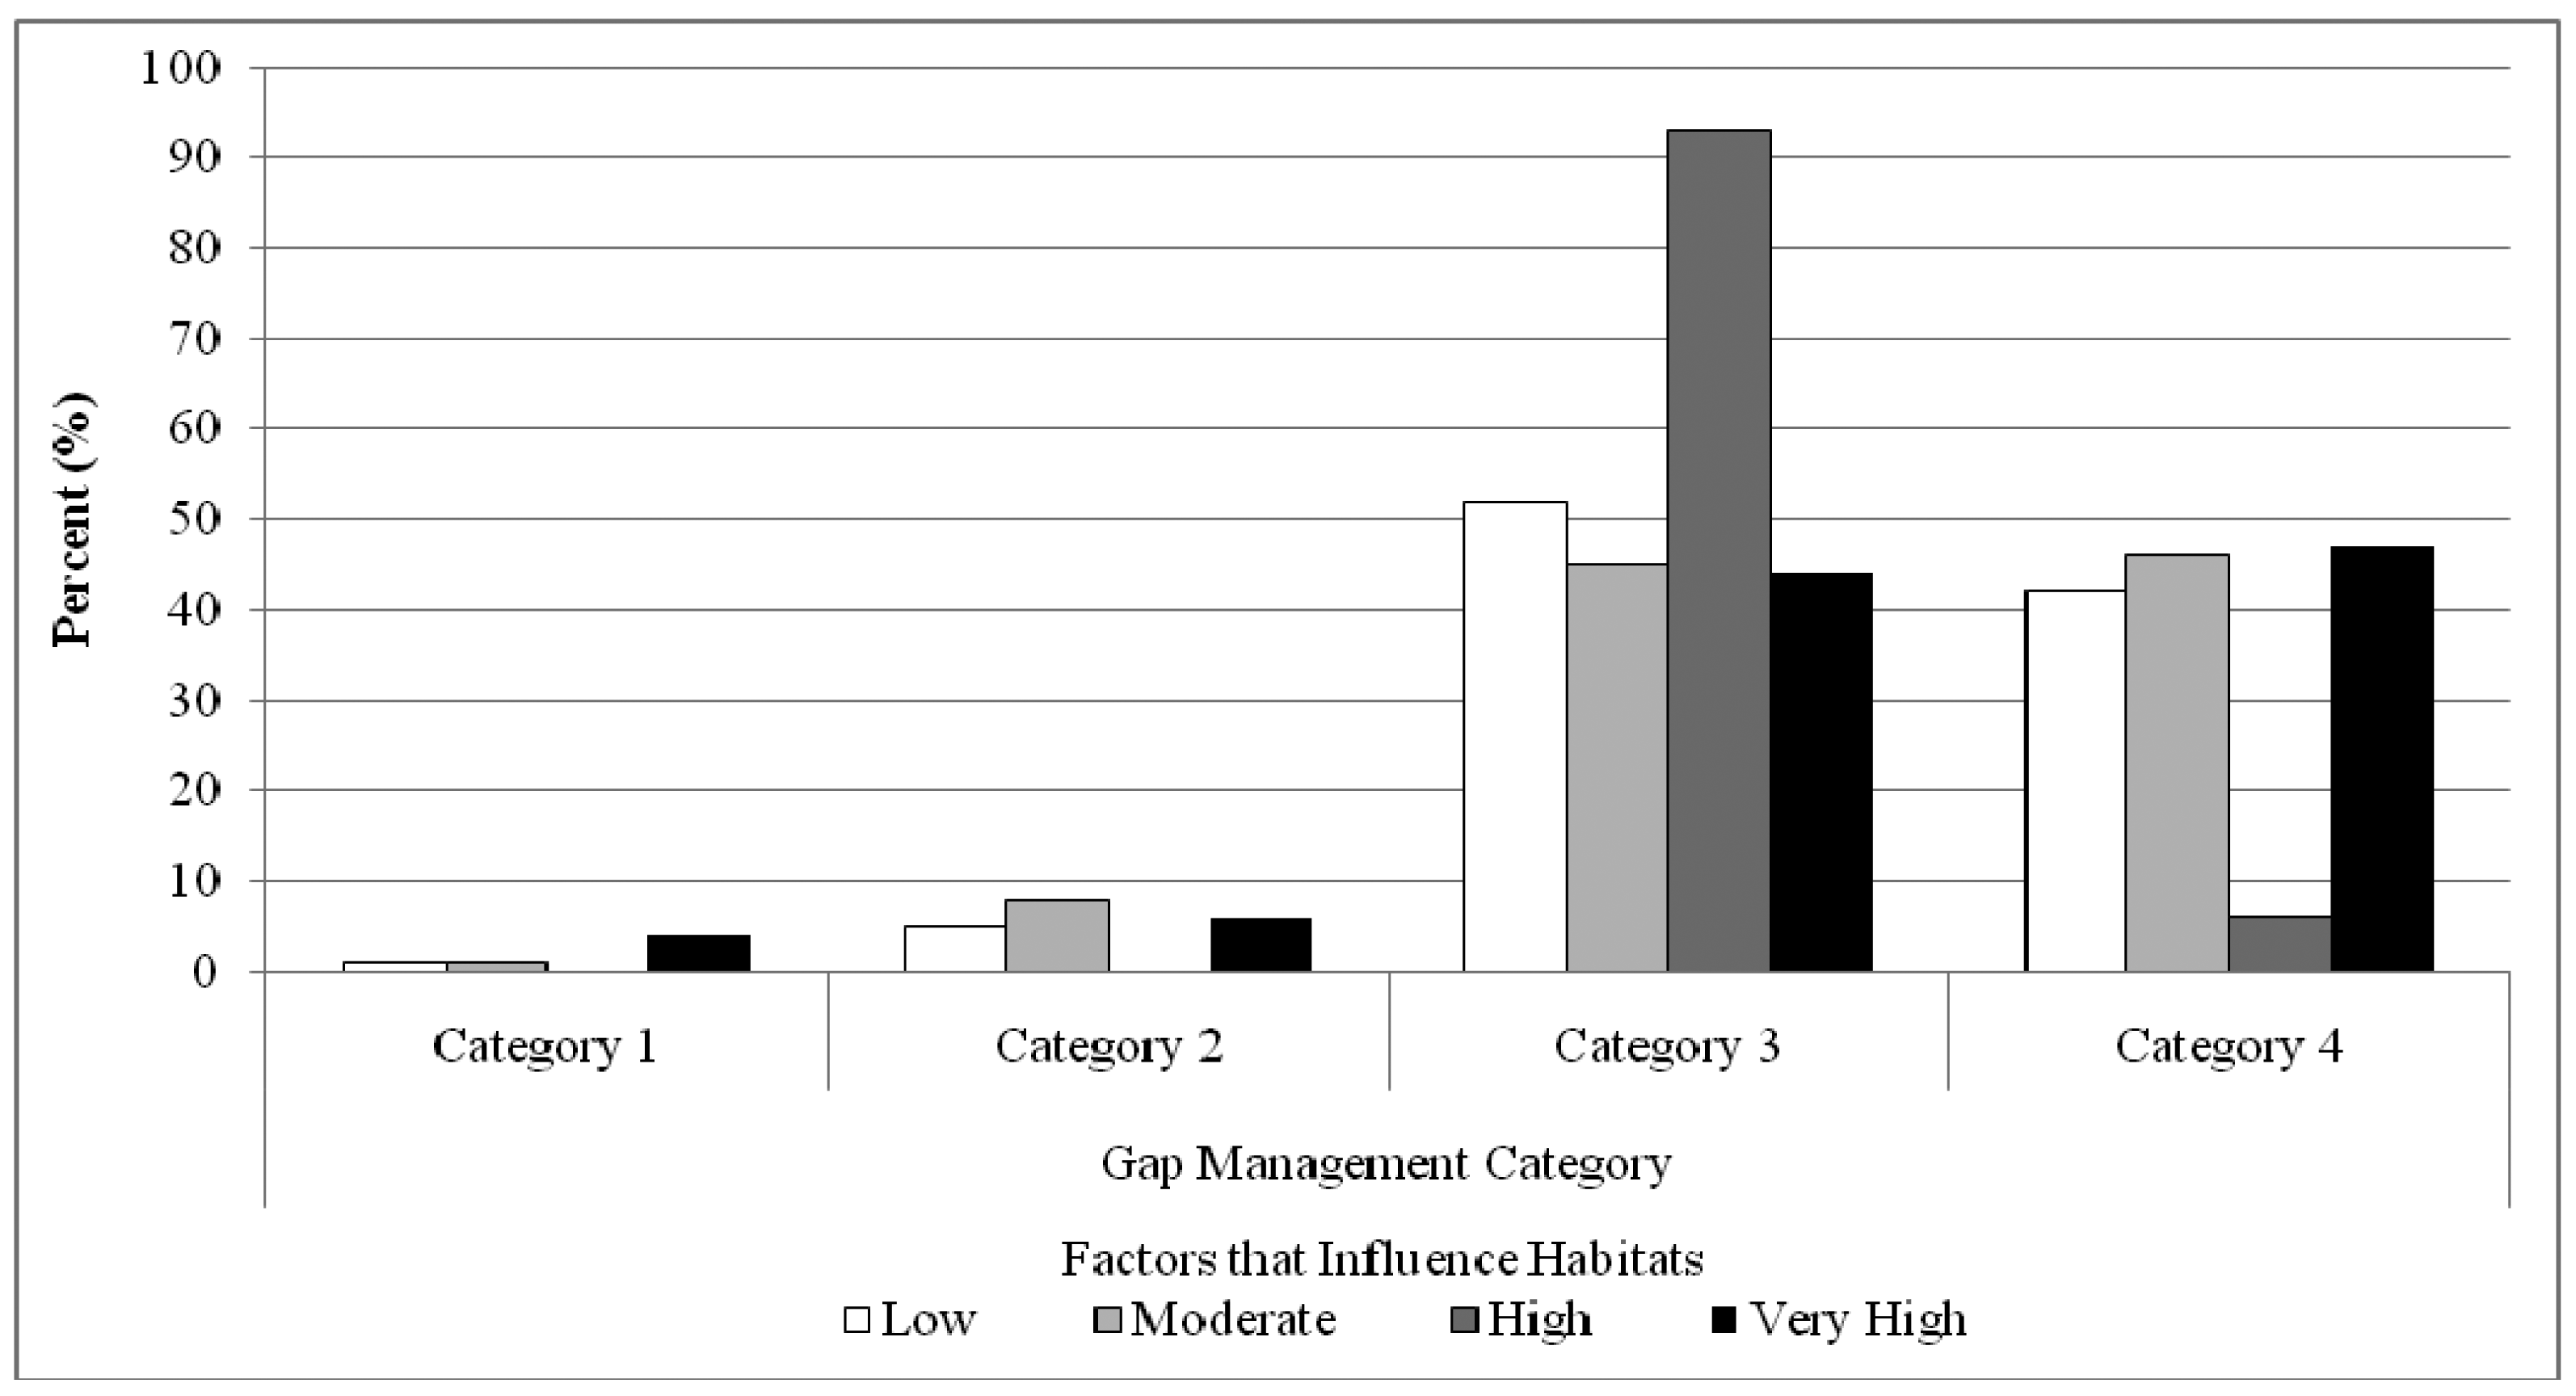
Areas with highest species and habitat stressors occurred in private and multiple use lands, i.e., Category 3 and 4, respectively (Figure 7). Category 1 and 2 lands are the most protected lands and perturbations within these lands are often limited because of legal mandates. Private lands (Category 3) had over 90% of the high FIH. This corresponds to the key habitat of Western Great Plains Shortgrass Prairie which occurs predominately on private lands.
3.6. Conservation Areas
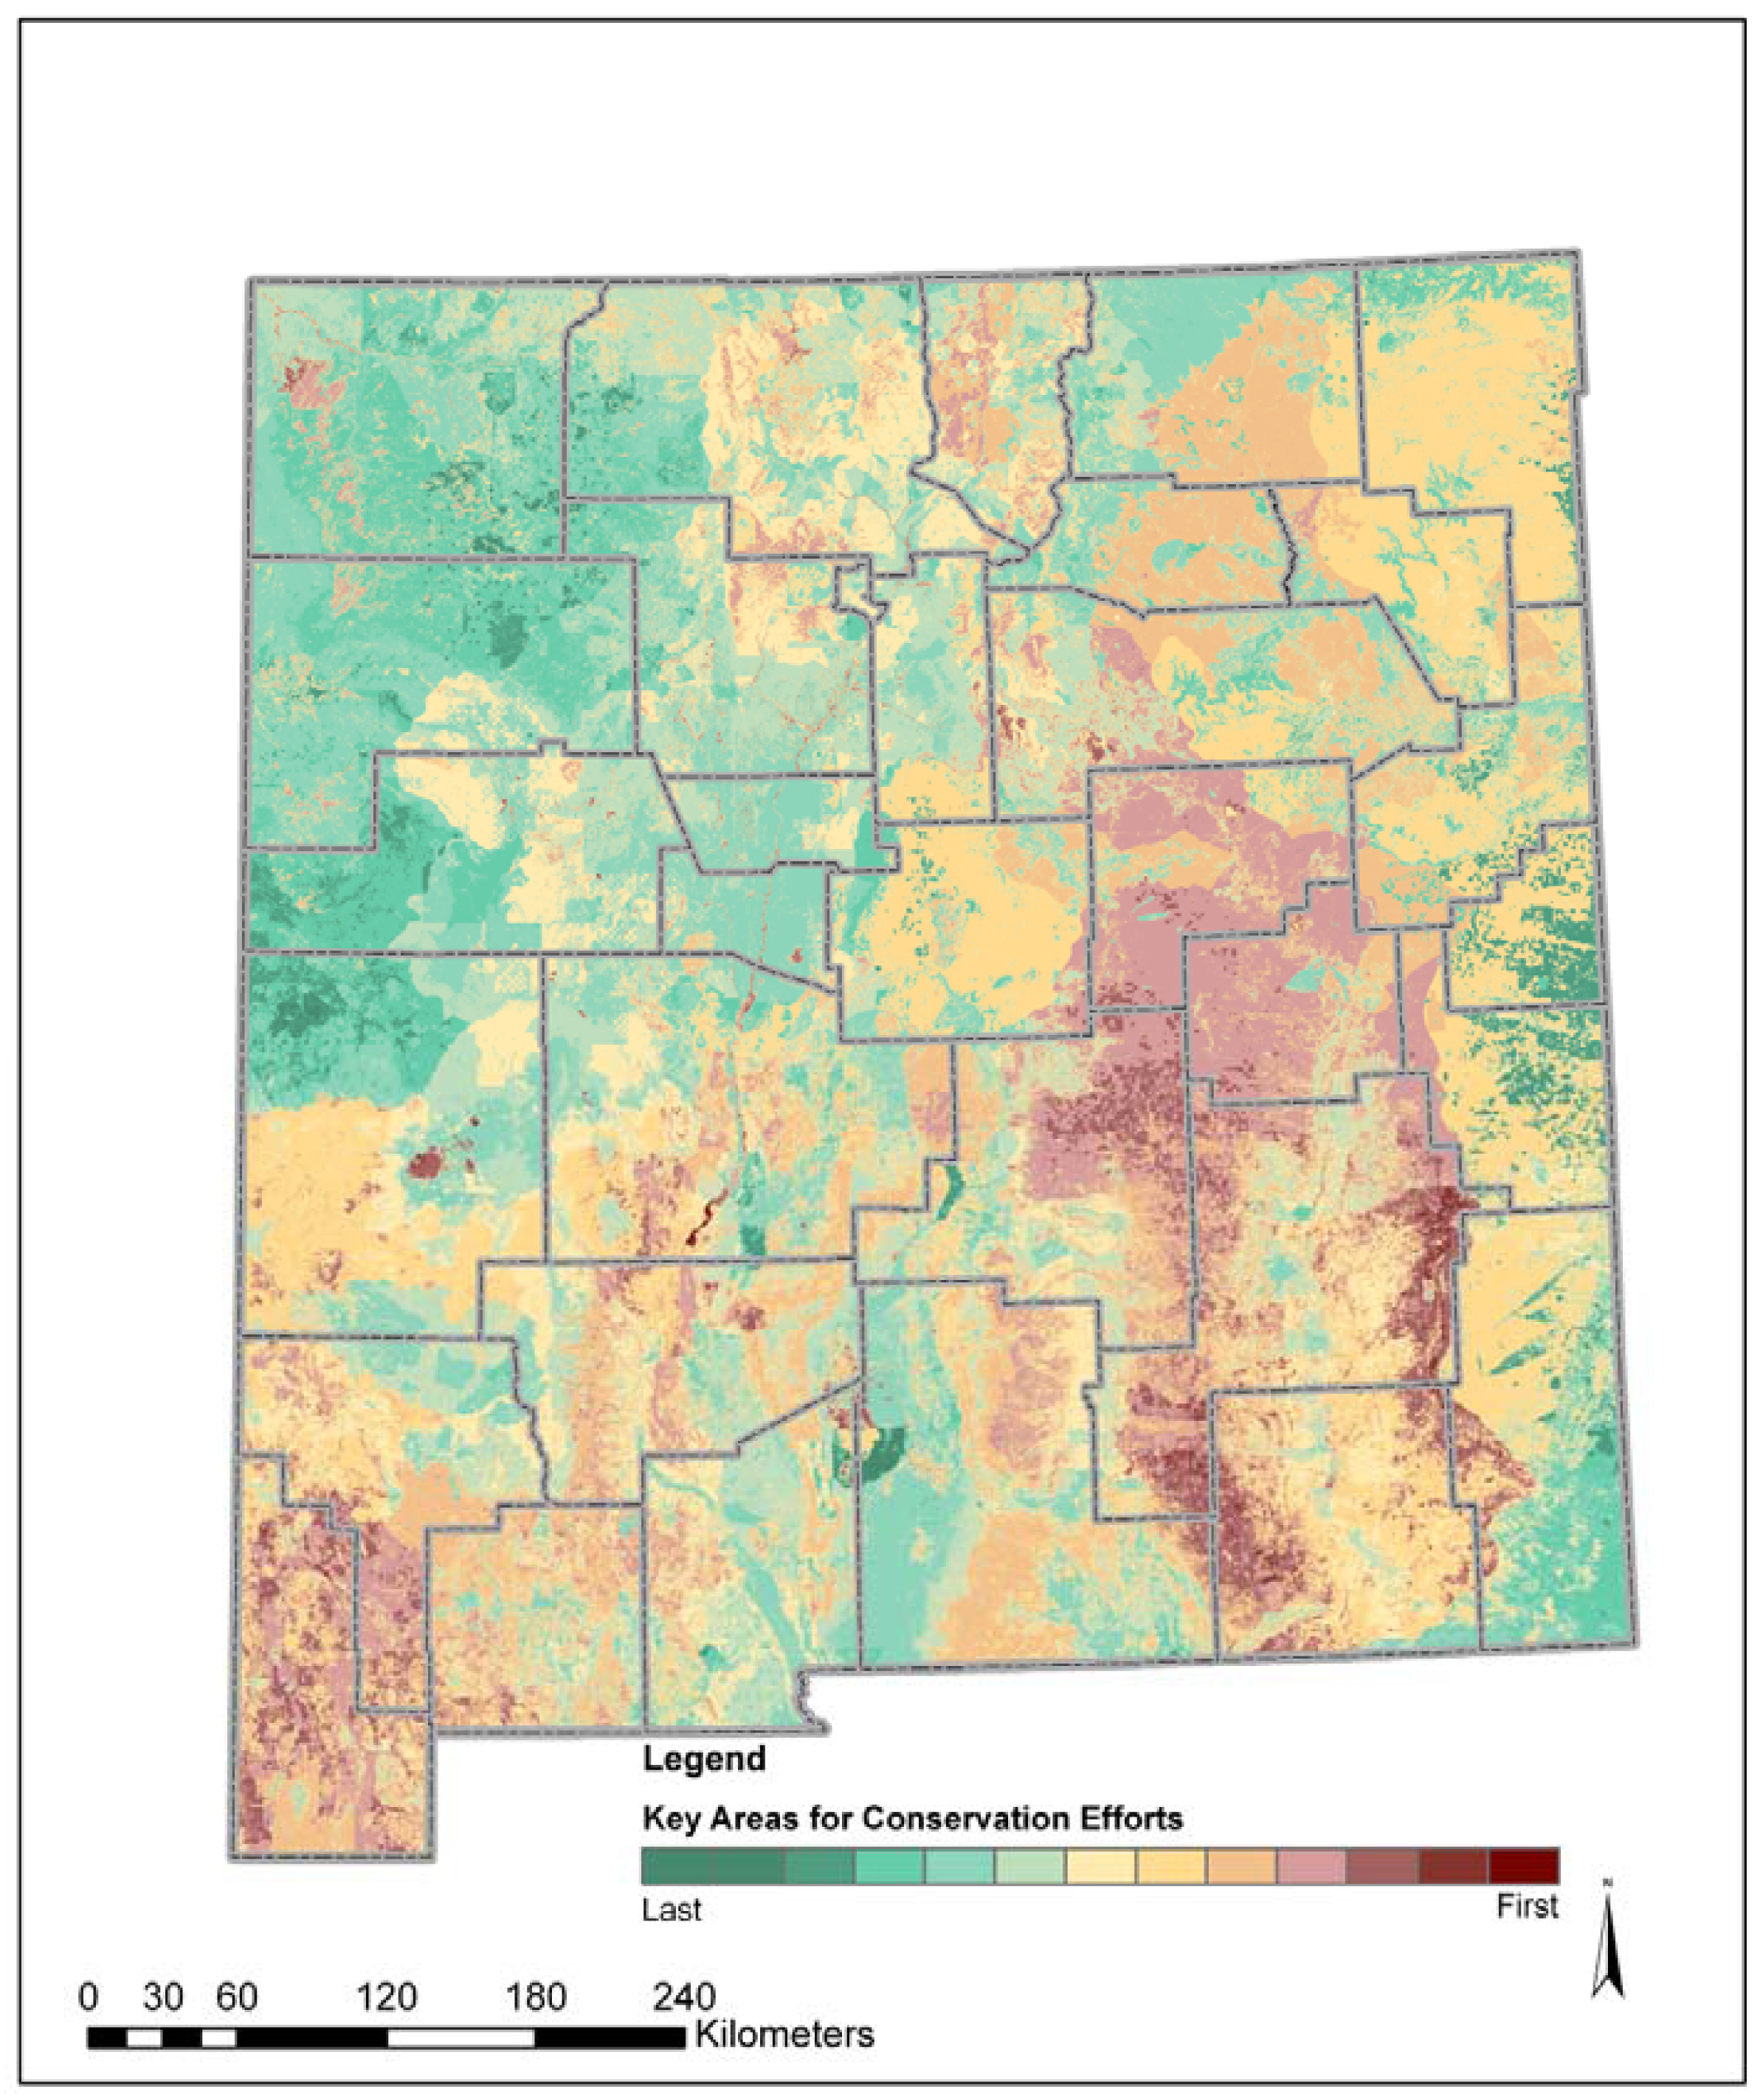
The spatial model that displays key area to consider for conservation planning identifies landscapes with high numbers of terrestrial and aquatic SGCN taxa, areas that are key habitats, may be potentially altered by multiple factors that influence habitats, and lack long-term legally-binding management plans protecting them from anthropogenic degradation (Figure 8). Key areas to consider for conservation efforts include the extreme southwest corner of New Mexico, much of the eastern plains, and mountainous areas of the state.
The southwest corner of New Mexico is one of the most diverse areas within New Mexico and the Southwest [20,24]. The area hosts a wide variety of fauna including a large number of primarily Mexican species. This area is at the extreme northern range of some species and often reflects the only US distribution of these species. Four key habitats occur within this area including the Chihuahuan Semi-Desert Grassland, Madrean Encinal, Madrean Pine-Oak/Conifer-Oak Forest and Woodland, and riparian systems [14]. The ownership is a patchwork of state, federal, private and non-governmental organizations [9]. The above three factors (SGCN, key habitats, and management category) rank these areas high as the sum of factors that influence habitats are generally low throughout this area [3].
The eastern plains of New Mexico are another key area for conservation consideration. The area hosts a large number of species particularly in the Lower Pecos River watersheds [3,15]. The area includes the confluence of several ecoregions and a wide variety of land cover types ranging from sagebrush scrub to conifer forest. Three key habitats occur within this area including the Western Great Plains Sandhill Sagebrush Shrubland, Western Great Plains Shortgrass Prairie, and riparian. The Western Great Plains Shortgrass Prairie is the largest mapped land cover type within New Mexico [14]. This part of New Mexico is largely held in private ownership [9] and is exposed to a number of factors that have or could permanently alter native communities [3].
The mountains of New Mexico are also key areas for conservation consideration. New Mexico mountains hold distinct faunal assemblages with many invertebrate and vertebrate endemics [3]. These mountainous regions contain a wide variety of land cover types with some unique to the Southwest and others at their most southern distribution [14,18]. Three key habitats occur within this area including the Rocky Mountain Montane Mixed Conifer Forest and Woodland, Rocky Mountain Alpine-Montane Wet Meadow, and riparian [3,14]. These areas are largely managed by federal agencies, principally the USDA Forest Service [9]. These areas also include much of the wilderness areas and other protected areas within New Mexico [9]. The habitats are exposed to relatively fewer factors that influence habitats [3].
Riparian areas within the Southwestern United States and in particular New Mexico are known to be key conservation areas [3] and are biological diverse. Although a large number of species (69% SGCN) are associated with riparian habitats, in the arid and semi-arid Southwest United States, these areas are extremely limited in scale compared to surrounding uplands. Further, riparian areas are often the focus of human recreation and other land uses, making these areas an important focal place for conservation efforts.
3.7. Comparison with Other Methods
There have been other efforts that have addressed similar questions to our research [4-7]. There has been a keen interest in the conservation community to identify areas in which to focus conservation efforts. We used the finest scale data available for the broad landscape of a U.S. State. These data are generally available within the U.S and many of these datasets are available at coarser levels throughout the world. Within New Mexico, our effort identified many of the same areas of interest as previous efforts [4,5] though only the SWReGAP effort was conducted over the entire state of New Mexico. In general, efforts have focused on conservation reserve design such Marxan [25] or biodiversity using aquatic [26] or terrestrial vertebrate species as a focal point [4,7]. We chose a simple process that focused on four variables that were central to the CWCS. This simplicity was important as the transparency provided a process for departmental personnel input and ease in repeating the process in future revision of CWCS in New Mexico.
There are uncertainties in the data used in this process and accuracy assessments have been conducted on the land cover [14] and original SWReGAP species habitat [27] datasets. Management status across the State may vary temporally, as lands are sold, exchanged, or management priorities are changed. In addition, landscape scale stressors or FIH may vary temporally asareas are developed or management actions change. Evaluating biodiversity in the field is an expensive endeavor, and was beyond the scope of this research. As such, we did not conduct a formal field assessment on the final model that displayed key areas to focus conservation efforts, though there are processes such as Monte Carlo similarities [28] that can addresses data uncertainties. There have also been a number of spatial risk analyses conducted [29] using processes that weigh risks or opportunities.
We chose to equalize the input variables so that no one variable was given priority. In the end, our process was simple, understandable, easily repeatable for future CWCS revisions, and applicable to other geographic regions and scales. Our process also provided a baseline to analyze ecological context [30] of any one site compared to other sites within the state using existing, available data. The purpose of this research was to assist land managers in identifying broad areas for conservation efforts across the State. Thus, assessment, or validation, of this model will primarily be done by conservation planners and management agencies. The validation question is whether the spatial model directed conservation attention to a given area in the State. As such, validation of this model will employ a temporal assessment. If the concepts are sound and the process is understandable, this type of effort can provide additional tools for use in identifying conservation priorities on the landscape and assist future CWCS revisions to track changes in areas identified for conservation priority.
4. Conclusions
All landscapes in New Mexico are important for conserving the full suite of New Mexico's biodiversity and should be considered in the context of ecosystem management. However, because time and resources are limited, it is important to identify, prioritize, and focus upon key areas for conservation action.
We used four criteria to identify key areas based on information gained in developing the CWCS for New Mexico. We identified areas that contain key habitats, have a high diversity of SGCN, are subjected to a moderate to high magnitude of multiple habitat altering factors, and lack legal constraints or long-term management plans protecting them from habitat conversion. Our analysis identified key areas to focus conservation efforts in New Mexico including riparian and aquatic habitats throughout the state, areas in the “boot heel” region in southwestern New Mexico extending northward into Madrean habitats, and areas of the shortgrass prairie and western mountain ranges where they converge with Chihuahuan Desert and Pecos River habitats.
Identifying these key areas is the first step in conservation efforts. The next step is to engage appropriate federal, state, local, and tribal governments, NGOs, and private interests in determining where, when, what, and how on-the-ground conservation actions can be implemented.


| Four Input Models | Numeric Values of Input Models | |||
|---|---|---|---|---|
| 1.0 | 2.0 | 3.0 | 4.0 | |
| SWReGAP land status categories (Status Code) | 1 A (Category 1) | 2 B (Category 2) | 4 C (Category 3) | 3 D (Category 4) |
| Key habitats | Not Present | Present | ||
| Terrestrial and aquatic SGCN diversity (SGCN Taxa Modeled) | 44–59 (low) | 60–76 (moderate) | 77–93 (high) | 94–109 (very high) |
| Multiple effects of factors that may influence habitats (Total Magnitude Score) | 0–40 (low) | 41–80 (moderate) | 81–120 (high) | 120–165 (very high) |
A(e.g., Wilderness Areas);B(e.g., National Park Lands);C(e.g., Private lands);D(e.g., Multiple use lands).
| Aquatic Habitats | Terrestrial Habitats |
|---|---|
| Perennial Large Reservoir | Chihuahuan Semi-Desert Grassland |
| Perennial 1st and 2nd Order Stream | Intermountain Basins Big Sagebrush Shrubland |
| Perennial 3rd and 4th Order Stream | Madrean Encinal |
| Perennial 5th Order Stream | Madrean Pine-Oak/Conifer-Oak Forest and Woodland |
| Perennial Tank | Riparian |
| Perennial Marsh/Cienega/Spring/Seep | Western Great Plains Sandhill Sagebrush Shrubland |
| Ephemeral 1st and 2nd Order Stream | Western Great Plains Shortgrass Prairie |
| Ephemeral Natural Catchments | Rocky Mountain Alpine-Montane Wet Meadow |
| Ephemeral Man-Made Catchments | Rocky Mountain Montane Mixed Conifer Forest and Woodland |
| Ephemeral Marsh/Cienega |
| Category | Description of Category |
|---|---|
| Abiotic Resource Use | Human extraction of non-biological resources. |
| Consumptive Biological Use | Human harvesting or use of biological resources from an ecosystem that removes the resources from the system. |
| Habitat Conversion | Total loss or destruction of natural habitat. |
| Invasive Species | Human linked introduction and spread of species from one ecosystem to another. Includes alien or exotic species plant and wildlife species. |
| Modification of Natural Processes and Ecological Drivers | Human caused changes in natural systems and overarching ecosystem drivers, e.g., drought. |
| Non-Consumptive Biological Use | Human use of biological resources in an ecosystem in a way that does not remove the resources from the system. |
| Pollution | Human caused introduction and spread of unwanted matter and energy into ecosystems. Includes chemical, biochemical, thermal, radiation, and noise pollution. |
| Transportation Infrastructure | Development of long narrow corridors for transporting people, goods, and energy. |
| Categories | Landscape Habitat Factors |
|---|---|
| Abiotic Resource Use | Geothermal energy |
| Hydropower | |
| Mining | |
| Oil and Gas exploration/development | |
| Water Withdrawal/Dewatering | |
| Windfarms | |
| Consumptive Biological Use | Deforestation |
| Fuel wood collection | |
| Hunting/gathering | |
| Improper Grazing Practices | |
| Logging | |
| Habitat–Conversion | Agricultural production/livestock production |
| Altered hydroperiod | |
| Channelization | |
| Dams | |
| Drainage of wetlands | |
| Ground water depletion | |
| Herbicide shrub control | |
| Regulated Flows | |
| Sediment Load | |
| Urban/residential, commercial/industrial, and recreational development | |
| Invasive Species | Disease/Parasites/pathogens |
| Exotic or invasive plants | |
| Exotic or invasive wildlife | |
| Modification of Natural Processes and Ecological Drivers | Drought |
| Ecological Sustainability and Integrity | |
| Fire management | |
| Loss of Keystone Species | |
| Non-consumptive Biological Use | ATVs/Snowmobiles/off road vehicles |
| Military Maneuvers | |
| Outdoor Recreational | |
| Scientific Research | |
| Pollution | Agricultural chemicals |
| Livestock/dairy groundwater contamination | |
| Sewage/Septic | |
| Solid Waste | |
| Toxic waste contamination | |
| Transportation Infrastructure | Roads, highways, railroads, and utility corridors |
| Variable | Continuous Measurement | Categorical Measurement | Comments |
|---|---|---|---|
| Spatial Scope | Area threatened expressed in hectares or as a % of the total possible project area | 4 = Throughout (>50%) 3 = Widespread (15–50%) 2 = Scattered (5–15%) 1 = Localized (<5%) | Calculated as % ofpossible area (i.e., water pollution is % of aquatic habitat at a site, not entire site) |
| Severity | Actual measure of reduced target viability/integrity (e.g., nesting success, stream temperature) | 4 = Serious damage or loss 3 = Significant damage 2 = Moderate damage 1 = Little or no damage | Independent of area; the degree to which a threat has an impact on the viability/integrity of targets within the project area within 10 years. |
Acknowledgments
We thank the New Mexico Department of Game and Fish for the opportunity to assist in creation of the Comprehensive Wildlife Conservation Strategy for New Mexico. We thank William Graves for his contribution to this effort and to New Mexico conservation. The United States Geological Survey National Gap Analysis Program provided additional funding for this work. Additional financial assistance was provided by New Mexico State University, Agricultural Experiment Station.
References
- Wood, P.J.; Armitage, P.D. Biological effects of fine sediment in the lotic environment. Environ. Manage. 1997, 21, 203–217. [Google Scholar]
- Niemi, G.J.; DeVore, P.; Detenbeck, N.; Taylor, D.; Lima, A.; Pastor, J.; Yount, J.D.; Naiman, R.J. Overview of case studies on recovery of aquatic systems from disturbance. Environ. Manage. 1990, 14, 571–587. [Google Scholar]
- New Mexico Department of Fish and Game. Comprehensive Wildlife Conservation Strategy for New Mexico; New Mexico Department of Fish and Game: Santa Fe, NM, USA, 2006. [Google Scholar]
- Prior-Magee, J.S.; Boykin, K.G.; Bradford, D.F.; Kepner, W.G.; Lowry, J.H.; Schrupp, D.L.; Thomas, K.A.; Thompson, B.C. Southwest Regional Gap Analysis Project Final Report; U.S. Geological Survey, Gap Analysis Program: Moscow, ID, USA, 2007; p. 417. [Google Scholar]
- Bell, G.; Baumgartner, J.; Humke, J.; Laurenzi, A.; McCarthy, P.; Mehlhop, P.; Rich, K.; Silbert, M.; Smith, E.; Spicer, B.; et al. Ecoregional Conservation Analysis of the Arizona-New Mexico Mountains; The Nature Conservancy: Santa Fe, NM, USA, 1999; p. 151. [Google Scholar]
- Sowa, S.P.; Annis, G.; Morrey, M.E.; Diamond, D.D. A gap analysis and comprehensive conservation strategy for riverine ecosystems of Missouri. Ecol. Monogr. 2007, 77, 301–334. [Google Scholar]
- Scott, J.M.; Davis, F.; Csuti, B.; Noss, R.; Butterfield, B.; Groves, C.; Anderson, H.; Caicco, S.; D'Erchia, F.; Edwards, T.C., Jr.; et al. Gap analysis: A geographical approach to protection of biological diversity. Wildl. Monogr. 1993, 123, 3–41. [Google Scholar]
- Gara, R.I.; Littke, W.R.; Agee, J.K.; Geiszler, D.R.; Stuart, J.D.; Driver, C.H. Influences of Fires, Fungi, and Mountain Pine Beetles on Development of a Lodgepole Pine Forest in South-Central Oregon. In Lodgepole Pine: The Species and Its Management; Baumgartner, D.M., Ed.; Washington State University: Pullman, WA, USA, 1985; pp. 153–162. [Google Scholar]
- Prior-Magee, J.S.; Thompson, B.C.; Daniel, D. Evaluating consistency of categorizing biodiversity management status relative to land stewardship in the Gap Analysis Program. J. Environ. Plann. Manage. 1998, 41, 209–216. [Google Scholar]
- Ernst, A.E.; Schrader, S.; Lopez, V.; Prior-Magee, J.; Boykin, K.; Schrupp, D.; O'Brien, L.; Kepner, W.; Thomas, K.; Lowry, J.; Thompson, B. Land Stewardship. In Southwest Regional Gap Analysis Final Report; Prior-Magee, J.S., Ed.; U.S. Geological Survey, Gap Analysis Program: Moscow, ID, USA, 2007; pp. 79–111. [Google Scholar]
- Paine, R.T.; Tegner, M.J.; Johnson, E.A. Compounded perturbations yield ecological surprises. Ecosystems 1998, 1, 535–545. [Google Scholar]
- Peet, R.K. Forests of the Rocky Mountains. In North American Terrestrial Vegetation; Barbour, M.G., Billings, W.D., Eds.; Cambridge University Press: New York, NY, USA, 1988; pp. 63–101. [Google Scholar]
- Strahler, A.N. Quantitative analysis of watershed geomorphology. Trans. Am. Geophys. Union 1957, 38, 913–920. [Google Scholar]
- Lowry, J.; Ramsey, R.; Thomas, K.; Schrupp, D.; Sajwaj, T.; Kirby, J.; Waller, E.; Schrader, S.; Falzarano, S.; Langs, L.; et al. Mapping moderate-scale land-cover over very large geographic areas within a collaborative framework: A case study of the Southwest Regional Gap Analysis Project (SWReGAP). Remote Sens. Environ. 2007, 108, 59–73. [Google Scholar]
- Boykin, K.G.; Thompson, B.C.; Deitner, R.A.; Schrupp, D.; Bradford, D.; O'Brien, L.; Drost, C.; Propeck-Gray, S.; Rieth, W.; Thomas, K.; et al. Predicted Animal Habitat Distributions and Species Richness. In Southwest Regional Gap Analysis Final Report; Prior-Magee, J.S., Ed.; U.S. Geological Survey, Gap Analysis Program: Moscow, ID, USA, 2007; pp. 39–78. [Google Scholar]
- Salafsky, N.; Salzer, D.; Ervin, J.; Ostlie, W.; Boucher, T. Conventions for defining, naming, measuring, combining, and mapping threats in conservation: An initial proposal for a standard system. ConservationOnline. 2003, p. 33. Available online: http://conserveonline.org/workspaces/ecoregional_status_measures/ersm/threat_status/threat%20convetions.pdf (accessed on 24 May 2010). [Google Scholar]
- The Nature Conservancy. Conservation Action Planning Handbook: Developing Strategies, Taking Action and Measuring Success at Any Scale; The Nature Conservancy: Arlington, VA, USA, 2007; p. 129. [Google Scholar]
- Dick-Peddie, W.A. New Mexico Vegetation: Past, Present and Future; University of New Mexico Press: Albuquerque, NM, USA, 1992; p. 280. [Google Scholar]
- Briggs, M.K. Riparian Ecosystem Recovery in Arid Lands: Strategies and References; University of Arizona Press: Tucson, AZ, USA, 1996; p. 159. [Google Scholar]
- Thompson, B.C.; Matusik-Rowan, P.L.; Boykin, K.G. Prioritizing conservation potential of arid-land montane natural springs and associated riparian areas. J. Arid Land 2002, 50, 527–547. [Google Scholar]
- Elton, C.S. The Ecology of Invasion by Animals and Plants; University of Chicago Press: Chicago, IL, USA, 1958. [Google Scholar]
- Malcolm, J.R.; Pitelka, L.F. Ecosystems and Global Climate Change: A Review of Potential Impacts on US Terrestrial Ecosystems and Biodiversity; Pew Center on Global Climate Change: Arlington, VA, USA, 2001; pp. 1–41. [Google Scholar]
- Malcolm, J.R.; Diamond, A.W.; Markham, A.; Mkanda, F.X.; Starfield, A.M. Biodiversity: Species, Communities, and Ecosystems. In Handbook on Methods for Climate Change Impact Assessment and Adaptation Strategies, 2nd ed.; Feenstra, J.F., Burton, I., Smith, J.B., Tol, R.S.J., Eds.; United Nations Environment Programme, Nairobi and Institute for Environmental Studies, Vrije Universiteit: Amsterdam, The Netherlands, 1998; pp. 13:1–13:34. [Google Scholar]
- Boykin, K.G.; Langs Stoner, L.; Lowry, J.; Schrupp, D.; Bradford, D.; O'Brien, L.; Thomas, K.; Drost, C.; Ernst, A.; Kepner, W.; et al. Analysis Based on Stewardship and Management Status. In Southwest Regional Gap Analysis Final Report; Prior-Magee, J.S., Ed.; U.S. Geological Survey, Gap Analysis Program: Moscow, ID, USA, 2007; pp. 112–171. [Google Scholar]
- Ball, I.R.; Possingham, H.P.; Watts, M.E. Marxan and Relatives: Software for Spatial Conservation Prioritization. In Spatial Conservation Prioritization. Quantitative Methods & Computational Tools; Moilanen, A., Wilson, K.A., Possingham, H.P., Eds.; Oxford University Press: Oxford, UK, 2009; pp. 185–195. [Google Scholar]
- Jennings, M.D.; Hoekstra, J.; Higgins, J.; Boucher, T. A comparative measure of biodiversity based on species composition. Biodivers. Conserv. 2008, 17, 833–840. [Google Scholar]
- Boykin, K.G.; Thompson, B.C.; Propeck-Gray, S. Accuracy of southwest regional gap analysis project habitat models in predicting physical features for habitat associations. Ecol. Model. 2010, 221, 2769–2775. [Google Scholar]
- Miller, T.K.; Allen, C.R.; Landis, W.G.; Merchant, J.W. Risk assessment: Simultaneously prioritizing the control of invasive plant species and the conservation of rare plant species. Biol. Conserv. 2010, 143, 2070–2079. [Google Scholar]
- Andersen, M.C.; Thompson, B.C.; Boykin, K.G. Spatial risk assessment across large landscapes with varied land use: Lessons from a conservation assessment of military lands. Risk Anal. 2004, 24, 1231–1242. [Google Scholar]
- Hamazaki, T.; Thompson, B.C.; Locke., B.A.; Boykin, K.G. Analysis of ecological context for identifying vegetation and animal conservation planning foci: An Example from the arid Southwestern United States. J. Environ. Plann. Manage. 2003, 46, 239–256. [Google Scholar]
© 2011 by the authors; licensee MDPI, Basel, Switzerland. This article is an open access article distributed under the terms and conditions of the Creative Commons Attribution license (http://creativecommons.org/licenses/by/3.0/).
Share and Cite
Boykin, K.G.; Young, K.E.; Guy, R.K. Spatial Identification of Statewide Areas for Conservation Focus in New Mexico: Implications for State Conservation Efforts. Diversity 2011, 3, 275-295. https://doi.org/10.3390/d3020275
Boykin KG, Young KE, Guy RK. Spatial Identification of Statewide Areas for Conservation Focus in New Mexico: Implications for State Conservation Efforts. Diversity. 2011; 3(2):275-295. https://doi.org/10.3390/d3020275
Chicago/Turabian StyleBoykin, Kenneth G., Kendal E. Young, and Rachel K. Guy. 2011. "Spatial Identification of Statewide Areas for Conservation Focus in New Mexico: Implications for State Conservation Efforts" Diversity 3, no. 2: 275-295. https://doi.org/10.3390/d3020275