Diversity, Stand Characteristics and Spatial Aggregation of Tree Species in a Bangladesh Forest Ecosystem


Abstract
: Assessing biodiversity and the spatial structures of forest ecosystems are important for forestry and nature conservation. However, tropical forests of Bangladesh are only sparsely investigated. Here we determined biodiversity (alpha, beta and gamma), spatial species turnover and stand characteristics of one of the few remnant tropical forests in Bangladesh. Two differently protected areas of Satchari forest were compared. We recorded tree species composition, in a systematic plot design, measured diameter at breast height for each individual tree (to assess basal area), and calculated decay in similarity of tree species composition with geographical distance. The distance-decay was assessed separately for the whole study area and for two subsamples from Satchari National Park and Satchari Reserve Forest. Satchari National Park (strictly protected) had, despite its smaller area, a higher Alpha and Gamma diversity, but a lower Beta diversity than Satchari Reserve Forest. Variation in species composition was not significant between the two differently protected areas. Basal area increased significantly with protection status although tree individuals were of equal size in both areas. Plots in the Reserve Forest were associated with higher species turnover than in the National Park. We suggest anthropogenic disturbance, which occurs in the less strictly protected Reserve Forest, is the main driver for the detected spatial heterogeneity in species composition.1. Introduction
Sarkar [1,2] highlights that biodiversity is (implicitly) defined as the parts of the living world that conservation management and conservation biology is supposed to conserve. In Bangladesh, a country with the fourth highest human population density (1,071 people per km2), biodiversity is under constant threat. After the 1974 Wild Life Preservation Act was established, conservation of biodiversity in Bangladesh has thoroughly improved. Despite its importance (160 million inhabitants in Bangladesh) only limited knowledge is available in international publications on plant biodiversity and ecology (463 publications with the search string “Bangladesh” in the category plant science in the Web of Knowledge; July 2011). Here we will investigate tree diversity, stand characteristics and spatial turnover of diversity in two differently protected parts of one of the few remnant protected forests of the country.
The term biodiversity has, despite intense discussions, remained remarkably vague and its measurement equally ‘capricious’ [3]. After Whittaker [4,5] ecologists traditionally separate three different types of diversity. Alpha diversity is seen as the diversity within one sampling unit, beta diversity as the similarity between different units and gamma diversity as the diversity of a whole data set (often representing a region). By suggesting different concepts of beta diversity, Whittaker [4] laid the basis for later confusion. A multitude of different ways to measure beta diversity has since been developed, all associated to different aspects of similarity and/or distance. All those concepts are somehow related to the idea that the heterogeneity of an ecosystem (or landscape) can be examined based on the joint analysis of single observations within this ecosystem/landscape [6]. Whittaker [5] defined beta diversity as ‘species turnover’ or changes in species composition from one community to another, bearing in mind the idea of a change along a gradient. Due to a multitude of measures not taking into account the distribution of species on spatial or environmental gradients, some authors suggest that the use of ‘beta diversity’ and ‘species turnover’ as synonyms is no longer adequate [7-10]. However, in some cases these terms are still used interchangeably [11-13]. Tuomisto [9] recently suggested using the average plot-level species richness as a measure for alpha diversity, the relation of gamma diversity and alpha diversity as a measure of beta diversity where gamma diversity is the total number of species observed within a data set as a measure of gamma diversity. This is also the definition we follow hereafter.
However, turnover is definitely seen as an integral part of biodiversity [9,14]. One way to quantify spatial species turnover is the application of distance-decay curves, which are a function of similarity between biotic entities and their spatial distance. The decrease of similarity between any two observations with distance is referred to as the “first law of geography” [15]. In ecology, this mostly refers to species composition [4,5,16,17]. Distance decay analyses serve as a novel perspective to analyze spatial patterns of turnover in biodiversity [18-20]. Such distance-decay curves have been applied for a wide range of organisms, geographic gradients, environments (climatic gradients) and ecosystems or communities [18,21-23]. A decline of similarity in species composition can result from various reasons such as environmental heterogeneity [21,24,25], dispersal limitation [21,26,27], abiotic and biotic disturbances [22,28], and non-stochastic organismic (animal) behavior [29-31]. A distance decay can also be an expected outcome of the balance between speciation and stochastic loss of species in landscapes [18,32,33]. Nekola and White [16], who pioneered formal and quantitative analyses of distance-decay in plant communities, highlighted the two following causes: (a) the decay of environmental similarity with distance (e.g., climatic gradients), which renders the ability of organisms to adapt to environmental changes; (b) the dispersal limitation due to ecological barriers and filters, which restricts the exchange of biotic information in space (e.g., seed transport, migration).
In this study, we characterize and examine various aspects of diversity (alpha, beta, gamma), spatial species turnover (distance-decay) as well as stand structure of tree species in Satchari forest, one of the few remaining (semi-) natural protected forests of Bangladesh. Two differently protected areas of this forest area (Satchari National Park and Satchari Reserve Forest) are compared.
In tropical forests, tree species diversity is often extraordinarily high [34], which is relevant for a whole legacy of other species. Trees are the major structural components of forest ecosystems. They support ecosystem fluxes and functioning (e.g., microclimate, nutrient availability). Stand characteristics are important for forestry. Planning and management depend on data on wood volume or tree biomass [35,36]. However, these characteristics are also of ecological importance.
This is to our knowledge the first study investigating biodiversity and stand characteristics in Bangladesh at the landscape scale. Former biodiversity studies in Bangladesh focused mainly on indexing species [37,38] or on biodiversity in home gardens [39-41].
2. Methods
2.1. Study Area
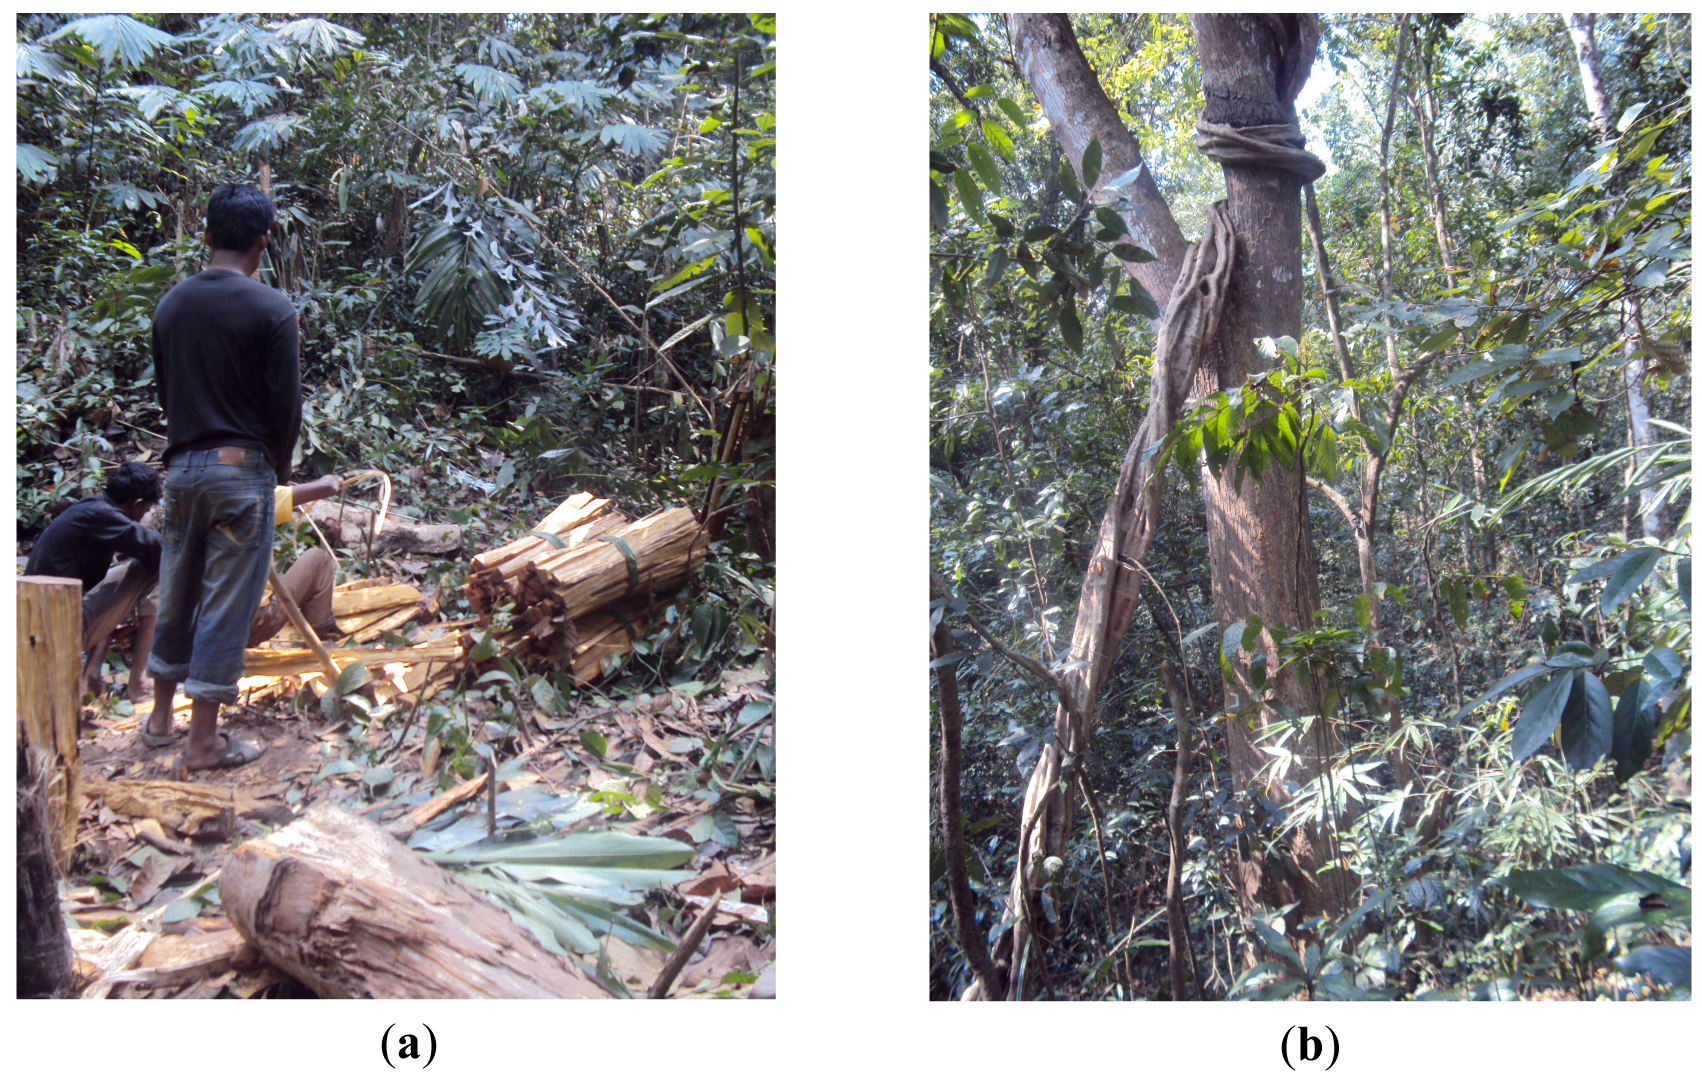
The study was conducted in forest ecosystems of Bangladesh, where knowledge about diversity patterns is scarce. We focused on the Satchari forest, which is subdivided into two parts of different protection status: Satchari National Park (NP) and Satchari Reserve Forest (RF). The whole study area has been under nominal protection since the 1974 Wild Life Preservation Act. However, human disturbances were almost entirely excluded from Satchari National Park only after its establishment in 2005, while the Reserve Forest is still subjected to different illegal usage (especially firewood collection; Figure 1(a)). Tea plantations, fallow land and settlements cover almost all of the adjoining areas of the forest. The study area is located in north-eastern Bangladesh and stretches between approximately N24°5″ and 24°9″ and E91°24″ and 92°29″. It covers an area of about 20 km2. The natural vegetation of the study area consists of a mixed tropical evergreen forest. A well-developed tree stratum with evergreen top canopy trees characterizes the less disturbed sites of the area (Figure 1(b)).
The study area is characterized by sandy loam to silty clay acidic soils and gently undulating to hilly topography (10 to 105 m a.s.l.). The climate is sub-tropical and monsoonic. The rainy season usually extends from June to September; however, the rainfall is irregularly distributed. Mean annual rainfall is 4,162 mm, peaking in the monsoon season. The relative humidity ranges from 74% during December to 90% during July and August. Research on Satchari forests is sparse and concentrates on management and conservation of rural livelihoods and wildlife [42-44].
2.2. Sampling Design
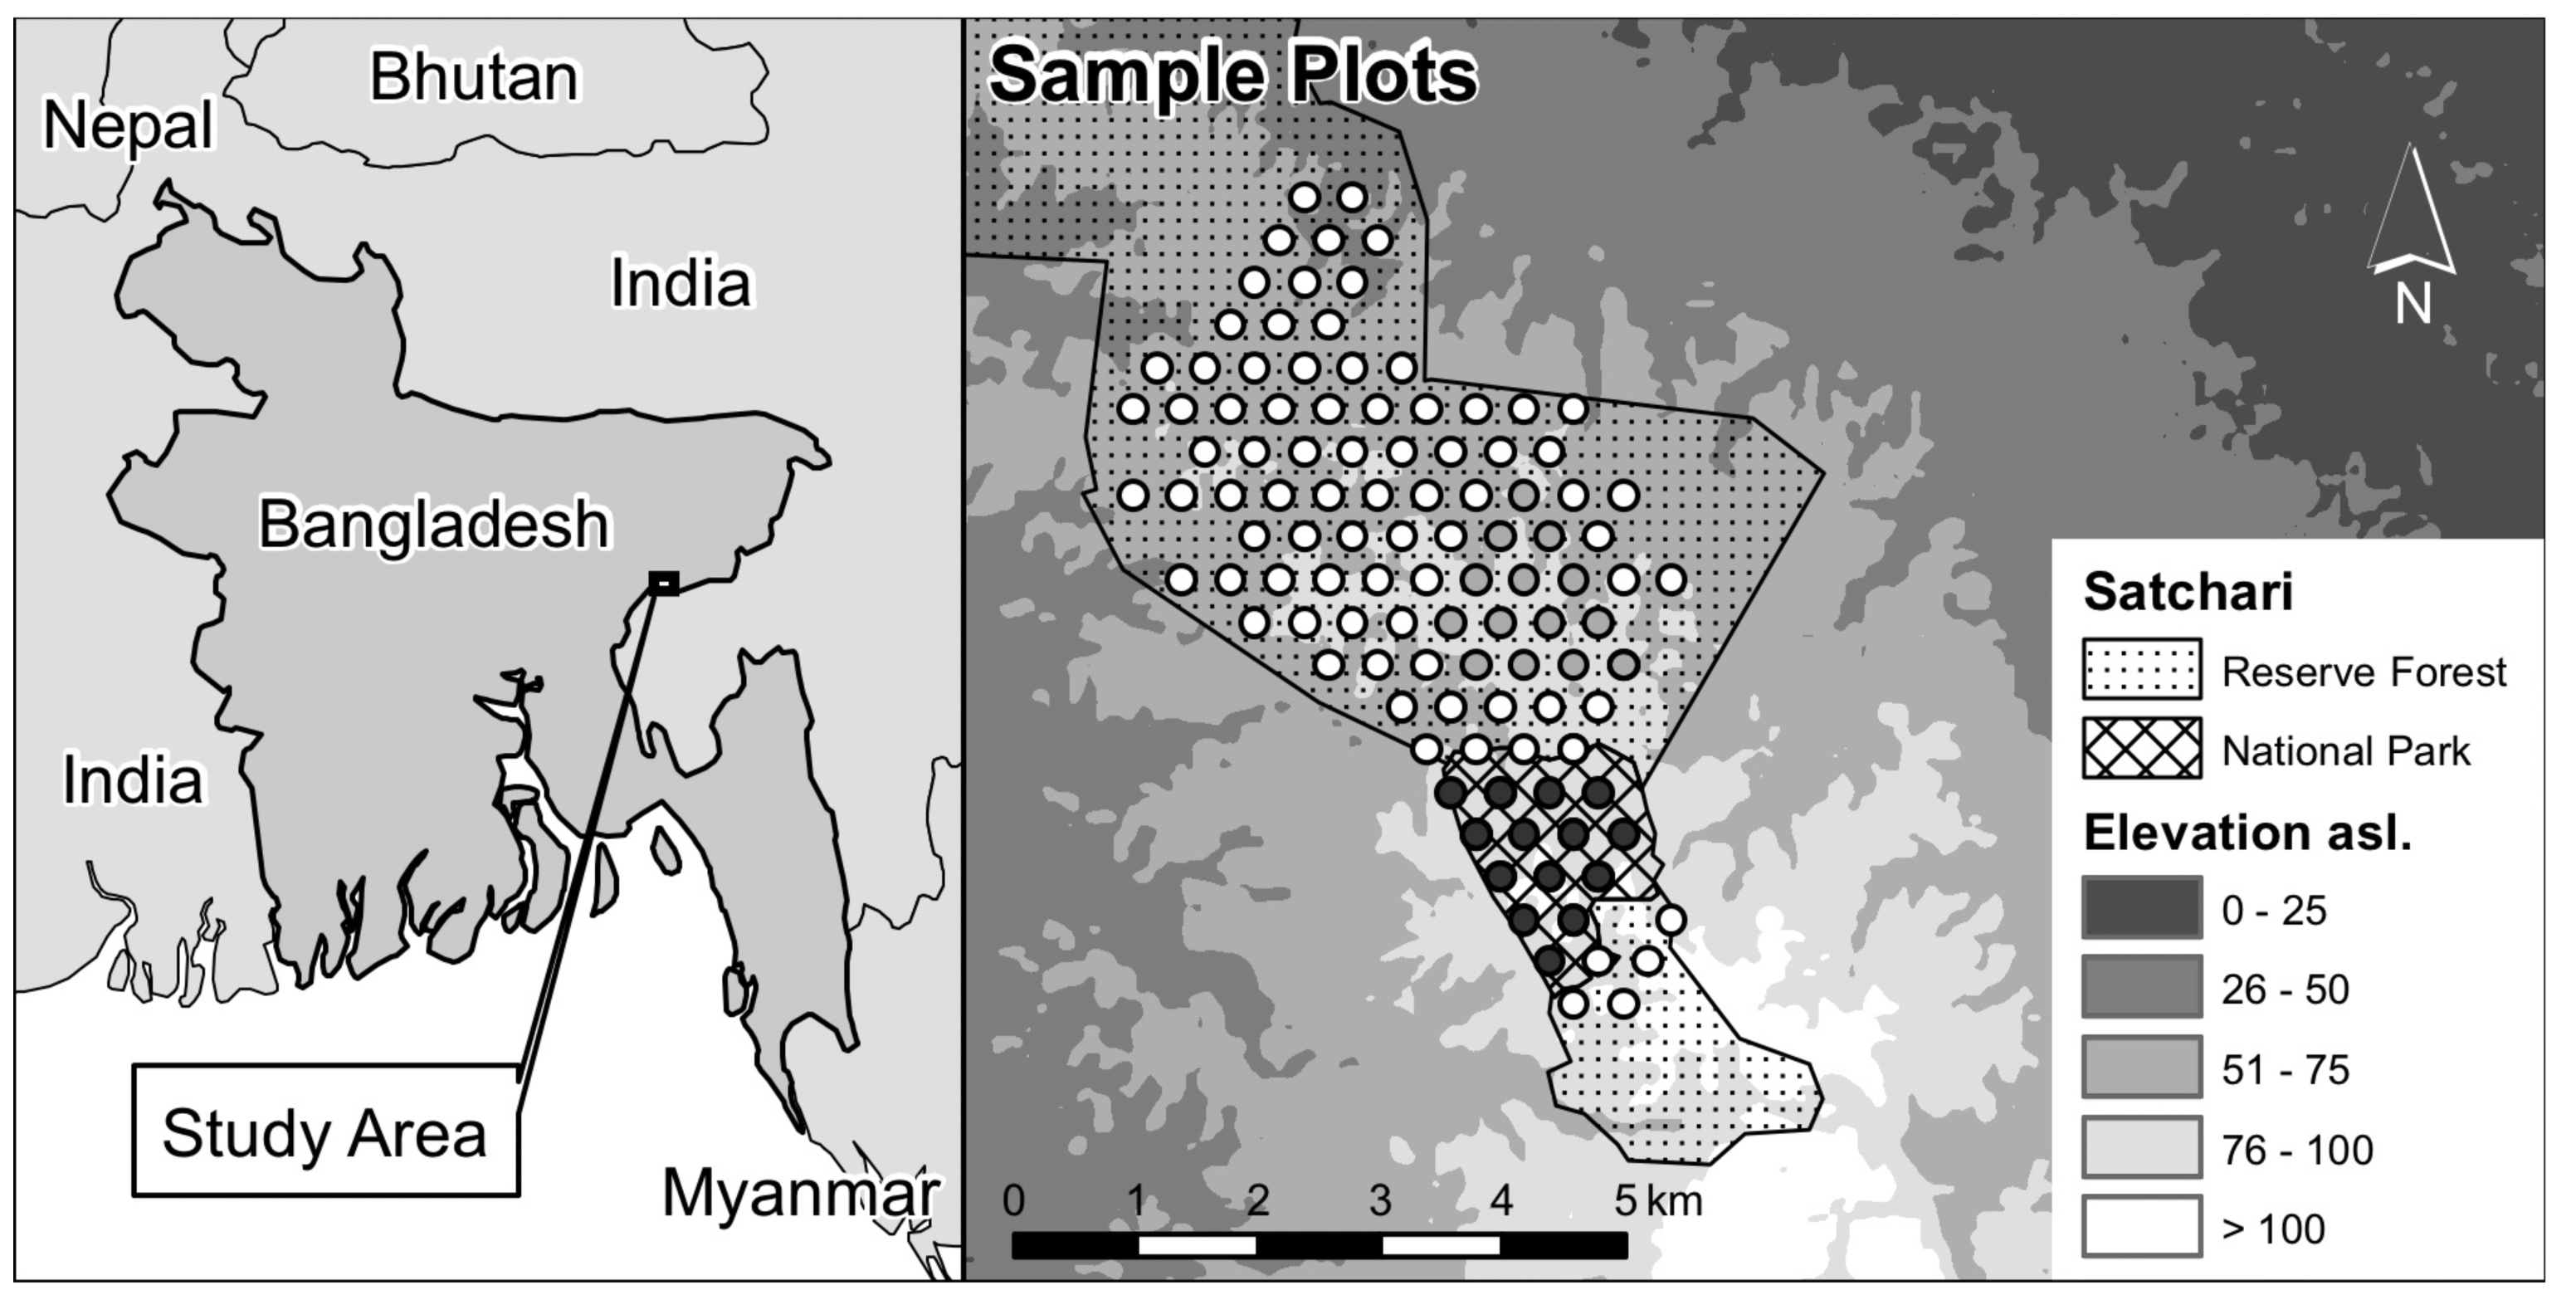
The study is based on an assessment of tree species characteristics and composition. A representative, unbiased and systematic sampling procedure was applied for the Satchari National Park (15 plots) and Satchari Reserve Forest (96 plots). An equidistant sampling grid (distance of 400 m) was implemented in those parts of the protected area that are actually forested (Figure 2).
For all tree individuals in the plots, we measured diameter at breast height (DBH) at 1.3 m height from the ground, which is recognized as a standard and most widely used reference diameter for expressing tree or stand characteristics associated to wood biomass [24]. In our investigation, a “tree” is regarded as a woody plant with a minimum DBH of 10 cm. DBH was recorded within each circular plot of 10 m radius. Basal area of each tree was calculated (basal area = pi × (DBH/2)2) and summed for each plot. For some species that could not be identified directly in the field, pressed samples were taken to the National Herbarium at National Botanical Garden, Dhaka University and Jahangirnagar University, for identification and confirmation. The nomenclature of families and genera follows the Encyclopedia of Flora and Fauna of Bangladesh [45]. The four botanical collections, which could not be identified to species or genus level, due to the lack of diagnostic features, were not included in our floristic analyses.
2.3. Data Analysis
Alpha (average plot-level species richness) and beta diversity (relation of gamma and alpha diversity) as well as gamma diversity (overall species richness) [9] were calculated for the National Park and the Reserve Forest. Species composition between the two differently protected areas was compared using function ANOSIM in R-package vegan version 1.17-0 [46]. For this and the four distance-decay analyses plots from the Reserve Forest were removed, as they did not contain trees. Floristic similarities in tree species composition were calculated for all possible pairs of plots using the Bray-Curtis Index that allows for consideration of quantitative information for single species. Hence, species frequency (number of tree individuals of a specific species) within the plots is incorporated in the calculated values for this index.
To compare spatial species turnover between the two differently protected areas, the distance-decay relation was assessed for two equal sized sub samples from Satchari National Park and Satchari Reserve Forest (Figure 2). We choose both a similar plot size and area under study, i.e., National Park and Reserve Forest as the distance-decay analyses are suspected to be sensitive to spatial grain and extent. The distance-decay relation was calculated by a linear regression (leased squared with R2 as the goodness-of-fit measure) on a pairwise comparison of geographical distance and similarity in species composition. Distance-decay relations are frequently calculated using log-transformed similarity values, log transformed distance values or both. Most studies dealing with plants use an untransformed relationship [22,47]. Untransformed relations have the advantage of clear interpretation and comparison but bear the problem that: (a) the fitted line has an intercept with the x-axis implying negative similarity values after a certain distance; and (b) that the fitted line has an intercept with the y-axis implying negative distances for specific similarity values.
In their seminal paper Nekola and White [16] tried all combinations (log- and untransformed) and selected the combination with best values for model residuals. Here we follow this procedure choosing our model based on: (a) the goodness of fit indicator r-squared; and (b) the visual model diagnostics. A significance test for a linear relation between distance matrices has to account for the problem of pseudoreplication. One possible solution is the use of permutation tests. Here, a Mantel-test with 10,000 permutations was performed (conservative two-tailed p-value: null hypothesis: r = 0) that is offered in the R-function mantel in package ecodist version 1.1.4 [48]. To test a potential influence of elevation, the Euclidean distance in elevation between the plots was related to similarity in species composition. In case of significance (again mantel test), the residuals of that relation were related to geographic distance. Thus a significant distance decay relation is tested after accounting for an influence of elevation. The statistical software used was R 2.10.0. [49].
Stand characteristics such as tree density, number of tree species, number of tree individuals and basal area (summed basal area of each tree in a plot) were compared between the areas of different protection status using t-Test. Two plots were excluded from the calculations of basal area (t-Tests) as they contained trees with extensive buttress roots, which rendered the assessment of comparable DBH impossible.
3. Results
Within the survey area, we recorded 2,032 tree individuals in 103 plots. 117 tree species were identified. Tectona grandis was the most abundant species, which was recorded with 196 individuals. It was followed by Artocarpus chaplasha (180 individuals), Acacia auriculiformis (169 individuals) and Eucalyptus camaldulensis (116).
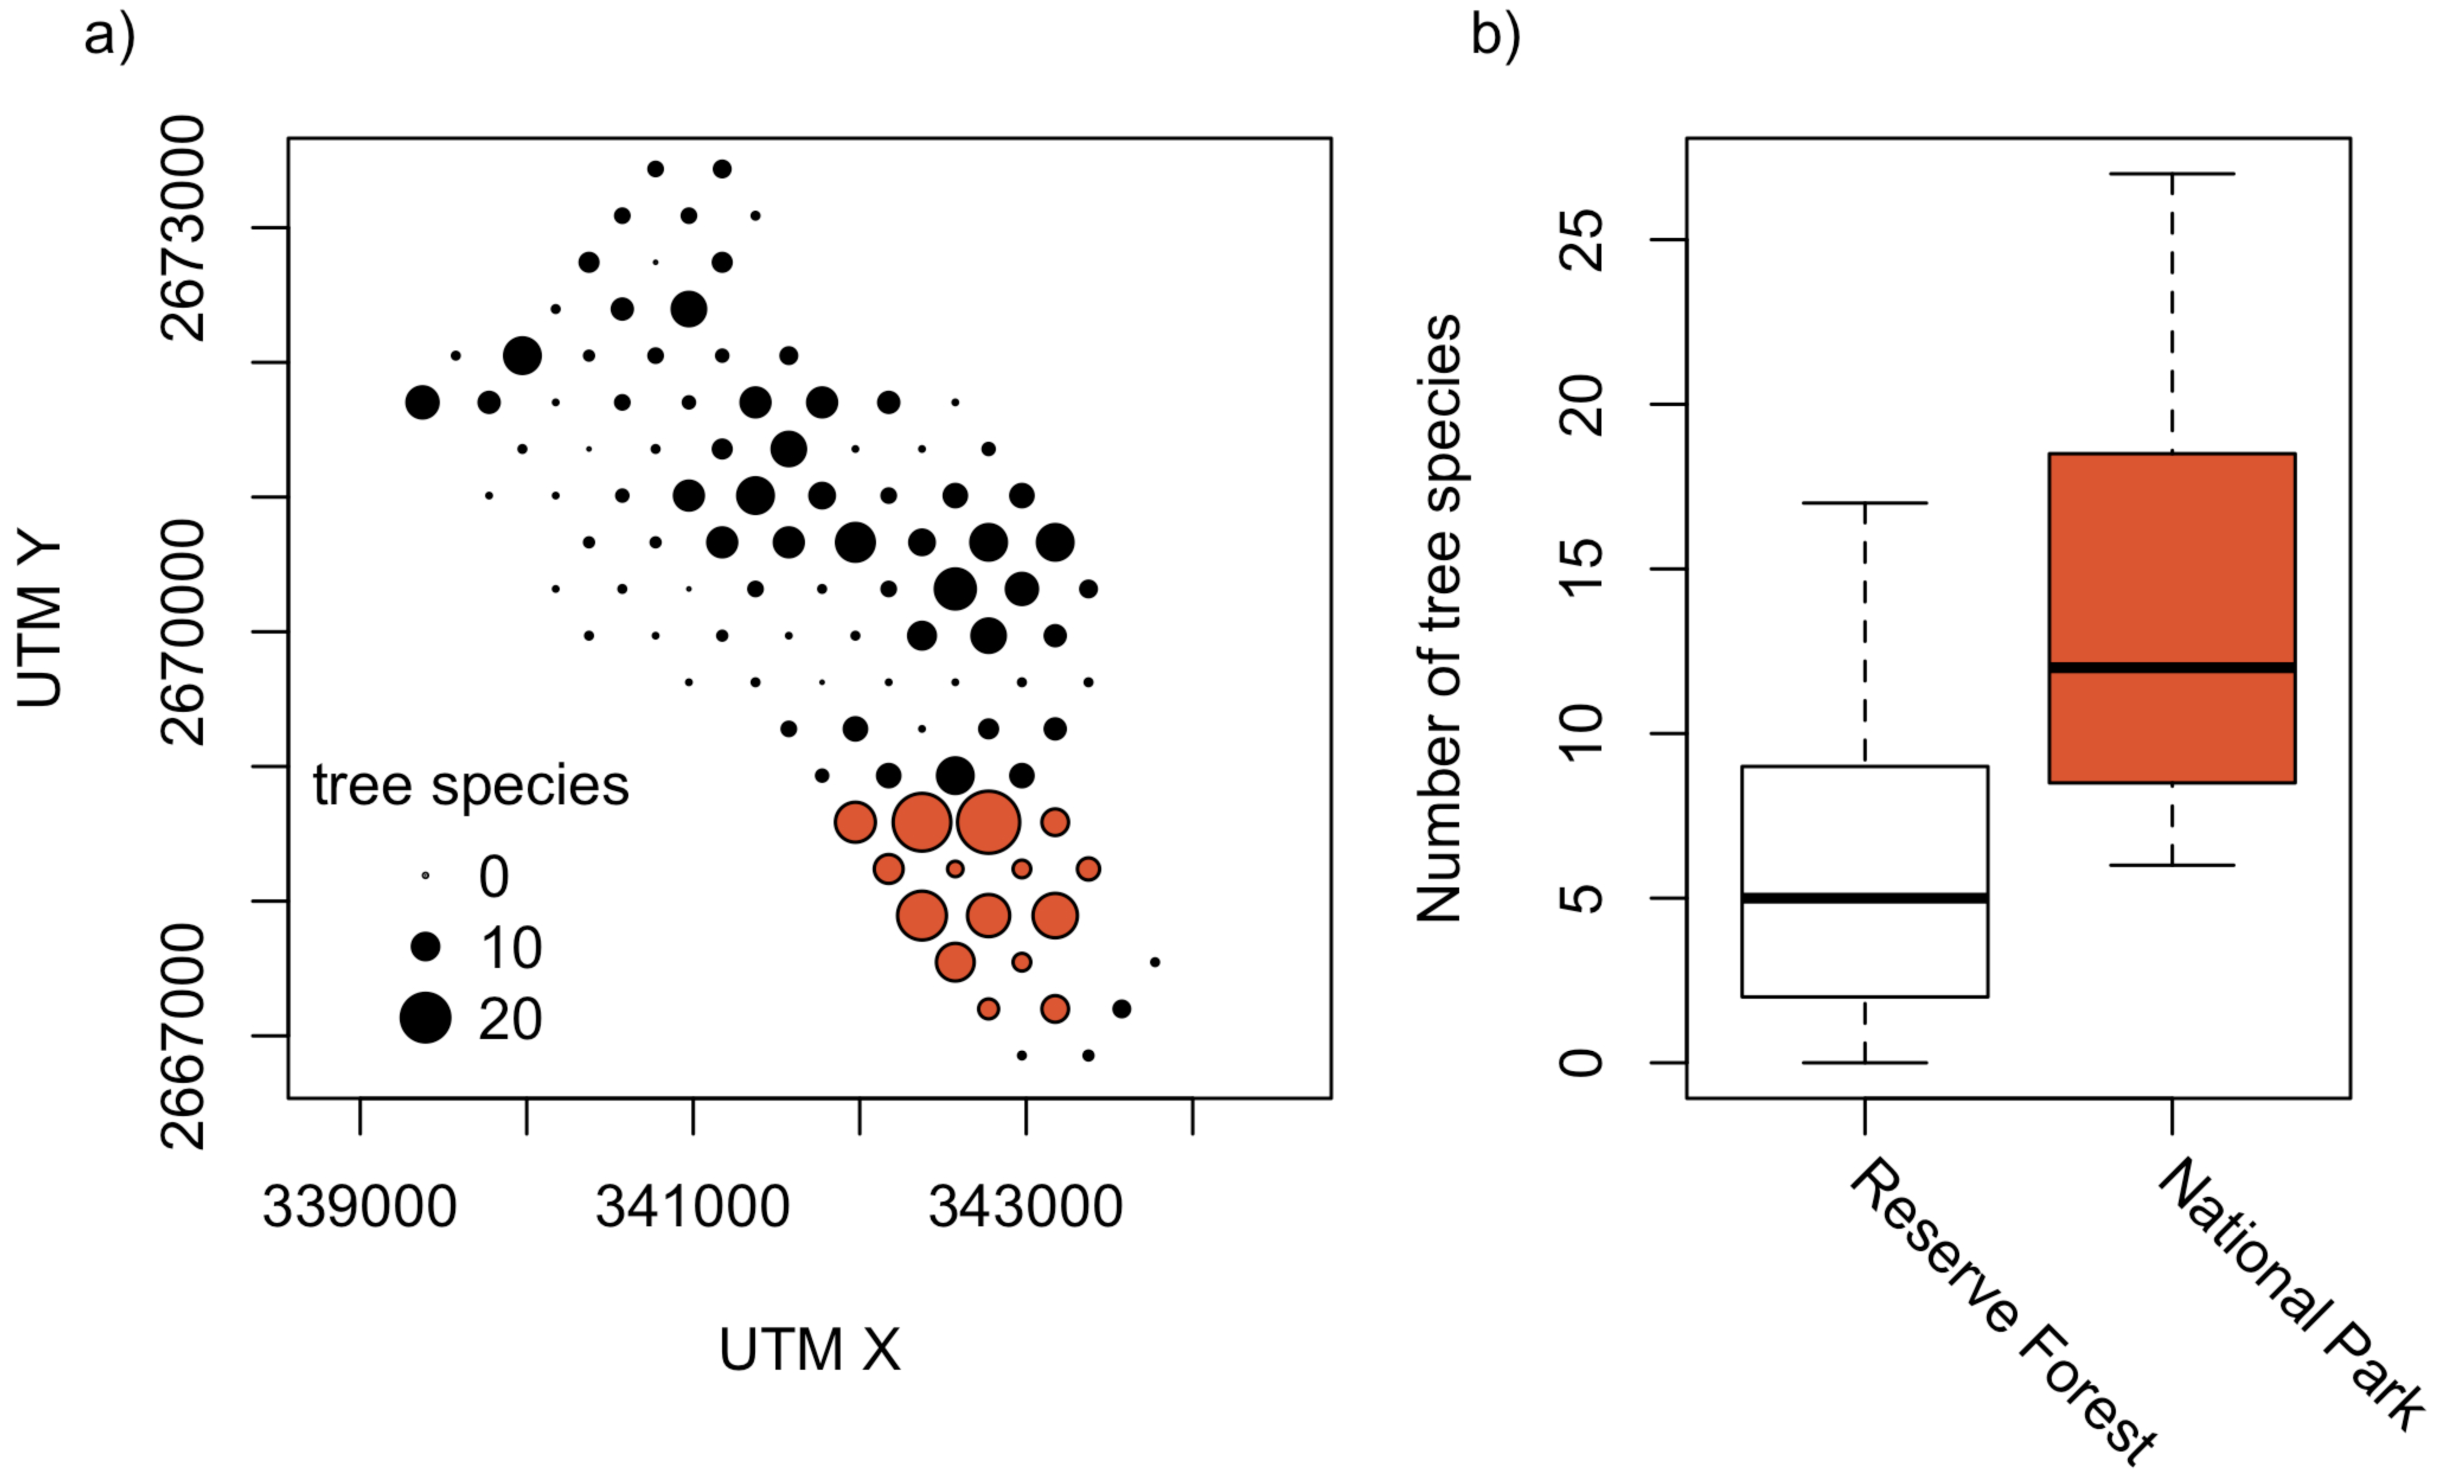
Despite its smaller area, Satchari National Park (strictly protected) had a higher Alpha (14.3) and Gamma diversity (89), but a lower Beta diversity (6.2) of tree species than Satchari Reserve Forest (Alpha: 6.0, Beta: 13.7, Gamma: 82) (Figure 3). Tree species composition was not significantly different between the two differently protected areas. In the mean, the comparisons of plots within the National Park performed Bray-Curtis similarity of 0.15, the Reserve Forest of 0.09, and a comparison between those units resulted in a similarity of 0.08.
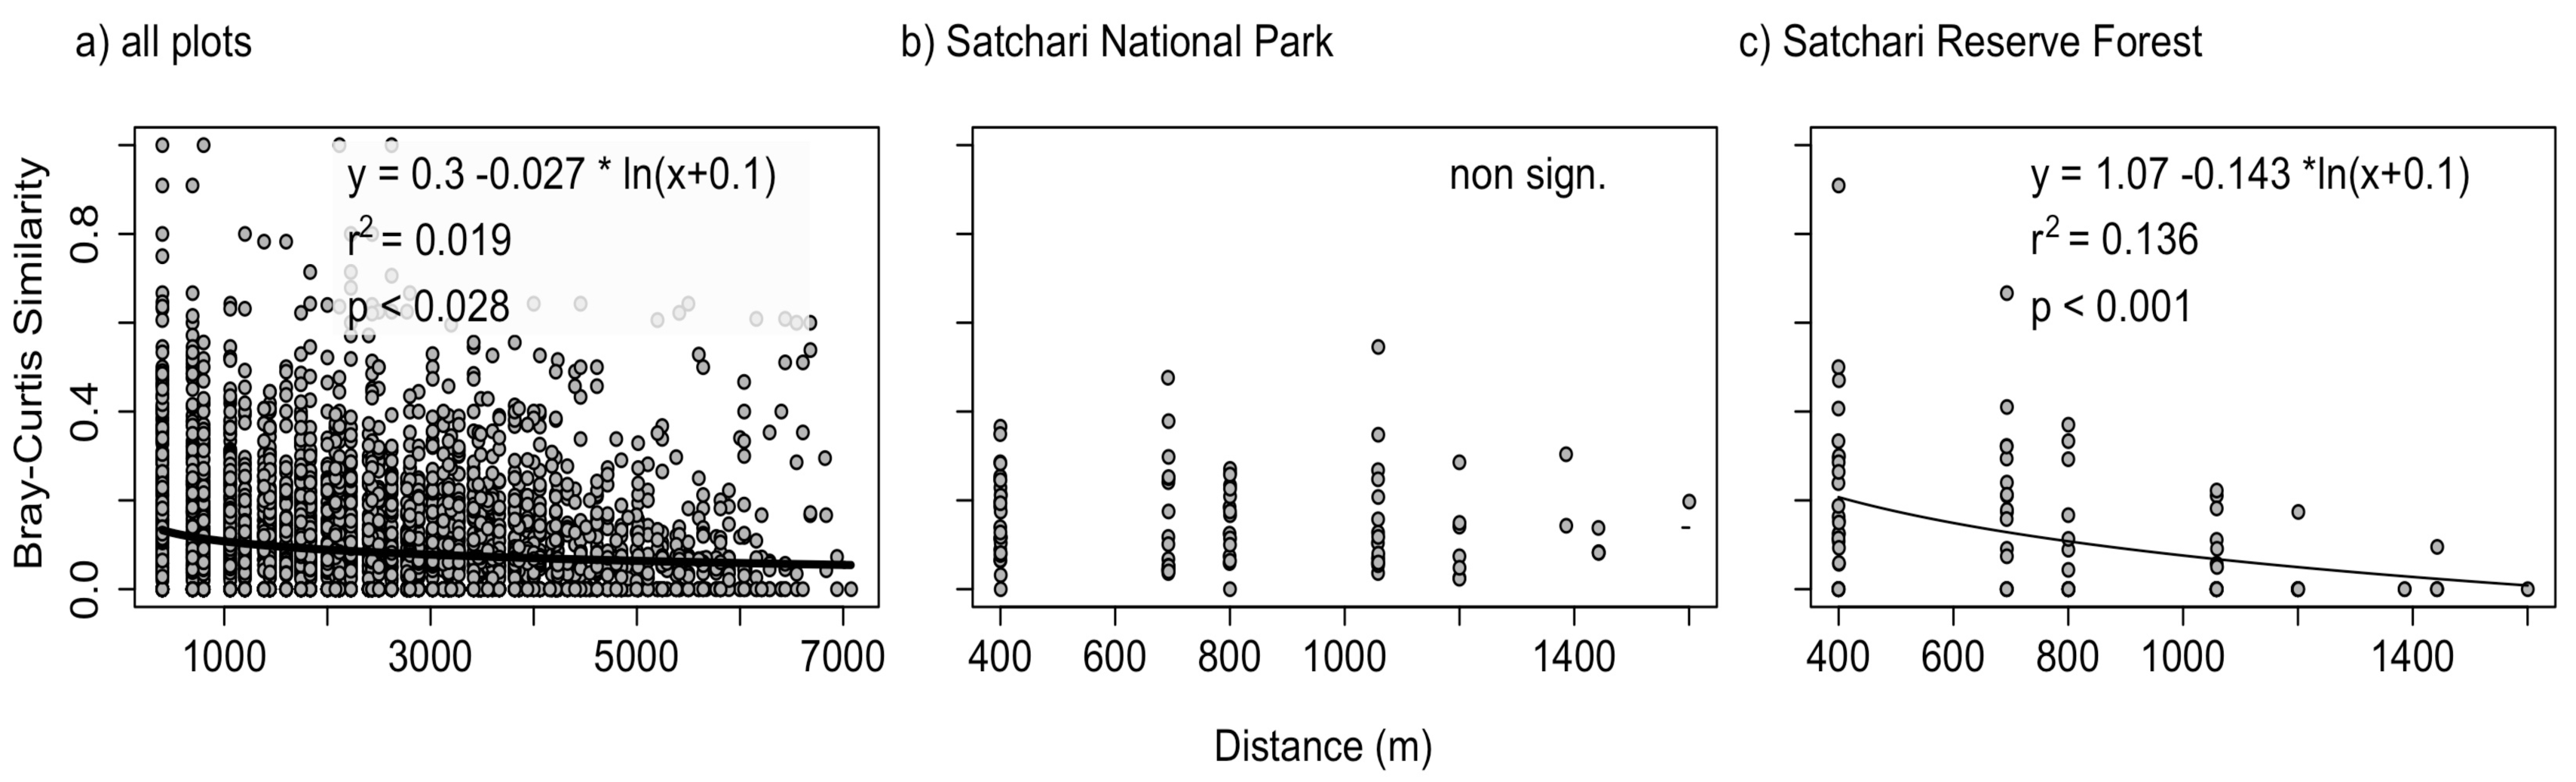
A relation with untransformed similarity values but ln (x + 0.1) transformed geographic distance provided best distance-decay models. For the overall study area a decline in tree species similarity with geographic distances was identified (adjusted R2: 0.02; p < 0.001; Figure 4(a)). This is also true for the subset of the Reserved Forest (adjusted R2: 0.14; p < 0.001; Figure 4(b)) while no significant trend was identified in the National Park (Figure 4(c)). Similarity in species composition was found to decline with difference in elevation in the whole study area (adjusted R2: 0.002; p < 0.05). After correcting for this effect the decline of similarity with geographic distance was still significant (adjusted R2: 0.013; p < 0.001). Neither in the National Park, nor in the Reserve Forest, was similarity in species composition related to distance in elevation.
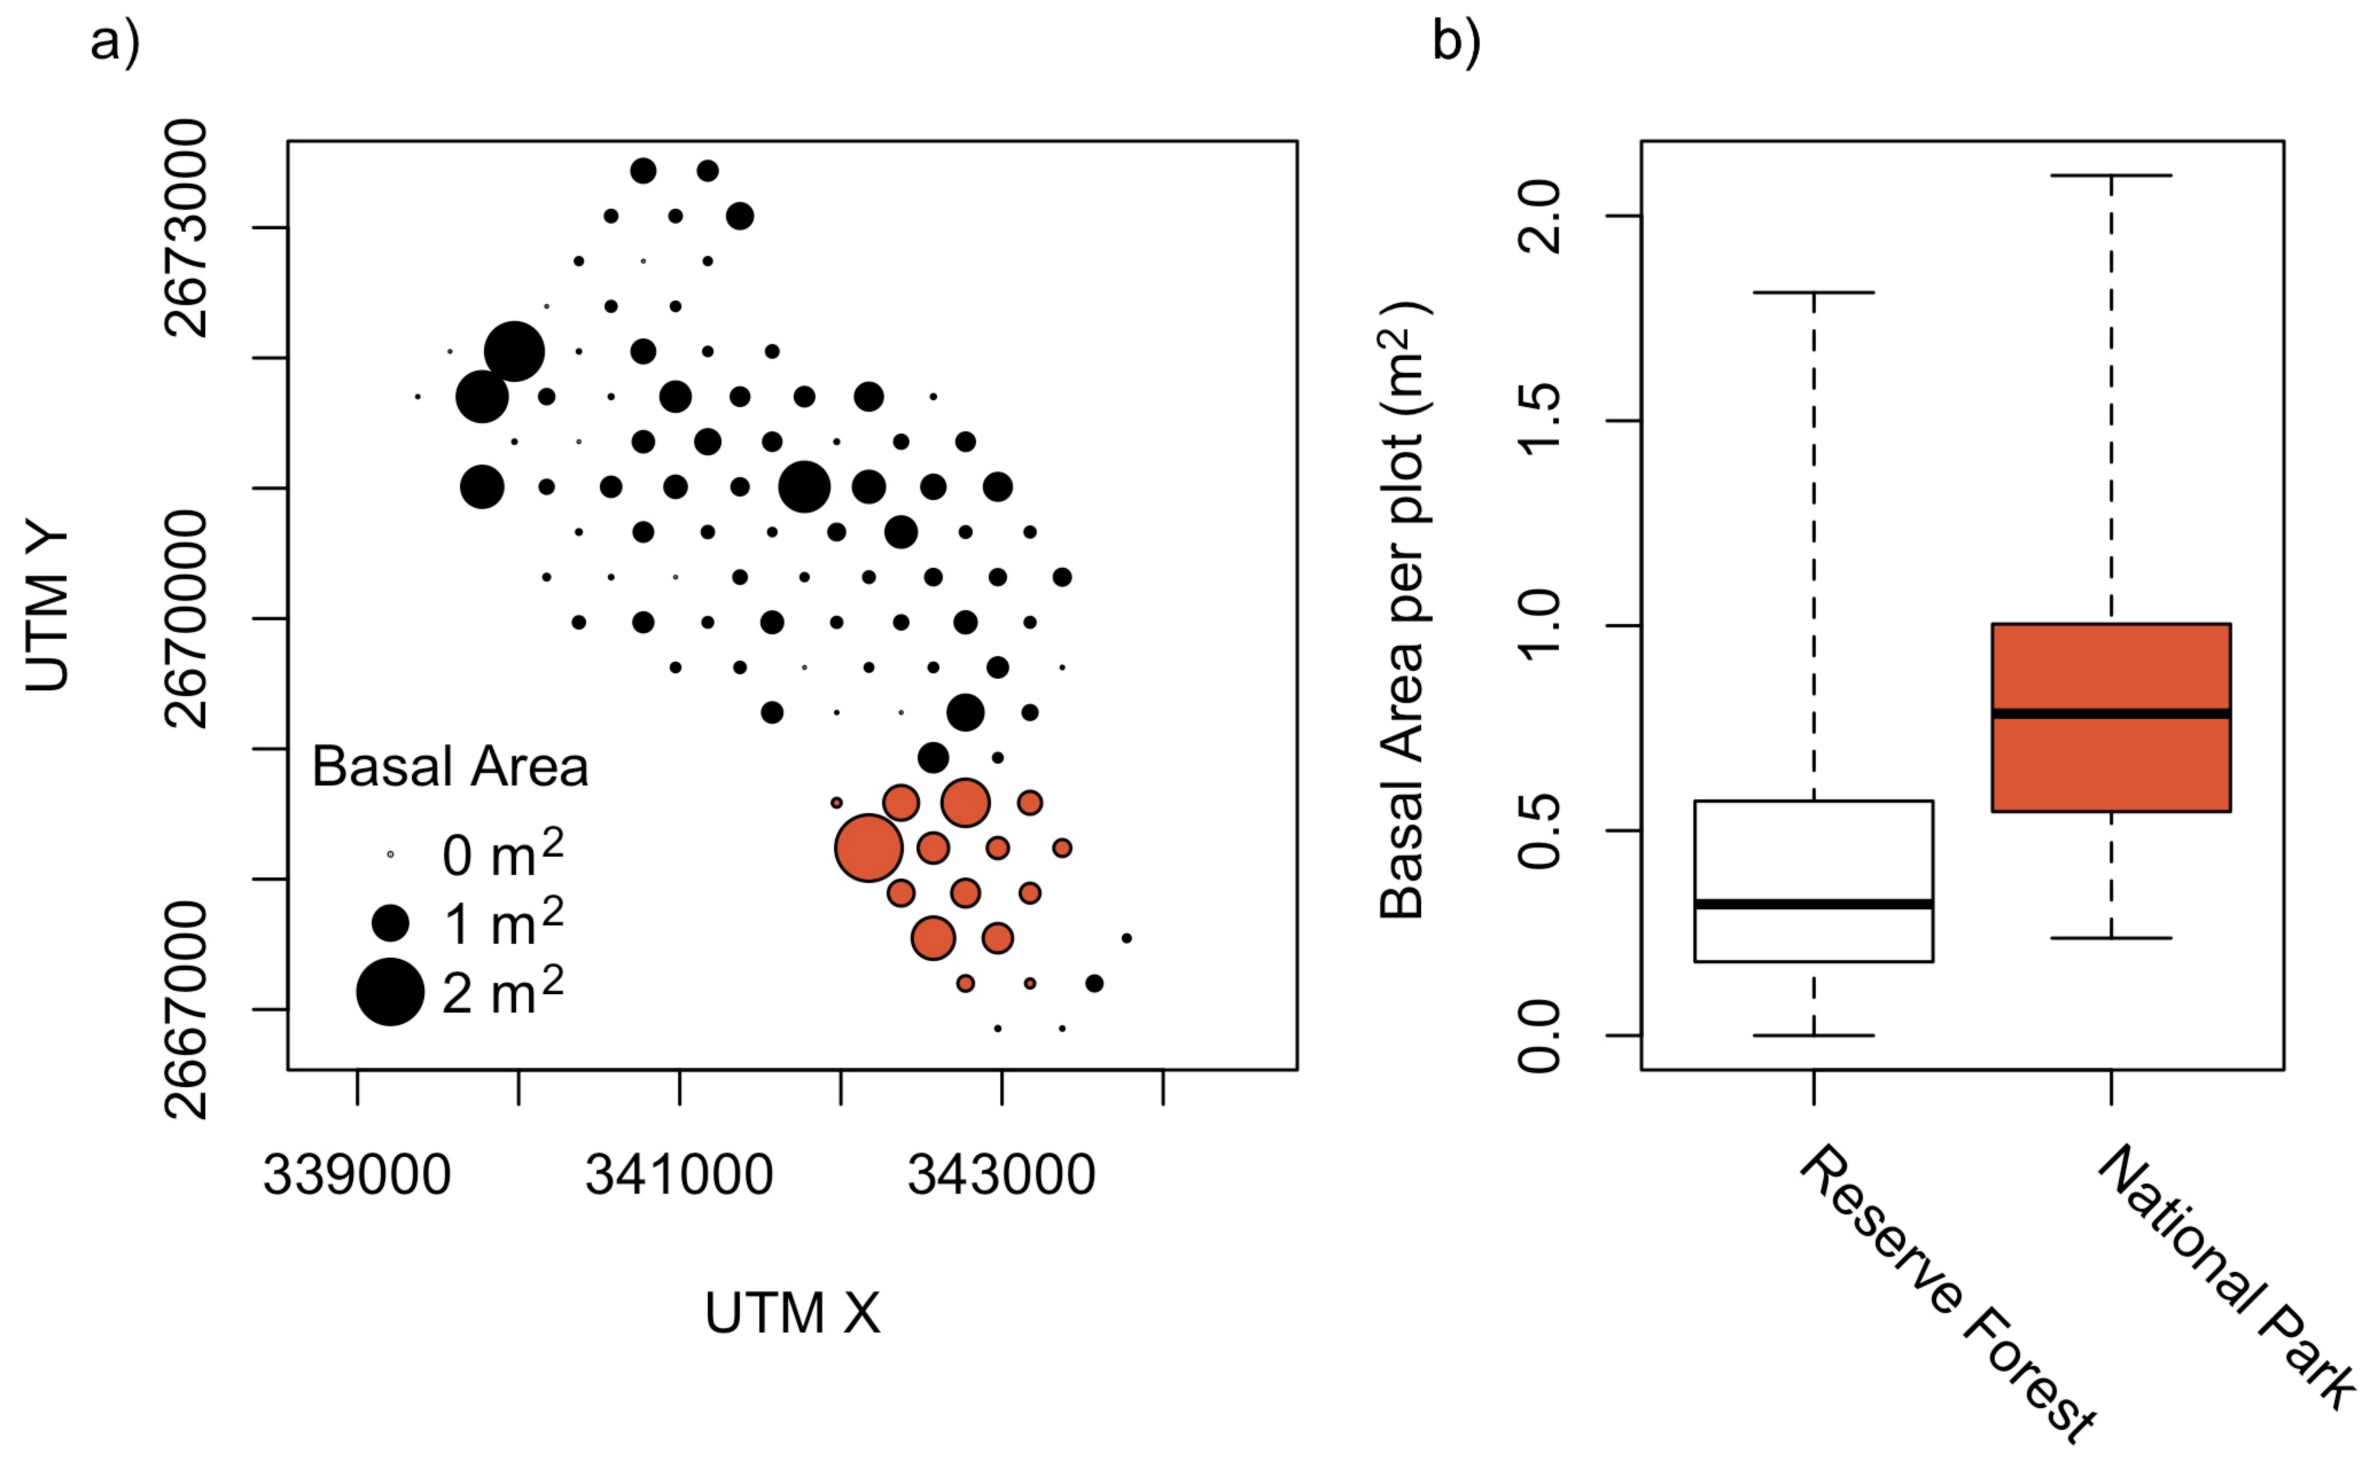
There is a significantly higher number of tree individuals (Mean in NP: 35, RF: 17, p < 0.001, t = −4.41, df = 19.3), tree species (NP: 14, RF: 6, p < 0.001, t = −4.57, df = 16.5; Figure 3) and also basal area is higher (NP: 0.9 m2, RF: 0.4 m2, p < 0.005, t = −3.26, df = 16.8; Figure 5) in the National Park than in the Reserve Forest. However, trees in the Reserved Forest are in the mean not significantly smaller (DBH) than those in the National Park.
4. Discussion
In this remnant forest area in Bangladesh, the identified species richness of trees is rather low in comparison to other tropical forests on the Indian Subcontinent [50]. However, the number of tree species in Satchari is still considerable given the land use pressure in Bangladesh induced by one of the highest population densities in the world. We could show that the strictly protected National Park has both a higher alpha and gamma diversity, despite being smaller than the less protected Reserve Forest. It cannot be said whether the higher species richness is caused by the more intense protection (that might have been in place before the establishment of the park) or if the park is designed in a way to protect the area with highest species richness. However, it seems that species richness actually measures what nature conservation wants to protect [1,2]. The higher values of tree basal area in the National Park indicate that human disturbances have been reduced already before its establishment. In contrast, human impact on the Reserve Forest could not be totally excluded during the last decades and is still subject to different (illegal) usage (such as fire wood extraction; Figure 1(a)). Here it is unlikely that individual trees of economic interest reach a larger size. These differences in land use might also be an explanation for the higher beta diversity in the Reserve Forest. The Reserve Forest exhibits a patchy mosaic of natural but also disturbed sites. Thus the species dependent on a natural environment as well as those adapted to a human induced disturbance regime may grow in the area. Among the plots, similarity in species composition is rather small in both the National Park as well as the Reserve Forest. This heterogeneity in communities may also be an explanation for the non significant differences in species composition between the two differently protected areas.
Surprisingly, we detected spatial trends of community similarity in this rather small area. Distance-decay effects were also reported for other tropical systems, but those commonly cover a larger area [18,25,51-53]. For studies with a rather small spatial extent, evidence is rare [54]. In the study area, the slope of the distance-decay relation was found to be comparable to other studies of equal scale in tropical ecosystems [54] and temperate ecosystems [55]. However, this evidence is not sufficient to support the explanation of general characteristics of ecosystem heterogeneity. Comparisons are restricted by differences in individual plot size and sampling density. Nevertheless, we hypothesize that studies that are based on a proper systematic sampling design might result in comparable findings for the spatial traits of beta diversity and species turnover [6].
The stronger decline of similarity with distance within the Reserve Forest compared to the National Park (where no significant trend was detected) was unexpected. The Reserve is protected by law but evidence for illegal exploitation was found during fieldwork. While on undisturbed sites, climax species have the option to become dominant, pioneer trees will preferentially grow on disturbed sites. This spatially fine-grained variation in disturbance regimes (e.g., firewood collection and illegal logging; Figure 5), which is missing in the National Park area, might explain the decline in species similarity with distance in the Reserve Forest.
In tropical forests distance-decay may be explained by both, environmental filtering and neutrality [18]. Recent studies have emphasized that these processes are supplementary rather than mutually exclusive. Combined effects on floristic composition were documented [22,25,51,56-58]. In our study, the environment can be regarded to be rather comparable in the whole study area. Elevation that varies between 30 and 105 m a.s.l., was found to be weekly related to community similarity. However, this could only partly explain the relation of similarity in species composition with distance. The relation between difference in elevation and community similarity is probably too weak to reach significance within the two data subsets. Other studies found that environmental conditions were stronger predictors for floristic similarity than geographical distances [54,59]. Furthermore, complex tropical ecosystems can hardly be completely understood by purely abiotic and geographic parameters. A large portion of the variation in species similarity in tropical forests remains unexplained [51].
Other factors, such as variation in plant functional groups and differences in niche width among taxa might also cause the distance-decay of similarity [16,56]. The seeds of many tree species in the tropics are dispersed by vertebrates such as birds or primates [60]. Directed dispersal can result in characteristic non-random population patterns. Especially for canopy trees, wind can also act as an important dispersal vector [61]. And finally, anthropogenic disturbances may blur distance-decay relations resulting from natural ecological processes. According to La Sorte et al. [22,63], anthropogenic activities are responsible for the strongest distance-decay in non-native European urban floras. Like other forest ecosystems in Bangladesh, the biodiversity in the study area is facing a noticeable threat from anthropogenic disturbances, mainly exploitation [63,64].
It remains simply impossible to measure or conserve diversity at all locations and levels of structural, taxonomic and functional organisation [3,65]. Efficient work is therefore dependent on decisions and prioritizations. The results of our study suggest in summary, that the high protection status of the National Park area is an efficient strategy to maintain tree species richness in the area.
Similarity in tree species composition tends to decay very slightly with increasing distance especially in the less protected forest area. This reflects that in the study area, spatial heterogeneity is strongly associated with anthropogenic pressure and disturbances.
In general, more studies on spatial pattern in biodiversity on a landscape scale are needed in Bangladesh. These are especially important as the fulfillment of targets of the Convention on Biological Diversity (e.g., stop loss of Biodiversity) has to be proven. Our analysis is the first to explicitly investigate spatial patterns of tropical tree species composition in forest ecosystems of Bangladesh. It also offers the option for future comparisons.


Acknowledgments
We thank Reinhold Stahlmann and the other members of the Department of Biogeography at the University of Bayreuth for constructive hints. This research was supported by a personal grant to Mohammad Belal Uddin from the German Academic Exchange Service (DAAD).
References
- Sarkar, S. Conservation area networks. Conserv. Soc. 2003, 1, 5–7. [Google Scholar]
- Sarkar, S. Biodiversity and Environmental Philosophy: An Introduction; Cambridge University Press: Cambridge, UK, 2005. [Google Scholar]
- Sarkar, S. Defining ‘biodiversity’: Assessing biodiversity. Monist 2002, 85, 131–155. [Google Scholar]
- Whittaker, R.H. Vegetation of the Siskiyou Mountains, Oregon and California. Ecol. Monogr. 1960, 30, 279–338. [Google Scholar]
- Whittaker, R.H. Evolution and measurement of species diversity. Taxon 1972, 21, 213–251. [Google Scholar]
- Jurasinski, G.; Retzer, V. Inventory, differentiation and proportional diversity—A consistent terminology for quantifying biodiversity. Oecologia 2009, 159, 15–26. [Google Scholar]
- Vellend, M. Do commonly used indices of beta-diversity measure species turnover? J. Veg. Sci. 2001, 12, 545–552. [Google Scholar]
- Ricotta, C. Additive partitioning of Rao's quadratic diversity: A hierarchical approach. Ecol. Model. 2005, 183, 365–371. [Google Scholar]
- Tuomisto, H. A diversity of beta diversities: Straightening up a concept gone awry. Part 1. Defining beta diversity as a function of alpha and gamma diversity. Ecography 2010, 33, 2–22. [Google Scholar]
- Tuomisto, H. A diversity of beta diversities: Straightening up a concept gone awry. Part 2. Quantifying beta diversity and related phenomena. Ecography 2010, 33, 23–45. [Google Scholar]
- Koleff, P.; Gaston, K.J.; Lennon, J.J. Measuring beta diversity for presence-absence data. J. Anim. Ecol. 2003, 72, 367–382. [Google Scholar]
- Magurran, A.E. Measuring Biological Diversity; Blackwell Science: Oxford, UK, 2004. [Google Scholar]
- Heegaard, E. Trends in aquatic macrophyte species turnover in Northern Ireland—Which factors determine the spatial distribution of local species turnover? Glob. Ecol. Biogeogr. 2004, 13, 397–408. [Google Scholar]
- Anderson, M.J.; Crist, T.O.; Chase, J.M.; Vellend, M.; Inouye, B.D.; Freestone, A.L.; Sanders, N.J.; Cornell, H.V.; Comita, L.S.; Davies, K.F.; et al. Navigating the multiple meanings of β diversity: A roadmap for the practicing ecologist. Ecol. Lett. 2011, 14, 19–28. [Google Scholar]
- Tobler, W.R. A computer movie simulating urban growth in the Detroit region. Econ. Geogr. 1970, 46, 234–240. [Google Scholar]
- Nekola, J.C.; White, P.S. The distance decay of similarity in biogeography and ecology. J. Biogeogr. 1999, 26, 867–878. [Google Scholar]
- Preston, F.W. The canonical distribution of commonness and rarity: Part II. Ecology 1962, 43, 410–432. [Google Scholar]
- Condit, R.; Pitman, N.; Lieigh, E.G.; Chave, J.; Terborgh, J.; Foster, R.B.; Nunez, P.; Aguilar, S.; Valencia, R.; Villa, G.; et al. Beta-diversity in tropical forest trees. Science 2002, 295, 666–669. [Google Scholar]
- Ferrier, S.; Manion, G.; Elith, J.; Richardson, K. Using generalized dissimilarit modelling to analyse and predict patterns of beta diversity in regional assessment. Divers. Distrib. 2007, 13, 252–264. [Google Scholar]
- Morlon, H.; Chuyong, G.; Condit, R.; Hubbell, S.; Kenfack, D.; Thomas, D.; Valencia, R.; Green, J.L. A general framework for the distance-decay of similarity in ecological communities. Ecol. Lett. 2008, 11, 904–917. [Google Scholar]
- Duque, A.; Phillips, J.F.; Hildebrand, P.; Posada, C.A.; Prieto, A.; Rudas, A.; Suescun, M.; Stevenson, P. Distance decay of tree species similarity in protected areas on Terra Firme forests in Colombian Amazonia. Biotropica 2009, 41, 599–607. [Google Scholar]
- La Sorte, F.A.; McKinney, M.L.; Pysek, P.; Klotz, S.; Rapson, G.L.; Clelesti-Grapow, L.; Thompson, K. Distance decay of similarity among European urban floras: The impact of anthropogenic activities on beta diversity. Glob. Ecol. Biogeogr. 2008, 17, 363–371. [Google Scholar]
- Soininen, J.; McDonald, R.; Hillebrand, H. The distance decay of similarity in ecological communities. Ecography 2007, 30, 3–12. [Google Scholar]
- Miller, T.F.; Mladenoff, D.J.; Clayton, M.K. Oldgrowth northern hardwood forests: Spatial autocorrelation and patterns of understory vegetation. Ecol. Monogr. 2002, 72, 487–503. [Google Scholar]
- Toumisto, H.; Ruokolainen, K.; Yli-Halla, M. Dispersal, environment, and floristic variation of western Amazonian forests. Science 2003, 299, 241–244. [Google Scholar]
- Harms, K.E.; Condit, R.; Hubbell, S.P.; Foster, R.B. Habitat associations of trees and shrubs in a 50-ha neotropical forest plot. J. Ecol. 2001, 89, 947–959. [Google Scholar]
- Selmi, S.; Boulinier, T.; Barbault, R. Richness and composition of Oasis bird communities: Spatial issues and species-area relationships. The Auk 2002, 119, 533–539. [Google Scholar]
- Moloney, K.A.; Levin, S.A.; Chiarello, N.E.; Buttel, L. Pattern and scale in a serpentine grassland. Theor. Popul. Biol. 1992, 41, 257–276. [Google Scholar]
- Lichstein, J.W.; Simons, T.R.; Shriner, S.A.; Franzreb, K.E. Spatial autocorrelation and autoregressive models in ecology. Ecol. Monogr. 2002, 72, 445–463. [Google Scholar]
- Oliva, M.E.; Gonzalez, M.T. The decay of similarity over geographical distance in parasite communities of marine fishes. J. Biogeogr. 2005, 32, 1327–1332. [Google Scholar]
- Wilkinson, C.D.; Edds, D.R. Spatial pattern and environmental correlates of a midwestern stream fish community: including spatial autocorrelation as a factor in community analysis. Am. Midl. Nat. 2001, 146, 271–289. [Google Scholar]
- Chave, J.; Leigh, E.G. A spatially explicit neutral model of beta-diversity in tropical forests. Theor. Popul. Biol. 2002, 62, 153–168. [Google Scholar]
- Hubbel, S.P. The Unified Neutral Theory of Biodiversity and Biogeography; Princeton University Press: Princeton, NJ, USA, 2001; p. 377. [Google Scholar]
- Prance, G.T.; Beentje, H.; Dransfield, J.; Johns, R. The tropical flora remains undercollected. Ann. Mo. Bot. Gard. 2000, 87, 67–71. [Google Scholar]
- Chhetri, D.B.K.; Fowler, G.W. Estimating diameter at breast height and basal diameter of trees from stump measurements in Nepal's lower temperate broad-leaved forests. For. Ecol. Manag. 1996, 81, 75–84. [Google Scholar]
- Köhl, M. Forest Inventory. In Tropical Forestry Handbook; Pancel, L., Ed.; Springer-Verlag: Heidelberg, Germany, 1993; Volume 1, pp. 243–332. [Google Scholar]
- Amin, M.N. Status of Plant Diversity in Bangladesh In: Pushpangandan. Proceeding of Biodiversity and Medicinal Plant Wealth of South Asian Countries; Pushpangandan, P., Nair, K.N., Ahmad, M.R., Eds.; National Botanical Research Institut: Lucknow-226001, India, 2004; pp. 1–10. [Google Scholar]
- Uddin, S.M.M.; Misbahuzzaman, K. Tree species diversity in Dulhazara Safari Park of Bangladesh. Malaysian App. Biol. 2007, 36, 33–40. [Google Scholar]
- Alam, M.S.; Masum, K.M. Status of homestead biodiversity in the offshore island of Bangladesh. Res. J. Agric. Biol. Sci. 2005, 1, 246–253. [Google Scholar]
- Kabir, M.E.; Webb, E.L. Floristics and structure of southwestern Bangladesh homegardens. Int. J. Biodivers. Sci. Manag. 2008, 4, 54–64. [Google Scholar]
- Kabir, M.E.; Webb, E.L. Can homegardens conserve biodiversity in Bangladesh? Biotropica 2008, 40, 95–103. [Google Scholar]
- Mollah, A.R.; Kundu, D.K.; Rahman, M.M. Site-Level Field Appraisal for Protected Area Co-Management: Satchari Reserve Forest; Nature Conservation Management (NACOM): Dhaka, Bangladesh, 2004; p. 102. [Google Scholar]
- Sultana, R. Linking fuelwood collection and community livelihoods in Satchari National Park. In Making Conservation Work: Linking Rural Livelihoods and Protected Area Management in Bangladesh; Fox, J., Bushley, B.R., Dutt, S., Quazi, S.A., Eds.; East-West Center: Honolulu, HI, USA, 2007; pp. 110–130. [Google Scholar]
- Uddin, M.B.; Mukul, S.A. Improving forest dependent livelihoods through NTFPs and home gardens: A case study from Satchari National Park. In Making Conservation Work: Linking Rural Livelihoods and Protected Area Management in Bangladesh; Fox, J., Bushley, B.R., Dutt, S., Quazi, S.A., Eds.; East-West Center: Honolulu, HI, USA, 2007; pp. 13–31. [Google Scholar]
- Ahmed, Z.U.; Begum, Z.N.T.; Hassan, M.A.; Khondker, M.; Kabir, S.M.H.; Ahmad, M.; Ahmed, A.T.A.; Rahman, A.K.A.; Haque, E.U. Encyclopedia of Flora and Fauna of Bangladesh; Asiatic Society of Bangladesh: Dhaka, Bangladesh, 2009; p. 230. [Google Scholar]
- Oksanen, J.; Kindt, R.; Legendre, P.; O'Hara, B.; Simpson, G.L.; Solymos, P.; Stevens, M.H.H.; Wagner, H. Vegan: Community Ecology Package; R package version: 1.15-4. R Project Institute for Statistics and Mathematics, WU Wirtschaftsuniversität Wien: Wien, Austria, 2010. Available onlin: http://CRAN.R-project.org/package=vegan (accessed on 15 August 2011).
- Steinbauer, M.J.; Beierkuhnlein, C. Characteristic pattern of species diversity on the Canary Islands. Erdkunde 2010, 64, 57–71. [Google Scholar]
- Goslee, S.C.; Urban, D.L. The ecodist package for dissimilarity-based analysis of ecological data. J. Stat. Softw. 2007, 22, 1–19. [Google Scholar]
- R Development Core Team. R: A Language and Environment for Statistical Computing; R Foundation for Statistical Computing: Vienna, Austria, 2009. [Google Scholar]
- Mishra, B.P.; Tripathi, O.P.; Tripathi, R.S.; Pandey, H.N. Effects of anthropogenic disturbance on plant diversity and community structure of a sacred grove in Meghalaya, northeast India. Biodiv. Conserv. 2004, 13, 421–436. [Google Scholar]
- Duivenvoorden, J.F.; Svenning, J.C.; Wright, S.J. Beta diversity in tropical forests. Science 2002, 295, 636–637. [Google Scholar]
- Ruokolainen, K.; Tuomisto, H. Beta diversity in tropical forests-Response. Science 2002, 297, 1439. [Google Scholar]
- Duque, A.; Sánchez, M.; Cavelier, J.; Duivenvoorden, J.F. Different floristic patterns of woody understorey and canopy plants in Colombian Amazonia. J. Trop. Ecol. 2002, 18, 499–525. [Google Scholar]
- Jones, M.M.; Tuomisto, H.; Clark, D.B.; Olivas, P. Effects of mesoscale environmental heterogeneity and dispersal limitation on floristic variation in rain forest ferns. J. Ecol. 2006, 94, 181–195. [Google Scholar]
- Girdler, E.B.; Barrie, B.T.C. The scale-dependent importance of habitat factors and dispersal limitation in structuring Great Lakes shoreline plant communities. Plant Ecol. 2008, 198, 211–223. [Google Scholar]
- Tuomisto, H.; Ruokolainen, K.; Aguilar, M.; Sarmiento, A. Floristic patterns along a 43 km long transect in an Amazonian rain forest. J. Ecol. 2003, 91, 743–756. [Google Scholar]
- Valencia, R.; Foster, R.B.; Villa, G.; Condit, R.; Svennings, J.-C.; Hernandez, C.; Romoleroux, K.; Losos, E.; Magard, E.; Balsev, H. Tree species distributions and local habitat variation in the Amazon: Large forest plots in eastern Ecuador. J. Ecol. 2004, 92, 214–229. [Google Scholar]
- Vormisto, J.; Svenning, J.C.; Hall, P.; Balslev, B. Diversity and dominance in palm (Arecaceae) communities in terra firme forests in the western Amazon basin. J. Ecol. 2004, 92, 577–588. [Google Scholar]
- Gilbert, B.; Lechowicz, M.J. Neutrality, niches, and dispersal in a temperate forest understory. P. Natl. Acad. Sci. USA 2004, 101, 7651–7656. [Google Scholar]
- Stevenson, P.R. Seed dispersal by woolly monkeys (Lagothrix lagothricha) at Tinigua National Park, Colombia: Dispersal distance, germination rates, and dispersal quantity. Am. J. Primatol. 2000, 50, 275–289. [Google Scholar]
- Augspurger, C. Morphology and dispersal potential of wind-dispersed diaspores of neotropical trees. Am. J. Bot. 1986, 73, 353–363. [Google Scholar]
- La Sorte, F.A.; McKinney, M.L.; Pysek, P. Compositional similarity among urban floras within and across continents: Biogeographical consequences of human mediated biotic interchange. Glob. Change Biol. 2007, 13, 913–921. [Google Scholar]
- Islam, K.R.; Ahmed, M.R.; Bhuiyan, M.K.; Badruddin, A. Deforestation effects on vegetative regeneration and soil quality in tropical semi-evergreen degraded and protected forests of Bangladesh. Land Degrad. Dev. 2001, 12, 45–56. [Google Scholar]
- Peres, C.A.; Barlow, J.; Laurance, W.F. Detecting anthropogenic disturbance in tropical forests. Trends Ecol. Evol. 2006, 21, 227–229. [Google Scholar]
- Sarkar, S. Ecological diversity and biodiversity as concepts for conservation planning: Comments on Ricotta. Acta Biotheor. 2006, 54, 133–140. [Google Scholar]
© 2011 by the authors; licensee MDPI, Basel, Switzerland. This article is an open access article distributed under the terms and conditions of the Creative Commons Attribution license (http://creativecommons.org/licenses/by/3.0/).
Share and Cite
Uddin, M.B.; Steinbauer, M.J.; Beierkuhnlein, C. Diversity, Stand Characteristics and Spatial Aggregation of Tree Species in a Bangladesh Forest Ecosystem. Diversity 2011, 3, 453-465. https://doi.org/10.3390/d3030453
Uddin MB, Steinbauer MJ, Beierkuhnlein C. Diversity, Stand Characteristics and Spatial Aggregation of Tree Species in a Bangladesh Forest Ecosystem. Diversity. 2011; 3(3):453-465. https://doi.org/10.3390/d3030453
Chicago/Turabian StyleUddin, Mohammad B., Manuel J. Steinbauer, and Carl Beierkuhnlein. 2011. "Diversity, Stand Characteristics and Spatial Aggregation of Tree Species in a Bangladesh Forest Ecosystem" Diversity 3, no. 3: 453-465. https://doi.org/10.3390/d3030453