1. Introduction
Patterns of species co-occurrence have been a major issue within the framework of community assembly studies [
1,
2,
3], and are usually investigated using null model approaches [
4,
5,
6,
7,
8,
9]. A crucial question is whether in a given community there are species combinations (usually, but not necessarily, pairs) that exhibit significant associations, either positive or negative. Negative associations are often attributed to interspecific competition, but other processes too may lead to similar patterns [
10,
11]. The term ‘associations’ in this discussion often refers to non-trivial patterns exhibited by species occurrences in species-per-sites matrices, either with presence-absence data or with abundances. It is assumed that direct or indirect interactions among species, such as competition, symbiotic relationships, habitat sharing, shared palaeogeography
etc, should leave their trace in such matrices in the form of excessive positive or negative ‘associations’, that is, patterns of species occurrences’ arrangements. Positive associations are cases where species pairs (or larger sets) occur in the same sites more often than expected by chance, and sometimes are called ‘aggregations’ or simply ‘co-occurrences’. Negative associations are cases where species tend to avoid one-another, in the sense that they occur at the same sites less often than expected by chance. Such associations have been called ‘segregations’ or ‘mutual exclusions’. Both kinds of associations are collectively referred to as ‘deviating’, in the sense that they do not conform to random expectations.
The question of deviating patterns can be projected to the community as a whole, and addressed using one of the several indices developed for this purpose (see [
8]). These are often referred to as ‘matrix-wide’ or ‘ensemble’ indices. A different approach, examining associations between each and every species-pair in a given matrix, has been proposed by Sanderson [
12,
13], who described a metric that identifies species pairs that co-occur more (or less) frequently than expected by chance. This has been called the ‘natural’ metric and has been also applied by Sfenthourakis
et al. [
10,
14] and Sanderson
et al. [
15]. Another such ‘pairwise’ approach has been followed recently by Gotelli and Ulrich [
9] and Collins
et al. [
16]. These authors used a metric that identifies cases where a species of a pair is not present at a site when the other member of the pair is, and
vice versa, for a given pair of sites. Such a pattern has been called a ‘checkerboard unit’, and the metric counts all such units for all pairs of species and sites in the matrix. There is no consensus among researchers as to which approach can better detect actual patterns, but there is a recent trend towards explorations at the species-pairs level. Results from application of a matrix-wide approach may differ substantially from those of a pairwise approach [
9], a difference that has not been explored in detail. Supporters of matrix-wide approaches suggest that when focusing on species pairs, patterns produced by interactions among larger sets of species cannot be seen. One such case of widespread interactions is what has been termed ‘diffuse competition’, which is supposedly revealed by matrix-wide approaches. The existence and effect of such a process is a very interesting hypothesis, but no robust and effective method for its documentation has been developed so far. We have to note here that the most commonly used matrix-wide metric, the C-score, is just a standardization of ‘checkerboard units’ among all species pairs, so it cannot serve for the identification of diffuse competition.
Pairwise approaches are not devoid of problems, though. As Zaman and Simberloff [
17] have argued, individual species pairs in such analyses are not independent, something that perplexes estimation of significance levels and, therefore, the detection of actual deviations from randomness. In order to amend this problem, Gotelli and Ulrich [
9] applied four methods for assessing statistical significance of associations between species pairs, suggesting two versions of the, so-called, ‘empirical Bayes approach’ and Bonferroni corrections. These methods, however, exhibit a high frequency of type II errors, often failing to identify known deviations from random co-occurrence patterns, as can be seen in the results of this same study [
9]. In any case, the effects of such corrections are not substantial, as can also be seen in these same results, where deviations found after the application of the corrections differed only to a small extent from those obtained without the corrections.
Another important complicating factor in such analyses, as shown by Sanderson
et al. [
15], is that the expected distribution of species pairs’ co-occurrences is utterly unknowable. This means that it is not possible to use sample statistics for evaluating significance. This is the very reason why it is necessary to use ‘null model’ approaches where the distribution of species co-occurrences is simulated through the use of a large number of randomized (‘null’) matrices based on the original, observed matrix, under certain algorithmic criteria. Significant deviations from randomness, then, are detected when the value of the metric in the observed matrix falls below the lower 5% or above the upper 95% of the simulated distribution (of course, one can choose another cut-off threshold). Values below the lower 5% imply excessive negative associations, while values above the upper 95% imply excessive positive associations. Given also the large number of possible species pairs even in a matrix of modest size, we can assume that some 5% of these pairs may exhibit such deviating patterns by chance alone, so one can speak of really significant associations only when more than 5% of all the species pairs in a matrix have found to be deviating from randomness. This is also a rough security threshold against the effects of non-independence of species pairs.
Besides metrics and models, though, the biologically important question remains whether we can detect evidence for exceptional co-occurrence or mutual exclusion among species in species by sites matrices. Diamond and Gilpin [
1,
18,
19] suggested the restriction of analyses into species guilds. In addition, a widespread idea is that closely related species should co-occur less often than expected by chance, since they are expected to exploit the same or largely overlapping sets of resources [
16]. Can we detect the signal of such phenomena in presence-absence matrices? Using the ‘natural’ metric, Sanderson
et al. [
15] found significant negative trends among congeneric species of birds in two large Pacific archipelagos. One of these sets, the birds of Bismarck archipelago, had played a crucial role in the development of community assembly theory, since Diamond’s famous ‘assembly rules’ [
1] had been based on patterns found therein. Nevertheless, Sfenthourakis
et al. [
10], using the same metric, found no evidence for either positive or negative associations between congeneric species in most of the 30 matrices analyzed, a data set that covered a wide range of taxa and archipelagos. In addition, Gotelli and Ulrich [
9], exploring a set of some 272 published matrices with a modification of the ‘checkerboard units’ (CU) metric, namely the CS that is the CU normalized by the product of each species’ occurrences, could not find evidence of significant associations between species pairs in most of the matrices. Here we attempt a further exploration of co-occurrence patterns using a data set of 269 matrices which partially overlaps with that of Gotelli and Ulrich [
9] (149 common matrices), but contains also 117 matrices not tested before for species co-occurrences, as well as the three matrices used by Sanderson and his colleagues in previous works [
12,
15]. We do not restrict our analysis to congeneric species or guilds, since we first want to check for patterns involving all species in each matrix in order to compare with previous analyses [
9,
15]. Furthermore, the size and range of the data set used herein does not permit identification of guilds or a ‘taxonomic sieving’ (
sensu Sanderson
et al. [
15]), so a focus on congeneric species will be the subject of a future study on a smaller number of matrices, selected after an evaluation of present results. Possible drawbacks due to non-independence of species pairs will be discussed where relevant.
We apply both pairwise approaches proposed so far, namely the ‘natural’ and the CS metrics, in order to compare their performance. We also report results from the matrix-wide C-score metric for comparative purposes.
Although the ‘natural’ metric has been used in a number of studies, it has not been properly tested regarding its proneness to Type I (false detection of statistically significant patterns in random matrices) and Type II (failure to detect statistically significant patterns in structured matrices) errors. Gotelli and Urlich [
9] have applied such tests on CS. Nevertheless, despite some expected correlation between the two metrics, these are related through a quadratic function, so there is no
a priori reason for the two metrics to provide the same results. So, we also perform some benchmark tests of the ‘natural’ metric using artificial data sets with desired properties.
2. Results and Discussion
Detailed results of all analyses can be found in
Supplementary Material (Appendices S1–S4). We present therein the size and fill of each matrix, the numbers of possible species pairs, the observed total numbers of deviating species pairs according to both metrics, as well as the expected and observed matrix-wide C-score. We provide these data for 149 published and independent matrices (Appendix S1 in
Supplementary Material) from the set of Atmar and Patterson [
20], for 120 additional published presence-absence matrices (Appendix S2 in
Supplementary Material), 100 random matrices constructed with the same probability of each species’ occurrence in each column (site) (Random 1, Appendix S3 in
Supplementary Material), and for 100 random matrices constructed with a different probability of each species’ occurrence in each column (Random 2, Appendix S4 in
Supplementary Material). We also report the number of deviating species pairs that were identified by one metric but not by the other, thus giving an estimate of the congruence between the two metrics.
Table 1 summarizes results from artificial and published matrices.
2.1. Artificial Matrices
In the case of matrices with equal-probability of occupancy per site (Random 1), both metrics found a larger number of deviating species pairs than the 5% of all possible segregated and aggregated pairs (in either tail), in just two out of 100 ‘random’ matrices (
Table 1). The percentage of deviating pairs per matrix (ratio of deviating to total pairs in each matrix) was positively correlated with number of sites (Kendall’s τ
natural = 0.244, τ
cs = 0.242, P < 0.001) and negatively with number of species (τ
natural = −0.142, τ
cs = −0.140, P < 0.05), with no effect of matrix size or fill. However, there is a significant quadratic relationship between matrix fill and the percentage of deviating pairs per matrix (for the ‘natural’ metric: R
2 = 0.346, F
(2, 97) = 27.13, P < 0.001, Y = −22.437X
2 − 0.110X + 22.803; for CS: R
2 = 0.355, F
(2, 97) = 28.27, P < 0.0001, Y = −23.074X
2 − 0.190X + 23.401). Matrix-wide C-score identified a co-occurrence pattern in just four matrices. It should be noted here that around 5% of the matrices are expected to show some deviation due to chance alone. This means that the extent of deviations in either direction is not significant.
Table 1.
Results of co-occurrence analysis of 100 random matrices, 149 from the set of Atmar and Patterson [
20] and 120 additional published matrices, using the ‘natural’ and the CS metrics. Under Random 1 we give numbers of matrices, constructed with the same probability of each species’ occurrences in each site, that show a significant co-occurrence pattern, whereas under Random 2 we give numbers of matrices, where the probability of occurrence of each species in each site was randomly selected, that show a significant co-occurrence pattern.
Table 1.
Results of co-occurrence analysis of 100 random matrices, 149 from the set of Atmar and Patterson [20] and 120 additional published matrices, using the ‘natural’ and the CS metrics. Under Random 1 we give numbers of matrices, constructed with the same probability of each species’ occurrences in each site, that show a significant co-occurrence pattern, whereas under Random 2 we give numbers of matrices, where the probability of occurrence of each species in each site was randomly selected, that show a significant co-occurrence pattern.
| Type of deviation | Random 1 | Random 2 | Atmar & Patterson’s | New set |
|---|
| Natural | CS | Natural | CS | Natural | CS | Natural | CS |
|---|
| Segregated | 0 | 0 | 1 | 1 | 5 | 4 | 8 | 9 |
| Aggregated | 2 | 2 | 0 | 0 | 3 | 2 | 0 | 0 |
| Both | 0 | 0 | 0 | 0 | 2 | 2 | 1 | 1 |
In the case of random matrices with different occupancy probability per site (Random 2), the ‘natural’ and the CS metrics found a significant co-occurrence pattern in only one out of 100 random matrices. The percentage of deviating pairs per matrix was positively correlated with number of sites (Kendall’s τnatural = 0.558, τcs = 0.560, P < 0.001) and matrix size (τnatural = 0.422, τcs = 0.420, P < 0.001), with no effect of species number or fill. The quadratic relationship between matrix fill and the percentage of deviating pairs per matrix is marginally significant, while R2 is negligible (for the natural metric: R2 = 0.063, F(2, 97) = 4.351, P < 0.05, Y = −130.03X2 − 28.14X + 132.08, for the CS: R2 = 0.061, F(2, 97) = 4.238, P < 0.05; Y = −130.86X2 − 27.86X + 131.98). Matrix-wide C-score identified a co-occurrence pattern in six matrices. Again, this number is not really different from the 5% expectedly deviating matrices.
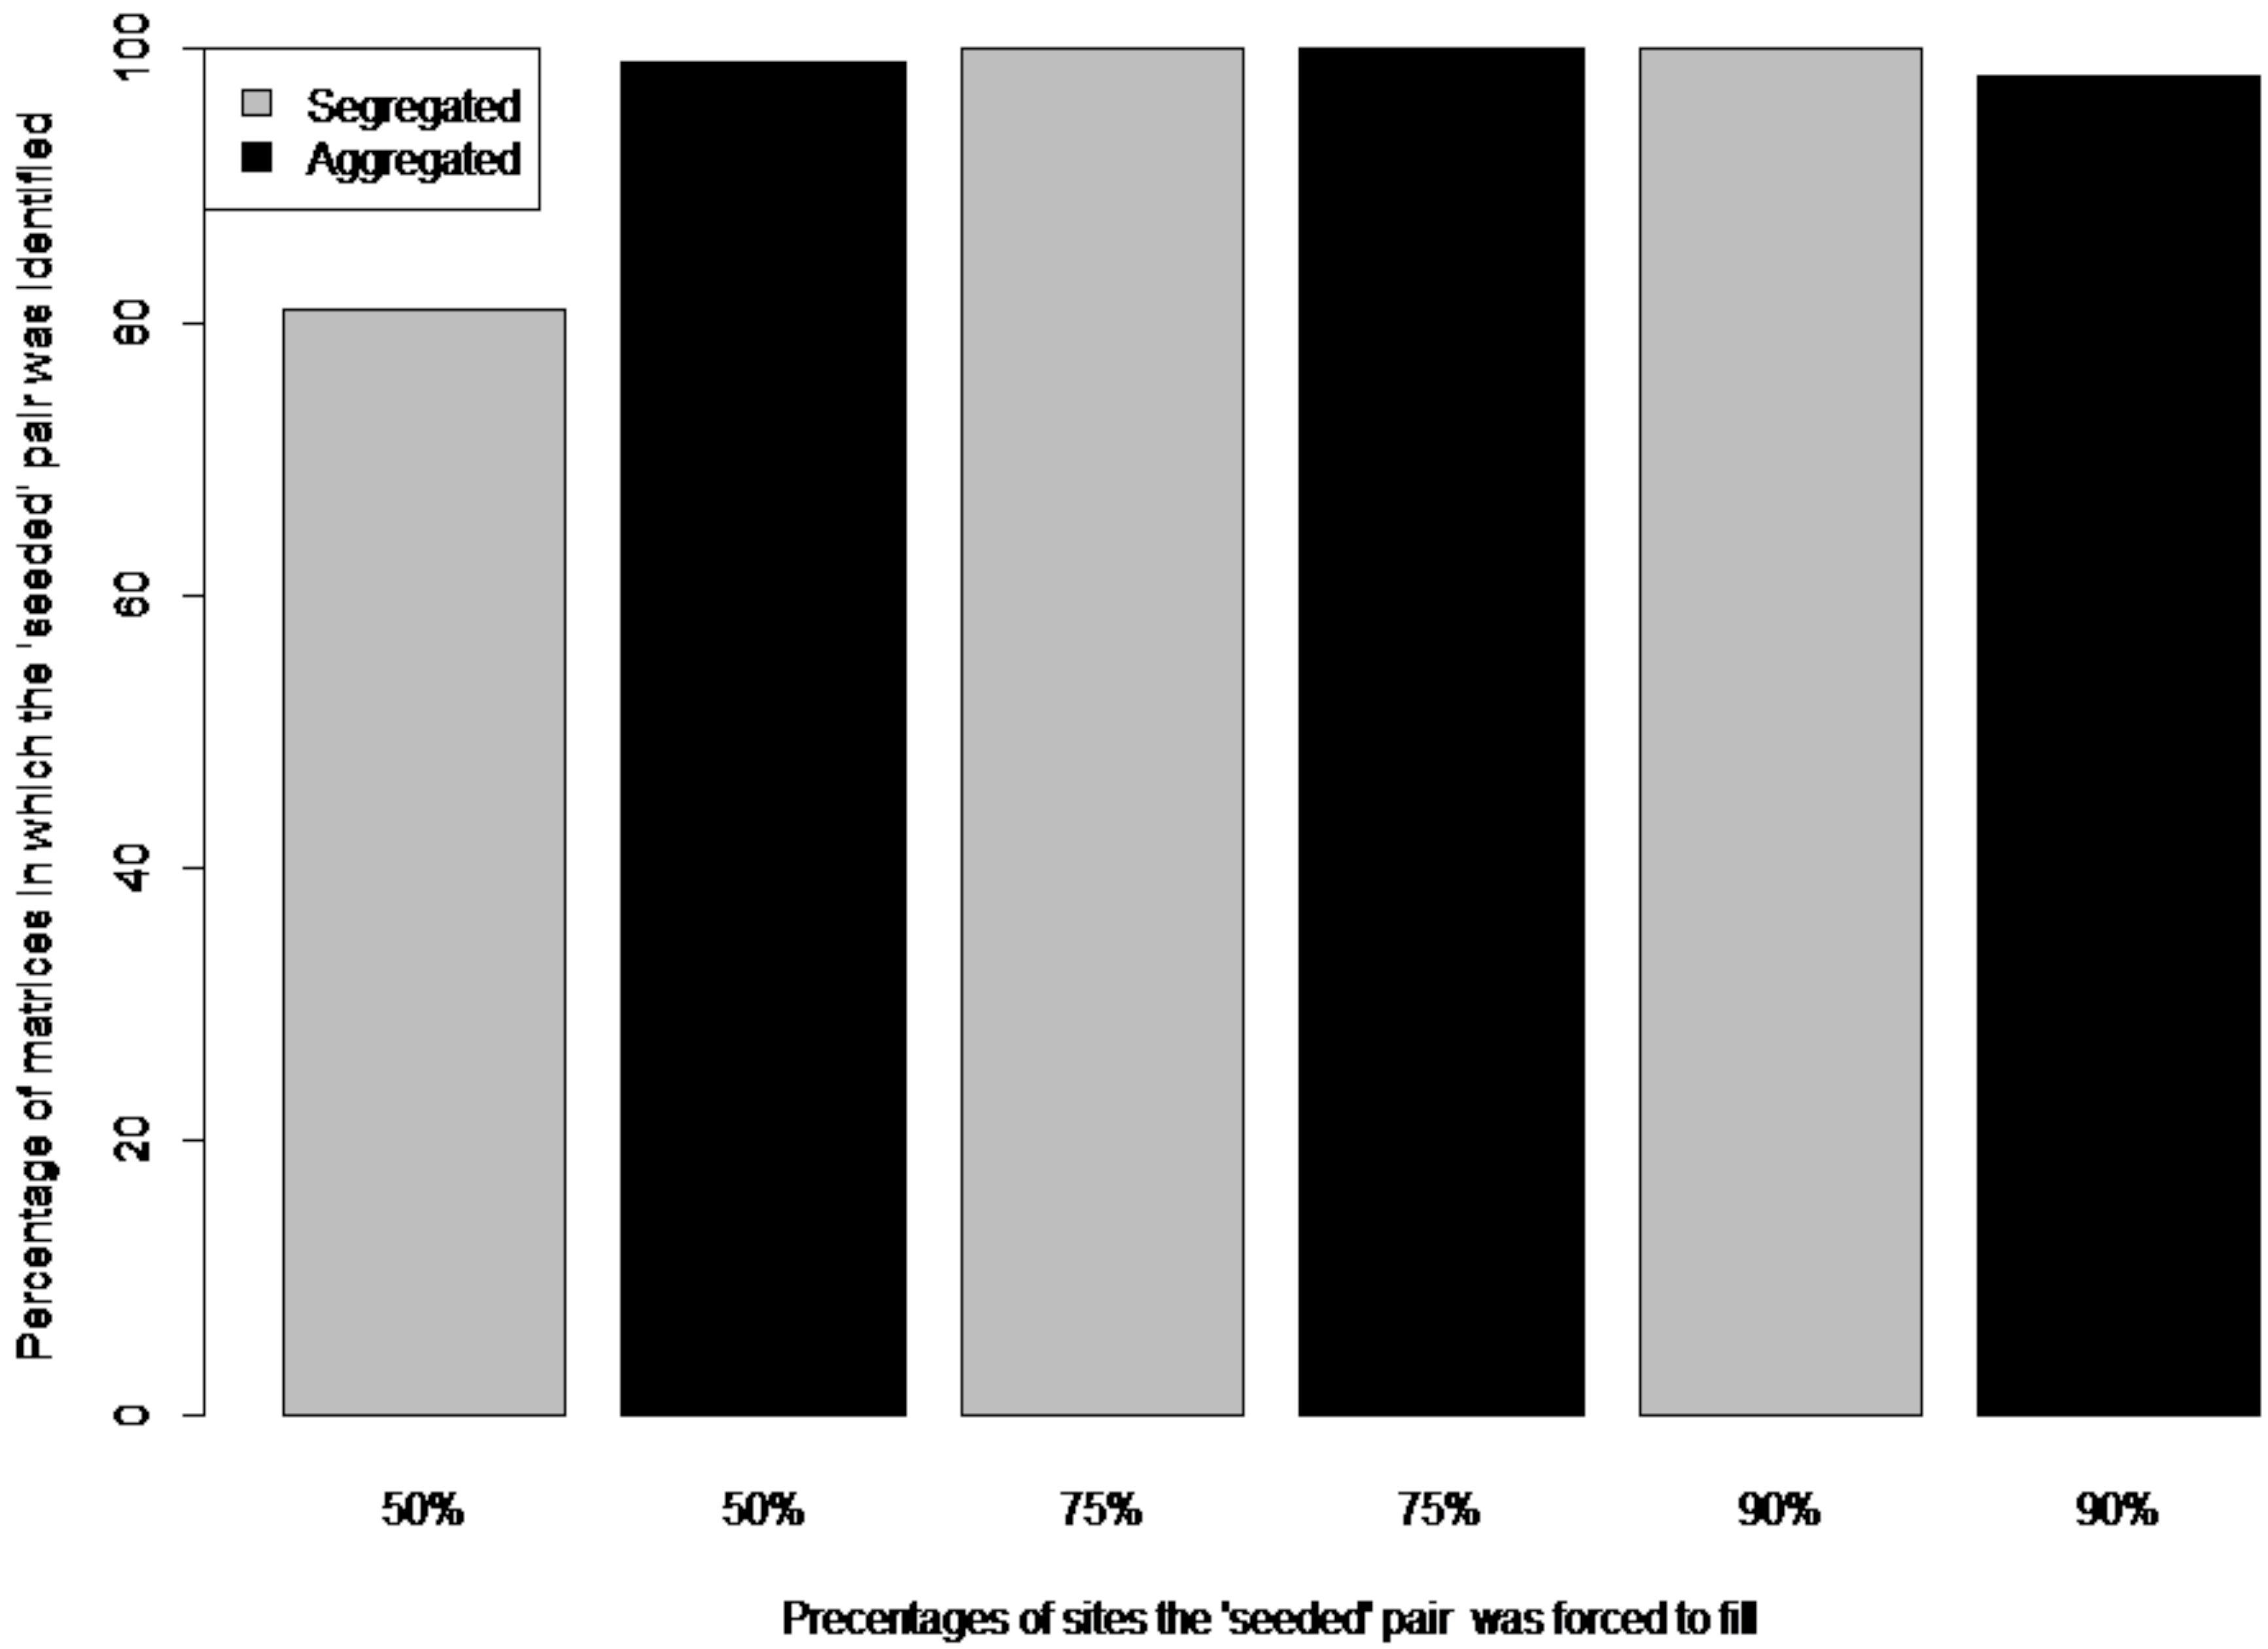
Regarding ‘seeded’ matrices, both metrics recovered all seeded ‘aggregated’ pairs for 50% and 75% site occupancies. For 90% site occupancy, the two metrics recovered 98% of seeded ‘aggregated’ pairs. Both metrics recovered 81% of seeded ‘segregated pairs’ for 50% site occupancy, 99% of seeded ‘segregated pairs for 75% site occupancy and all pairs for 90% site occupancy (
Figure 1).
Figure 1.
Percentage of matrices in which the ‘seeded’ pair was identified by the ‘natural’ and the pairwise C-score (CS) metrics. Both metrics gave identical percentages. For both segregated (‘checkerboard’ distribution) and aggregated (co-occurring) seeded pairs, the occurrences were forced to fill 50%, 75% and 100% of sites.
2.2. Published Matrices
The CS metric found a significant co-occurrence pattern in just eight, and the ‘natural’ metric in just 10, out of 149 matrices from the Atmar and Patterson [
20] collection. On the other hand, matrix-wide C-score found significant co-occurrence patterns in 65 matrices. As for the additional 120 matrices we compiled from the scientific literature, the ‘natural’ metric found significant co-occurrence patterns in nine and the CS metric in 10. Matrix-wide C-score found significant patterns in 47 matrices.
The percentage of deviating pairs per matrix was positively correlated with number of sites (Kendall’s τnatural = 0.444, τcs = 0.439, P < 0.001), number of species (τnatural = 0.108, P < 0.05, τcs = 0.116, P < 0.01) and matrix size (τnatural = 0.306, τcs = 0.310, P < 0.001), and negatively correlated with matrix fill (τnatural = −0.104, τcs = −0.103, P < 0.05). Matrix fill, though, is negatively correlated with matrix size (Kendall’s τ = −0.269, P < 0.001).
Although the two metrics appear to have almost identical behaviour, careful inspection of the results revealed some differences between the deviating pairs identified by each one of them. In most cases the difference is small, although it reached 35.7% of the identified deviating pairs in one matrix of the new set of presence-absence matrices, and 100% in five matrices of the Atmar and Patterson [
20] collection. Nevertheless, the identification of completely different deviating species pairs was observed only in small matrices where very few deviating pairs were identified (up to six). In three of these five matrices there was just one deviating pair, which only one of the metrics was able to identify. It should be noted, also, that none of these matrices exhibits a significant percentage of deviating associations, so these differences might as well be due to random ‘noise’.
We identified all species pairs explicitly presented by Sanderson
et al. [
15] for the Bismarck and Solomon archipelagos (
Table 2). For the Bismarck archipelago results were quite similar with those reported by these authors, but in the case of the Solomon archipelago we identified a notably larger number of deviating species pairs. Fewer pairs than those reported by Sanderson [
12] were identified for the birds of Galápagos islands (
Table 2).
Table 2.
The results of co-occurrence analysis using the ‘natural’ metric for the three data sets for birds previously analyzed by Sanderson [
12] and Sanderson
et al. [
15]. 5% pairs indicate the 5% of all possible species pairs in the matrix that are expected to deviate by chance alone. Deviating pairs indicate the actual number of deviating species pairs found by the ‘natural’ metric. In parentheses, the respective numbers of species pairs given by Sanderson [
12] and Sanderson
et al. [
15].
Table 2.
The results of co-occurrence analysis using the ‘natural’ metric for the three data sets for birds previously analyzed by Sanderson [12] and Sanderson et al. [15]. 5% pairs indicate the 5% of all possible species pairs in the matrix that are expected to deviate by chance alone. Deviating pairs indicate the actual number of deviating species pairs found by the ‘natural’ metric. In parentheses, the respective numbers of species pairs given by Sanderson [12] and Sanderson et al. [15].
| Archipelago | 5% pairs | Deviating pairs | Aggregated | Segregated |
|---|
| Bismarck | 558.75 | 1,164 (1,171) | 292 (292) | 872 (879) |
| Solomon | 493.50 | 1,496 (1,091) | 496 (465) | 1000 (626) |
| Galápagos | 3.90 | 10 (14) | 2 (2) | 8 (12) |
Figure 2.
Boxplot showing the proportion of deviating pairs (natural metric) for each taxonomic group in the Atmar and Patterson’s [
20] set of published matrices. The thick line in each box represents the median of the sample. Circles represent sample outliers. Letters above plots indicate similarities among taxa (same letters stand for no statistical difference).
Comparisons of the proportion of deviating pairs between taxonomic groups of the Atmar and Patterson’s [
20] set revealed significant differences between arthropods and birds (z = −3.74, P < 0.001), arthropods and mammals (z = −3.41, P < 0.001), arthropods and plants (z = −2.5, P < 0.05), as well as between reptiles and amphibians and mammals (z = 2.01, P < 0.05). Mammals and birds have the highest proportion of deviating pairs and arthropods the lowest (
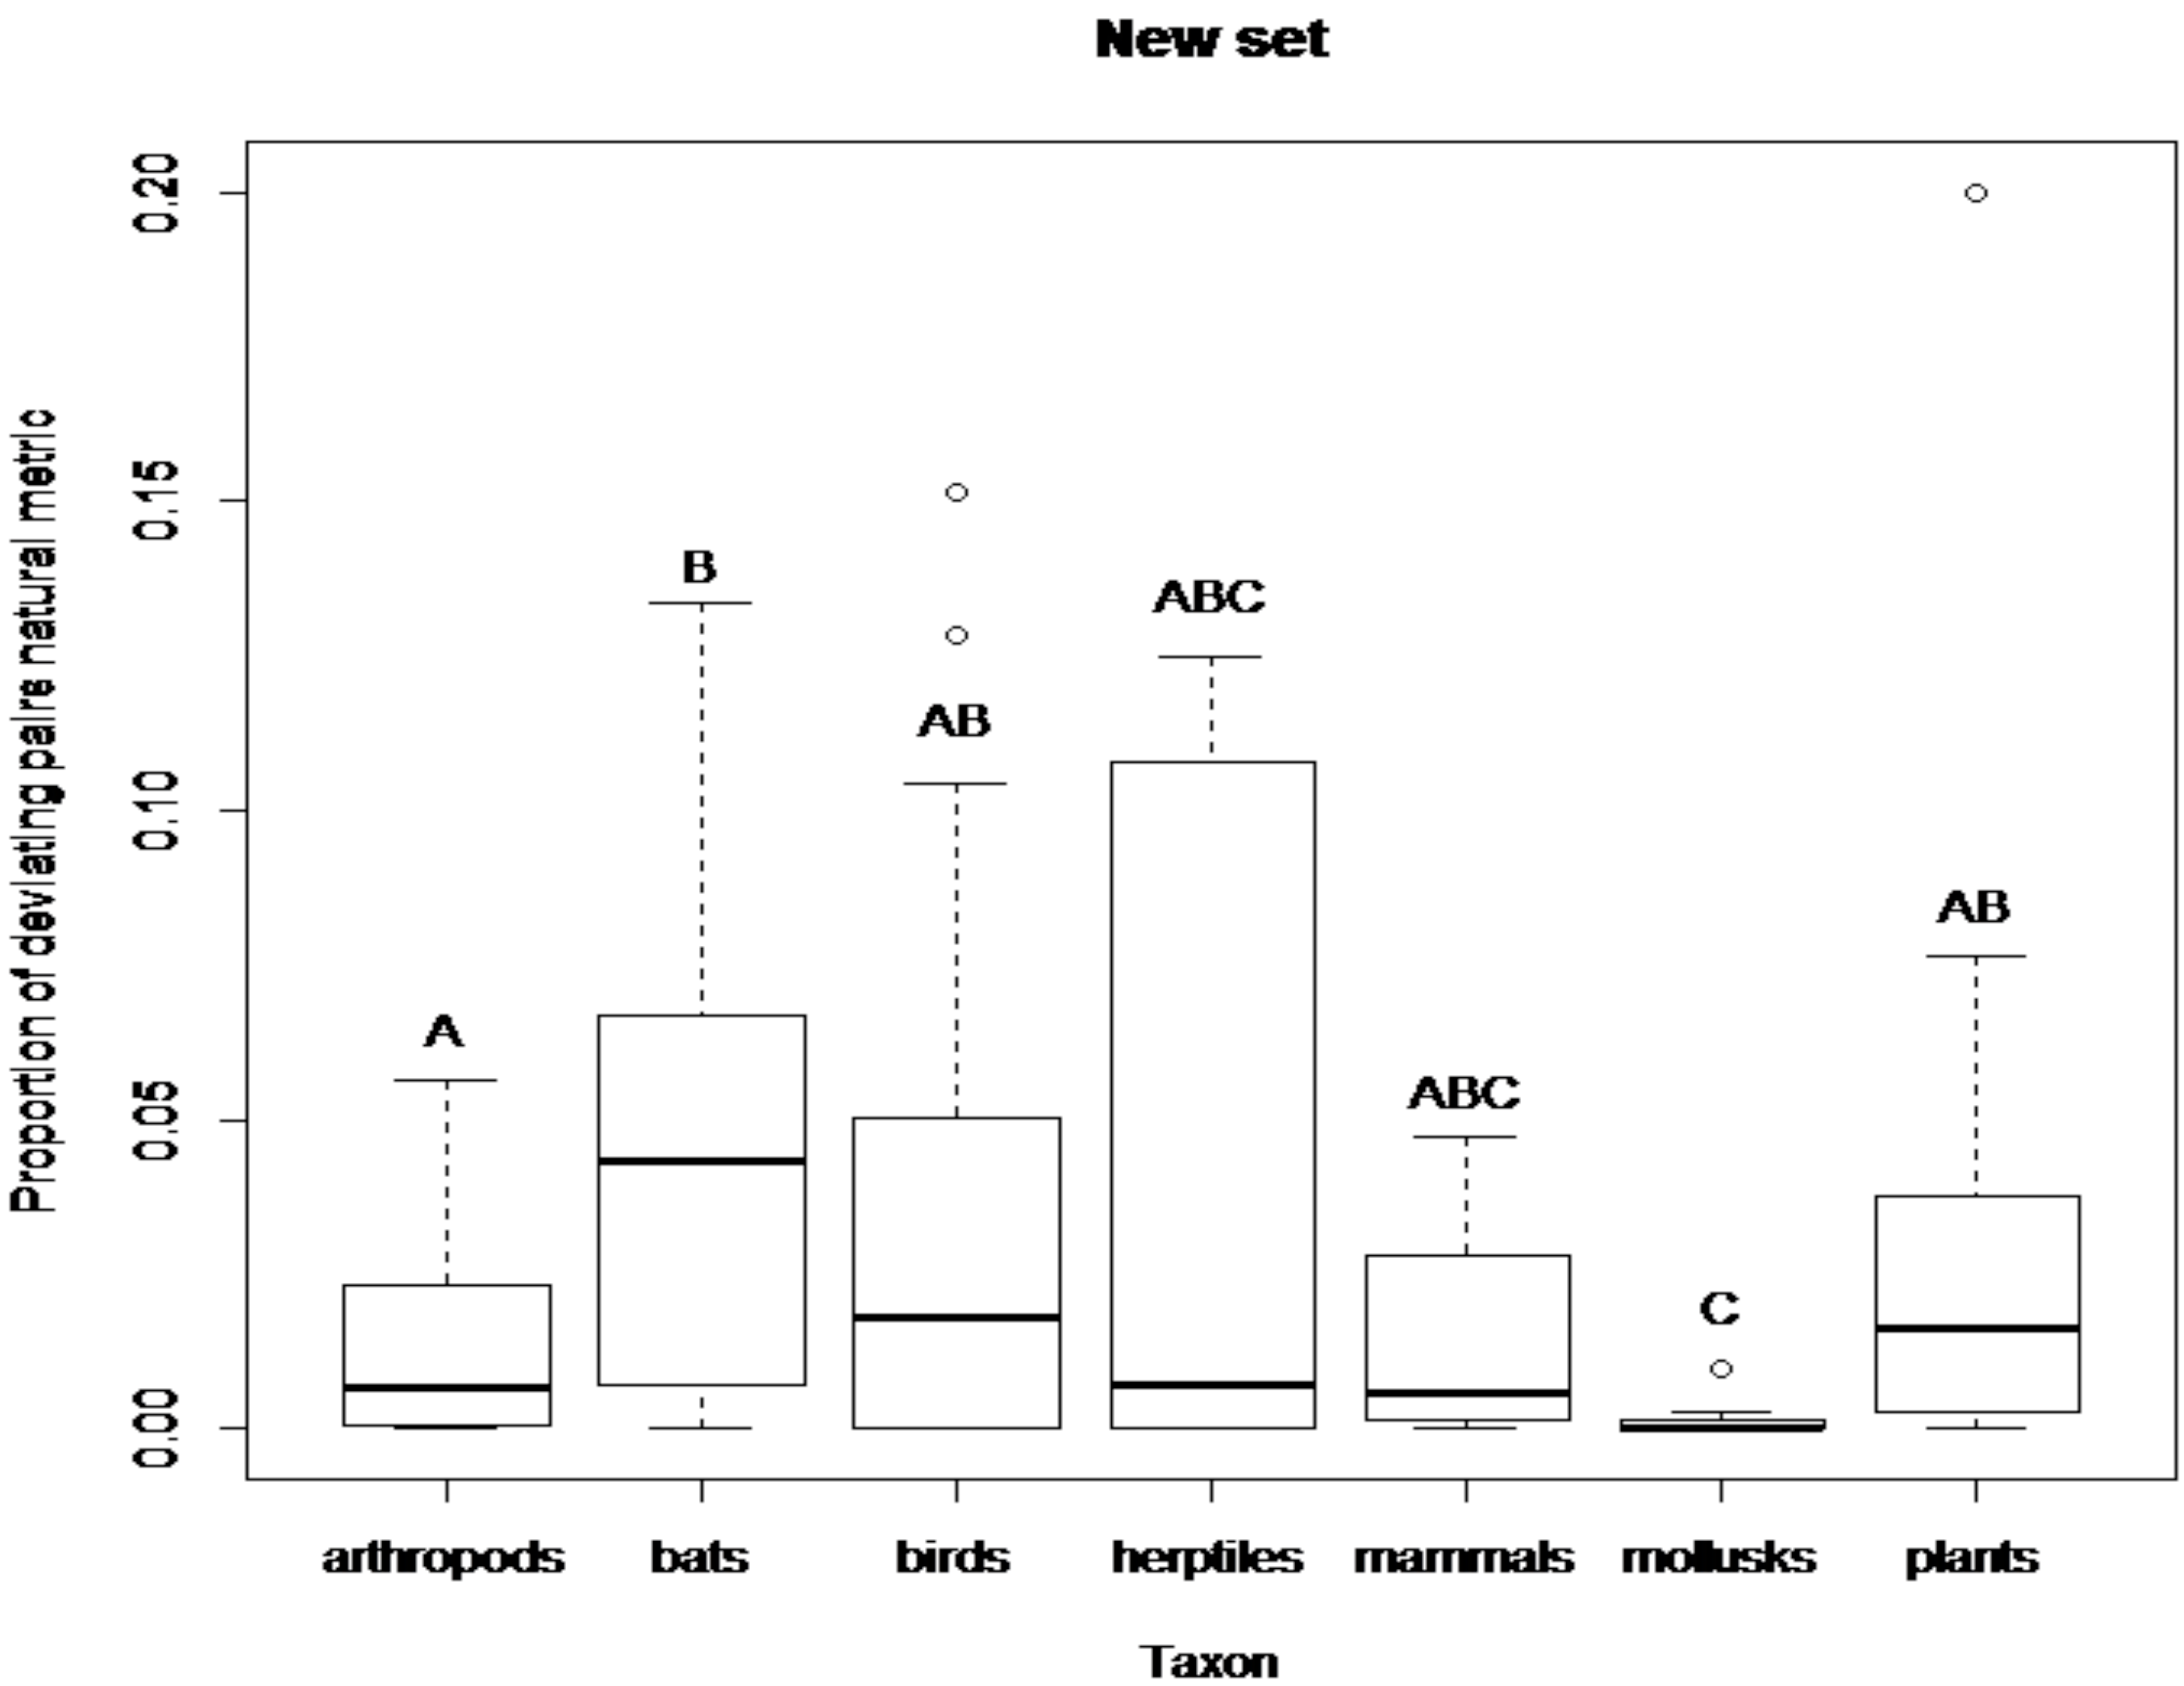
Figure 2). In the new set of published matrices comparisons of the proportion of deviating pairs between taxonomic groups revealed significant differences between arthropods and bats (z = −2,52, P < 0.05) and arthropods and mollusks (z = 2.96, P < 0.01). Significant differences were also observed between bats and mollusks (z = 3.42, P < 0.001), birds and mollusks (z = 2.77, P < 0.01) and between mollusks and plants (z = −3.56, P < 0.001). Bats, birds and plants have the highest proportion of deviating pairs and mollusks the lowest (
Figure 3).
Figure 3.
Boxplot showing the proportion of deviating pairs (natural metric) for each taxonomic group in the new set of published matrices. The thick line in each box represents the median of the sample. Circles represent sample outliers. Letters above plots indicate similarities among taxa (same letters stand for no statistical difference).
2.3. Discussion
The attempt to identify patterns resulting from species interactions in presence-absence matrices has led to a variety of approaches and to contrasting views regarding both methods and interpretations [
6,
9,
12,
15,
21,
22,
23,
24]. Despite evidence in favor of competitive community structure through the application of matrix-wide (‘ensemble’) metrics [
25] or in specific data sets [
15], the application of metrics focusing on the species-pair level does not seem to support such a claim [this study,
9,
10]. The identification of significant deviations from chance expectations for co-occurrence patterns in presence-absence matrices is restricted to a just few cases, some of which nevertheless have been used as benchmarks in an attempt to document such community assembly rules [
1,
15,
16,
26]. Recenlty, in a meta-analysis of 59 papers dealing with plant communities, Götzenberger
et al. [
27] concluded that non-random assemblage is only infrequently demonstrated in plant communities. Their result is interesting because it is based on meta-analyses of papers that use matrix-wide metrics, namely the C-score and CHECKER, which tend to detect excessive segregations. However, they state that their result does not constitute definitive evidence due to the many possible biases and methodological shortcomings associated with published studies.
Our results show that most data sets do not show any significant deviations from random expectation as far as co-occurrence patterns are concerned. Among those that have been found, most deviations are negative (2,592 compared to 659 positive over all published matrices, according to the natural metric), and are mostly found in vertebrates or higher plants, as shown by comparisons between taxonomic groups. Similar results were found by Sfenthourakis
et al. [
10] where six out of the eight matrices that showed a significant number of deviations were found in vertebrates (seven in birds and mammals and one in reptiles). Given that most communities of multicellular organisms consist of invertebrates, it is evident that deviations from randomness in such matrices are hardly the rule. It should be noted that we do not claim that biotic communities could not be shaped by competitive or cooperative processes, but that such processes cannot be seen through analyses of presence-absence matrices. Therefore, it may not be safe to base inferences for such processes on patterns exhibited by such matrices. Competitive or other processes may leave their imprint on binary matrices in some extreme cases, but most often presence-absence matrices look as if they are randomly structured regarding species co-occurrences. As already said, some authors have claimed that co-occurrence patterns are to be found simply because of the vast number of possible species pairs in large matrices, so that one should restrict analyses only to specified sub-groups of species for which interesting hypotheses can be formulated, such as trophic guilds or congeneric species [
15,
18,
19]. However, and despite the strength of this argument, it seems that even such ‘artifactual’ species pairs are very rare, so that our claim against the commonness of deviating co-occurrence patterns gains further support. In addition, as we have shown in previous work, even when only congeneric species are considered, deviations from random expectations are still rare [
10].
The tests of the performance of the ‘natural’ metric of species pairs co-occurrence, as well as that of the CS based on ‘checkerboard units’, showed that both perform very well against Type I and Type II errors and that they provide similar, albeit not identical, results. We should note, though, that our approach is conservative because we use a swap algorithm that maintains the row and column sums of each matrix. We believe that maintaining row sums (i.e., differences in the number of occurrences among species) is important because the number of occurrences of a species might vary for a number of reasons and not just as a result of competitive effects. Therefore we actually test if the distribution of a species is independent from others (i.e., random) given the number of occurrences of the species across islands.
Keeping this in mind, we must note the large difference observed in the detection rate of significant patterns in the published matrices between the matrix-wide C-score and the pairwise metrics. C-score does not seem to be directly associated with the detection of pairwise associations. Identification of co-occurrence patterns by a metric focusing on species pairs should strengthen evidence of non random associations between species given by a whole-matrix metric such as the C-score. Nevertheless the incongruence of results from the two approaches undermines the usefulness of matrix-wide methods compared to those identifying particular species pairs that exhibit interesting patterns.
Components of matrix size play an important role in results, with matrices that contain more sites tending to produce more deviating patterns of species co-occurrence. Similar observations were also made by Gotelli and Ulrich [
9]. We consider this effect as a reasonable and meaningful outcome, since more sites give more statistical power, so there is an increased probability to find the observed value outside one of the 5% tails of the simulated distribution. Actual patterns of species’ associations should be more evident in large sets of sites. Furthermore, a significant quadratic relationship between matrix fill and the percentage of deviating species pairs is observed in random matrices. This means that matrices with intermediate fill tend to have more deviating species pairs. Intermediate fill means more possible configurations of a matrix subjected to permutations by the swap algorithm resulting also in more possible configurations of each species pair’s occurrences. Such a quadratic relationship between matrix fill and the percentage of deviating species pairs is not observed in published matrices. This may be due to the fact that large matrices tend to have low fill and vice versa.
The results obtained by the application of any pairwise metric of co-occurrence on a presence-absence matrix should be evaluated with caution, since they are only indications of extreme patterns and different forces can generate them. Species associations may not only result from competitive interactions but they are perhaps more likely to result from the effects of historical factors (e.g., common palaeogeographic history) and/or habitat preferences of the species [
10,
11,
16].
Even though both metrics gave very similar results, attention should be given to what each one measures, so that possible divergences can be evaluated. The ‘natural metric’ is based on straightforward reasoning, given that co-occurrence or mutual exclusion for each species pair is evaluated on the basis of their joint presences. The CS metric, on the other hand, counts cases where one species is absent from a site where the other is present
only if the reverse is also observed in the same matrix. Also, positive interactions are indirectly evaluated as not allowing for ‘checkerboards’. These properties of the CS metric may lead to underestimation of positive interactions, especially in cases where there are a few sites rich in species that do not occur in poorer sites and there are also a few singletons in poorer sites. In these cases, the numbers of ‘checkerboards’ will increase dramatically, even with just one singleton. Such an effect of ‘supertramp’ species (
sensu Diamond [
1]) has been discussed by Simberloff and Collins [
11,
16] who showed that even one supertramp may drive pairwise patterns. We maintain that the ‘natural’ metric is far less sensitive in this regard, as it would use only the few common occurrences of the supertramp (since such species are found only at low richness sites) which would be maintained in the null matrices, especially under the restriction of retaining row and column sums in permutated matrices (fixed-fixed model), reducing the possibility to detect significant deviations. In any case, the effects of singletons and/or other ‘supertramps’ on co-occurrence patterns should be evaluated further in future studies.
Our results showed some differences in the precise numbers of deviating pairs reported by Sanderson
et al. [
15] for the birds of the Solomon archipelago. We actually found more deviating species pairs, especially for segregating ones. It is probable that this difference may be due to the 200-times larger null space explored by Sanderson
et al. [
15], since increasing the nulls almost always leads to reduced numbers of significant deviations (see Methods). On the other hand, it could be a result of the modified swapping algorithm used by these authors.
The significant correlations of co-occurrence metrics with various matrix properties (i.e., fill, size and/or separately with number of sites and species) indicate a possible effect of restrictions imposed by the structure of any finite matrix. In any case, the trend towards over-estimation of significant deviations from randomness due to effects of matrix properties and possibly also null space size on co-occurrence metrics, in combination with our results from a wide range of biotic communities, where just a few matrices show such deviations, lead to the conclusion that significant co-occurrence patterns are rare among presence-absence matrices. The effects of species interactions should thus be evaluated using other sources of evidence.


