Article

Effect of Disturbance Regime on Alpha and Beta Diversity of Rock Pools

by
Annie Séguin
1,2,
Dominique Gravel
2 and
Philippe Archambault
1,*
1
Institut des sciences de la mer de Rimouski, Université du Québec à Rimouski, Rimouski, Québec, G5L 3A1, Canada
2
Canada Research Chair on Terrestrial Ecosystems, Département de biologie, chimie et géographie, Université du Québec à Rimouski, Rimouski, Québec, G5L 3A1, Canada
*
Author to whom correspondence should be addressed.
Diversity 2014, 6(1), 1-17; https://doi.org/10.3390/d6010001
Submission received: 5 September 2013 / Revised: 3 December 2013 / Accepted: 6 December 2013 / Published: 19 December 2013

Abstract

:
Measures of alpha diversity are more frequently used to detect environmental changes and subsequent impacts on biodiversity, while measures based on variability (beta diversity) are said to be more appropriate for detecting those impacts. Theory predicts that beta diversity should increase with disturbance frequency in patchy communities. Our objective in this study was to experimentally determine the effect of high and low disturbance regimes, frequency and intensity combined, on marine benthic alpha and beta diversity. The experiment was conducted in a rock pool system of the St. Lawrence estuary, Canada. Rock pools were disturbed by (1) nutrient enrichment and (2) draining according to three disturbance regimes (none, low, high). Disturbance regimes had little or no effect on alpha diversity of benthic algae and sessile animals. However, the low regime of nutrient enrichment induced greater within-group beta diversity than the reference rock pools, while the high disturbance regime induced equal or even smaller within-group beta diversity compared to the reference. Draining had an opposite effect on benthic beta diversity, with a greater variability of the community structure under the high regime of disturbance. Taking into account the effect of disturbance regimes on beta diversity could provide a useful diagnostic for disturbed benthic communities.

1. Introduction

Disturbances are important drivers of the structure of most communities [1]. By definition, a disturbance is a discrete event in time that disrupts ecosystem, community, or population structure and changes resources, substrate availability, or the physical environment [2]. Environmental disturbances could shift community assembly dynamics from stochastic to deterministic [3]. Stochastic processes, both demographic and environmental, influence the structure of ecological communities [4]. As disturbances increase in frequency and intensity, they modify physical characteristics of the environment and some species will be favoured. On the other hand, disturbances can also promote coexistence via various mechanisms such as predation-mediated coexistence [5] or interspecific colonization-competition trade-offs [6,7]. For instance, according to the intermediate disturbance hypothesis there is a unimodal relationship between disturbances and diversity where coexistence between competitors and colonizers at an intermediate level of disturbances will lead to the highest level of biodiversity [8,9].
Disturbances affect temporal and/or spatial variability of community structure (beta diversity) as much as species richness (alpha diversity). For clarity in this paper, alpha diversity is defined as the diversity in taxa of individual rock pools and beta diversity refers to the variation in community structure (quantitative taxa abundance data) among rock pools, based on definitions given by Legendre et al. [10]. Several authors underlined that changes in alpha diversity following disturbances received much more attention [11,12,13,14,15]. Firstly, high temporal variance of population abundance can often mask the occurrence of anthropogenic disturbances. Secondly, the temporal trajectories of mean population abundance of a species can differ from one area to another. That leads to an important interaction between changes in mean abundance observed at one place across time and differences in mean abundance from place to place.
Variability of a community property such as beta diversity reveals as much, if not even more, information as the average of that property [16]. The analysis of temporal and spatial variability is also more appropriate for detecting environmental changes than analysis of the average or centroids [13,17,18]. Variability provides insight into the processes structuring ecosystems over multiple spatial scales [19,20]. The alteration of the variability by disturbances can also help to predict upcoming changes in ecosystem dynamics [18,21]. Several mechanisms could alter the variability in community structure: a modification of the total abundance of individuals within a location, a modification of the total number of species, a change in the variance to mean abundance ratio for particular species, or a change in the identities of species present in the assemblage [22,23]. There is a need to develop models and theories based on this variability to improve ecosystem management and conservation in disturbed environments.
Caswell and Cohen [24] predicted a positive relationship between the variability of community structure and the disturbance frequency (i.e., the number of disturbances per unit of time). Their model was based on an infinite set of physically identical patches occupied by communities whose dynamics were modulated by interspecific interactions, dispersal, colonization and disturbances. They then described the relationship between disturbance frequency and (1) beta diversity and (2) variance in alpha diversity, for different dispersal rates. These two measures of variability were highly correlated and showed similar patterns. Warwick and Clarke [22] experimentally tested the theory of Caswell and Cohen [24] and recorded increased beta diversity in disturbed sites compared to control sites due to an increase in the variability of abundances and changes in species identities. Warwick and Clarke [22] concluded that increased beta diversity might be used as a diagnostic tool in disturbed areas. Subsequent studies found mixed results; some reinforced the conclusions of Warwick and Clarke [22,25,26,27,28,29] while other studies did not find support for this theory [3,23,30,31,32]. Disturbances can be classified according to their characteristics, called disturbance regimes. A disturbance regime is quantified by its magnitude (intensity and severity) as well as its temporal (frequency) and spatial (size) components [1]. The study of Warwick and Clarke [22] passed over the potential divergent effects of disturbance regimes on the community structure. Such divergences have often been demonstrated in the literature [18,31,33,34,35]. Investigating the effect of disturbance regimes on a change in beta diversity could therefore bring new insight into how a community responds to disturbances leading to improved detection tools of disturbed areas.
Our objective in this study was to determine the effect of low and high disturbance regimes on alpha and beta diversity of benthic rock pool communities. We wanted to improve knowledge on the global effect of disturbance regimes on benthic beta diversity and therefore no attempt was made to differentiate between the effect of the frequency and intensity of disturbance. Rock pools were experimentally disturbed sporadically (low), daily (high) or left undisturbed (reference). We hypothesized that (i) disturbances will affect both alpha and beta diversity and (ii) high and low disturbance regimes will have the opposite effect on beta diversity relative to reference rock pools. We expected that low disturbance regimes would increase beta diversity while the reference rock pools would remain stable throughout the experiment. Alternatively, beta diversity should decrease more under high disturbance regimes than in the reference rock pools through the spatial homogenization of damages among replicates [31]. Finally, these hypotheses were experimentally manipulated with two types of disturbances, draining of pools and addition of nutrients, so that we could assess the generality of our results and avoid the potential confounding effect of the disturbance type. They are several streams flowing in the St. Lawrence Estuary. The water of these streams is enriched in nutrients, coming from extensive agriculture activities in the area, which supports algal growth. In this experiment, disturbance by nutrient enrichment therefore reproduces the effect of such input in nutrients in rock pools along the coast. Draining has been chosen to reproduce a disturbance by biomass destruction, contrary to nutrient enrichment that favors algal growth. It was not possible to manipulate directly the biomass within the rock pools as the abundance and diversity of species found in the rock pools differed from each other. We chose this method to ensure similar effect of the disturbance (by biomass destruction) over all the rock pools. We expected (iii) the direction of the above predictions to be the same both following a disturbance from the draining of pools and a disturbance by the addition of nutrients.

2. Experimental

2.1. Study Site

The manipulative experiment was conducted along 770 meters of exposed shore in a rock pool system of the mid-intertidal zone, located in the Lower St. Lawrence estuary, Quebec, Canada (48°37'49.1 N 68°11'39.6 W). Rock pools are a convenient experimental system because they have well-defined boundaries, are easy to manipulate, have been well studied [36,37,38,39], and are structured by a complex set of physical and biological factors [40]. The study area is a gently sloping rocky platform where ice scouring in spring is an important source of disturbance, dislodging most of the exposed organisms [41]. The height above chart datum for each rock pool was measured using a transit level and varied between 1.07 and 1.89 m. The experiment was conducted for 17 weeks between May 26 and September 20, 2008. This time frame covered the peak of the recruitment period of intertidal organisms found in the area of the experiment [42,43]. Overall, 25 irregularly-shaped rock pools, ranging between 0.9–2.3 m in length, were randomly assigned one of five experimental treatments. Rock pools with a mean depth less than 5 cm or more than 30 cm were excluded. The volume of the rock pools ranged between 8.6 and 80.4 L.

2.2. Experimental Design

The first six weeks of the experiment were dedicated to the monitoring of the natural benthic diversity and variability among rock pools and disturbances began at week seven. In separate rock pools, two independent types of disturbances were applied, either draining or nutrient enrichment. Once the pools isolated, water was removed with buckets and syringe to drain a rock pool until completely dry. Nutrient enrichment consisted of manually increasing the final rock pool nutrient concentration to 18 μM of inorganic nitrogen as NH4NO3 and 1.125 μM of inorganic phosphorus as H3PO4, values corresponding to the highest concentrations recorded in the study area throughout the year [44]. To ensure a similar final nutrient concentration in disturbed rock pools, the amount of nutrients added was determined from the initial water concentration and the volume of rock pools. Thus, once a week, 60 mL, in duplicate, was collected in six randomly chosen rock pools among the 25 studied rock pools, just before the isolation of rock pools for the determination of initial nitrates and phosphates concentrations. Lab analyses of nutrient concentrations were done according to Aminot and Kérouel [45]. We also monitored the nutrient consumption by algae after enrichment. We observed a decrease in nitrites + nitrates concentration of at least 50% in the disturbed rock pools, before water was renewed, at the subsequent high tide. The algae nutrient use corresponded to at least 150% of the initial nutrient concentration (before enrichment) in those rock pools. The water in rock pools that received an increase in nutrient concentration were homogenized for three minutes. A low disturbance regime was applied six times simultaneously in five randomly chosen rock pools for each disturbance type for the 11 weeks that the disturbances lasted. The high disturbance regime was applied every diurnal low tide within the same period in five different rock pools. Each date we disturbed the five rock pools at low regime, both rock pools that experienced high and low disturbance regime were disturbed with the same intensity. In other words, they were enriched in order to increase their nutrient concentration to the same final concentration. When considering the whole experiment, it means that highly disturbed rock pools received a greater amount of nutrients since disturbance in those rock pools were applied at a higher frequency. Finally, five rock pools served as reference systems and did not receive any disturbance.

2.3. Data Collection

Sampling of the community structure was performed weekly in each rock pool. Three 15 × 15 cm quadrats per rock pool were placed randomly on each sampling date. The percentage cover of benthic algae and sessile animals was estimated from 25 regularly spaced points. Taxa observed within the quadrat frame but not located under a point were considered as having a percentage cover of 1%. Canopy-forming taxa were sampled first and then gently moved to the side to sample the understory. As a result, total percentage cover could exceed 100%. Given the relatively small area of some rock pools, it is likely that sampling was not completely temporally independent and that we probably sampled more than once at the exact same place over the duration of the experiment. However, as we disposed quadrats randomly each time and that the risk was judged higher for only a minority of rock pools, we considered negligible the probability of high temporal correlation and did not apply any correction to circumvent this issue.

2.4. Statistical Analyses

Effects on alpha and beta diversity (Hypothesis i) were tested separately. First, the effect of disturbances on alpha diversity was analyzed with three indices with a four-way ANOVA. The experimental design corresponds to a Beyond-BACI design as described by Underwood [13], where the most critical factor is the Regime × Period interaction. We then analyzed changes in beta diversity with PERMDISP to detect alterations in multivariate dispersion of the benthic community under disturbance regimes. Differences were illustrated by nMDS and within-groups dissimilarity plotted over time (Hypothesis ii). The effects of both types of disturbances were analyzed independently because results were not expected to affect rock pool communities in the same way. Conclusions about the contrasting effect of both disturbance types on alpha and beta diversity were drawn from the differences observed when comparing their distinct analyses (Hypothesis iii). Twelve weeks of data were considered for these analyses; the six weeks prior to disturbances and the last six weeks after the beginning of disturbances, weeks 12–17. Weeks 7–11 were not integrated into the analyses to allow organisms a period of time to respond to the experimental disturbance regimes.

2.4.1. Alpha Diversity

Alpha diversity was quantified with three different indices (benthic taxa richness, Shannon-Wiener diversity and Pielou evenness) and compared among treatments with four-way partially hierarchical ANOVAs. Factors were; Regime with three levels (fixed effect; low, high, reference), Rock pool nested within Regime (random effect; five per regime), Period with two levels (fixed effect; before, after), Time nested within Period (random effect; six weeks per period) and their interactions. Shannon-Wiener diversity index and Pielou evenness index were power transformed (x2) to fulfill ANOVA assumptions (normality and homogeneity of residuals) for the nutrient enrichment experiment. A posteriori Tukey (HSD) tests were performed to discriminate between groups when a source of variation was significant.

2.4.2. Beta Diversity

The homogeneity of multivariate dispersions was tested to evaluate the effect of disturbance regimes on beta diversity of the entire assemblage. The routine PERMDISP (9999 permutations) was conducted using Bray-Curtis similarity index computed from the percentage cover. Dispersion was calculated as the average dissimilarity from individual observation units to their group centroid in multivariate space [46,47]. Smaller dispersions among disturbed rock pools depicted lower beta diversity compared to reference rock pools. The effect of the factor Treatment on dispersion was tested with a one-way PERMDISP. One-way PERMDISP is currently preferred over crossed designs for testing multivariate dispersion. In fact, if there is a significant interaction between the two main factors in their locations (previously tested with PERMANOVA [47,48]), one-way PERMDISP, that combines all individual Regime × Period cells, avoid problems linked to the interpretation of the test results across the main effects [49]. If interaction in their locations were not significant then multivariate dispersion was examined with a one-way PERMDISP independently for the two main factors. Preliminary analysis performed with PERMANOVA (9999 permutations) found significant Regime × Period interactions in drained rock pools but not after nutrient enrichment (respectively Pseudo − F = 3.269; p = 0.002 and Pseudo − F = 1.384, p = 0.197). Therefore, the effect of draining on dispersion was tested over all individual Regime × Period cells while the effect of nutrient enrichment was tested separately for both Regime and Period. Multivariate a posteriori pair-wise comparisons were performed to elucidate significantly different groups. Results were illustrated using non-metric multidimensional scaling (nMDS; 999 permutations).
Within-group and between-group dissimilarities were calculated using the SIMPER procedure (again using the Bray-Curtis similarity index [50]) and plotted against time for visual comparison. These indices provide information about the magnitude of change in beta diversity under each regime through time. A high within-group dissimilarity percentage indicates high beta diversity between rock pools for the treatment under study. A fourth root transformation of abundances was applied to the data before all analyses. This transformation reduces the influence of numerically dominant taxa [51].

3. Results and Discussion

Overall, 23 taxa were identified within the 25 rock pools during the 17 weeks of the experiment (Table 1). Algae were represented by 15 taxa, dominated by the macroalgae Fucus evanescens and the encrusting algae Ralfsia verrucosa and Ralfsia fungiformis. Sessile animals were represented by eight taxa, such as the blue mussel Mytilus edulis and/or Mytilus trossulus (the two species being indistinguishable by simple morphological examination so thereafter considered as a complex). We observed these five taxa within all 25 rock pools on each sampling date. Fucus vesicolosus, Laminaria sp., Porphyra umbilicalis, Spirorbis spirorbis, Semibalanus balanoides and Obelia sp. were rare taxa according to the definition provided by Gaston [52].
Table 1. List of the 24 taxa identified within the rock pools.
PhylumClassTaxa
BacillariophytaBacillariophyceaeBerkeleya rutilans
CoscinodiscophyceaeMelosira sp.
ChlorophytaUlvophyceaeUlvaria obscura
PhaeophytaPhaeophyceaeChordaria flagelliformis
Fucus evanescens
Fucus vesiculosus
Laminaria sp.
Petalonia fascia
Ralfsia fungiformis
Ralfsia verrucosa
Scytosiphon lomentaria
RhodophytaFlorideophyceaeHildenbrandia rubra
RhodophyceaeClathromorphum circumscriptum
Polysiphonia sp.
Porphyra umbilicalis
AnnelidaPolychaeta Fabricia stellaris
Polydora ciliata
Spirorbis spirorbis
Anthropoda CrustaceaSemibalanus balanoides
Cnidaria AnthozoaAulactinia stella
Clava multicornis
HydrozoaObelia sp.
MolluscaBivalviaMytilus edulis and/or Mytilus trossulus

3.1. Nutrient Enrichment

3.1.1. Alpha Diversity

We observed a significant increase of taxa richness and of the Shannon-Wiener diversity index over time following nutrient enrichment (Table 2). Overall, taxa richness was significantly greater in reference rock pools than in rock pools disturbed at low regime. Taxa richness in rock pools disturbed at high regime was not different from the richness recorded in reference and low disturbed rock pools. However, the taxa richness, the Shannon-Wiener diversity index and the Pielou evenness did not significantly change among the three regime levels over time (Regime × Period, p > 0.05).
Table 2. Univariate analysis performed with a four-way partially hierarchical ANOVA for differences in taxa richness, Shannon-Wiener diversity index and Pielou evenness index among regimes, rock pools, periods and times through nutrient enrichment disturbances. Shannon-Wiener diversity index and Pielou evenness index were power transformed (x2). Ns > 0.05; * p < 0.05; ** p < 0.01; *** p < 0.001.
Sources of variationTaxa richnessShannon-Wiener diversity indexPielou evenness index
dfMSFpMSFpMSFp
Regime213.2914.789*6.0093.201ns0.3131.158ns
Rock pool (Re)122.7271.049ns1.8556.222**0.2733.478*
Period1221.69627.460***8.63321.347**0.2491.869ns
Time (P)107.3123.876**0.3211.353ns0.0892.857*
Re × P26.1132.309ns0.4351.357ns0.0771.023ns
Re × T(P)201.8891.023ns0.2371.105ns0.0310.916ns
P × R(Re)122.5991.415ns0.2981.389ns0.0792.318*
T(P) × R(Re)1201.8371.479**0.2151.087ns0.0341.450**
Residual3601.2430.1970.023

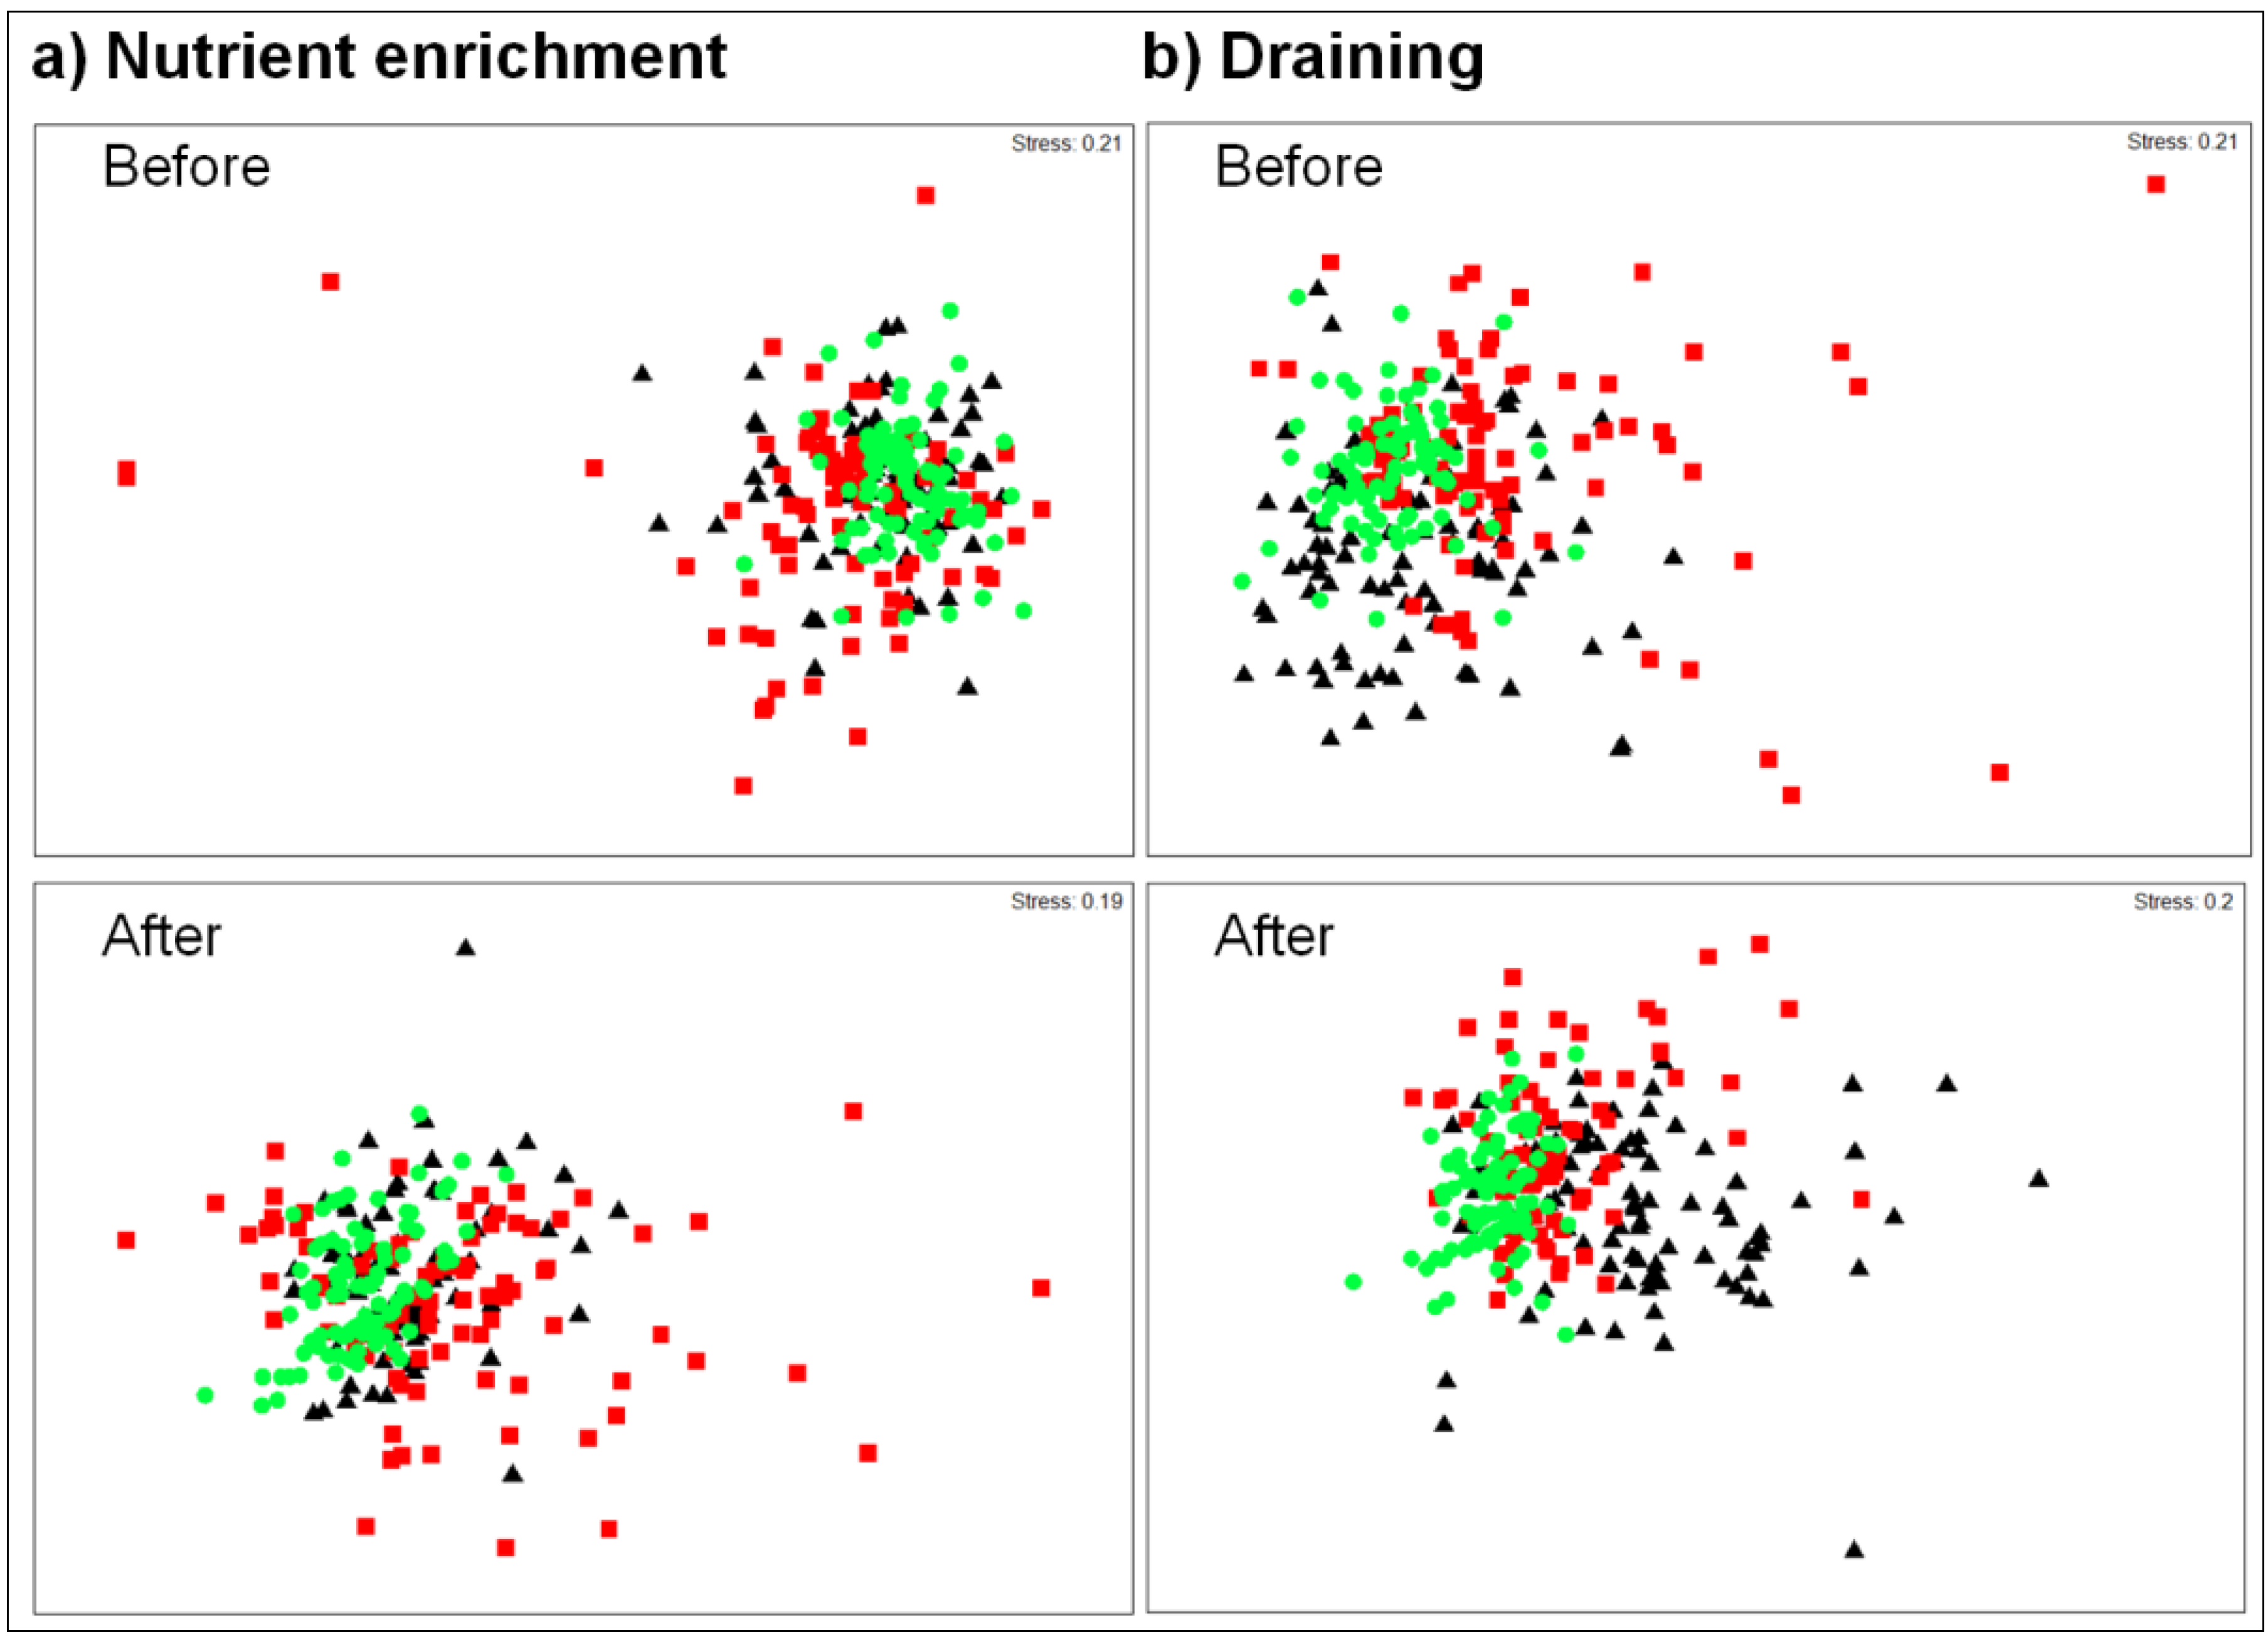
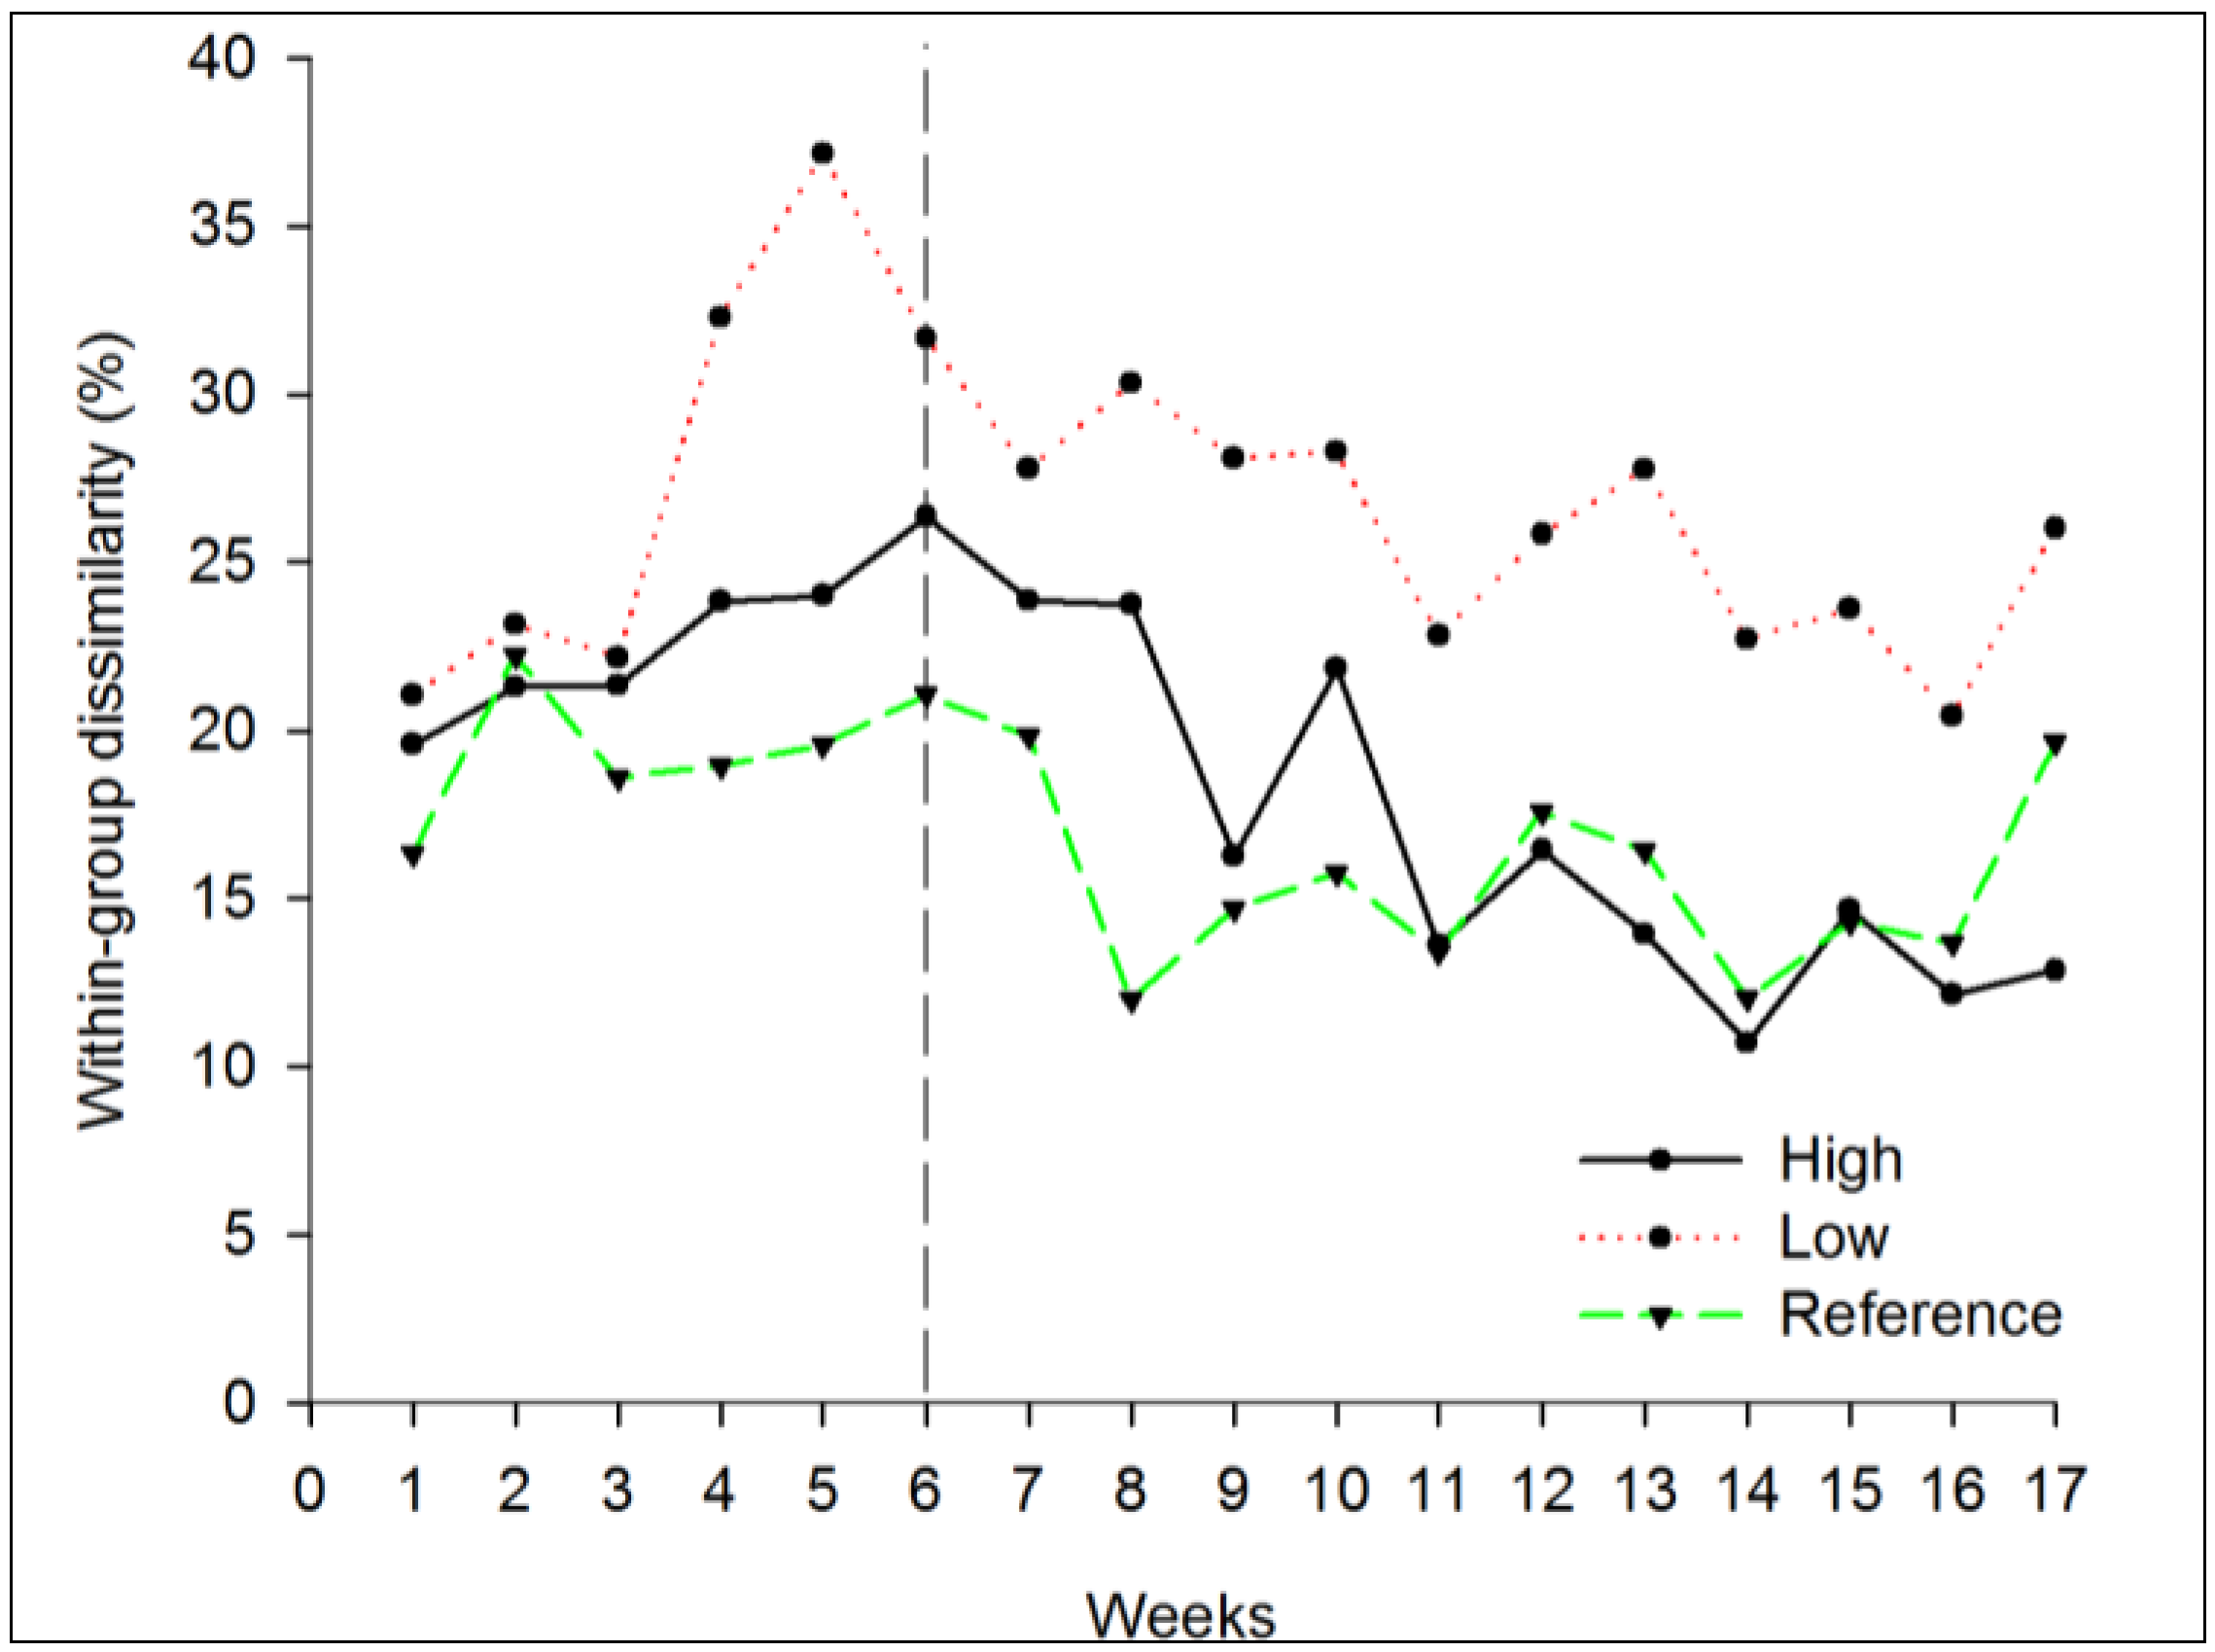
3.1.2. Beta Diversity
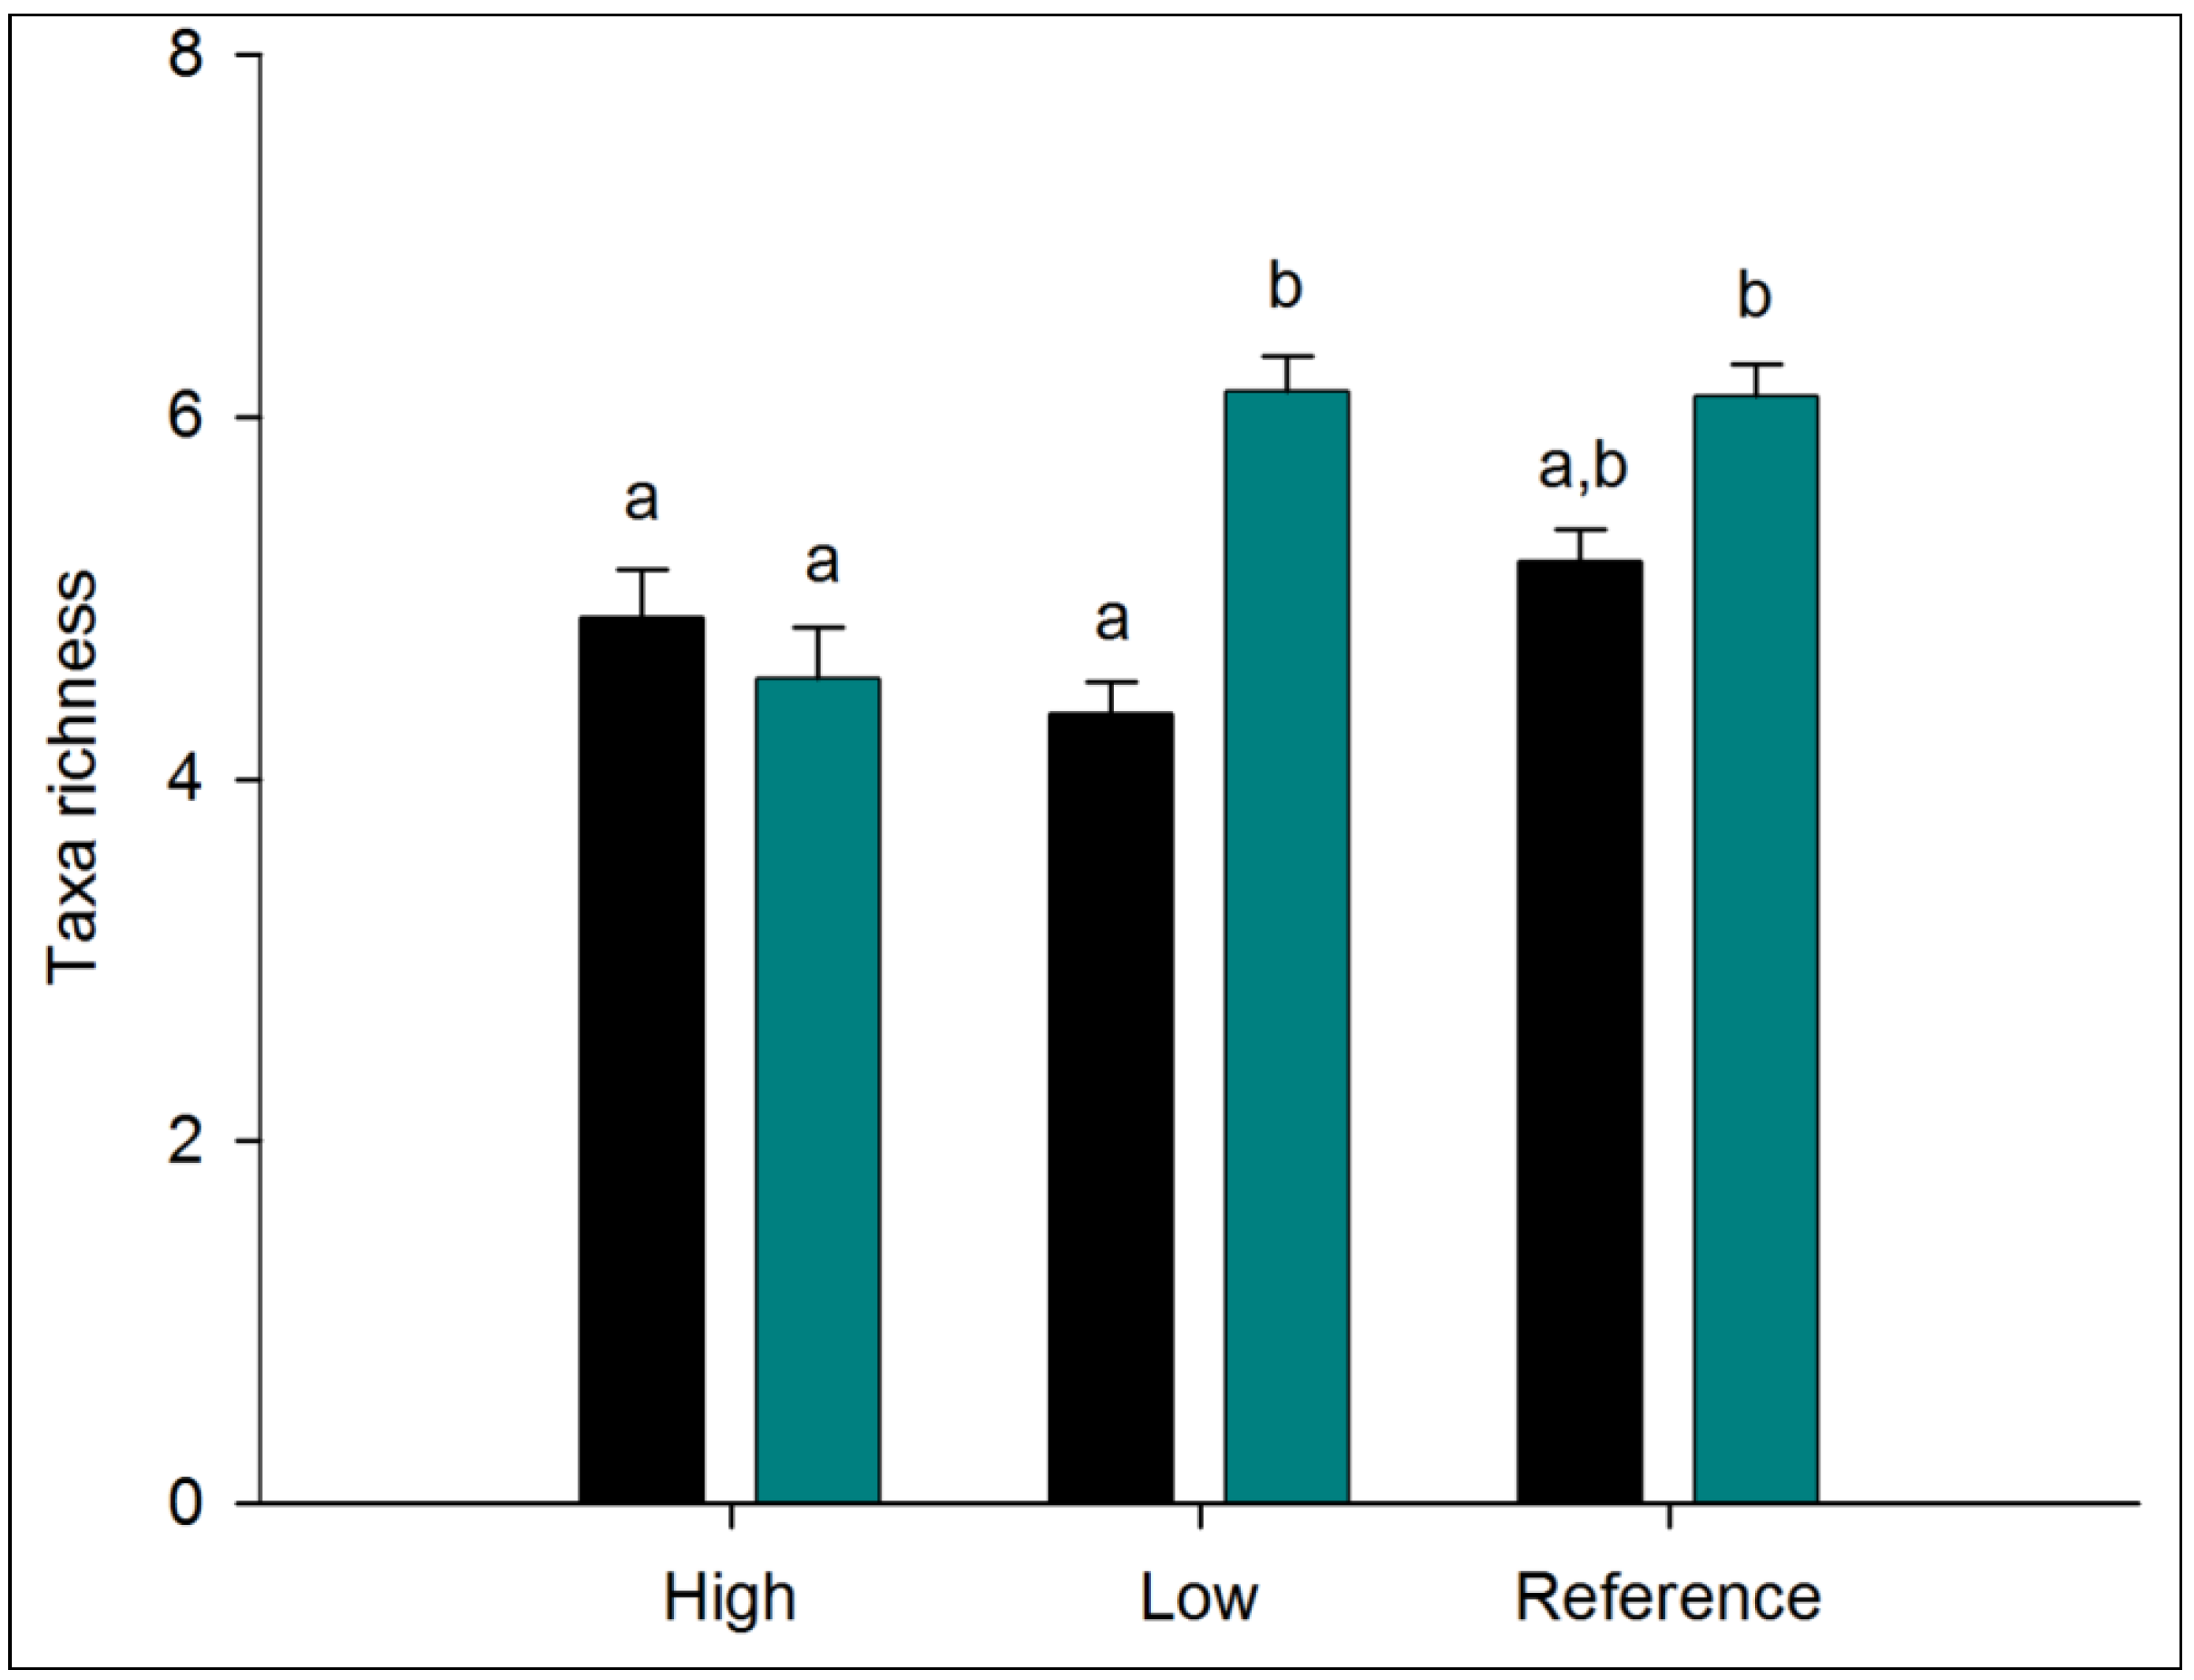
A significant difference was found in multivariate dispersion among regimes (PERMDISP, F2;537 = 49.324, p < 0.001). Pair-wise comparisons indicated significant differences in dispersion between communities under low disturbance regime and the reference treatment, with greater dispersion at low regime. No difference was observed between the reference and high regime of disturbance (Figure 1a). Significant differences were found in dispersion among periods (PERMDISP, F1;538 = 21.693, p < 0.001), and an overall smaller dispersion was noted after the occurrence of disturbance. Relative differences in dispersion observed between the three regimes were the same before and after the beginning of nutrient enrichment. While this appears to be an absence of community response to the nutrient input, a look at the similarity analysis (SIMPER), compiled each week for the entire experiment, revealed changes in beta diversity between regimes after the beginning of the disturbances. SIMPER showed that within-group dissimilarity in rock pools disturbed at high regimes became lower than other regimes. The average percentage of dissimilarity started at 20% before disturbances and decreased to 13% after disturbances (Figure 2). Inversely, for the same period, the within-group dissimilarity percentage in rock pools disturbed at low regimes stayed greater than was seen with the other regimes (around 23%) and thus greater than reference rock pools (around 16% at the end of the experiment).
Figure 1. Non-metric multidimensional scaling (nMDS) ordinations. nMDS were plotted for each regime before and after the beginning of disturbances by (a) nutrient enrichment and (b) draining. High = black triangle; Low = red square; Reference = green circle.
Diversity 06 00001 g001
Figure 2. Within-group dissimilarity in rock pools disturbed by nutrient enrichment. The black vertical line represents the beginning of the disturbances. High = nutrients added every diurnal low tide; Low = nutrients added six times during the period, Reference = no nutrient added. Note that high within-group dissimilarity is associated with high beta diversity.
Diversity 06 00001 g002

3.2. Draining

3.2.1. Alpha Diversity

A significant Regime × Period interaction was found on taxa richness (Table 3) indicating that the taxa richness in rock pools changed over time following the three disturbance regimes. Pairwise comparisons revealed a significant increase in taxa richness after the beginning of the disturbances at low disturbance regime (Figure 3). Although not a statistically significant difference, richness also increased in reference pools but decreased in rock pools disturbed at high regimes. Disturbances applied at the three regime levels did not significantly modify the Shannon-Wiener diversity index or Pielou evenness over time.
Table 3. Univariate analysis performed with a four-way partially hierarchical ANOVA for differences in taxa richness, Shannon-Wiener diversity index and Pielou evenness following draining disturbances. Ns > 0.05; * p < 0.05; ** p < 0.01; *** p < 0.001.
Taxa richnessShannon-Wiener diversity indexPielou evenness index
Source of variationdfMSFpMSFpMSFp
Regime265.27211.922***5.27712.116***0.3631.731ns
Rock pool (Re)124.3161.015ns0.4062.495ns0.2113.958*
Period169.6965.868*0.2380.710ns0.0570.799ns
Time (P)109.4973.134*0.2142.987*0.0421.888ns
Re × P235.0916.486**0.0540.279ns0.1252.388ns
Re × T(P)203.0301.620ns0.0721.698*0.0220.960ns
P × R(Re)124.2512.272*0.1633.861***0.0532.326**
T(P) × R(Re)1201.8711.169ns0.0420.510ns0.0231.007ns
Residual3601.6000.0830.022

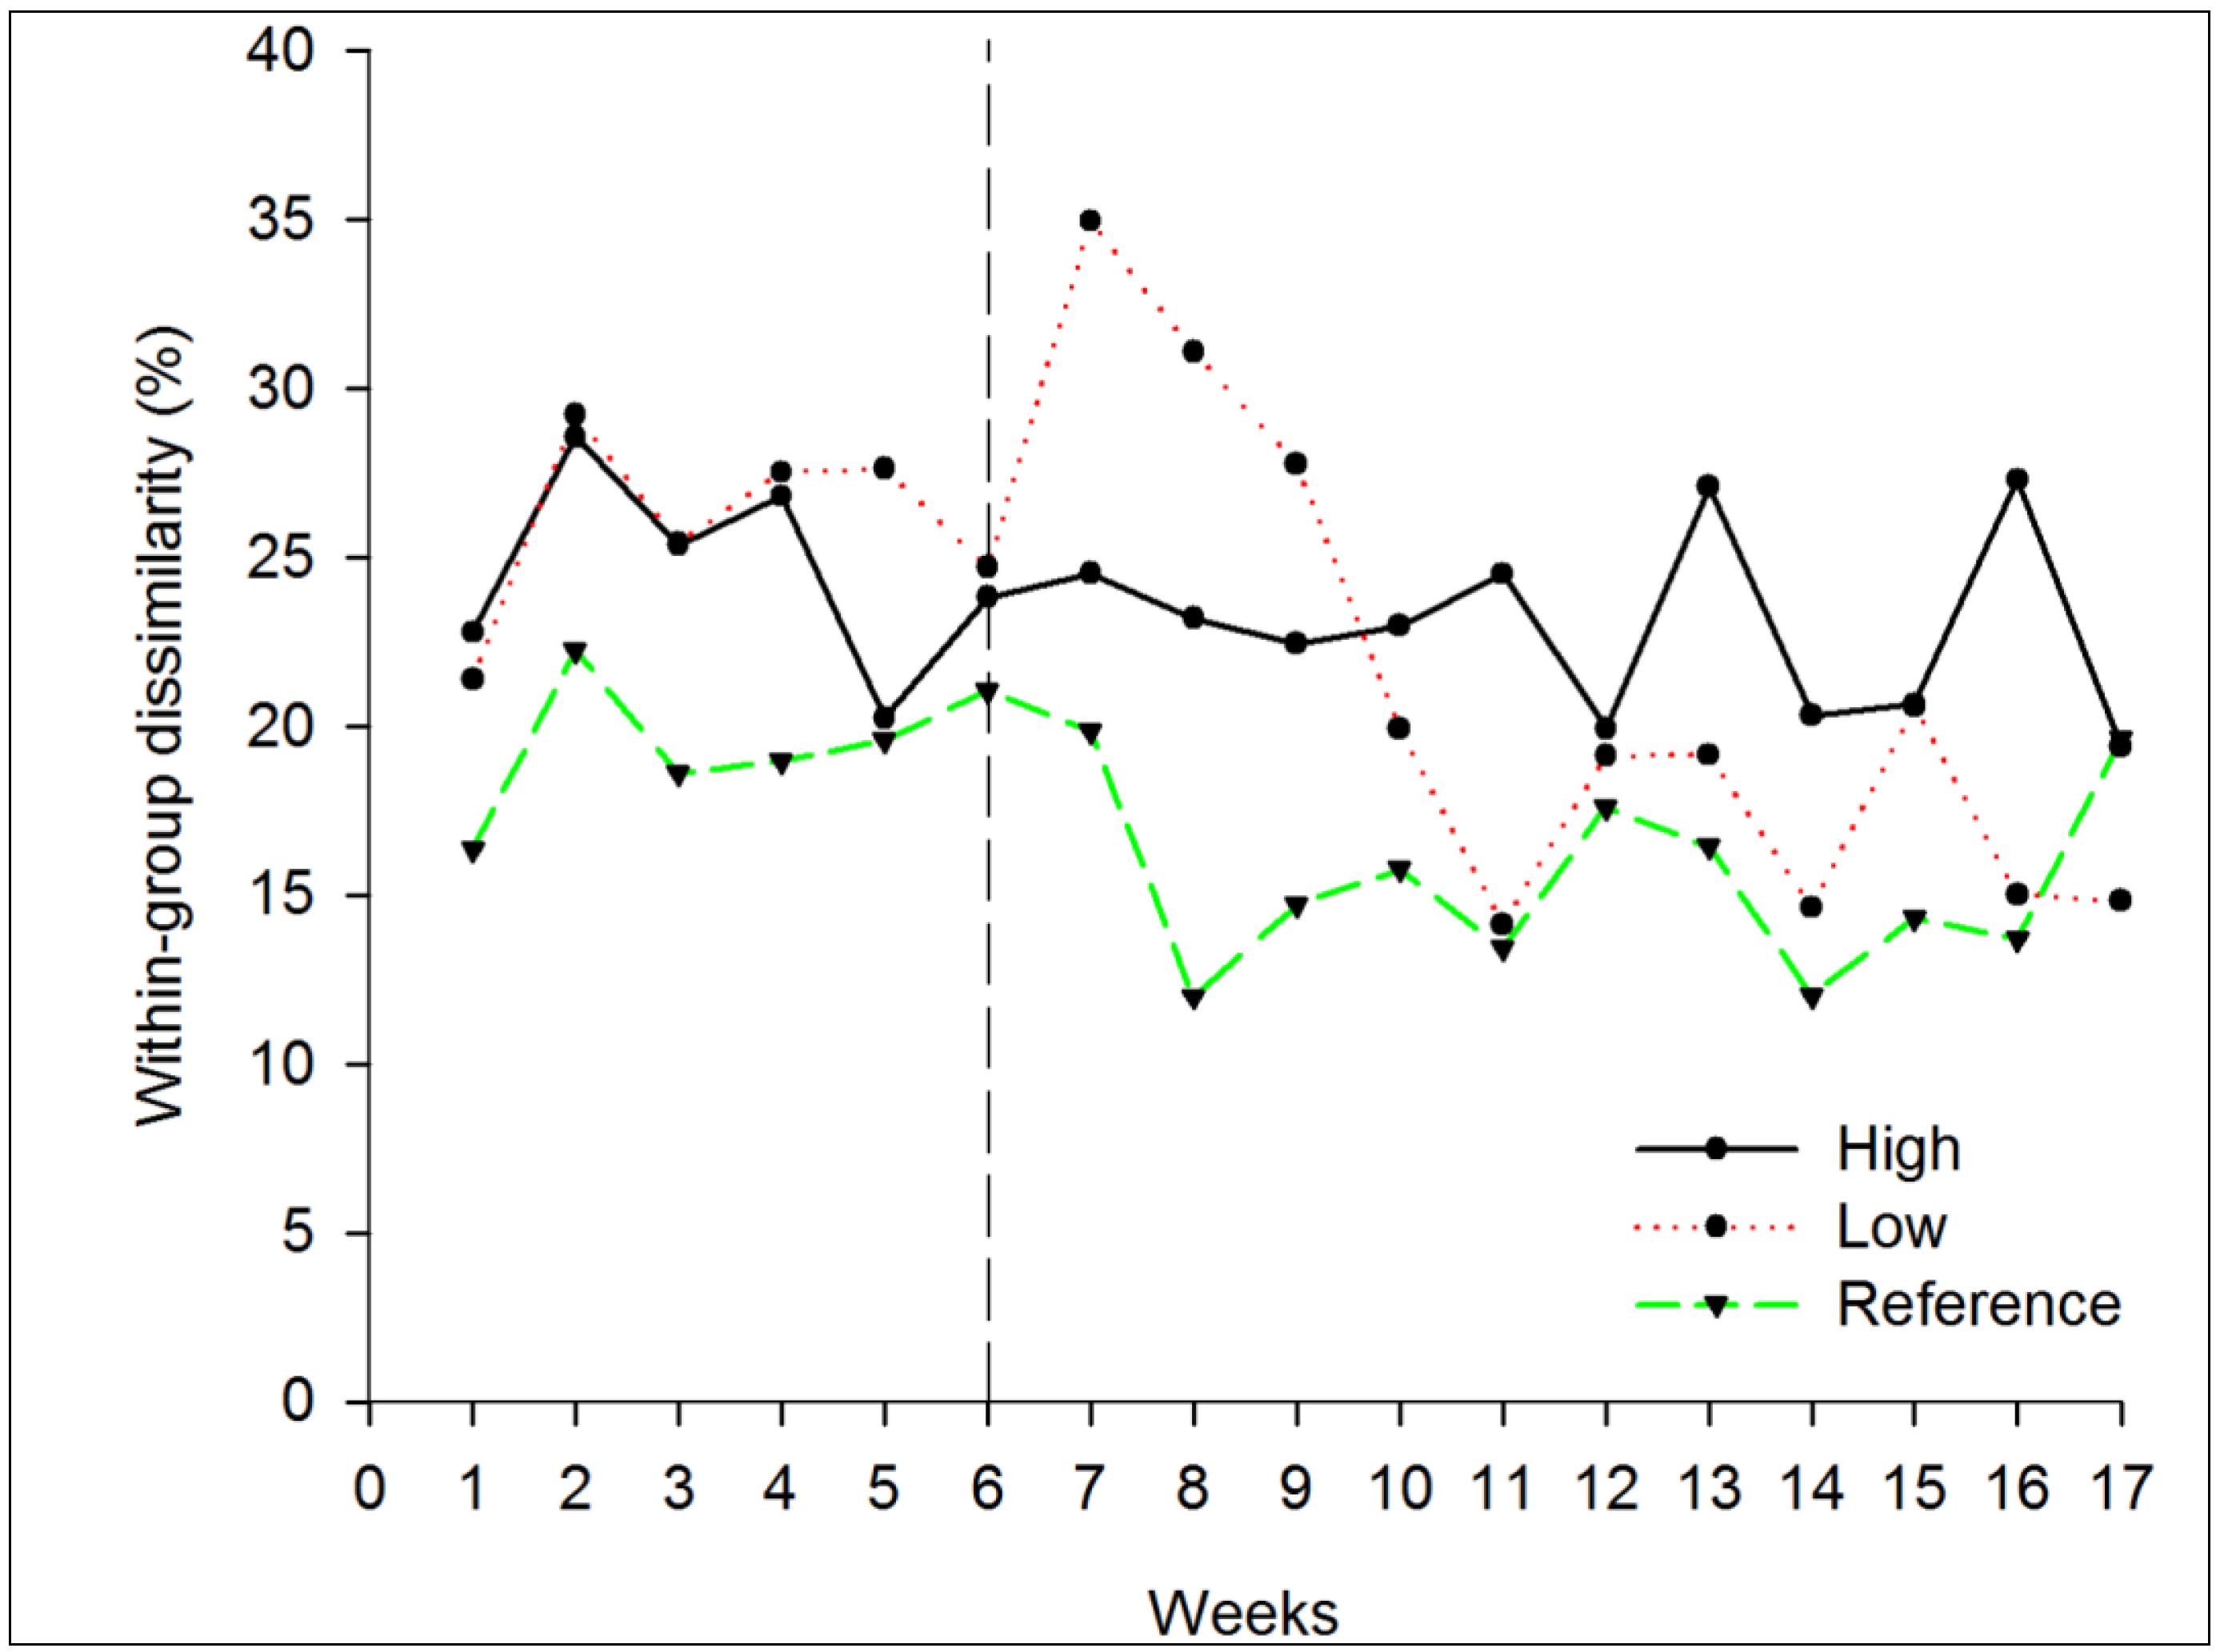
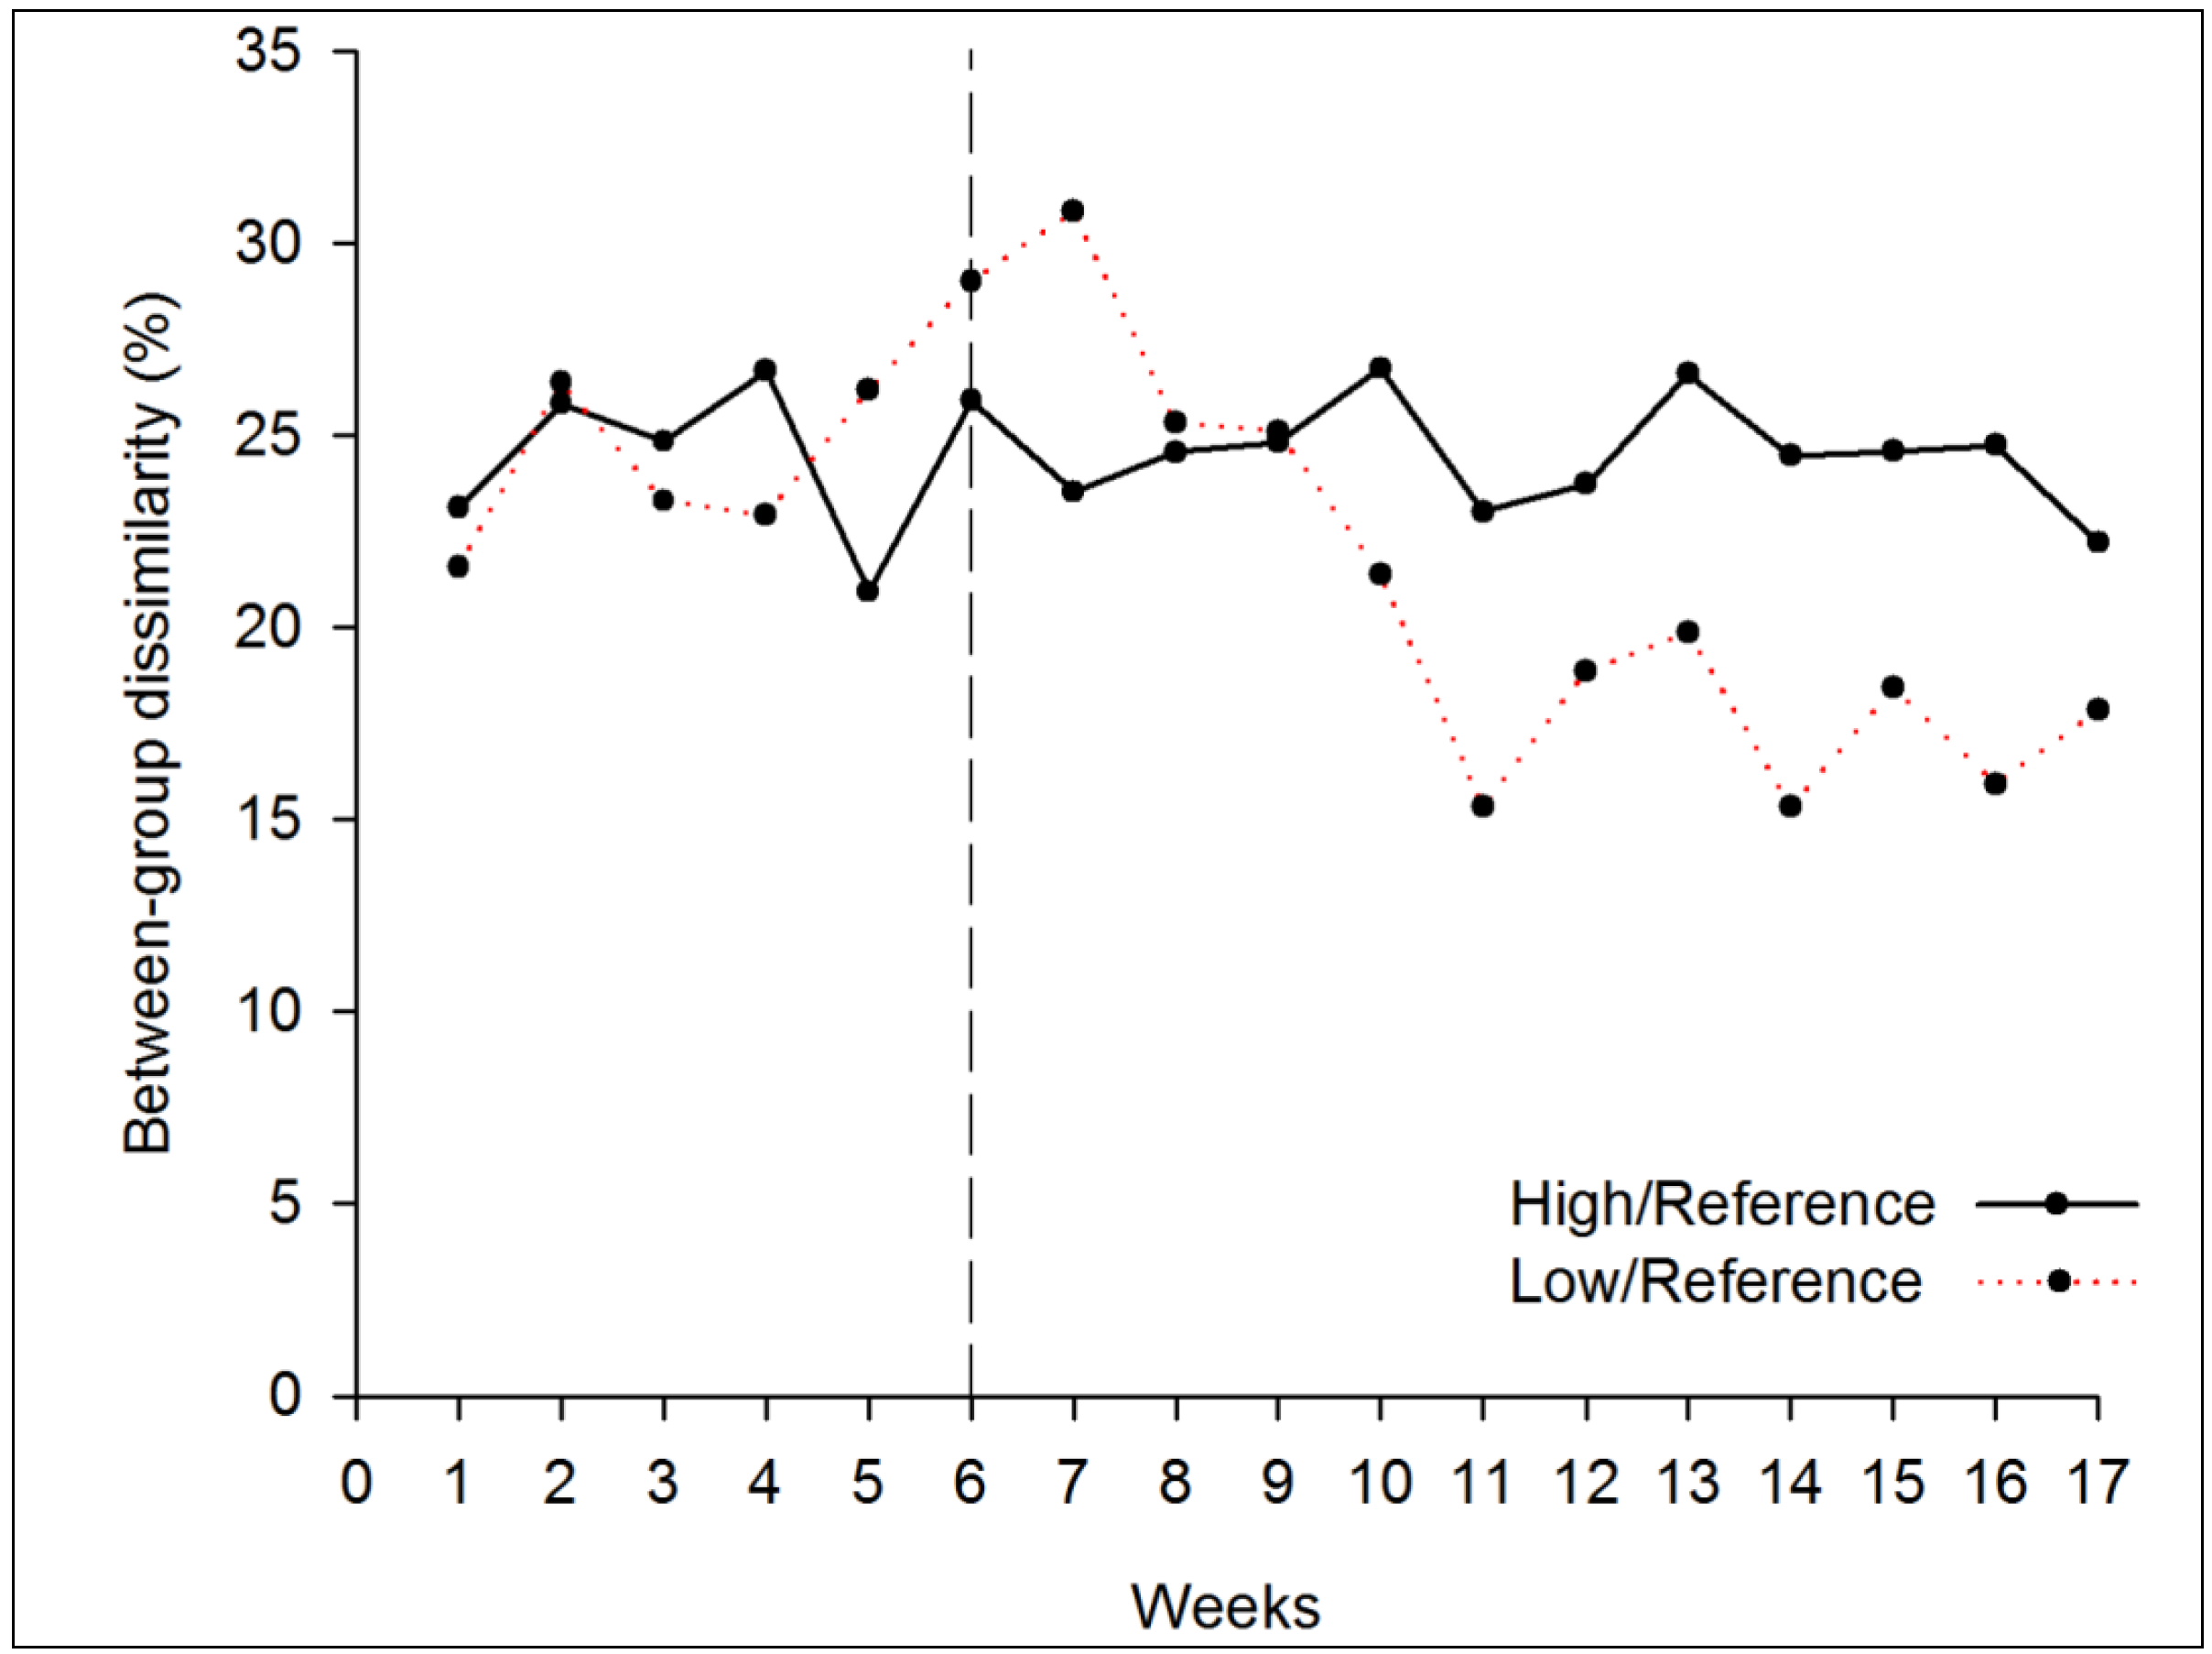
3.2.2. Beta Diversity

PERMDISP revealed differences in multivariate dispersion among treatments (Regime and Period levels combined; F5;234 = 30.134, p < 0.001). Pair-wise comparisons showed that dispersion in communities under high and low disturbances regimes, before draining, was not significantly different from one other and that their dispersion was significantly greater than the dispersion in reference rock pools. Draining lead to a decrease in dispersion in rock pools under low regimes so that dispersion became significantly lower than dispersion under high regime. Dispersion in disturbed rock pools remained, nevertheless, greater than in reference rock pools (Figure 1b). SIMPER depicted similar differences among within-group dissimilarities (Figure 4). Moreover, unlike nutrient enrichment, disturbance by draining induced important between-group dissimilarity between high regime/reference rock pools and low regime/reference rock pools (Figure 5). After week 7, rock pools disturbed at high regime became more dissimilar to reference rock pools than rock pools disturbed at low regimes. Dissimilarity between high regime/reference rock pools at the beginning of the experiment was around 20%–30% and levelled off to 25% after disturbances. Over the same period, dissimilarities between pools drained at low regime and reference decreased to 15%–20%. Between-group dissimilarities were mostly attributable to the more rare taxa (based on a pre-comparison of the between-group dissimilarities after a fourth-root transformation and after the analysis with no transformation applied on the data to down weight the influence of common taxa; results not shown).
Figure 3. Mean taxa richness (mean ± SE) before and after the beginning of disturbances by draining. Before = black; After = cyan; High = nutrients added every diurnal low tide; Low = nutrients added six times during the period; Reference = no nutrient added. Different letters indicate statistically significant difference between regimes.
Diversity 06 00001 g003
We observed considerable natural temporal and spatial variability in community structure among and within rock pools, consistent with variability documented in the literature [38,53]. Stochasticity in community assembly dynamics is expected to generate considerably high site-to-site variation when the diversity in the regional pool is higher than the local richness [3]. The impact of anthropogenic disturbances can consequently be difficult to dissociate from naturally occurring phenomena, due to a superposition of effects [54]. Despite great natural variability, our study showed that beta diversity was more efficient than alpha diversity to detect disturbances. Moreover, high and low disturbance regimes induced opposite effects on beta diversity, but the direction of those effects, an increase or decrease, changed following draining or nutrient enrichment.
Contrary to our first hypothesis, disturbance through nutrient enrichment did not alter alpha diversity. Increases in taxa richness in the three treatments over time can easily be attributable to the period of seasonal growth. However, nutrient enrichment significantly affected spatial beta diversity. A distinction between disturbance effects on alpha and beta diversity was also noticed in a study of the patterns of spatial variability at various scales in epiphytes of the seagrass Posidonia oceanica subjected to urban and industrial sewage [55]. In this study, beta diversity indices performed better than alpha diversity indices in distinguishing community assembly processes [56,57]. In the present study, greater beta diversity was observed among rock pools disturbed at a low regime with nutrient enrichment relative to reference rock pools. However, equivalent or slightly decreased beta diversity was observed among rock pools disturbed at high regimes compared to reference rock pools. We therefore did not reject our second hypothesis following enrichment, as both disturbance regimes indeed had different and opposite effects on beta diversity. Similar results have been mentioned in the literature [30]. Fraschetti et al. [31] suggested a unimodal hump-shaped relationship along a gradient of disturbance severity at a small scale, similar to the intermediate disturbance hypothesis [8,9]. They argued that at lower and higher severities of disturbance, the patchiness is less important than at an intermediate level. A uniform distribution of damage among replicates might explain the higher similarity at a greater severity of disturbance on their sites, while in absence of disturbance, the natural homogeneity of communities allowed for a low degree of variability [31]. One index in our study not only showed lower beta diversity among rock pools disturbed at high regime compared to those disturbed at low regime, but highlighted a beta diversity even lower than the one seen among reference rock pools. This finding, based on visual examination of the plots as performed in Warwick and Clarke [22], would necessitate further investigation. However, we are confident with these results, as similar observations have been discussed in the literature. Disturbances add extra environmental filters and thus impose strong selection from the regional species pool, consequently reducing beta diversity considerably [3]. The high disturbance regime might have homogenized the taxa distribution while the low regime induced greater stochasticity. This pattern was also observed by Terlizzi et al. [58], with the greatest similarity being recorded close to the sewage outfall, the lowest similarity at sites located about 100–300 m apart that were probably less frequently disturbed, and the intermediate values being found at control sites.
The addition of nutrients did not open space to potential colonizers through mortality of residents, nor did it negatively affect the richness or the community structure within the rock pools. In other words, nutrient enrichment did not impose selection on taxa as draining did. Instead, nutrient addition mainly provoked a change in the variance to mean ratio for particular taxa, following the four mechanisms mentioned by Warwick and Clarke [22] to explain change in assemblage variability. Nutrient enrichment would have benefited specific opportunistic taxa that could best respond to the additional inputs. It is known, for instance, that the diatom Berkeleya rutilans has a high demand for nitrogen and thus responds positively to inputs of nutrients [59].
Draining and nutrient enrichment did not induce the same effects on alpha and beta diversity of benthic communities. Draining affected alpha diversity more strongly than nutrient enrichment did. After the beginning of the disturbances, rock pools not submitted to a high regime of drainage increased in their taxa richness, which remained slightly under their pre-disturbance state. Draining at high regimes thus eliminated or greatly reduced the growth of some algae taxa, such as the encrusting calcareous Rhodophyta Clathromorphum circumscriptum, the erected Phaeophyta Fucus distichus edentatus and the encrusting Phaeophyta Ralfsia fungiformis and Ralfsia verrucosa (personal observation). Observations in the field suggested that more taxa would have been eliminated if there had not been an influx of water in small crevices allowing taxa to survive. Rock pools drained at low regimes reacted similarly to reference rock pools. However, none of the alpha diversity indices has clearly identified the presence of both disturbance regimes when compared to a reference system.
Figure 4. Within-group dissimilarity in rock pools disturbed by draining. The black vertical line represents the beginning of the disturbances. High = draining every diurnal low tide; Low = draining six times during the period, Reference = no draining. Note that high within-group dissimilarity is associated with high beta diversity.
Diversity 06 00001 g004
Draining had an opposite effect on beta diversity to nutrient enrichment. Beta diversity within the rock pool community remained high at high regimes of draining compared to reference rock pools, while it decreased at low regimes compared to reference rock pools. The persistence of non-tolerant taxa in crevices may partly explain the greater patchiness observed in rock pools submitted to a high regime of draining. Furthermore, draining modified between-group dissimilarity through changes in taxa richness and community structure of rock pools. The observed between-group dissimilarity was mainly attributable to rare taxa. It is known that many rocky shore organisms are tolerant to a wide range of stresses, including anthropogenic ones [60]. More rare taxa, therefore, were likely less adapted to the intertidal fluctuations and thus more prone to be affected by disturbances.

4. Conclusions

Our results show that disturbance regimes differently influenced beta diversity of rock pool communities, with an increase or decrease in beta diversity depending on the type of disturbance. As mentioned above, disturbances could induce a shift from stochastic to deterministic community assembly with distinct responses to disturbance in terms of beta diversity [3]. However, the specific pattern of this shift differs depending on the disturbance type and consequently modulates the disturbance regimes-beta diversity relationship [61]. Our study also adds to the synthesis of how disturbances affect beta diversity by Fraterrigo and Rusak [18], who recognized their model performed poorly in predicting the impact of chronic events. The current experimental design did not allow the distinction between frequency and intensity. The elaboration of an appropriate design to test for the interaction between both regimes of disturbance, with an adjustment to ensure equivalent total intensity levels over each frequency level, would be a further step towards understanding the impact of disturbance on beta diversity. Moreover, the existing literature demonstrates that organisms would respond differently according to the extent of the spatial and/or temporal scale at which disturbances occur [18,26,52,62]. In summary, we emphasize the need to consider several aspects of disturbance regimes and their impact on both alpha and beta diversity. It seems illogical to only consider alpha diversity or mean values of abundance or size when attempting to quantify the impact of disturbances [11,12,13].
Figure 5. Between-group dissimilarity in rock pools disturbed by draining. The black vertical line represents the beginning of the disturbances. High = draining every diurnal low tide; Low = draining six times during the period; Reference = no draining.
Diversity 06 00001 g005
A change of beta diversity could not only be an indicator of stressed communities but could also be used as an early-warning signal of a critical transition of a system. Prior to a shift to an alternative state, symptoms can be recognized as a system approaches the tipping point of this transition [21]. System dynamics critically slow down at the edge of tipping point, which result in slower recovery and higher impact of environmental variation and disturbances. Recent work specifically testing the robustness of variance as an early-signal concluded that, even if potentially useful, it is not generic as it increases or decreases according to the situation [63]. Our experimental design did not specifically test for the detection of upcoming tipping points, but the observed changes in variance in rock pools according to disturbance types and regimes agree with the theory of early-warning signals. We recommend further efforts be pursued to develop indicators based on beta diversity, as it clearly seems to surpass alpha diversity in detecting community changes. Gradually, it will improve our ability to limit disturbance impacts on ecosystem functioning and anticipate critical transitions, thereby contributing to the advancement of ultimate objectives of improving our assessment tool in conservation and ecosystem management.

Acknowledgments

Special thanks to Pauline Robert, Valérie Bélanger, Cindy Grant, Adeline Piot, and Francis Jacques for helping in the field, and to Robert Chabot for specimen identification. Annie Séguin was supported by an NSERC (Natural Sciences and Engineering Research Council of Canada) scholarship. This project was funded by NSERC and the strategic network CHONe (Canadian Healthy Oceans Network) to Philippe Archambault This project is a contribution to the research program of Québec-Océan.

Conflicts of Interest

The authors declare no conflict of interest.

References

  1. Sousa, W.P. The role of disturbance in natural communities. Annu. Rev. Ecol. Syst. 1984, 15, 353–391. [Google Scholar]
  2. White, P.S.; Pickett, S.T.A. Natural Disturbance and Patch Dynamics: An Introduction. In The Ecology of Natural Disturbance and Patch Dynamics; Pickett, S.T.A., White, P.S., Eds.; Academic press: Orlando, FL, USA, 1985; pp. 3–13. [Google Scholar]
  3. Chase, J.M. Drought mediates the importance of stochastic community assembly. Proc. Natl. Acad. Sci. USA 2007, 104, 17430–17434. [Google Scholar] [CrossRef]
  4. Gravel, D.; Guichard, F.; Hochberg, M.E. Species coexistence in a variable world. Ecol. Lett. 2011, 14, 828–839. [Google Scholar] [CrossRef]
  5. Paine, R.T. Food web complexity and species diversity. Am. Nat. 1966, 100, 65–75. [Google Scholar]
  6. Tilman, D. Competition and biodiversity in spatially structured habitats. Ecology 1994, 75, 2–16. [Google Scholar] [CrossRef]
  7. Cadotte, M.W. Competition-colonization trade-offs and disturbance effects at multiple scales. Ecology 2007, 88, 823–829. [Google Scholar] [CrossRef]
  8. Grime, J.P. Competitive exclusion in herbaceous vegetation. Nature 1973, 242, 344–347. [Google Scholar] [CrossRef]
  9. Connell, J.H. Diversity in tropical rain forests and coral reefs. Science 1978, 199, 1302–1310. [Google Scholar]
  10. Legendre, P.; Borcard, D.; Peres-Neto, P.R. Analyzing beta diversity: Partitioning the spatial variation of community composition data. Ecol. Monogr. 2005, 75, 435–450. [Google Scholar] [CrossRef]
  11. Underwood, A.J. On Beyond BACI: Sampling designs that might reliably detect environmental disturbances. Ecol. Appl. 1994, 4, 3–15. [Google Scholar] [CrossRef]
  12. Underwood, A.J. Beyond BACI: the detection of environmental impacts on populations in the real, but variable, world. J. Exp. Mar. Biol. Ecol. 1992, 161, 145–178. [Google Scholar] [CrossRef]
  13. Underwood, A.J. Beyond BACI: Experimental-designs for detecting human environmental impacts on temporal variations in natural-populations. Aust. J. Mar. Fresh. Res. 1991, 42, 569–587. [Google Scholar] [CrossRef]
  14. Bertocci, I.; Araújo, R.; Vaselli, S.; Sousa-Pinto, I. Marginal populations under pressure: spatial and temporal heterogeneity of Ascophyllum nodosum and associated assemblages affected by human trampling in Portugal. Mar. Ecol. Prog. Ser. 2011, 439, 73–82. [Google Scholar]
  15. Krasnov, B.R.; Mouillot, D.; Shenbrot, G.I.; Khokhlova, I.S.; Poulin, R. Beta-specificity: The turnover of host species in space and another way to measure host specificity. Int. J. Parasitol. 2011, 41, 33–41. [Google Scholar] [CrossRef]
  16. Benedetti-Cecchi, L. The importance of the variance around the mean effect size of ecological processes. Ecology 2003, 84, 2335–2346. [Google Scholar] [CrossRef]
  17. Lindegarth, M.; Valentinsson, D.; Hansson, M.; Ulmestrand, M. Effects of trawling disturbances on temporal and spatial structure of benthic soft-sediment assemblages in Gullmarsfjorden, Sweden. ICES J. Mar. Sci. 2000, 57, 1369–1376. [Google Scholar] [CrossRef]
  18. Fraterrigo, J.M.; Rusak, J.A. Disturbance-driven changes in the variability of ecological patterns and processes. Ecol. Lett. 2008, 11, 756–770. [Google Scholar] [CrossRef]
  19. Landres, P.B.; Morgan, P.; Swanson, F.J. Overview of the use of natural variability concepts in managing ecological systems. Ecol. Appl. 1999, 9, 1179–1188. [Google Scholar]
  20. Ellingsen, K.; Gray, J.S. Spatial patterns of benthic diversity: is there a latitudinal gradient along the Norwegian continental shelf? J. Anim. Ecol. 2002, 71, 373–389. [Google Scholar] [CrossRef]
  21. Scheffer, M.; Bascompte, J.; Brock, W.A.; Brovkin, V.; Carpenter, S.R.; Dakos, V.; Held, H.; van Nes, E.H.; Rietkerk, M.; Sugihara, G. Early-warning signals for critical transitions. Nature 2009, 461, 53–59. [Google Scholar] [CrossRef]
  22. Warwick, R.M.; Clarke, K.R. Increased variability as a symptom of stress in marine communities. J. Exp. Mar. Bio. Ecol. 1993, 172, 215–226. [Google Scholar] [CrossRef]
  23. Chapman, M.G.; Underwood, A.J.; Skilleter, G.A. Variability at different spatial scales between a subtidal assemblage exposed to the discharge of sewage and two control assemblages. J. Exp. Mar. Biol. Ecol. 1995, 189, 103–122. [Google Scholar] [CrossRef]
  24. Caswell, H.; Cohen, J.E. Communities in Patchy Environments: A Model of Disturbance, Competition, and Heterogeneity. In Ecological Heterogeneity; Kolasa, J., Pickett, S.T.A., Eds.; Springer-Verlag: New York, NY, USA, 1991; pp. 97–122. [Google Scholar]
  25. Cervin, G.; Lindegarth, M.; Viejo, R.M.; Aberg, P. Effects of small-scale disturbances of canopy and grazing on intertidal assemblages on the Swedish west coast. J. Exp. Mar. Biol. Ecol. 2004, 302, 35–49. [Google Scholar] [CrossRef]
  26. Terlizzi, A.; Benedetti-Cecchi, L.; Bevilacqua, S.; Fraschetti, S.; Guidetti, P.; Anderson, M.J. Multivariate and univariate asymmetrical analyses in environmental impact assessment: a case study of Mediterranean subtidal sessile assemblages. Mar. Ecol. Prog. Ser. 2005, 289, 27–42. [Google Scholar] [CrossRef]
  27. Dye, A.H. Persistent effects of physical disturbance on meiobenthos in mangrove sediments. Mar. Environ. Res. 2006, 62, 341–355. [Google Scholar] [CrossRef]
  28. Garpe, K.C.; Yahya, S.A.S.; Lindahl, U.; Ohman, M.C. Long-term effects of the 1998 coral bleaching event on reef fish assemblages. Mar. Ecol. Prog. Ser. 2006, 315, 237–247. [Google Scholar] [CrossRef]
  29. Wildsmith, M.; Rose, T.; Potter, I.; Warwick, R.; Clarke, K.; Valesini, F.J. Changes in the benthic macroinvertebrate fauna of a large microtidal estuary following extreme modifications aimed at reducing eutrophication. Mar. Pollut. Bull. 2009, 58, 1250–1262. [Google Scholar] [CrossRef]
  30. Archambault, P.; Banwell, K.; Underwood, A.J. Temporal variation in the structure of intertidal assemblages following the removal of sewage. Mar. Ecol. Prog. Ser. 2001, 222, 51–62. [Google Scholar] [CrossRef]
  31. Fraschetti, S.; Bianchi, C.N.; Terlizzi, A.; Fanelli, G.; Morri, C.; Boero, F. Spatial variability and human disturbance in shallow subtidal hard substrate assemblages: a regional approach. Mar. Ecol. Prog. Ser. 2001, 212, 1–12. [Google Scholar] [CrossRef]
  32. Bishop, M.J.; Underwood, A.J.; Archambault, P. Sewage and environmental impacts on rocky shores: necessity of identifying relevant spatial scales. Mar. Ecol. Prog. Ser. 2002, 236, 121–128. [Google Scholar] [CrossRef]
  33. Collins, S.L. Disturbance frequency and community stability in native tallgrass prairie. Am. Nat. 2000, 155, 311–325. [Google Scholar] [CrossRef]
  34. Elmqvist, T.; Folke, C.; Nyström, M.; Peterson, G.; Bengtsson, J.; Walker, B.; Norberg, J. Response diversity, Ecosystem change, and resilience. Front. Ecol. Environ. 2003, 1, 488–494. [Google Scholar] [CrossRef]
  35. Tewfik, A.; Guichard, F.; McCann, K.S. Influence of acute and chronic disturbance on macrophyte landscape zonation. Mar. Ecol. Prog. Ser. 2007, 335, 111–121. [Google Scholar] [CrossRef]
  36. Metaxas, A.; Scheibling, R.E. Community structure and organization of tidepools. Mar. Ecol. Prog. Ser. 1993, 98, 187–198. [Google Scholar] [CrossRef]
  37. Hunt, H.L.; Scheibling, R.E. Structure and dynamics of mussel patches in tidepools on a rocky shore in Nova Scotia, Canada. Mar. Ecol. Prog. Ser. 1995, 124, 105–115. [Google Scholar] [CrossRef]
  38. Underwood, A.J.; Skilleter, G.A. Effects of patch-size on the structure of assemblages in rock pools. J. Exp. Mar. Biol. Ecol. 1996, 197, 63–90. [Google Scholar] [CrossRef]
  39. O’Connor, N.E.; Crowe, T.P. Biodiversity loss and ecosystem functioning: Distinguishing between number and identity of species. Ecology 2005, 86, 1783–1796. [Google Scholar] [CrossRef]
  40. Benedetti-Cecchi, L.; Cinelli, F. Patterns of disturbance and recovery in littoral rock pools: Nonhierarchical competition and spatial variability in secondary succession. Mar. Ecol. Prog. Ser. 1996, 135, 145–161. [Google Scholar] [CrossRef]
  41. Bergeron, P.; Bourget, E. Shore topography and spatial partitioning of crevice refuges by sessile epibenthos in an ice disturbed environment. Mar. Ecol. Prog. Ser. 1986, 28, 129–145. [Google Scholar] [CrossRef]
  42. Archambault, P.; Bourget, E. Influence of shoreline configuration on spatial variation of meroplanktonic larvae, recruitment and diversity of benthic subtidal communities. J. Exp. Mar. Biol. Ecol. 1999, 238, 161–184. [Google Scholar] [CrossRef]
  43. Smith, G.K.; Guichard, F.; Petrovic, F.; McKindsey, C.W. Using spatial statistics to infer scales of demographic connectivity between populations of the blue mussel, Mytilus spp. Limnol. Oceanogr. 2009, 54, 970–977. [Google Scholar] [CrossRef]
  44. Poulin, P. Cycle biogéochimique de l’azote dans l’estuaire du Saint-Laurent; rôle des marais côtiers. Ph.D. Thesis, Université du Québec à Rimouski, Rimouski, Canada, 2008. [Google Scholar]
  45. Aminot, A.; Kérouel, R. Hydrologie des écosystèmes marins: paramètres et analyses; (in French). Ifremer: Plouzané, France, 2004; pp. 215–282. [Google Scholar]
  46. Anderson, M.J. Distance-based tests for homogeneity of multivariate dispersions. Biometrics 2006, 62, 245–253. [Google Scholar] [CrossRef]
  47. Anderson, M.J.; Ellingsen, K.E.; McArdle, B.H. Multivariate dispersion as a measure of beta diversity. Ecol. Lett. 2006, 9, 683–693. [Google Scholar] [CrossRef]
  48. Anderson, M.J. A new method for non-parametric multivariate analysis of variance. Austral Ecol. 2001, 26, 32–46. [Google Scholar]
  49. Anderson, M.J.; Gorley, R.N.; Clarke, K.R. PERMANOVA + for PRIMER: Guide to Software and Statistical Methods; PRIMER-E: Plymouth, UK, 2008; pp. 87–104. [Google Scholar]
  50. Clarke, K.R. Nonparametric multivariate analyses of changes in community structure. Austral Ecol. 1993, 18, 117–143. [Google Scholar] [CrossRef]
  51. Clarke, K.R.; Green, R.H. Statistical design and analysis for a biological effects study. Mar. Ecol. Prog. Ser. 1988, 46, 213–226. [Google Scholar] [CrossRef]
  52. Gaston, K.J.; Mcardle, B.H. The temporal variability of animal abundances: Measures, Methods and patterns. Philos T. Roy. Soc. B. 1994, 345, 335–358. [Google Scholar] [CrossRef]
  53. Archambault, P.; Bourget, E. Scales of coastal heterogeneity and benthic intertidal species richness, Diversity and abundance. Mar. Ecol. Prog. Ser. 1996, 136, 111–121. [Google Scholar] [CrossRef]
  54. Apitz, S.E.; Degetto, S.; Cantaluppi, C. The use of statistical methods to separate natural background and anthropogenic concentrations of trace elements in radio-chronologically selected surface sediments of the Venice Lagoon. Mar. Pollut. Bull. 2009, 58, 402–414. [Google Scholar] [CrossRef]
  55. Piazzi, L.; Balata, D.; Cinelli, F.; Benedetti-Cecchi, L. Patterns of spatial variability in epiphytes of Posidonia oceanica - Differences between a disturbed and two reference locations. Aquat. Bot. 2004, 79, 345–356. [Google Scholar] [CrossRef]
  56. Münkemüller, T.; de Bello, F.; Meynard, C.; Gravel, D.; Lavergne, S.; Mouillot, D.; Mouquet, N.; Thuiller, W. From diversity indices to community assembly processes: A test with simulated data. Ecography 2012, 35, 468–480. [Google Scholar] [CrossRef]
  57. Drouin, A.; Sirois, P.; Archambault, P. Discriminating zooplankton communities in lakes with brook trout (Salvelinus. fontinalis) and in fishless lakes. Ecoscience 2009, 16, 271–281. [Google Scholar] [CrossRef]
  58. Terlizzi, A.; Fraschetti, S.; Guidetti, P.; Boero, F. The effects of sewage discharge on shallow hard substrate sessile assemblages. Mar. Pollut. Bull. 2002, 44, 544–550. [Google Scholar] [CrossRef]
  59. Hillebrand, H.; Sommer, U. Response of epilithic microphytobenthos of the Western Baltic Sea to in situ experiments with nutrient enrichment. Mar. Ecol. Prog. Ser. 1997, 160, 35–46. [Google Scholar] [CrossRef] [Green Version]
  60. Crowe, T.P.; Thompson, R.C.; Bray, S.; Hawkins, S.J. Impacts of anthropogenic stress on rocky intertidal communities. J. Aquat. Ecosyst. Stress Recov. 2000, 7, 273–297. [Google Scholar] [CrossRef]
  61. Lepori, F.; Malmqvist, B. Deterministic control on community assembly peaks at intermediate levels of disturbance. Oikos 2009, 118, 471–479. [Google Scholar] [CrossRef]
  62. Petraitis, P.S.; Methratta, E.T. Using patterns of variability, to test for multiple community states on rocky intertidal shores. J. Exp. Mar. Biol. Ecol. 2006, 338, 222–232. [Google Scholar] [CrossRef]
  63. Dakos, V.; van Nes, E.H.; D’Odorico, P.; Scheffer, M. Robustness of variance and autocorrelation as indicators of critical slowing down. Ecology 2012, 93, 264–271. [Google Scholar] [CrossRef]

