Article

Seasonal Changes in Microbial Community Structure in Freshwater Stream Sediment in a North Carolina River Basin

1
Aquatic Epidemiology and Conservation Laboratory, Department of Population Health and Pathobiology, College of Veterinary Medicine, North Carolina State University, 1060 William Moore Drive Raleigh, NC 27607, USA
2
In Silico LLC, 1634 Southcross Street, Fuquay-Varina, NC 27526, USA
*
Author to whom correspondence should be addressed.
Currently at the School of Marine Science and Ocean Engineering, University of New Hampshire, Durham, NH 03824, USA
Currently at the Department of Biochemistry and Molecular Biology, University of Georgia, Athens, GA 30602, USA
Diversity 2014, 6(1), 18-32; https://doi.org/10.3390/d6010018
Submission received: 27 October 2013 / Revised: 3 December 2013 / Accepted: 24 December 2013 / Published: 3 January 2014

Abstract

:
This study examined seasonal differences in microbial community structure in the sediment of three streams in North Carolina’s Neuse River Basin. Microbes that reside in sediment are at the base of the food chain and have a profound influence on the health of freshwater stream environments. Terminal-Restriction Fragment Length Polymorphism (T-RFLP), molecular fingerprint analysis of 16S rRNA genes was used to examine the diversity of bacterial species in stream sediment. Sediment was sampled in both wet and dry seasons from an agricultural (Bear), mixed urban (Crabtree) and forested (Marks) Creek, and the microbiota examined. Gamma, Alpha and Beta proteobacteria were prevalent species of microbial taxa represented among all sites. Actinobacteria was the next most prevalent species observed, with greater occurrence in dry compared to the wet season. Discernable clustering was observed of Marks and Bear Creek samples collected during the wetter period (September–April), which corresponded with a period of higher precipitation and cooler surface water temperatures. Although not statistically significant, microbial community structure appeared different between season (ANOSIM, R = 0.60; p < 0.10). Principal components analysis confirmed this pattern and showed that the bacterial groups were separated by wet and dry seasonal periods. These results suggest seasonal differences among the microbial community structure in sediment of freshwater streams and that these communities may respond to changes in precipitation during wetter periods.

1. Introduction

Microbial communities in freshwater streams are a diverse functional assemblage of bacteria that include prokaryotes, microeukaryotic phototrophs and heterotrophs that influence key processes in stream nutrient cycles [1]. These microbes are vital to the stream food web and changes in their structure or composition can vary on a temporal scale [2], which can have unintended consequences for stream biotic health. Low order streams are a primary link between aquatic and terrestrial systems [3]. Seasonal fluctuations in flow, temperature, the input of inorganic compounds and the suspension and deposition of allochthonous and autochthonous organic materials have the potential to alter microbial structure in freshwater streams within large urban watersheds [4]. Although temporal and spatial differences in bacterioplankton population structure have been observed in response to seasonal fluctuations in flow and related limnological conditions [5,6], stream sediment microbial structure is much less understood. Seasonal changes in rainfall can hydrologically fragment stream flow and bacterioplankton population dispersal, impacting the quality of dissolved organic matter that supports these bacterial populations [7].
Stream microorganisms that drive oxidation and nitrification are of importance to sediment habitat and benthic residents [8]. During the drier, warmer season, denitrification processes trigger microbe-mediated ecosystem processes in stream sediments and in turn can change community structure [4,9,10]. Although sediment microbial communities may demonstrate similar shifts in response to seasonal condition as those observed in bacterioplankton, few studies have linked variable seasonal influences with the microbial community structure of stream sediments. In one study, Hullar and coworkers (2006) observed seasonal changes in Gamma and Beta-proteobacteria populations in three streams over a four-year period in a Delaware drainage basin [2]. In this study we evaluated seasonal level comparisons of hyporheic microbial community structure using terminal restriction fragment length polymorphism (T-RFLP) analysis of 16S rRNA genes in sediment samples collected from three streams within North Carolina’s Neuse River Basin (NRB). Sampling was conducted across seasonal periods with the intent to characterize class level differences in bacterial community structure.

2. Methods

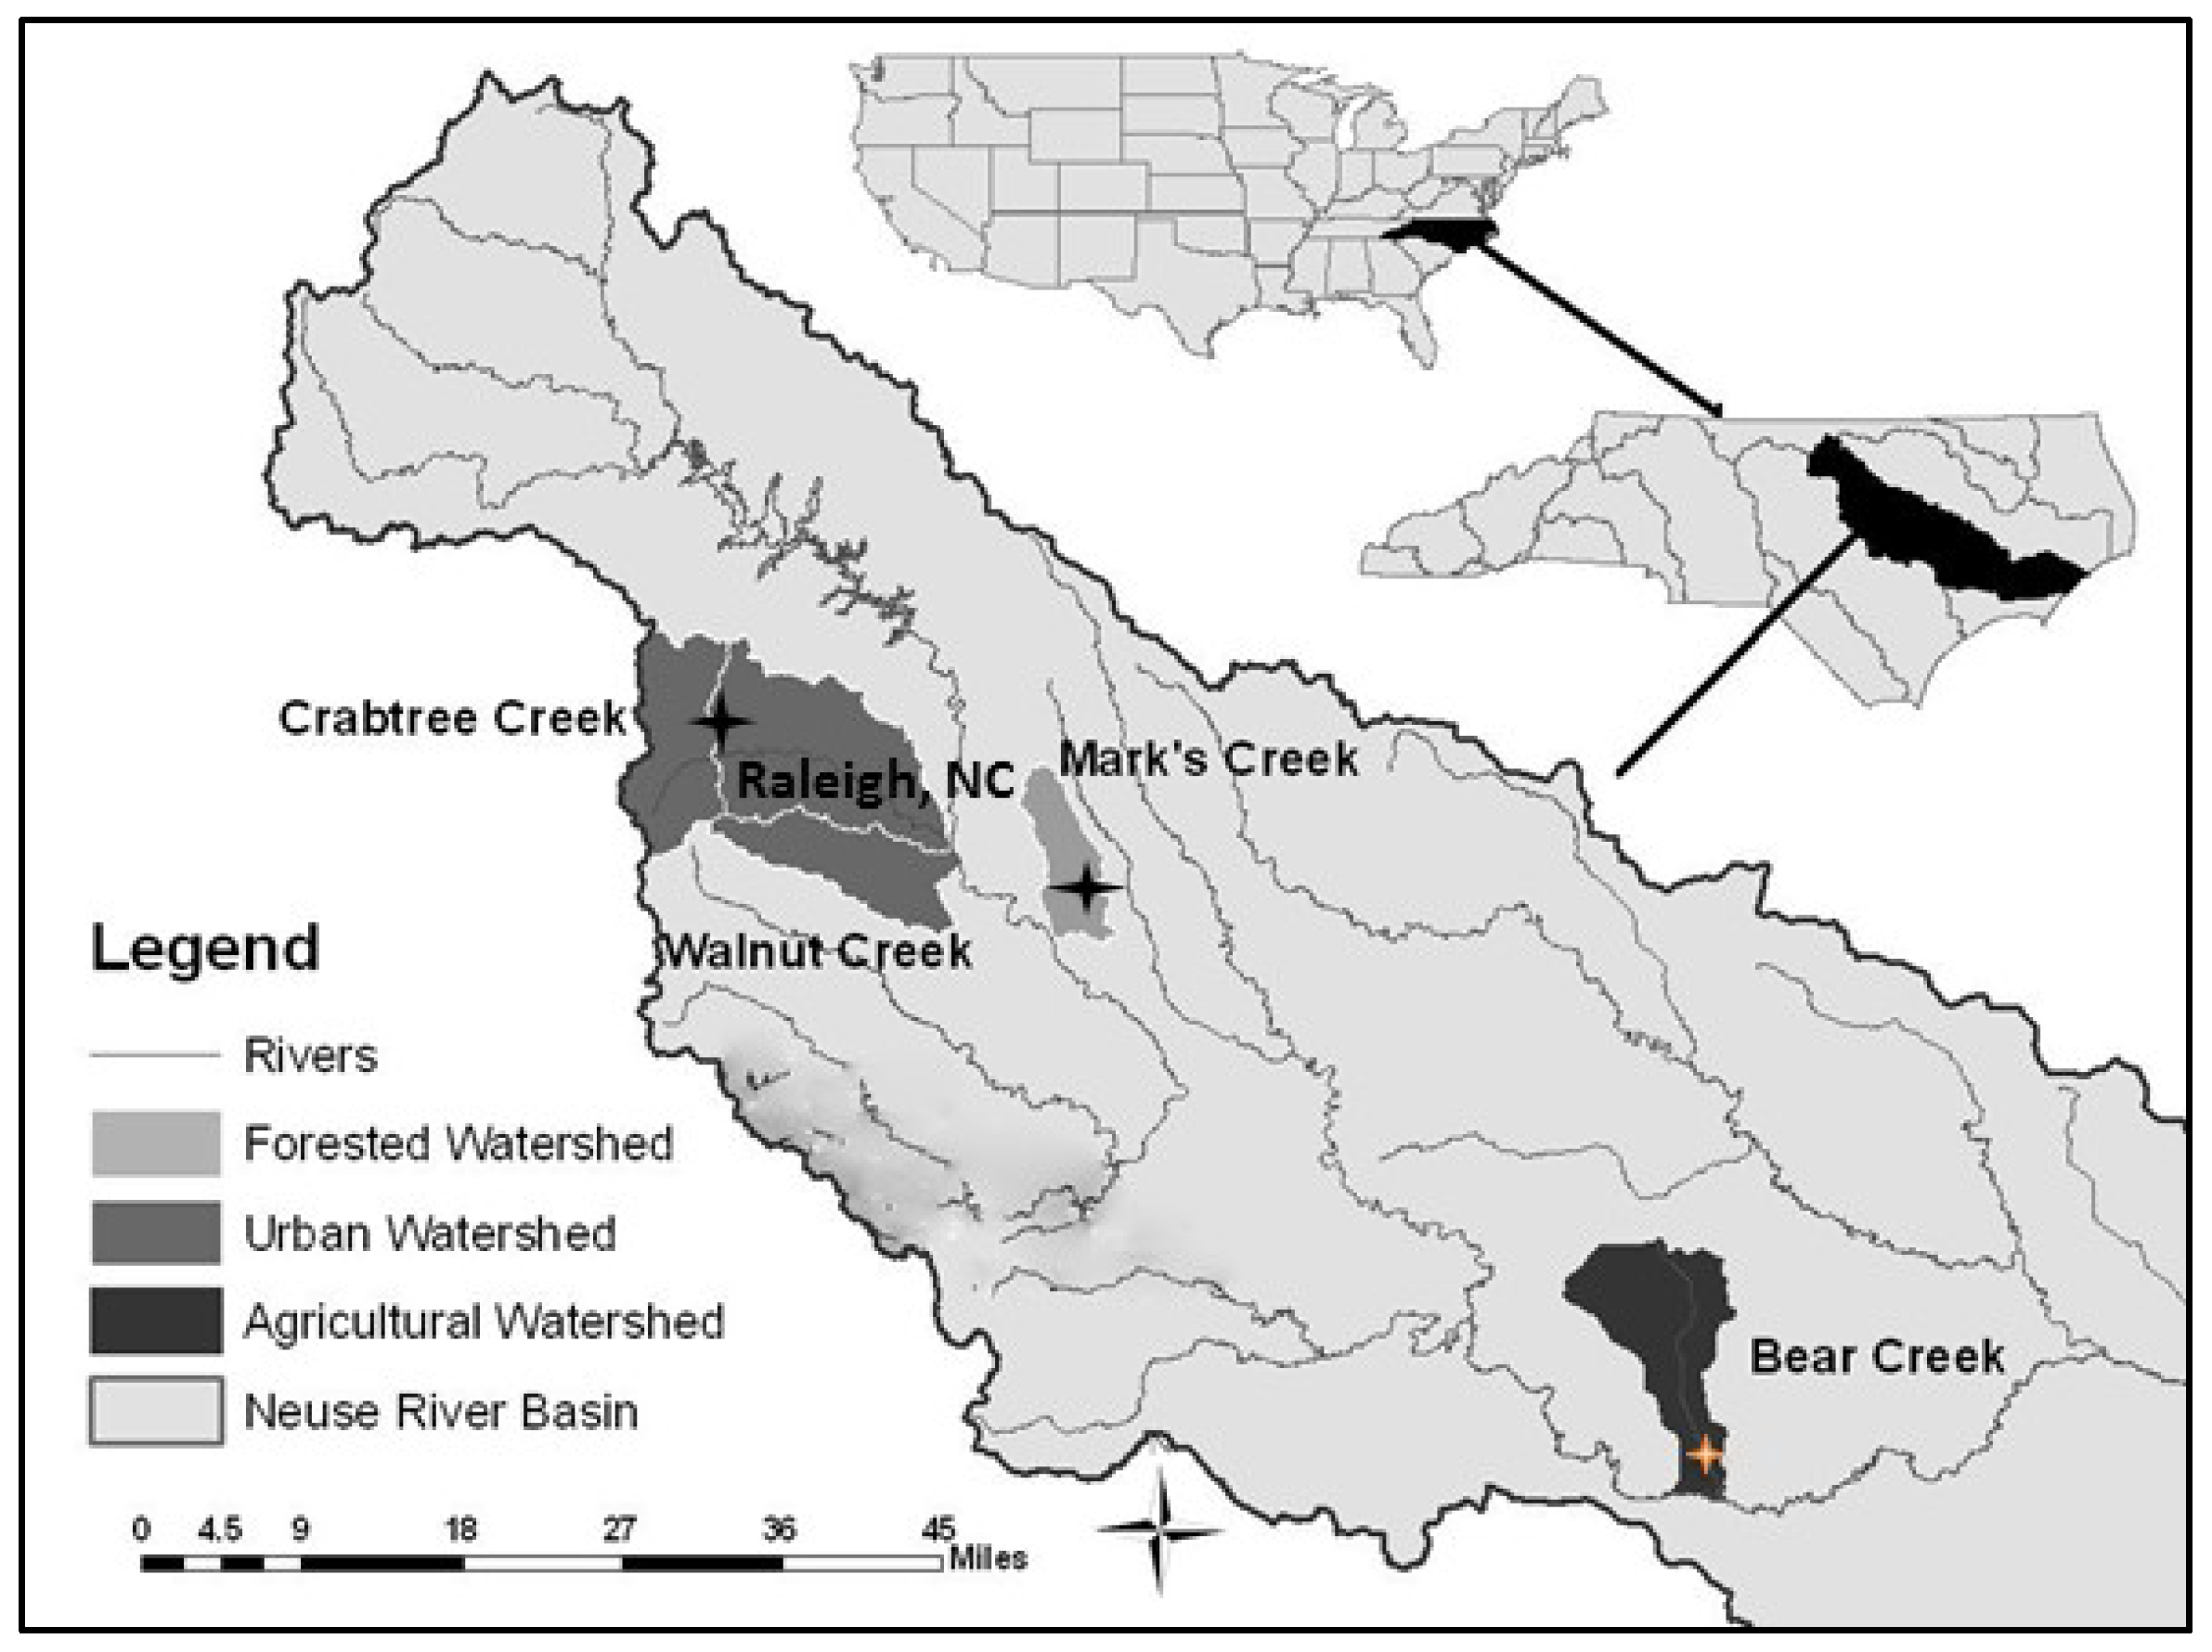
2.1. Study Area and Site Descriptions

Stream sampling sites were located in the upper Neuse River Basin (NRB), which encompasses a large area (15 km2) including metropolitan Raleigh, North Carolina. A combination of residential septic, storm water, fertilizer and animal wastewater is considered to be a major source of nitrogen to NRB watershed streams [11,12]. Nitrogen inputs are transported from point and non-point sources via streams where inorganic compounds (i.e., aqueous nitrate) enter surface water and become incorporated into sediment organic matter [13].
Three sampling sites included first order streams: Bear Creek (N 35°16.5′ W 77°47.7′), Crabtree Creek (N 35°49.3′, W 78°38.0′), and Marks Creek (N 35°42.4′, W 78°25.9′) (Figure 1).
Figure 1. Map of upper Neuse River Basin with study sites marked by star.
Diversity 06 00018 g001
Bear Creek’s surrounding watershed includes drainage from crop and intensive animal farm operations where a high concentration of nitrate is associated with frequent surface water discharge runoff. The Crabtree Creek site is in an urban watershed exposed to a major point source contributor of nitrogen downstream from a municipal wastewater facility. In contrast, Marks Creek is a smaller tributary located in the Neuse River Basin. It is in a primarily forested watershed with residential and mixed-use lands less represented. Lower nitrate concentrations have been documented for this site compared to Bear and Crabtree creeks [14]. However, the entire watershed is influenced by non-point nitrogen sources such as failing septic systems, fertilizer waste and atmospheric deposition.

2.2. Sediment Microbial Sampling

Surficial sediment (i.e., to a depth of 10 cm) was sampled at the three study sites for T-RFLP bacterial analysis during wet and dry seasons from 2007 to 2008. Seasonal periods corresponded to wetter/cooler and drier/warmer months annually. Samples were collected (in duplicate) at the shallow bank of each stream site using a hand-held PVC® coring device (JM Eagle, Los Angeles, CA, USA). Sample IDs corresponded to designated codes described in Table 1 and the same IDs were used throughout analyses. Each sample extended to approximately 2 cm below the benthic surface to capture the recent condition of the microbial community. Upon field sampling, the sediments were transferred into sealable plastic bags and placed on ice within 2 h until delivery to the laboratory then stored at −20 °C. Once in the laboratory, samples were sieved with mesh strainers to differentiate between two different sediment size fractions, coarse (4–8 mm, analogous to fine gravel) and fine (125–250 µm, analogous to fine sand) and kept frozen until microbial analysis.
Table 1. Sample identification numbers, collection dates and ambient water parameters for the three sampling sites are listed. Naming convention: The first letter signifies stream site; M = Marks Creek, B = Bear Creek, C = Crabtree Creek. Second letter signifies seasonal period in which collected; D = dry, W = wet. Numeric code is the year of collection. Lower case letters depict sediment size; c= coarse; f = fine. SWI and Evenness correspond to Shannon Weaver indices for sediment bacterial analysis.
SamplesCollection DateMean Daily Discharge (cfs) * (10 year median)Mean Daily Air Temp * (°F)Average Daily Precipitation (Inches)SWIEvenness
Summer Season
MD-07c15 September 200710%–20%720.154.20.85
MD-07f15 September 200710%–20%720.154.00.87
MD-08c20 June 2008198 (223)780.124.40.87
MD-08f20 June 2008198 (223)780.124.20.86
BD-07f15 September 200710%–20%720.154.00.91
BD-07f215 September 200710%–20%720.153.70.89
BD-08c25 June 200814 (24)790.123.60.85
BD-08f25 June 200814 (24)790.123.90.85
CD-07f10 July 20072.5 (2.2)800.154.1-
CD-08c11 June 20082.8 (2.8)760.114.00.84
Fall Season
MW-08c21 November 2008**510.114.00.91
MW-08f19 December 2008**420.094.30.91
BW-08c3 December 200874 (40)470.113.70.92
BW-08f1 November 200829 (33)560.103.70.88
CW-08c17 November 20083.1 (2.8)520.103.50.88
CW-08f19 December 20082.9 (2.9)420.094.10.92
*: Mean daily discharge and air temperature based on NCDENR 2009, NC Climate Office, 2003–2012 [15,16]. **: Within median value.

2.3. Stable Isotope Analysis

Stable isotope analyses were conducted on sediment core samples collected concurrently with microbial sediment analysis. Natural abundant isotopes (i.e., nitrogen) provide a time-integrated signal related to sediment biota and ambient surface water nitrogen levels [17,18]. The natural abundance of heavy stable isotopic nitrogen (δ15N) becomes enriched by repeated exposure of high nitrate concentrations from agricultural fertilizers, municipal wastewater, animal waste and residential septic systems [19,20]. The sediment collected using a coring device was processed for δ15N and δ13C values. Prepared samples were combusted in a Carlo Erba NC 2500 elemental analyzer (CE Instruments, Milan, Italy) and the N2 peak was injected into a Finnegan Mat Delta + XLS continuous flow isotope ratio mass spectrometer (CFIRMS, Bremen, Germany). The δ15N of sediment were reported, using δ notation, in per mil (‰) deviations from atmospheric nitrogen using the convention: δ15N (‰) = [(15N:14N sample/15N:14Natm N2) − 1] × 103. The δ13C of the sediment was analyzed in a similar fashion. Results were determined from sample weights and integrated peak areas calibrated against international laboratory standards [21].

2.4. Statistical Analyses

To test for significant differences among bacterial taxonomic groups by season (wetter/cooler vs. drier/warmer) site, and sediment size (c = coarse vs. f = fine), a non-parametric analysis of similarly (ANOSIM) was used [22]. The T-RFLP raw data was imported into the Primer V.6 software package (Primer-E Ltd, Lutton, UK), and a similarity matrix was calculated using the Bray Curtis similarity coefficient. A multidimensional scaling (MDS) procedure was used to ordinate the similarity data. A one-way analysis of similarity (ANOSIM) was then used to examine the statistical significance of differences among microbial taxonomic groups by season and sediment size. The ANOSIM reports include R-statistics and p-values. An R statistic close to 1 indicates that samples in the same group are more similar to each other than samples in different groups. An R-statistic close to 0 indicates that samples in the same group are not more similar to each other than samples in different groups. The p value reflects the statistical significance of the R-statistic. Subsequently, a principle component analysis (PCA) was used to visualize the T-RFLP similarity data. The T-RFLP data was transformed into mean % values and graphically represented by sediment size and season.
An analysis of variance (ANOVA) procedure was used to evaluate relationships among sediment isotope values (δ15NSED and δ13CSED) and sampling site. For these analyses, Post hoc comparisons tests were performed using a Bonferroni pairwise correction method, when a significant interaction effect was observed [23].

2.5. Microbial Analyses—DNA Extraction and Quantification

The DNA extractions were made from a composite of replicate sediment samples. Samples were thawed and 250 mg were obtained for gDNA extraction using the PowerSoilTM DNA isolation kit (MoBio Laboratories, Inc., Solana Beach, CA, USA) according to the kit protocols. All samples underwent a 4× extraction and were then passed over the same DNA binding filter and eluted with 50 µL of elution buffer from the MoBio kit (Solana Beach, CA, USA). For each replicate, sediment samples were pooled to improve the probability of PCR amplification and stored in −20 °C until microbial DNA extraction. Comparative analysis of the bacterial diversity in surficial sediment was performed by using 16S rDNA sequences and T-RFLP analysis.

2.6. PCR Amplification of 16S rDNA

The T-RFLP analysis of the sediment was as previously described [2,24], with some modifications. Briefly, the isolated gDNA was amplified using the bacterial specific 16S rDNA primers 8F (′5-AGAGTTTGATC (A/C) TGGCTCAG-3′) and 1492R (′5-GGTTACCTTGTTACGACTT-3′). Each PCR reaction consisted of 25 µL, containing 1.25 µL (100 nM) labeled forward primer, 1.25 µL (100 nM) labeled reverse primer, 12.5 µL Taq polymerase (Qiagen, Inc., Valencia, CA, USA) including dNTPs, 9 µL PCR grade water, and 1 µL DNA template. Each PCR test was performed with duplicate samples using an ABI 9700 thermal cycler (Applied Biosystems, Oslo, Norway). Reaction mixtures were held at 94 °C for 120 s, followed by 25–30 cycles of 94 °C for 60 s, 50 °C for 60 s, and 72 °C for 120 s with a final extension of 72 °C for 9 min. One microliter of each PCR reaction was run on a 1% agarose gel at 120 volts for 20 min to verify amplification of microbial 16S rDNA sequences.

2.7. Restriction Enzyme-Digest of PCR Products

The PCR reactions for composite sediment samples were purified using the UltraClean PCR Clean-up Kit (MoBio Laboratories, Inc., Solana Beach, CA, USA) and were visualized on a 1% agarose gel. The HhaI reaction required the addition of 1 μL of 100× Bovine Serum Albumin (BSA). The PCR products were then digested in three separate reactions. Each contained at least 15 μL of the purified PCR reaction, 74 μL of PCR grade water, 1 μL of one of three enzymes: RsaI, MspI, or HhaI, and 10 μL of its corresponding buffer. The restricted DNA fragments were purified using the QIAquick Nucleotide Removal Kit (Qiagen, Inc., Valencia, CA, USA) and were eluted into 50 μL of heated PCR grade water. Thirty microliters of each sample were placed in 1.5 mL microcentrifuge tubes, which were wrapped in parafilm and stored at −80 °C until shipped to the Genomic Technology Support Facility at Michigan State University for analysis on an Applied Biosystems Prism 3100 Gene Analyzer (Applied Biosystems, Foster City, CA, USA). The resulting fragment patterns were analyzed using the In Silico software package (In Silico LLC, Fuquay-Varina, NC, USA).

2.8. Analysis of T-RFLP Data

Taxonomic assignment was made using In Silico’s taxonomic assignment tool as previously described [25,26]. We used a single-value diversity index (In Silico LLC, Fuquay-Varina, NC, USA) for the T-RFLP analysis to calculate a Shannon-Weaver index (H′), Simpson diversity (reported as 1-D), the reciprocal Simpson (1/D), and evenness (E) [27,28]. For calculation of the indices, the T-RFLP analysis peak area was used as the amount and its relative abundance was measured by dividing individual peaks by the total fluorescence of the sample. The results for each diversity measure are representative of the number of fragments in each stream sediment sample. Mean percentage of each taxa from T-RFLP analysis were reported by site, seasonal collection period and sediment size.

3. Results

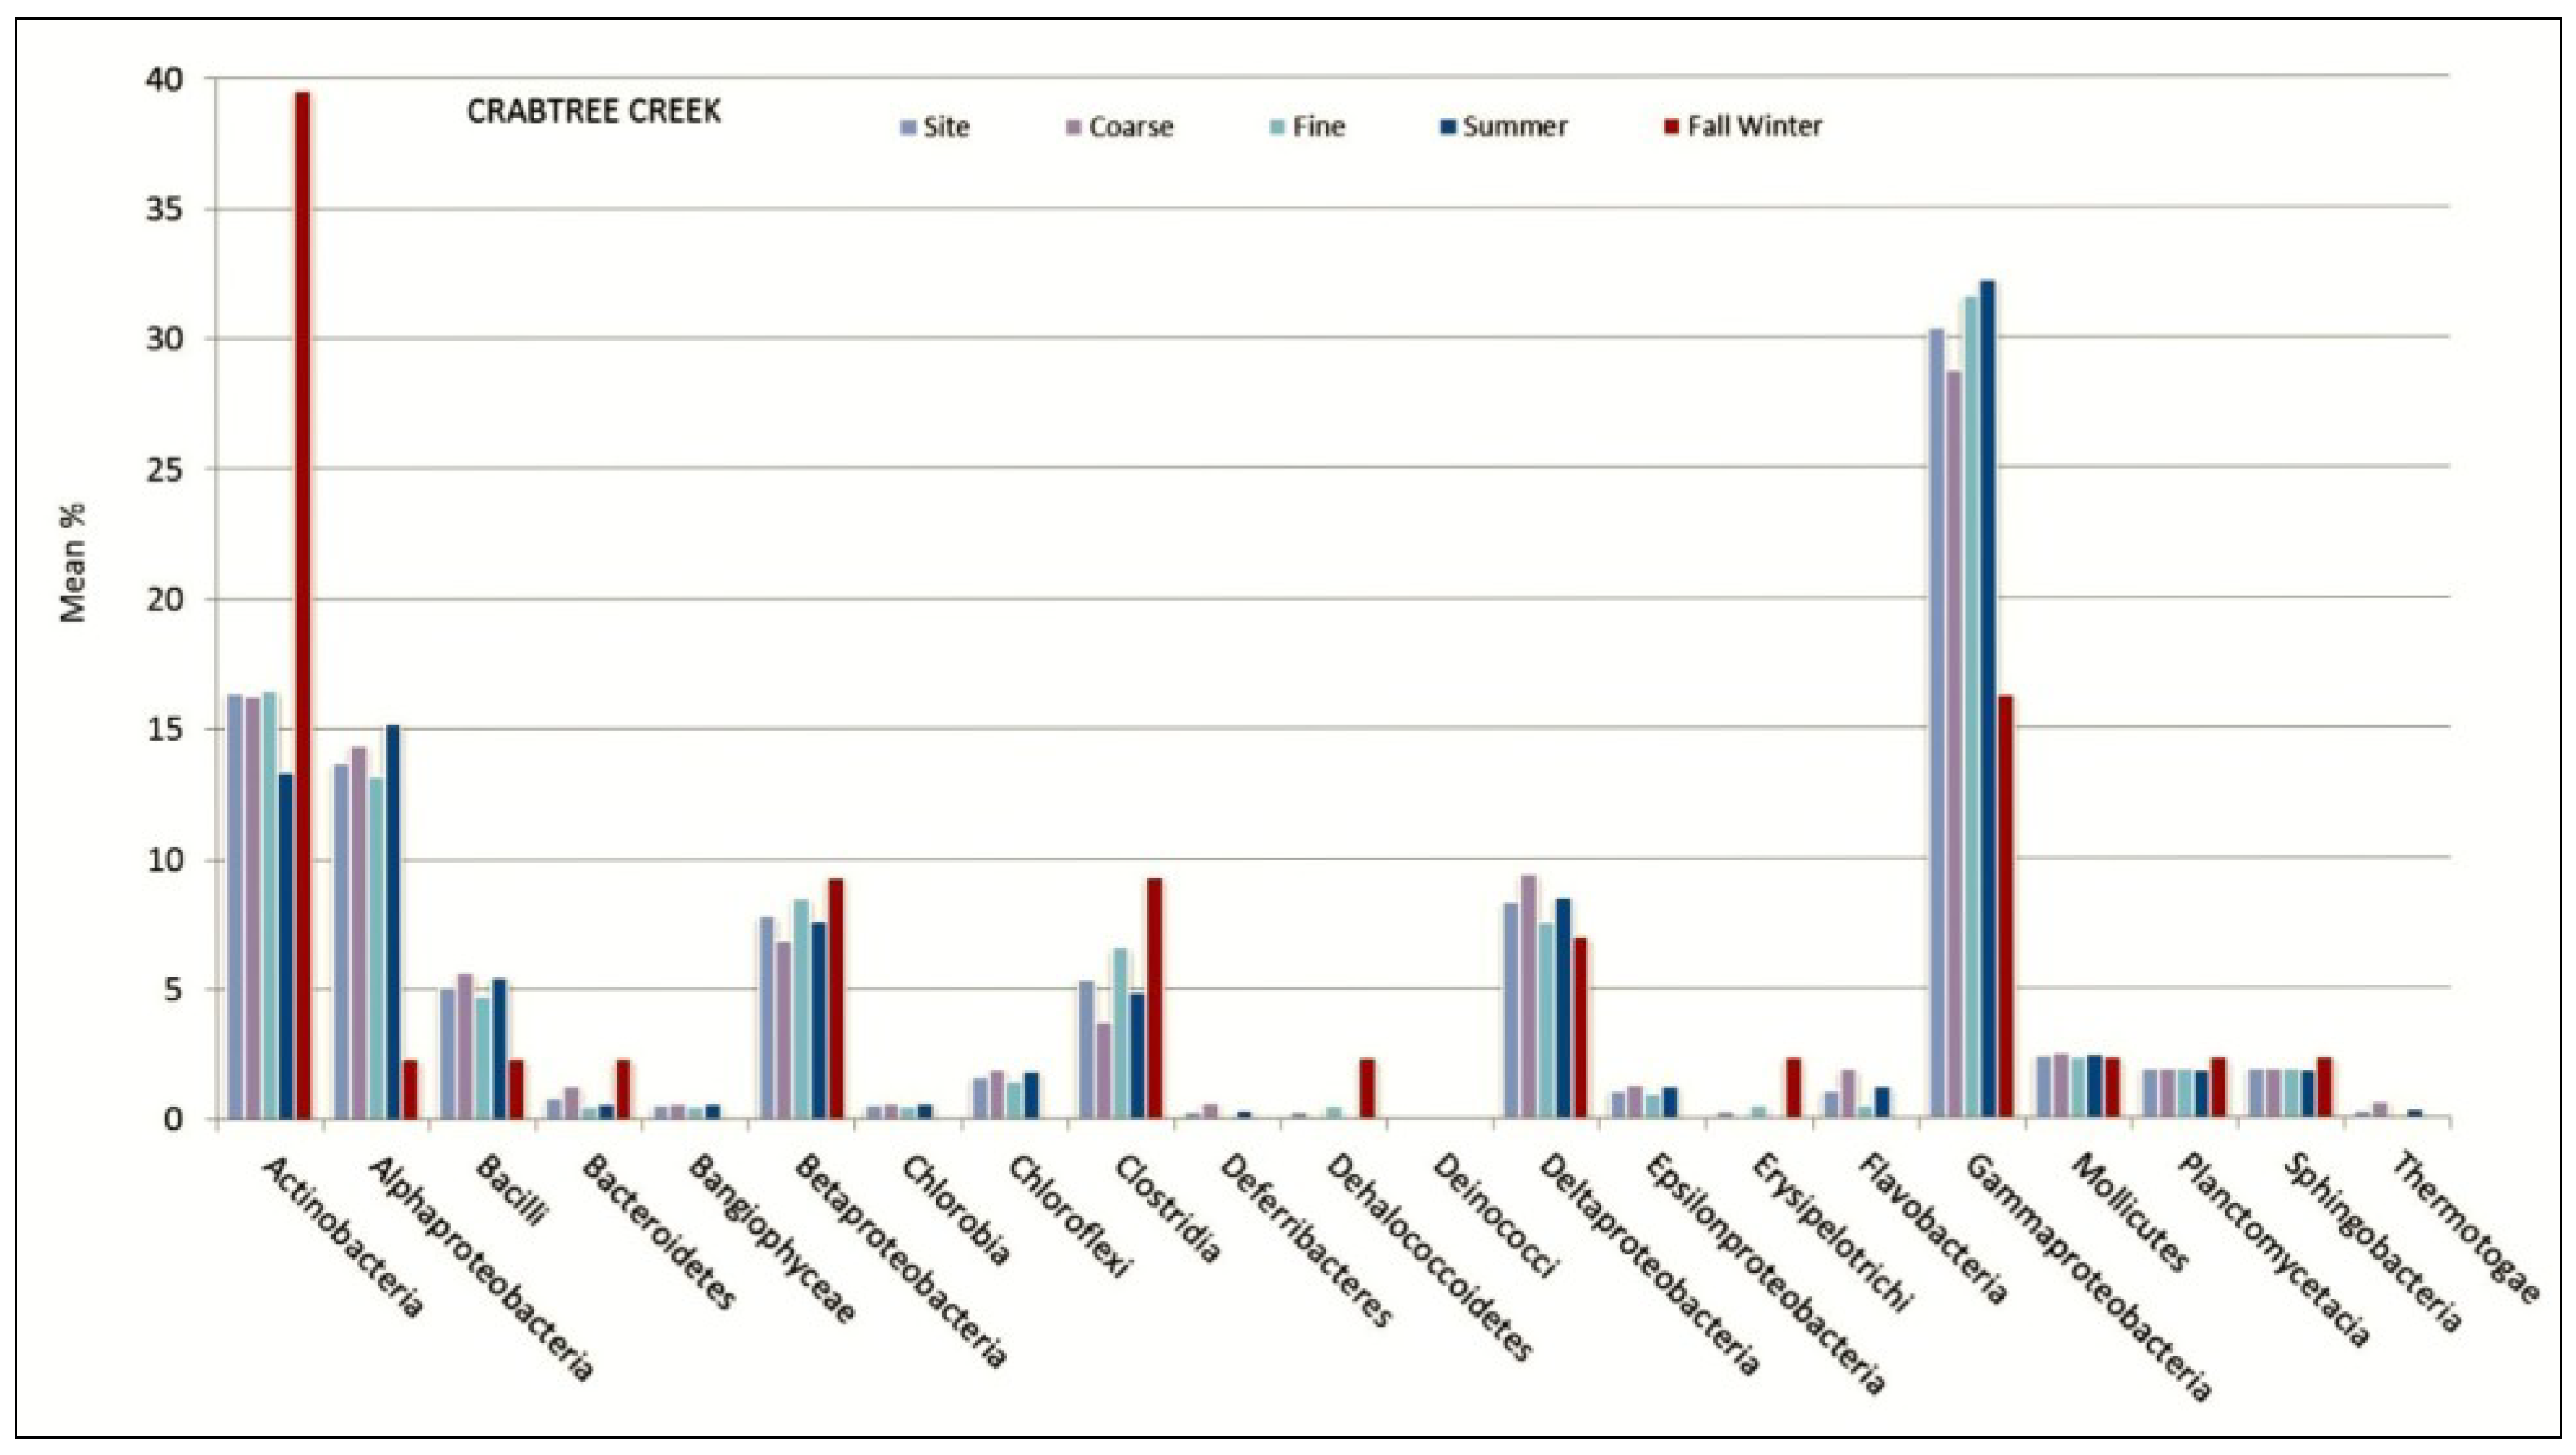
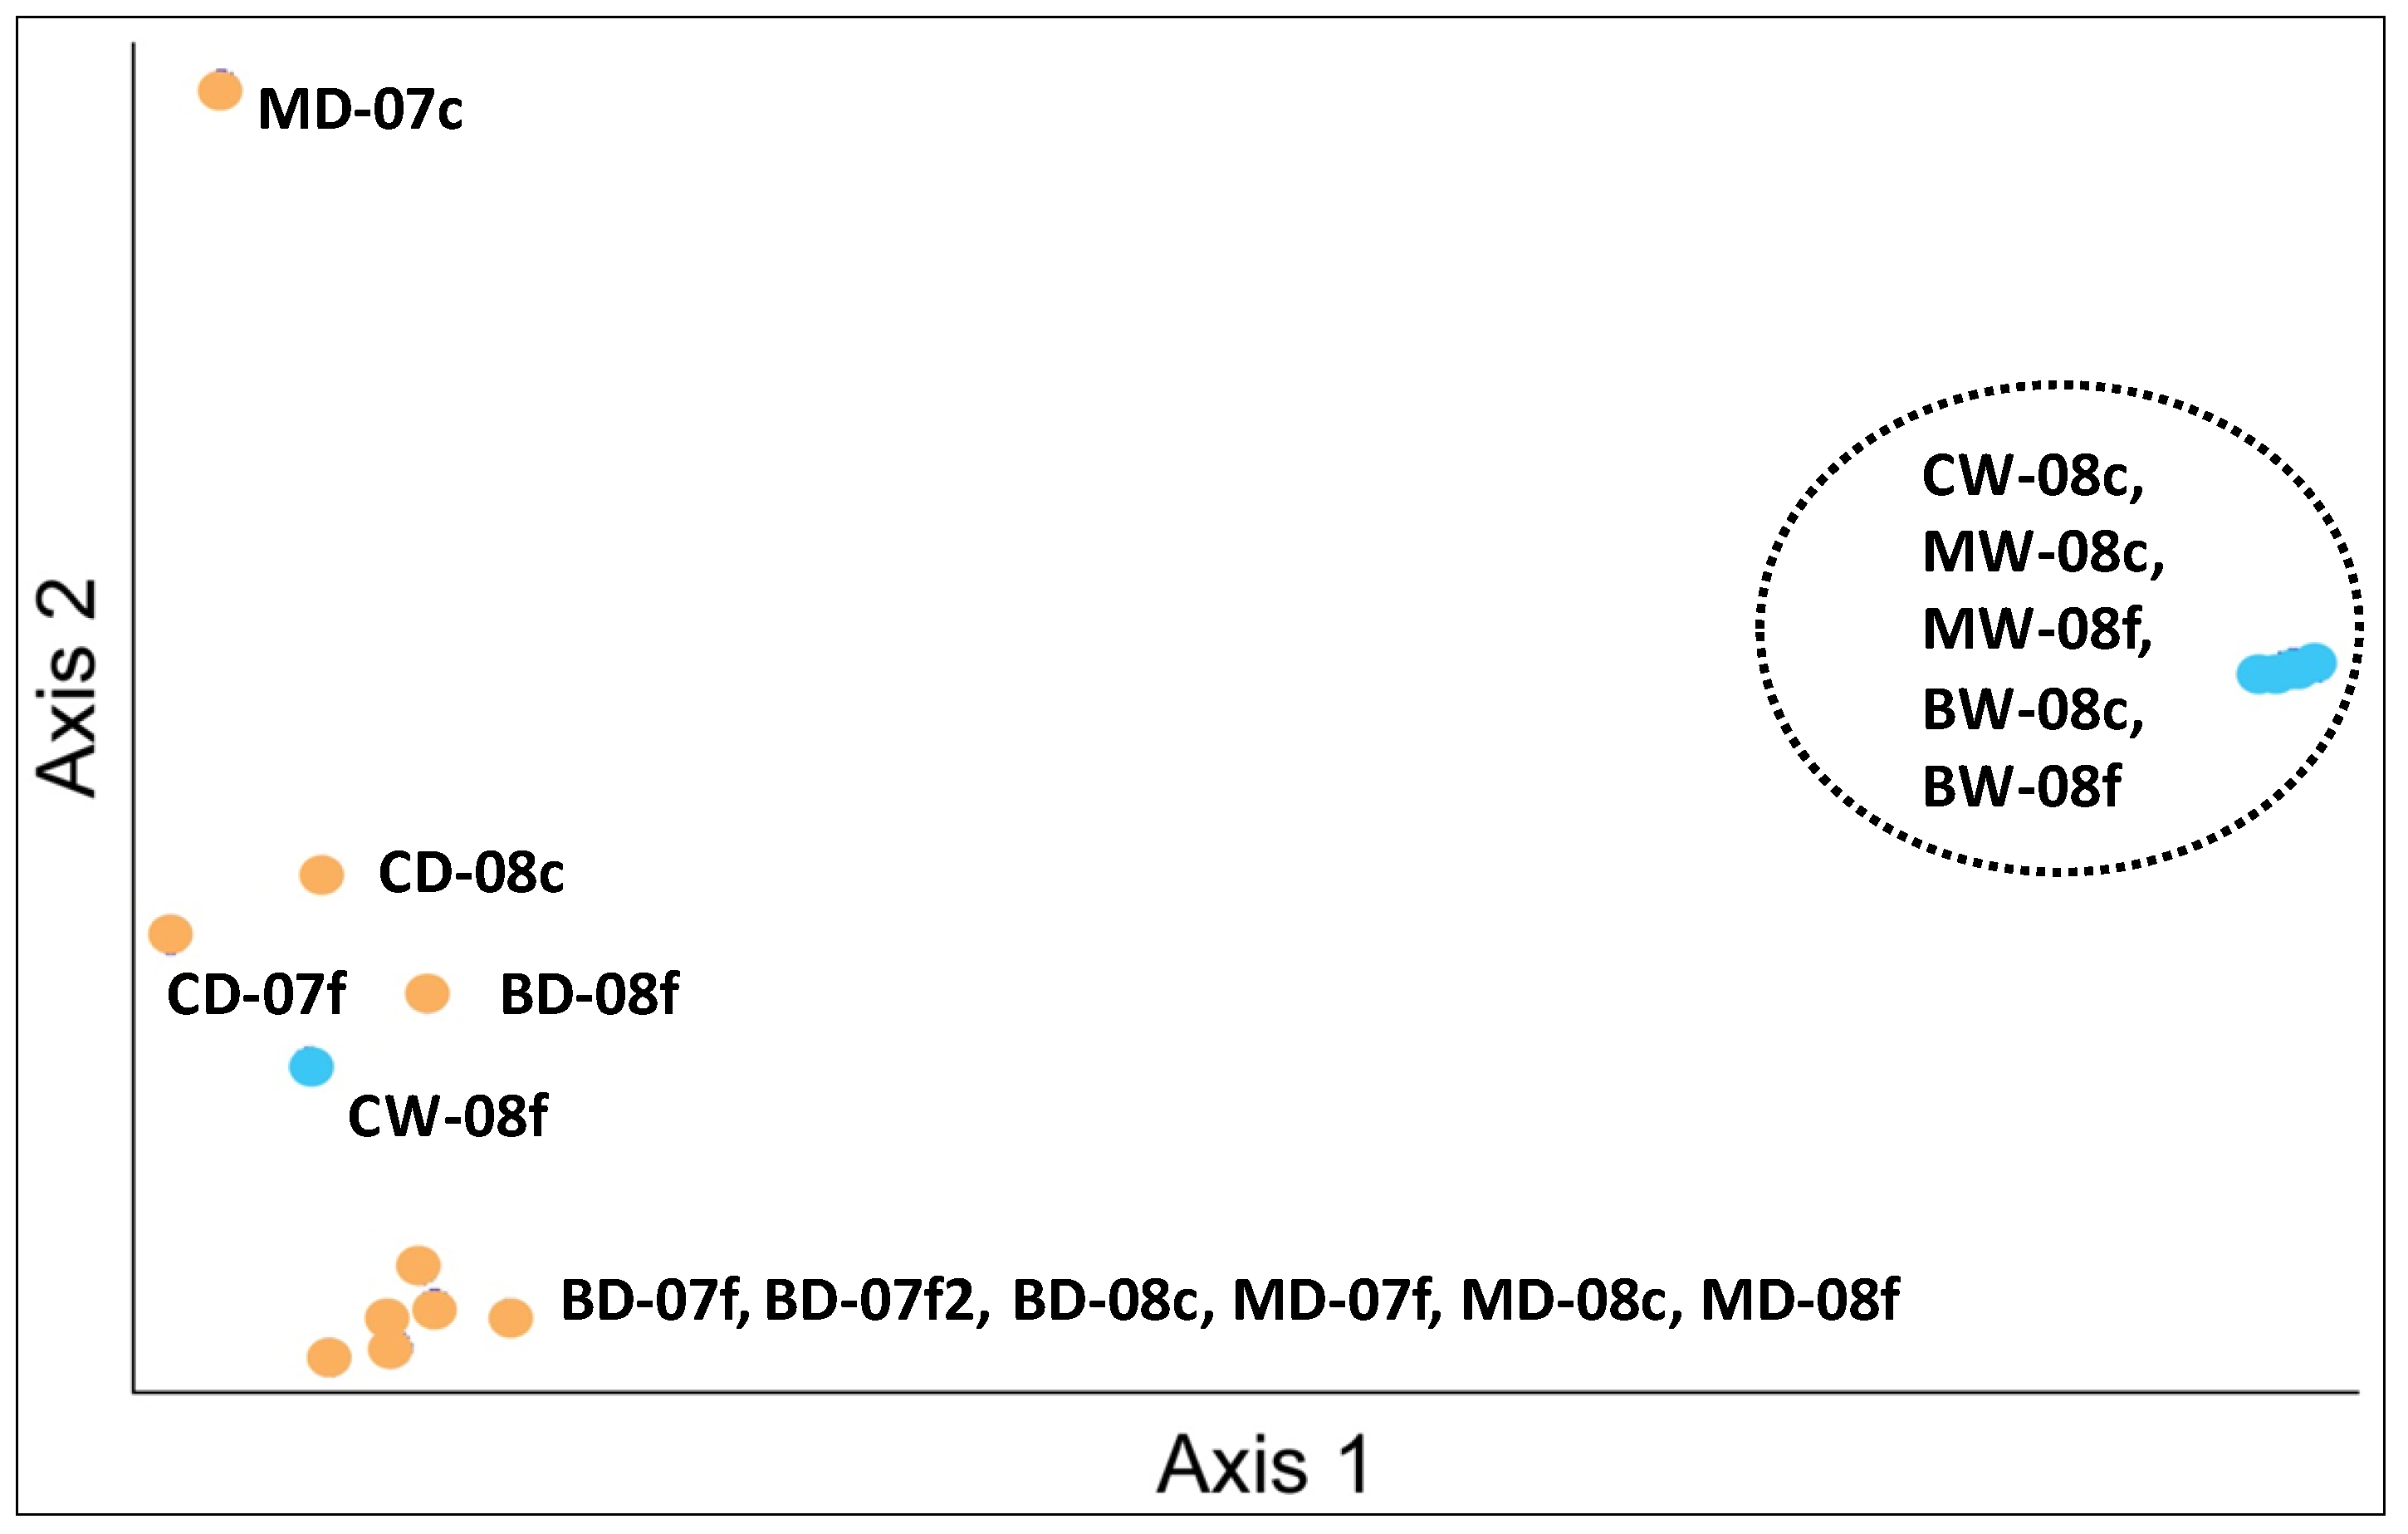
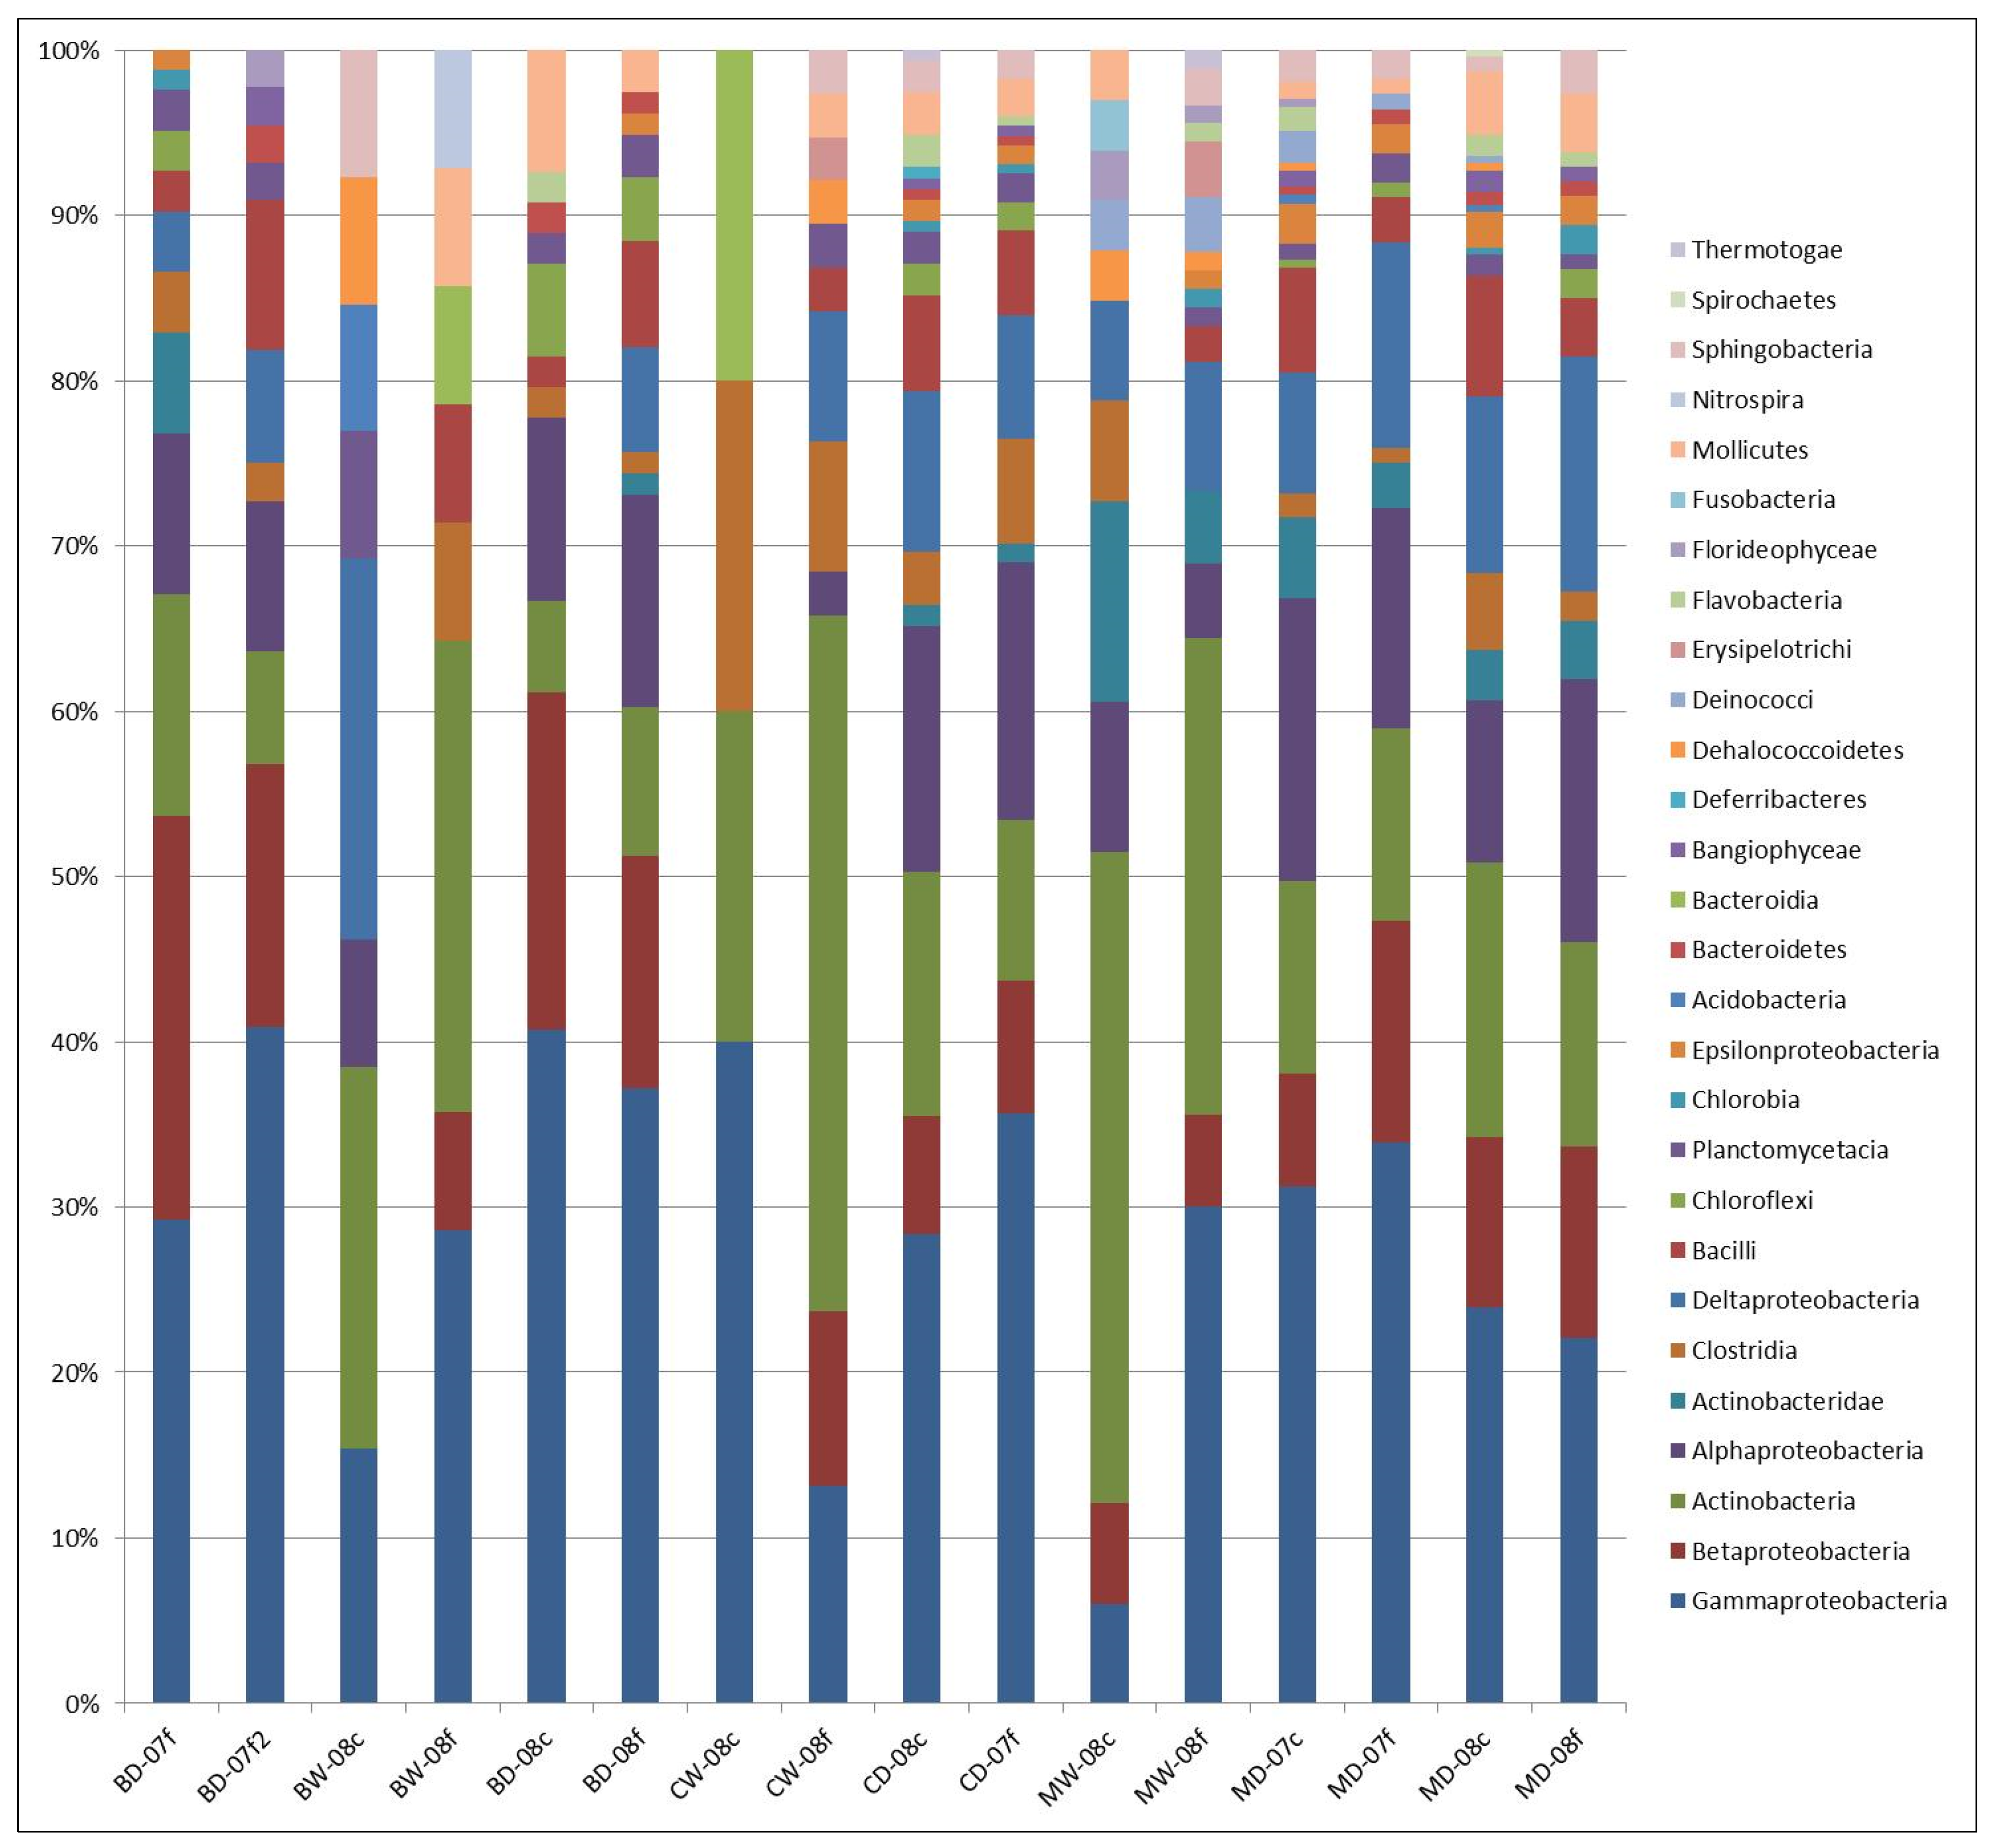
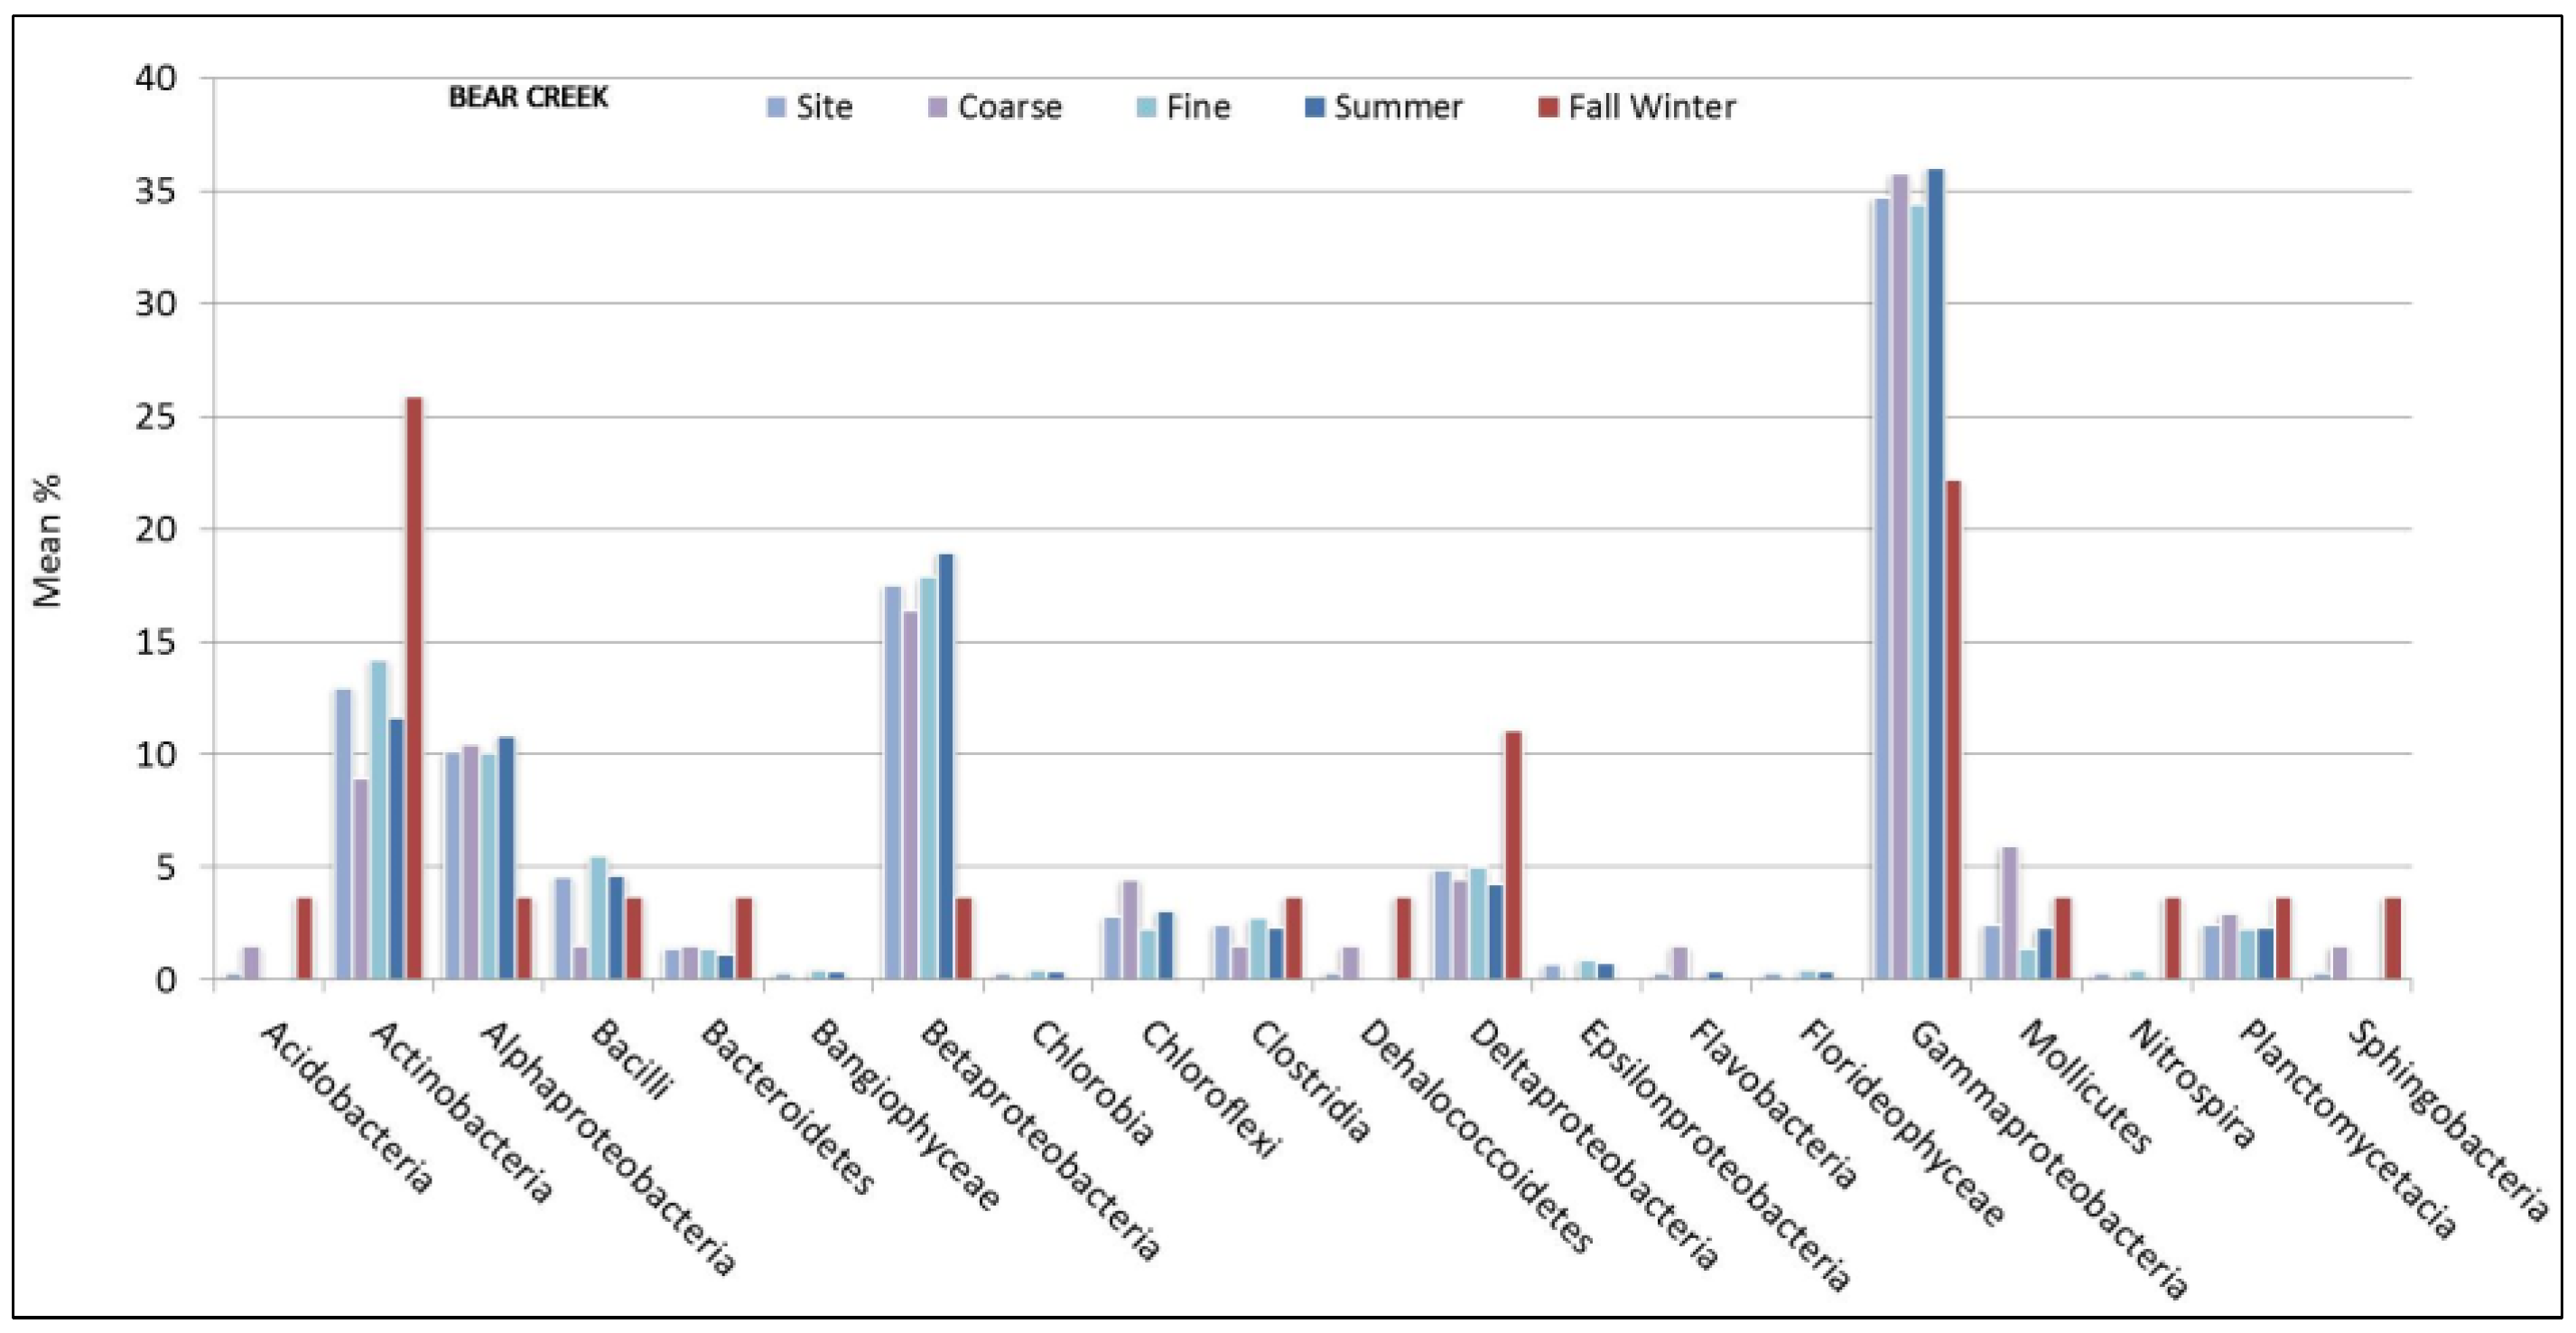
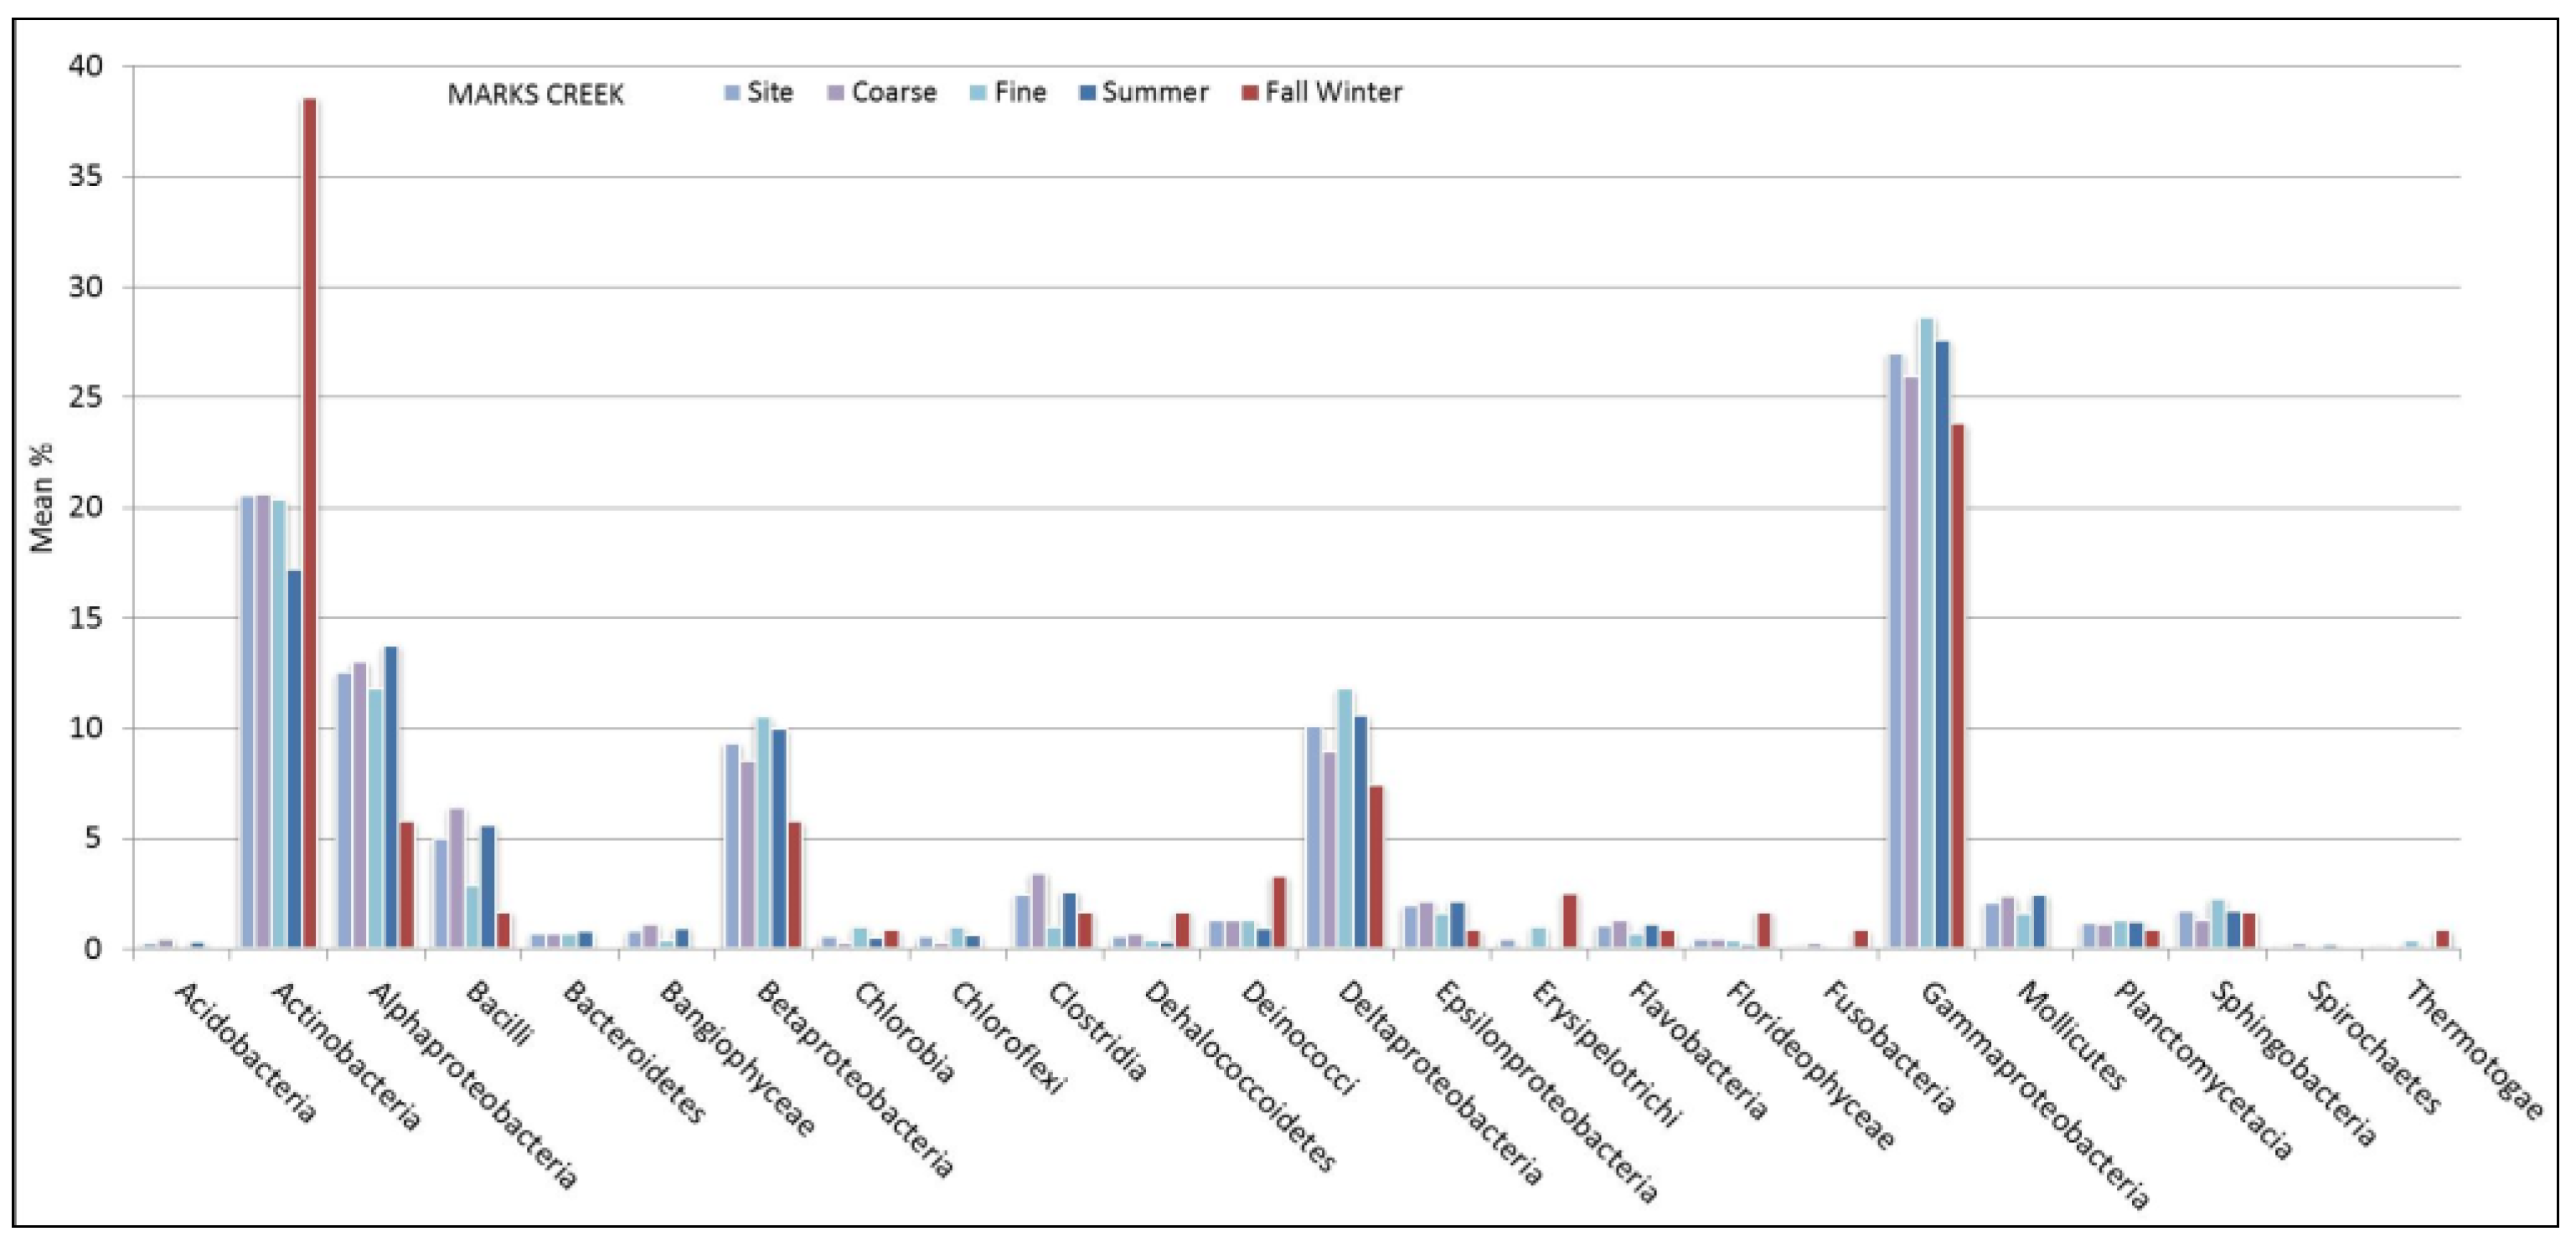
3.1. Microbial Structure

Taxonomic microbial classification of observed OTU (operational taxonomic unit) patterns was evaluated for all sites using the non-parametric ANOSIM procedure. Percent class abundance of twenty-six bacterial classes from different phyla were graphically represented as OTUs based on the 16S rDNA gene libraries from all sites sampled from the In Silico output (Figure 2). This method was used to represent microbial class patterns by each site with respect to season and sediment size (Figure 3, Figure 4 and Figure 5).
Figure 2. Percent abundance of bacterial class presented from all three sites. The x axis are sample site abbreviations that correspond to the naming convention in Table 1 (M = Marks Creek, B = Bear Creek, C = Crabtree Creek, W = wet; D = dry. Numeric code is the year of collection. Lower case letters depict sediment size; c= coarse; f = fine).
Diversity 06 00018 g002
The most prevalent group represented among all three stream sites regardless of season and sediment size was Gamma-proteobacteria. This group represented 34% of the microbial community in sediment samples obtained from Bear Creek, 30.4% from Crabtree Creek (30.4%) and 27% from Marks Creek.
Figure 3. Bear Creek mean % values of OTU matches for bacterial class represented by sediment size and seasonal sampling period.
Diversity 06 00018 g003
Figure 4. Marks Creek mean % values of OTU matches for bacterial class represented by sediment size and seasonal sampling period.
Diversity 06 00018 g004
Figure 5. Crabtree Creek mean % values of OTU matches for bacterial class represented by sediment size and seasonal sampling period.
Diversity 06 00018 g005
Actinobacteria was the second most prevalent group observed in the sediment among all sites (Bear 13.6%; Crabtree 13.7%; Marks 20.5%), with greater occurrence in the wet compared to the dry season.
Bear Creek showed a higher portion of Actinobacteria in the wetter (26%) compared to the drier (12%) sampling period. Furthermore, Gamma (22% vs 36%), Alpha (4% vs 11%) and Beta (4% vs 19%) Proteobacteria were less prevalent at Bear Creek in the wetter season when compared to the drier period. Conversely, Delta-proteobacteria was more prevalent at Bear Creek in the samples obtained during the wetter season (11% vs 4%). Across all sites, the proportion of sediment samples comprised of Alpha-proteobacteria was higher during drier (10%–15%) periods than during the wetter (<7%) seasonal periods. Unlike Bear Creek, Gamma, Beta, and Delta Proteobacteria were less prevalent in sediment samples obtained in Marks Creek during wetter months. Gamma-proteobacteria was less prevalent in sediment samples obtained in Crabtree Creek (16%) during the wetter months than during drier months 32%.
Discernable clustering was observed for Marks and Bear Creek samples collected during the wetter period, which corresponded with a period of higher precipitation and cooler surface water temperatures (Table 1). The principal components analysis confirmed this pattern and showed that the trend in community structure was separated by wet and dry seasonal periods (Axis 1 vs 2 (Figure 6). Although not statistically significance at alpha 0.05 using nonparametric analysis, sample microbial community structure appeared different between season regardless of sediment size and site (ANOSIM, R = 0.60; p < 0.10). The R value suggested that the samples within each seasonal group were quite similar.
Figure 6. Axis 1 vs. 2 Principle Component Analysis for sediment analyzed from T-RFLP analyses. Samples were clustered on the basis of the OTU data. Sample IDs correspond to the naming convention in Table 1. Orange circles = drier period; Blue = wetter period (M = Marks Creek, B = Bear Creek, C = Crabtree Creek, W = wet; D = dry. Numeric code is the year of collection. Lower case letters depict sediment size; c= coarse; f = fine).
Diversity 06 00018 g006
Microbial community structure was not different between site and sediment size according to ANOSIM. The graphical representation of % class abundance supported this result as the proportion of Gamma-proteobacteria in coarse sediments (Bear Creek coarse, 36%) was similar to the proportion observed in fine sediments (Bear Creek fine, 35%), with similar proportions observed in Crabtree Creek (coarse, 29% and fine, 32%). Marks Creek showed a slightly lower occurrence of Gamma-proteobacteria in both sediment types (coarse, 26%; fine, 29%) with little variation observed in the proportion noted in samples with a different grain size. The mean values of the Shannon Weaver (SWI) and Evenness Indices (95% confidence interval) of community diversity were reported for each site (Table 1). Although not a definitive measure of diversity, these indices provided relative values for assessing spatial variation among sites [29]. Using these indices, no significant differences were observed between the proportion of bacterial species in coarse vs. fine sediments.

3.2. Sediment Stable Isotopes

Nitrogen isotopic values of sediment (δ15NSED; 8.9‰ ± 2.6‰) sampled at Bear Creek had significantly higher nitrogen values when compared to other sites (Crabtree, δ15NSED; 5.3‰ ± 1.6‰ and Marks, δ15NSED; 5.2‰ ± 1.2‰) (F = 32; df = 2; p < 0.01). Post hoc comparisons of sediment δ13C values did not show definable trends among sites.

4. Discussion

Our study examined microbial community structure in stream sediments among sites in a large watershed located in the Neuse River Basin, NC. Although land-use differences as well as nutrient levels varied among sites, seasonal patterns appear to influence the stream sediment bacterial structure. The community structure was predominately comprised of Proteobacteria (i.e., Beta, Delta, and Alpha) and Actinobacteria, which is not surprising and supports previous findings [2,30]. These bacteria play an essential role in benthic biochemical processing of nitrogen and deposited organics and changes in the proportion of bacterial assemblages can serve as bio-indicators of nutrient input and other forms of environmental contamination and degradation [31,32].
In previous studies, hydrological parameters associated with season cycles such as surface water temperatures and precipitation [33] influenced sediment microbial community structure [34] in sediment. A better understanding of these trends is needed as climate change disrupts seasonal temperatures. Changes in stream base flow and seasonal storm-related input modify both physical and chemical processes as factors such as stream temperature, light penetration, and organic and inorganic sediment structure are altered [35]. Previous studies conducted by Kan and coworkers in the Chesapeake Bay showed that extended periods of rainfall can prompt marked temporal variation in the water column and influence bacterioplankton populations [36]. Kan’s work did not find site differences on a spatial scale, which is consistent with our findings.
We examined whether seasonal variability, such as changes in rainfall [15] can alter stream bacterial sediment communities. Our study suggests that distinct groupings in bacteria species were evident during wetter and drier periods. The estimated air and stream water temperature at sampling sites at the time of collection varied with season (Summer 75–80 °F; Fall 60–65 °F), as expected [16,37]. Further studies of bacterioplankton stream populations have showed that temporal variability is a consequence of frequent changes in physicochemical parameters, particularly during high flow conditions [33,38]. Certain bacteria may favor rainfall and cooler conditions. Rees and coworkers (2006) investigated the impact of drought on microbial sediment community structure and observed relatively consistent patterns among community structure exposed to frequent drying and rewetting [39].
Although we did not directly evaluate biogeochemical factors associated with nutrient impacts, studying the spatial biogeography of freshwater sediment bacteria would be a likely next step in the NRB since it is known to receive high levels of nitrogen. For example, within the upper NRB, riparian land-use practices, which can contribute nitrogen waste, have impaired stream ecosystems [40,41]. We observed a greater percentage of Gamma-proteobacteria in Bear Creek, which is in a more agriculturally dominated watershed compared to the more urban Crabtree and mixed-use Marks Creek [15]. Beta-proteobacteria was the second most prevalent group observed in Bear Creek (18%) sediments and comprised a larger proportion of the total bacterial sediment population when compared to Marks (9%) and Crabtree (8%) sites. Beta-proteobacteria, such as Nitrosomonas play a critical role in oxidation processes, which has been well documented in high nitrogen streams [42]. This is not surprising since Gamma, Alpha and Beta-proteobacteria populations are considered common in nutrient impacted aquatic systems [43]. Proteobacteria are phenotypically diverse, many decompose nutrient wastewater and include denitrifying and ammonia-oxidizing (AOB) microorganisms, and catalyze nitrification [35,44,45]. Specific Proteobacteria species can influence nutrient removal processes in freshwater sediment habitat [46].
The biogeochemistry of water and sediment at sampling sites in our study has been previously evaluated. For example, nitrate concentrations (NO3 mg·L−1) measured in surface water were significantly higher (2.3 ± 0.6 mg/L; n = 46) in agriculturally dominated Bear Creek, than in Crabtree Creek (1.2 ± 0.7 mg/L; n = 111) and Marks Creek (0.09 ± 0.7 mg/L; n = 35) (F = 139; df = 2; p < 0.01) [47,48,49,50]. Surficial sediment (δ15NSED) values observed have been consistent with this pattern among sites. Nitrogen isotope values have a characteristic δ15N signature and values in surface waters exposed to animal waste consistently fall within the range of 10‰ to 20‰ [51,52]. Conversely, nitrate derived from commercial fertilizers has δ15N values from −2‰ to 2‰. The prevalence of agriculture operations and animal wastewater runoff in Bear Creek has been linked to increased elevated levels of reactive nitrogen draining into adjacent streams [14]. Higher nitrogen levels may influence sediment microbiota diversity [53] and stable isotope signatures have proven useful for identifying the source of nitrogen input [54,55,56].

5. Conclusions

Our study suggests that factors associated with seasonal cycles, such as rainfall and temperature may influence first order stream sediment bacterial communities; however, more study is needed. Further examination of these communities along a temperature gradient may be informative. For example, it would be useful to examine the functional properties of sediment microbial communities across a fine range of water temperatures to understand compositional shifts in response to seasonal variation [57]. Using this approach, microbial diversity studies may reveal species specific changes on a finer temporal scale, not otherwise depicted in previous work. This way, scientists can provide a potential tool for environmental managers to assess the potential secondary impacts of land-use activity, which are often the most difficult to predict when initiating new land-development projects.

Acknowledgments

We thank those reviewers and laboratory experts for their thoughtful comments. We especially thank Anthony Devine, for his valuable input during the preparation of this manuscript. We are also grateful to William Showers and Bernie Genna for support in the preparation of environmental samples at the North Carolina State University, Stable Isotope Laboratory. Funds supporting these studies were provided in part by the USDA Epidemiologic Approaches to Food Safety Program, and the North Carolina State University College of Veterinary Medicine.

Conflicts of Interest

The authors declare no conflict of interest.

References

  1. Palmer, M.A.; Covich, A.P.; Lake, S.; Biro, P.; Brooks, J.J.; Cole, J.; Dahm, C.; Gibert, J.; Goedkoop, W.; Martens, K.; et al. Sediment biota and life above sediments as potential drivers of biodiversity and ecological processes. BioScience 2000, 50, 1062–1075. [Google Scholar] [CrossRef]
  2. Hullar, M.A.; Kaplan, L.A.; Stahl, A. Recurring seasonal dynamics of microbial communities in stream habitats. Appl. Environ. Microbiol. 2006, 72, 713–722. [Google Scholar] [CrossRef]
  3. Findlay, S.; Tank, J.; Dye, S.; Valett, H.M.; Mulholland, P.J.; McDowell, W.H.; Johnson, S.L.; Hamilton, S.K.; Edmonds, J.; Dodds, W.K.; et al. A cross-system comparison of bacterial and fungal biomass in detritus pools of headwater streams. Microb. Ecol. 2002, 43, 55–66. [Google Scholar] [CrossRef]
  4. Wang, S.; Sudduth, E.; Wallenstein, M.D.; Wright, J.P.; Bernhardt, E.M. Watershed urbanization alters the composition and function of stream bacterial communities. PLoS One 2011, 6, e22972. [Google Scholar]
  5. Chiaramonte, J.B.; Roberto Mdo, C.; Pagioro, T.A. Seasonal dynamics and community structure of bacterioplankton in upper Paraná River floodplain. Microb. Ecol. 2013, 66, 773–783. [Google Scholar] [CrossRef]
  6. Findlay, S.; Yeates, J.C.; Hullar, M.; Stahl, D.A.; Kaplan, L.A. Biome-level biogeography of streambed microbiota. Appl. Environ. Microb. 2008, 74, 3014–3021. [Google Scholar] [CrossRef]
  7. Fazi, S.; Vazquez, E.; Casamayor, E.O.; Amalfitano, S.; Butturini, A. Stream hydrological fragmentation drives bacterioplankton community composition. PLoS One 2013, 8, e64109. [Google Scholar]
  8. Mummey, D.L.; Stahl, P.D. Spatial and temporal variability of bacterial 16S rDNA-based T-RFLP patterns derived from soil of two Wyoming grassland ecosystems. FEMS Microbiol. Ecol. 2003, 46, 113–120. [Google Scholar] [CrossRef]
  9. Starry, O.S.; Valett, H.M.; Schreiber, M.E. Nitrification rates in a headwater stream: Influences of seasonal variation in C and N supply. J. North Am. Benthol. Soc. 2005, 24, 753–768. [Google Scholar] [CrossRef]
  10. Arango, C.P.; Tank, J.L. Land use influences the spatiotemporal controls on nitrification and denitrification in headwater streams. J. North Am. Benthol. Soc. 2008, 27, 90–107. [Google Scholar] [CrossRef]
  11. Paerl, H.W.; Pinckney, J.L.; Fear, J.M.; Peierls, B.L. Ecosystem responses to internal and watershed organic matter loading: Consequences for hypoxia in the eutrophying Neuse River Estuary, North Carolina, USA. Mar. Ecol. Prog. Ser. 1998, 166, 17–25. [Google Scholar] [CrossRef]
  12. Mallin, M.A.; Cahoon, L.B. Industrialized animal production—a major source of nutrient and microbial pollution to aquatic ecosystems. Popul. Environ. 2003, 24, 369–385. [Google Scholar] [CrossRef]
  13. Oczkowski, A.; Nixon, S.; Henry, K.; DiMilla, P.; Pilson, M.; Granger, S.; Buckley, B.; Thornber, C.; McKinney, R.; Chaves, J. Distribution and trophic importance of anthropogenic nitrogen in Narragansett Bay: An assessment using stable isotopes. Estuar. Coasts 2008, 31, 53–69. [Google Scholar] [CrossRef]
  14. Usry, B.P. Nitrogen Loading in the Neuse River Basin, North Carolina: The Rivernet Monitoring Program. Master Thesis, North Carolina State University, Raleigh, NC, USA, May 2005; pp. 90–120. [Google Scholar]
  15. North Carolina Department of Environmental and Natural Resources (NCDENR). Basin-wide Assessment Reports for the Neuse River Basin, NCDENR: Raleigh, NC, USA, 2009.
  16. State Climate Office of North Carolina. CRONOS Data Source Map and Archive; North Carolina State University: Raleigh, NC, USA, 2003. Available online: http://www.nc-climate.ncsu.edu/cronos/index.php (accessed on 27 October 2013).
  17. Robinson, D. δ15N as an integrator of the nitrogen cycle. Trends Ecol. Evol. 2001, 16, 153–162. [Google Scholar] [CrossRef]
  18. Fry, B.; Allen, Y.C. Stable isotopes in zebra mussels as bioindicators of river-watershed linkages. River Res. Appl. 2003, 19, 683–696. [Google Scholar] [CrossRef]
  19. Carpenter, S.R.; Caraco, N.F.; Correll, D.L.; Howarth, R.W.; Sharpley, A.N.; Smith, V.H. Nonpoint pollution of surface waters with phosphorus and nitrogen. Ecol. Appl. 1998, 8, 559–568. [Google Scholar] [CrossRef]
  20. Gau, C.; Zhu, J.G.; Zhu, J.Y.; Gao, X.; Dou, Y.J.; Hosen, Y. Nitrogen export from an agriculture watershed in the Taihu Lake area, China. Environ. Geochem. Health 2004, 26, 199–207. [Google Scholar] [CrossRef]
  21. Kendall, C.; Silva, S.R.; Kelly, V.J. Carbon and nitrogen isotopic compositions of particulate organic matter in four large river systems across the United States. Hydrol. Process. 2001, 15, 1301–1346. [Google Scholar] [CrossRef]
  22. Clarke, K.R. Non-parametric multivariate analyses of changes in community structure. Aust. J. Ecol. 1993, 18, 117–143. [Google Scholar]
  23. Strassburger, K.; Bretz, F. Compatible simultaneous lower confidence bounds for the Holm procedure and other Bonferroni-based closed tests. Stat. Med. 2008, 27, 4914–4927. [Google Scholar] [CrossRef]
  24. Liu, W.T.; Marsh, T.L.; Cheng, H.; Forney, L.J. Characterization of microbial diversity by determining terminal restriction fragment length polymorphisms of genes encoding 16S rRNA. Appl. Environ. Microbiol. 1997, 63, 4516–4522. [Google Scholar]
  25. Kent, A.D.; Smith, D.J.; Benson, B.J.; Triplett, E.W. Web-based phylogenetic assignment tool for analysis of terminal restriction fragment length polymorphism profiles of microbial communities. Appl. Environ. Microbiol. 2003, 69, 6768–6776. [Google Scholar] [CrossRef]
  26. Johnson, M.C.; Devine, A.A.; Ellis, J.C.; Grunden, A.M.; Fellner, V. Effects of antibiotics and oil on microbial profiles and fermentation in mixed cultures of ruminal microorganisms. J. Dairy Sci. 2009, 92, 4467–4480. [Google Scholar] [CrossRef]
  27. Tajima, K.; Aminov, R.I.; Nagamine, T.; Ogata, K.; Nakamura, M.; Matsui, H.; Benno, Y. Rumen bacterial diversity as determined by sequence analysis of 16S rDNA libraries. FEMS Microbiol. Ecol. 1999, 29, 159–169. [Google Scholar] [CrossRef]
  28. Blackwood, C.B.; Hudleston, D.; Zak, D.R.; Buyer, J.S. Interpreting ecological diversity indices applied to terminal restriction length polymorphism data: Insights from simulated microbial communities. Appl. Environ. Microbiol. 2007, 73, 5276–5283. [Google Scholar] [CrossRef]
  29. Hewson, I.; Jacobson Meyers, M.F.; Fuhrman, J.A. Diversity and biogeography of bacterial assemblages in surface sediments across the San Pedro Basin, Southern California Borderlands. Environ. Microbiol. 2007, 9, 923–933. [Google Scholar] [CrossRef]
  30. Crump, B.; Hobbie, J.E. Synchrony and seasonality in bacterioplankton communities of two temperate rivers. Limnol. Oceanogr. 2005, 50, 1718–1729. [Google Scholar] [CrossRef]
  31. Judd, K.E.; Crump, B.C.; Kling, G.W. Variation in dissolved organic matter controls bacterial production and community composition. Ecology 2006, 87, 2068–2079. [Google Scholar] [CrossRef]
  32. Sezenna, M.L. (Ed.) Proteobacteria: Phylogeny, Metabolic Diversity and Ecological Effects; Nova Science Publishers, Incorporated: Hauppauge, NY, USA, 2011.
  33. Adams, H.E.; Crump, B.C.; Kling, G.W. Temperature controls on aquatic bacterial production and community dynamics in arctic lakes and streams. Environ. Microbiol. 2010, 12, 1319–1333. [Google Scholar] [CrossRef]
  34. Nelson, J.D.; Boehme, S.E.; Reimers, C.E. Temporal patterns of microbial community structure in the Mid-Atlantic Bight. FEMS Microbiol. Ecol. 2008, 65, 484–493. [Google Scholar] [CrossRef]
  35. Baldwin, D.S.; Rees, G.N.; Watson, G.; Williams, J. The potential of sediment microbial community structure as either a target or an indicator for the restoration of degraded aquatic ecosystems—preliminary results from a creek affected by in-stream sand accretion. Ecol. Manag. Restor. 2008, 9, 156–159. [Google Scholar] [CrossRef]
  36. Kan, J.; Suzuki, M.T.; Wang, K.; Evans, S.E.; Chen, F. High temporal but low spatial heterogeneity of bacterioplankton in the Chesapeake Bay. Appl. Environ. Microbiol. 2007, 73, 6776–6789. [Google Scholar] [CrossRef]
  37. Boggs, J.L.; Sun, G.; McNulty, S.G.; Swartley, W.; Treasure, E.; Summer, W. Temporal and Spatial Variability in North Carolina Piedmont Stream Temperature. In Proceedings of the 2009 AWRA Spring Specialty Conference, Anchorage, AK, USA, 4–6 May 2009.
  38. Portillo, M.C.; Anderson, S.P.; Fierer, N. Temporal variability in the diversity and composition of stream bacterioplankton communities. Environ. Microbiol. 2012, 14, 2417–2428. [Google Scholar] [CrossRef]
  39. Rees, G.N.; Watson, G.O.; Baldwin, D.S.; Mitchell, A.M. Variability in sediment microbial communities in a semipermanent stream: Impact of drought. J. North Am. Benthol. Soc. 2006, 25, 370–378. [Google Scholar] [CrossRef]
  40. Lenat, D.R.; Crawford, J.K. Effects of land use on water quality and aquatic biota of three North Carolina Piedmont streams. Hydrobiologia 1994, 294, 185–199. [Google Scholar] [CrossRef]
  41. Galloway, J.N. Nitrogen cycles past, present, and future. Biogeochemistry 2004, 70, 153–226. [Google Scholar] [CrossRef]
  42. Cebron, A.; Garnier, J. Nitrobacter and Nitrospira genera as representatives of nitrite-oxidizing bacteria: Detection, quantification and growth along the lower Seine River (France). Water Res. 2005, 39, 4979–4992. [Google Scholar] [CrossRef]
  43. Rubin, M.A.; Leff, L.G. Nutrients and other abiotic factors affecting bacterial communities in an Ohio River (USA). Microbiol. Ecol. 2007, 54, 374–383. [Google Scholar] [CrossRef]
  44. Cavigelli, M.A.; Robertson, G.P. The functional significance of denitrifier community composition in a terrestrial ecosystem. Ecology 2000, 81, 1402–1414. [Google Scholar] [CrossRef]
  45. Wakelin, S.A.; Colloff, M.J.; Kookana, R.S. Effect of wastewater treatment plant effluent on microbial function and community structure in the sediment of a freshwater stream with variable seasonal flow. Appl. Environ. Microbiol. 2008, 74, 2659–2668. [Google Scholar] [CrossRef]
  46. Wagner, M.; Rath, G.; Amann, R.; Koops, H.P.; Schleifer, K.H. In situ, identification of ammonia-oxidizing bacteria. Syst. Appl. Microbiol. 1995, 18, 251–264. [Google Scholar] [CrossRef]
  47. Karr, J.D.; Showers, W.J.; Gilliam, J.W.; Andres, A.S. Tracing nitrate transport and environmental impact from intensive swine farming using delta Nitrogen-15. J. Environ. Qual. 2001, 30, 1163–1175. [Google Scholar] [CrossRef]
  48. Line, D.E.; White, N.M.; Osmond, D.L.; Jennings, G.D.; Mojonnier, C.B. Pollutant export from various land uses in the upper Neuse River Basin. Water Environ. Res. 2002, 74, 100–108. [Google Scholar] [CrossRef]
  49. Gustafson, L.L.; Showers, W.J.; Thomas, K.; Levine, J.F.; Stoskopf, M. Temporal and spatial variability in stable isotope compositions of a freshwater mussel: Implications for biomonitoring and ecological studies. Oecologia 2007, 152, 140–150. [Google Scholar]
  50. Bucci, J.P.; Showers, W.J.; Genna, B.; Levine, J.F. Stable oxygen and carbon isotope profiles in an invasive bivalve (Corbicula fluminea) in North Carolina watersheds. Geochim. Cosmochim. Acta 2009, 73, 3234–3247. [Google Scholar] [CrossRef]
  51. Kendall, C. Tracing Nitrogen Sources and Cycling in Catchments. In Isotope Tracers in Catchment Hydrology; Kendall, C., McDonnell, J.J., Eds.; Elsevier: New York, NY, USA, 1998; pp. 519–576. [Google Scholar]
  52. Barnes, R.T.; Raymond, P.A. Land use controls on the delivery, processing, and removal of nitrogen from small watersheds: Insights from the dual isotopic composition of stream nitrate. Ecol. Appl. 2010, 20, 1961–1978. [Google Scholar] [CrossRef]
  53. Howarth, R.W.; Boyer, E.W.; Pabich, W.; Galloway, J.N. Nitrogen use in the United States from 1961 to 2000 and potential future trends. Ambio 2002, 31, 88–96. [Google Scholar]
  54. McClelland, J.W.; Valiela, I.; Michener, R.H. Nitrogen-stable isotope signatures in estuarine food webs: A record of increasing urbanization in coastal watersheds. Limnol. Oceanogr. 1997, 42, 930–937. [Google Scholar] [CrossRef]
  55. McKinney, R.A.; Lake, J.L.; Charpentier, M.A. Using mussel isotope ratios to assess anthropogenic nitrogen inputs to freshwater ecosystems. Environ. Monit. Assess. 2002, 74, 167–192. [Google Scholar] [CrossRef]
  56. Savage, C.; Leavitt, P.R.; Elmgren, R. Distribution and retention of effluent nitrogen in surface sediments of a coastal bay. Limnol. Oceanogr. 2004, 49, 1503–1511. [Google Scholar] [CrossRef]
  57. Fierer, N.; Morse, J.L.; Berthrong, S.T.; Bernhardt, E.S.; Jackson, R.B. Environmental controls on the landscape-scale biogeography of stream bacterial communities. Ecology 2007, 88, 2162–2173. [Google Scholar] [CrossRef]

