Article

Modelling Growth of Juvenile Crown-of-Thorns Starfish on the Northern Great Barrier Reef

1
ARC Centre of Excellence for Coral Reef Studies, James Cook University, Townsville QLD 4811, Australia
2
Red Fish Blue Fish Marine, Cairns QLD 4870, Australia
*
Author to whom correspondence should be addressed.
Diversity 2017, 9(1), 1; https://doi.org/10.3390/d9010001
Submission received: 18 November 2016 / Revised: 23 December 2016 / Accepted: 26 December 2016 / Published: 29 December 2016
(This article belongs to the Special Issue Biology, Ecology and Management of Crown-of-Thorns Starfish)

Abstract

:
The corallivorous crown-of-thorns starfish (Acanthaster spp.) is a major cause of coral mortality on Indo-Pacific reefs. Despite considerable research into the biology of crown-of-thorns starfish, our understanding of the early post-settlement life stage has been hindered by the small size and cryptic nature of recently settled individuals. Most growth rates are derived from either laboratory studies or field studies conducted in Fiji and Japan. The Great Barrier Reef (GBR) is currently experiencing its fourth recorded outbreak and population models to inform the progression of outbreaks lack critical growth rates of early life history stages. High numbers of 0+ year juveniles (n = 3532) were measured during extensive surveys of 64 reefs on the northern GBR between May and December 2015. An exponential growth model was fitted to the size measurement data to estimate monthly ranges of growth rates for 0+ year juveniles. Estimated growth rates varied considerably and increased with age (e.g., 0.028–0.041 mm·day−1 for one-month-old juveniles versus 0.108–0.216 mm·day−1 for twelve-month-old juveniles). This pioneering study of 0+ year juveniles on the GBR will inform population models and form the basis for more rigorous ongoing research to understand the fate of newly settled Acanthaster spp.

1. Introduction

Crown-of-thorns starfish (Acanthaster spp.) are among the most intensively studied of all coral reef organisms [1]. This starfish species is renowned for its extreme temporal and spatial variation in abundance, which can result in extensive destruction of coral reef habitats if starfish occur at high densities (during outbreaks). Outbreaks of crown-of-thorns starfish are considered to be one of the foremost causes of significant and sustained declines in live hard coral cover on Indo-Pacific reefs [2,3,4,5]. On Australia’s Great Barrier Reef (GBR), there have been four distinct episodes of outbreaks since the early 1960’s, with the latest outbreak first apparent in 2010 [6,7]. Over a period of 27 years (1985 to 2012), the GBR has lost approximately half of its initial coral cover, with 42% of this loss attributable to recurrent outbreaks of crown-of-thorns starfish [2].
Outbreaks of crown-of-thorns starfish are fundamentally caused by changes in key demographic rates and population dynamics [8], resulting in either progressive accumulation of starfish over several successive cohorts [9] or the rapid onset of outbreaks following a single mass-recruitment event [10]. However, the extent to which these demographic changes are caused by anthropogenic degradation of reef ecosystems (e.g., overfishing and/or eutrophication) versus inherent environmental changes and stochasticity (e.g., cycles of food availability for larvae, juveniles, and/or adult starfish) is largely unknown and widely debated [6,11]. Our understanding of the proximal and ultimate causes of outbreaks has been hampered at least in part by difficulties in studying the early life stages of crown-of-thorns starfish in natural environments [6,11]. Current models [7,12,13] that aim to understand and predict outbreak dynamics lack critical demographic rates, such as estimates of growth rates and survival for early life history stages in the field.
Field-based studies of early life stages of crown-of-thorns starfish have largely been constrained by the small size, cryptic nature, and largely nocturnal habits of recently settled individuals [10], making them difficult to detect and sample [14,15,16]. Attempts to locate 0+ year old juveniles on the GBR have remained largely unsuccessful [14,15,16]. However, studies conducted in Fiji and Japan that followed individual cohorts of crown-of-thorns starfish through time on single island reefs effectively sampled newly settled individuals (0+ year old) [10,17]. Resulting estimates of growth rates for coralline algae feeding juveniles (2–3 mm/month) [10,17] were consistent with early post-settlement growth estimates for laboratory reared juveniles [18,19].
As early stages of newly settled juveniles (i.e., 1–3 months-old starfish after settlement, size = 0.3–5 mm) have rarely been detected in the field [17], demographic rates for these early stages are largely derived from aquarium-based studies [18,19]. Crown-of-thorns starfish have been reared in captivity since 1973, providing important insights into their early development and life history [18,19,20,21]. Once fully developed competent larvae (i.e., at the late brachiolaria stage) find a suitable settlement substrate (i.e., coralline algae), they metamorphose within two days into five-armed juvenile starfish that measure between 0.3 and 0.8 mm in diameter [18,19,22,23]. Yamaguchi (1973) [18] found that laboratory-reared juveniles grew 0.076 mm·day−1 in the 20 weeks following settlement, while Lucas (1974) [19] estimated that 3-month-old juveniles grew 0.048 mm·day−1 in the laboratory. Field-based estimates of juvenile growth rates averaged 0.10–0.15 mm·day−1 in the coralline algae feeding phase and 0.40–0.84 mm·day−1 in the coral feeding phase [10,17]. So far, existing growth data has been fitted with logistic or Gompertz growth equations to describe the sigmoidal growth pattern of crown-of-thorns starfish [10,17,20,21,24]. However, these equations have been acknowledged to be limited in accurately describing growth during distinct life stages [21], and so alternative equations have been suggested for distinct stages, such as for coralline algae feeding juveniles [25] and coral-eating 1+ year old juveniles [21,26].
The purpose of this study was to reconstruct growth curves for juvenile (0+ year old) crown-of-thorns starfish on the northern GBR, based on intensive (near monthly) field sampling of newly settled individuals. The exact ages of juvenile starfish cannot be verified, but may be inferred for 0+ year old starfish by assuming that settlement occurs within a relatively narrow period [10,17]. Here we provide, for the first time, monthly ranges of growth rates for 0+ year juveniles to inform crown-of-thorns starfish population models. In addition, we compare these results to previous field studies and present ranges of predicted mean sizes for different age classes that can be used to inform the planning of future juvenile monitoring studies on the GBR.

2. Materials and Methods

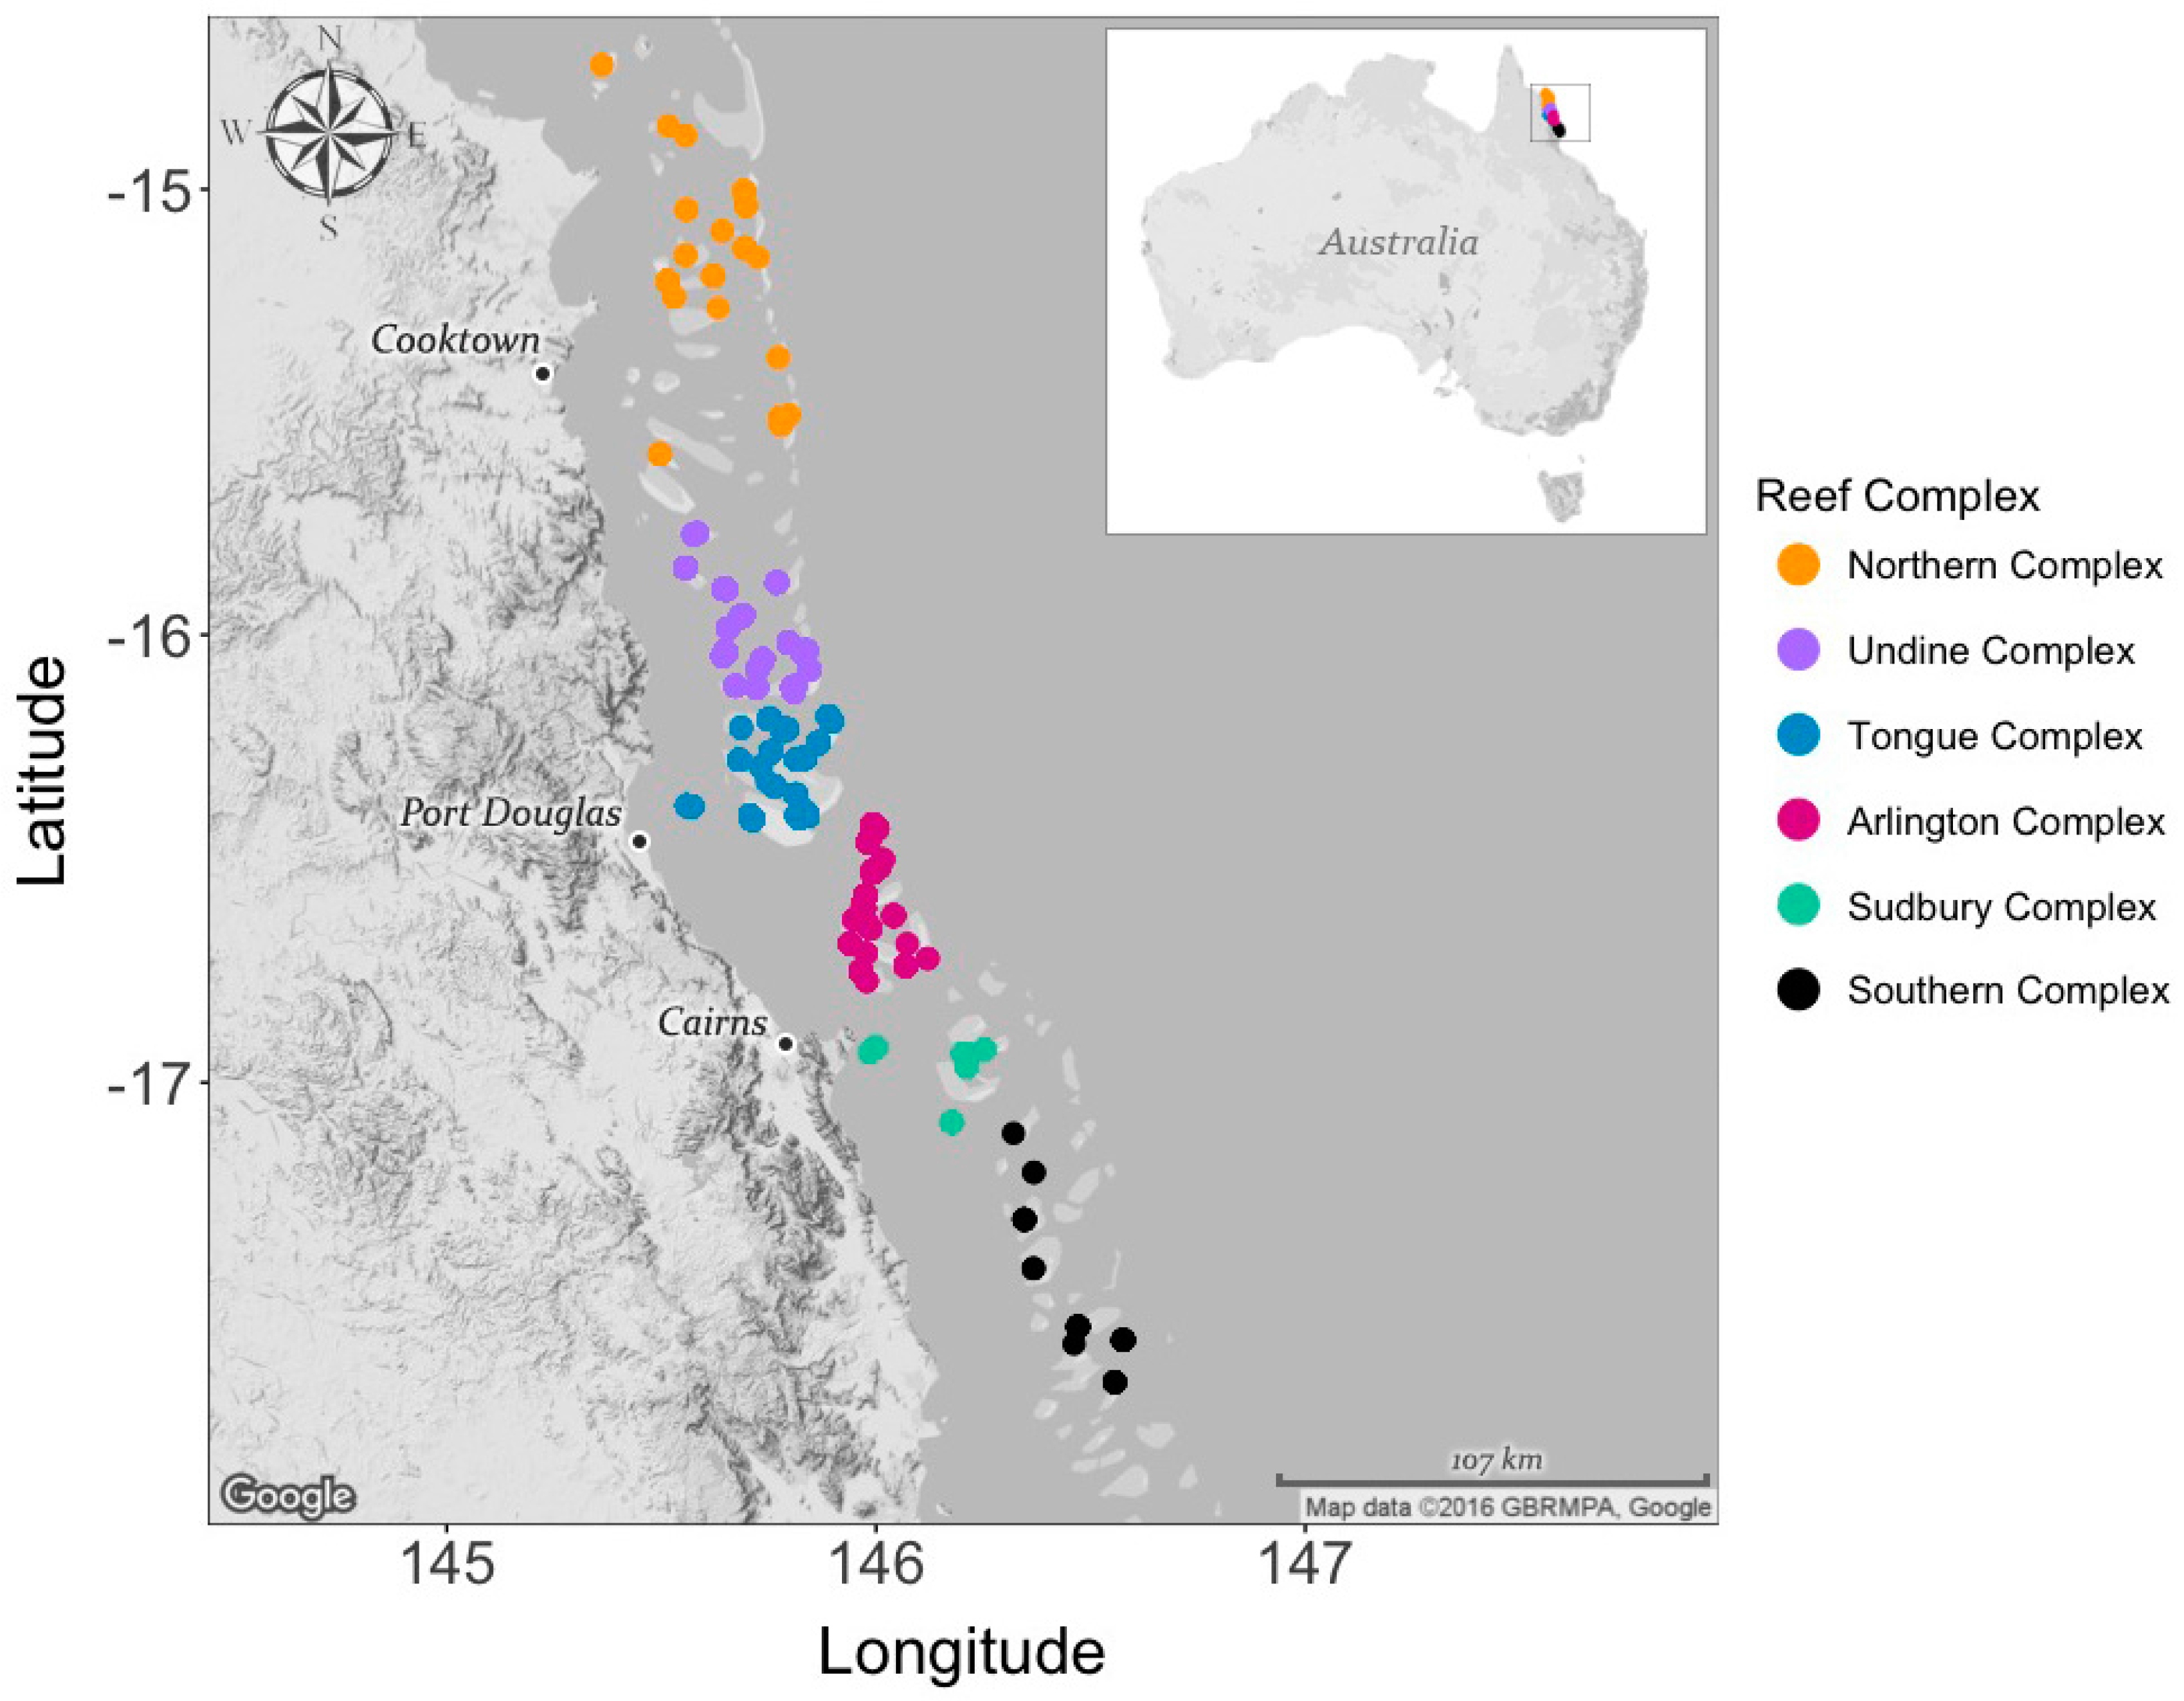
2.1. Field Collection

All field sampling was conducted in conjunction with the Association of Marine Park Tourism Operators’ (AMPTO) crown-of-thorns starfish control vessels during the fourth recorded outbreak of Acanthaster cf. solaris [27] on Australia’s GBR. One hundred and eleven sites on 64 reefs within six geographic locations (or reef complexes) located between 14.72° S and 17.67° S were sampled between 7 May and 15 December 2015 (Figure 1). At each site, 1–2 SCUBA divers searched coralline algae encrusted pieces of dead coral and live coral colonies for juvenile crown-of-thorns starfish and their feeding marks. Individual pieces of live and dead coral were thoroughly inspected for juvenile starfish if feeding marks were sighted on exposed surfaces. Each diver was able to cover up to 250 m2 during a typical 40 min dive. However, if juvenile abundances were high (e.g., 40 individuals collected during a 40 min dive), search effort was restricted to a much smaller area (≈50 m2). All starfish (target size ≤ 50 mm) were collected and placed in sampling jars underwater. This size threshold was selected, as previous growth models [17,21,24] predict that the mean size of starfish from the previous year’s cohort would be >50 mm at the time of our first sampling (May 2015). The size of individuals was not measured in situ, and as such, two of the 3532 juveniles were slightly larger than 50 mm (52.5 mm and 64 mm). These larger individuals were collected in November/December 2015, and were retained in the analysis, as they were likely to have come from the same cohort. After each sampling dive, juvenile starfish were kept alive in containers filled with seawater, and their maximum diameter was measured to the nearest half millimetre with a stainless steel ruler. Once starfish were measured, all individuals were preserved in 95% ethanol for future analyses.

2.2. Growth Curve Analysis
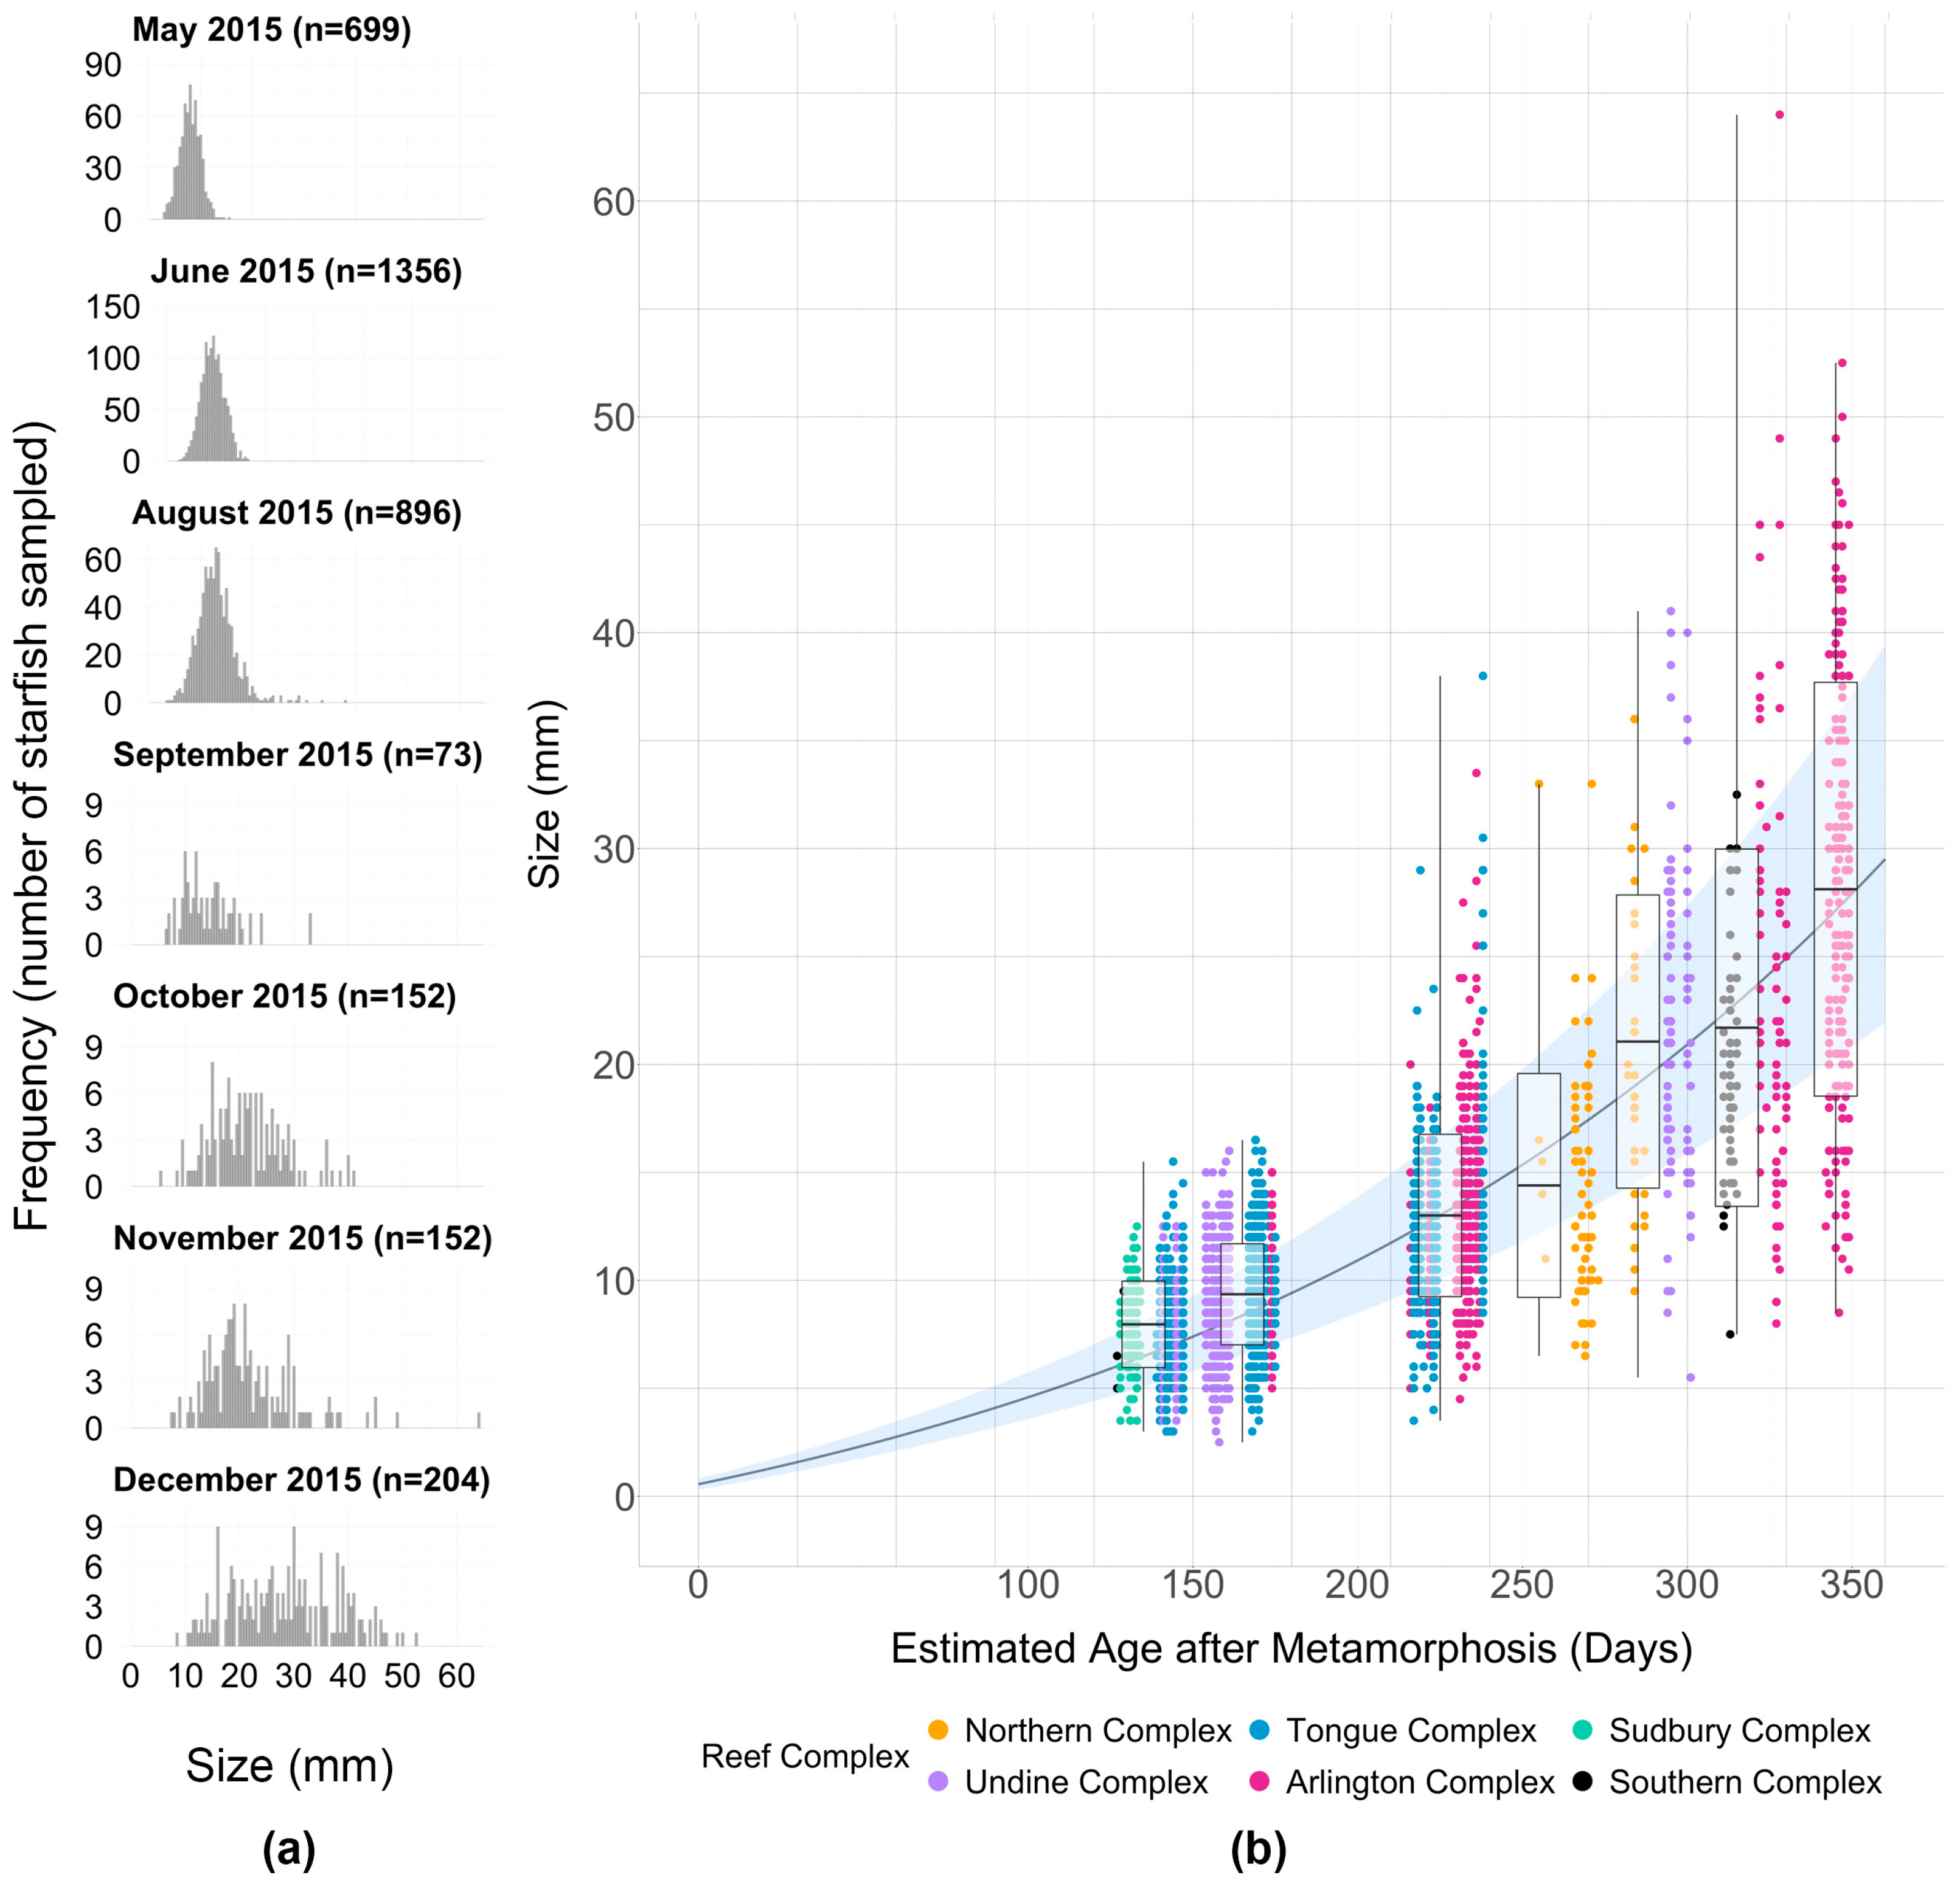
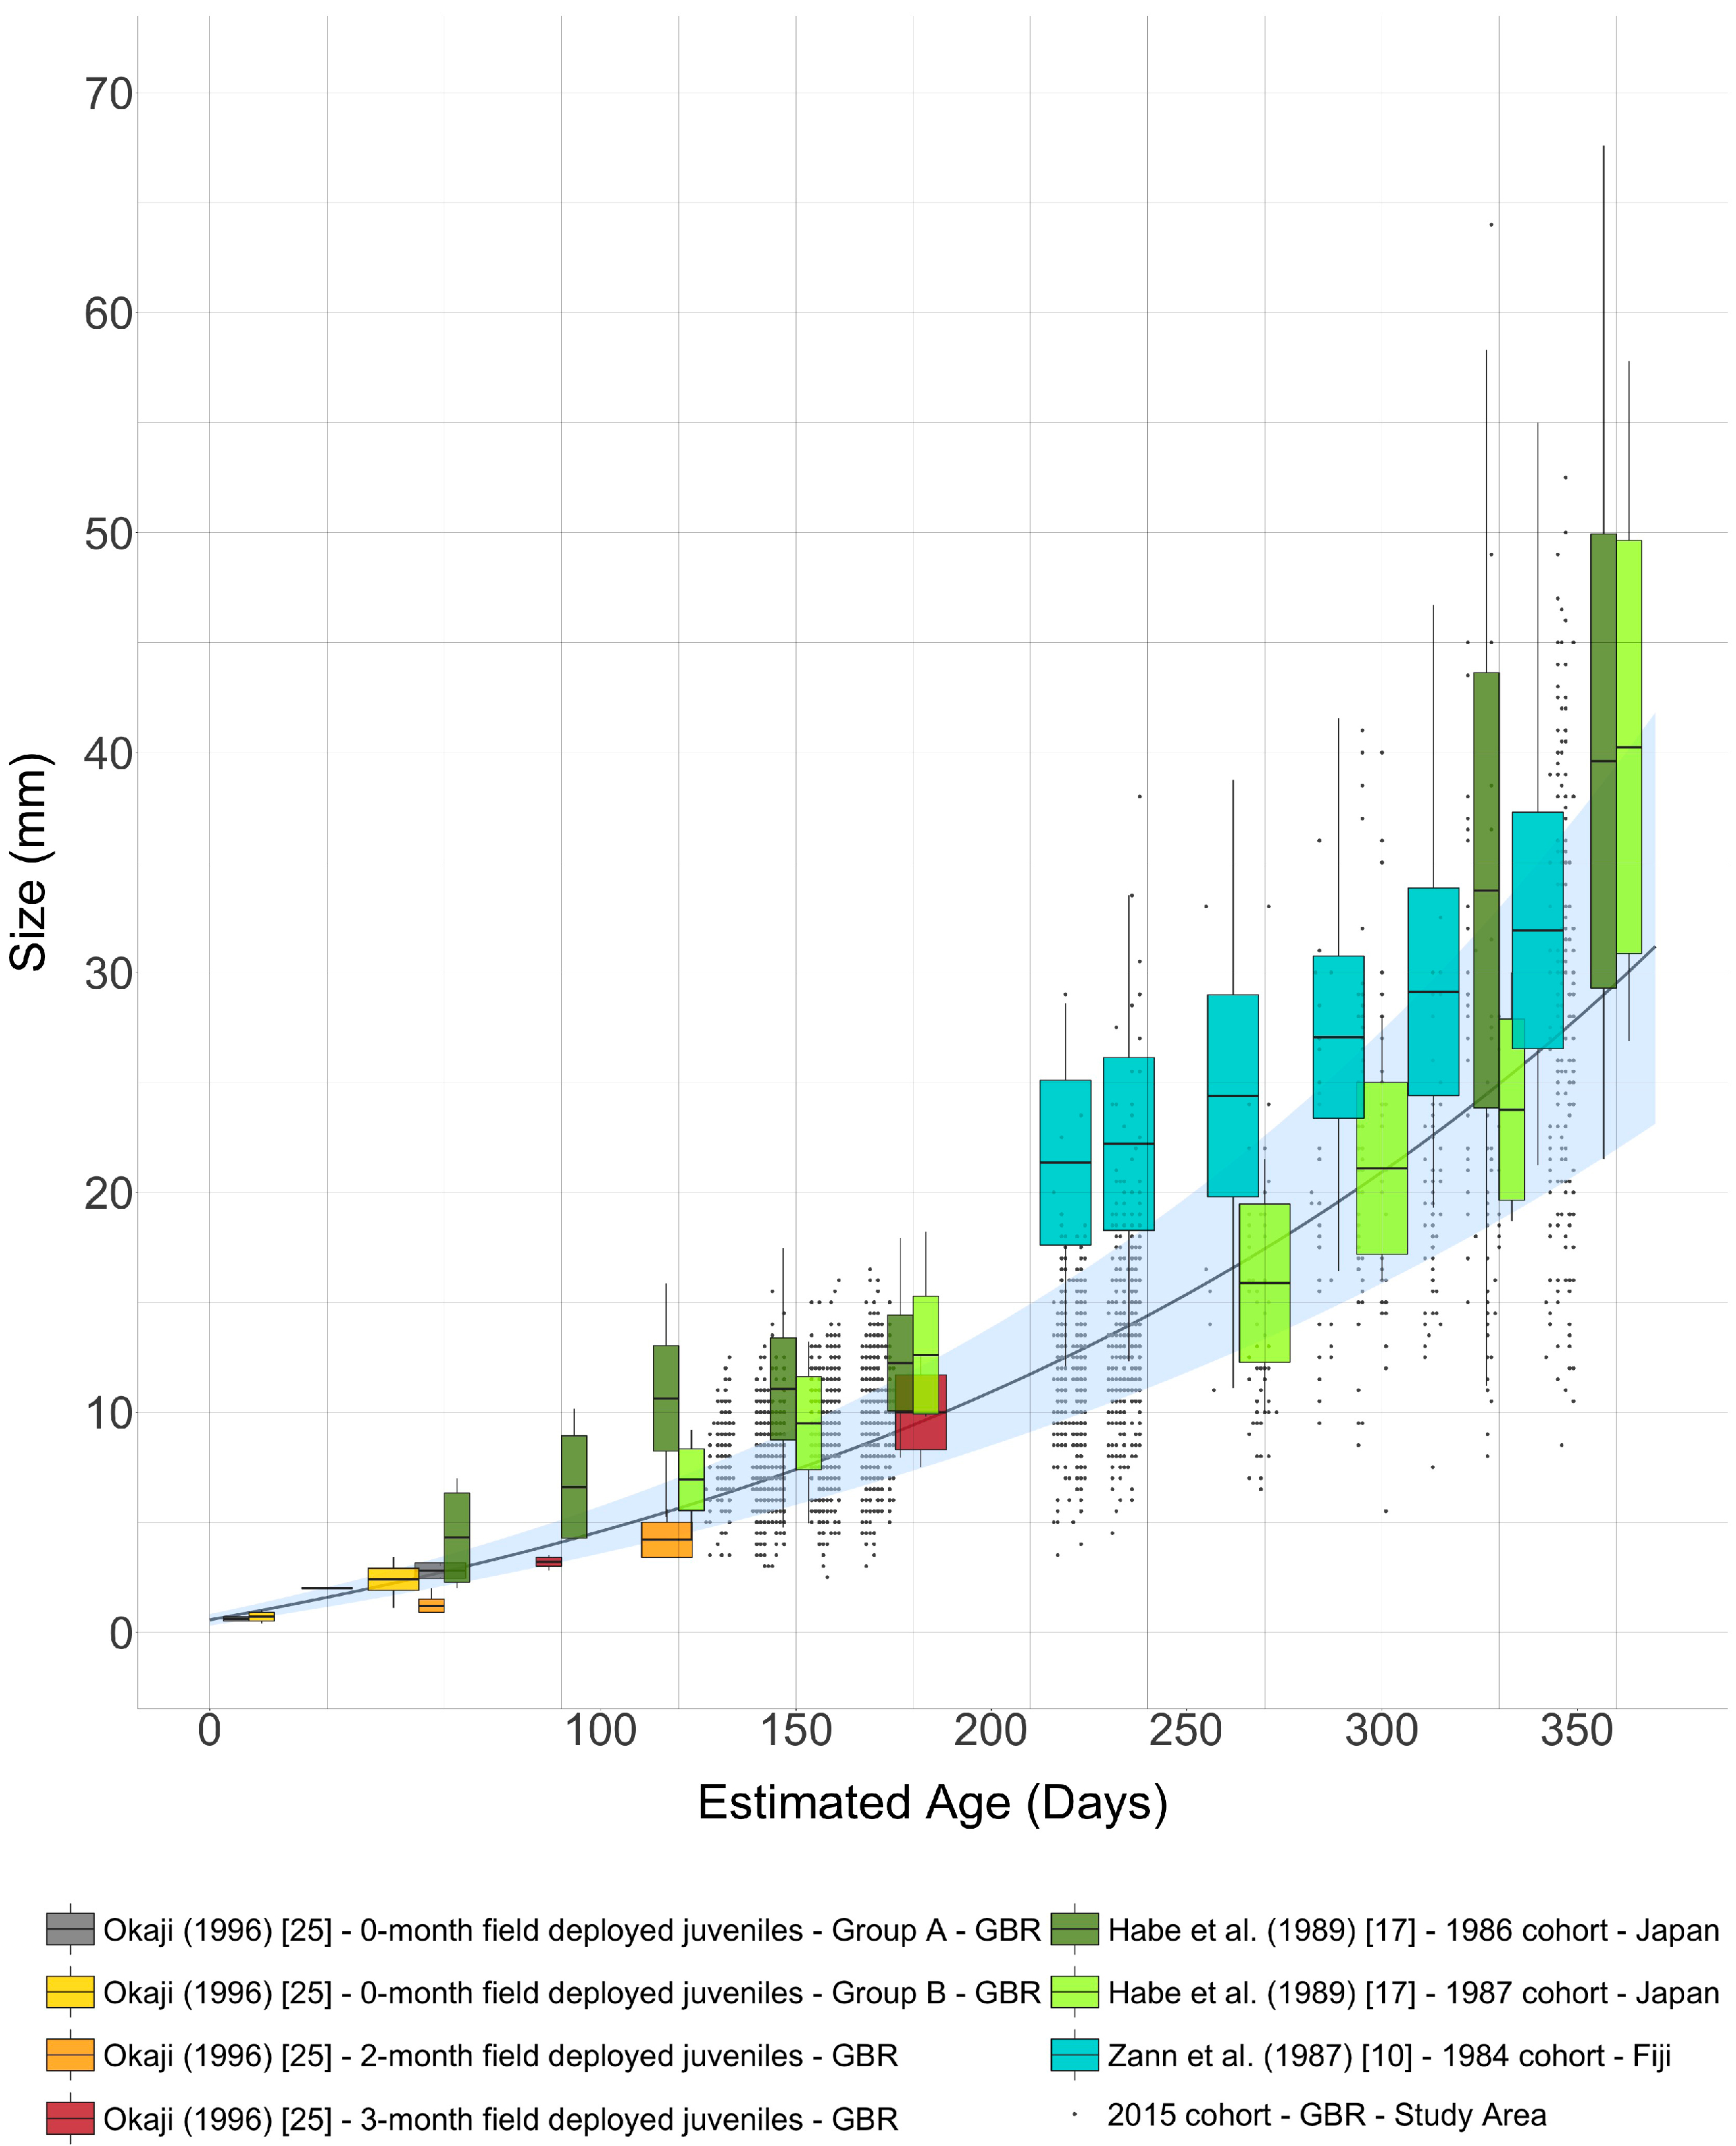
On the GBR, spawning has been reported to occur throughout summer months, but is concentrated in December and January [6]. In the year of sampling, Uthicke et al. (2015) [28] reported that spawning occurred between 10 and 21 of December 2014 in the area of the northern GBR relevant to our study (i.e., 1 to 7 days prior to sampling), and that there was no subsequent spawning throughout December or January. Assuming a planktonic larval duration of 10 to 40 days [22,23,29,30,31,32], settlement is likely to have occurred predominantly—if not exclusively—in early January 2015. As age of sampled individuals cannot be verified, age of sampled juveniles for the model was based on the assumption that all juveniles settled on 1 January 2015 (i.e., 10–21 days after the reported spawning, which incorporates the 17–22 peak settlement window determined by Pratchett et al., in review [33]). Ultimately, all growth estimates are presented as monthly growth rates, and so even if crown-of-thorns starfish settled over several days to weeks, it would have limited influence on our results.
All exploratory and growth curve analyses were conducted using R [34]. A series of preliminary models (e.g., logistic growth model and exponential growth model) were fitted to the 2015-juvenile size data to determine which type of model was most suitable to describe the relationship between size and age. Visual inspection and exploratory analysis of the fitted growth curves (based on least residual sum of squares) identified an exponential growth model (as suggested by Okaji (1996) [25]) in the following form as the most accurate in describing the shape of the size measurement data:
SizeAge = β0 × e k x Age + β1
where Size is the diameter of starfish in mm, Age is number of days since 1 January, and β0, k, and β1 are parameters to be estimated. As size measurements were missing for the initial four months of development (i.e., sampling period: January to April 2015), the y-intercept (i.e., SizeAge=0) was fixed to a biologically meaningful size (see below), representative of the range of predicted mean sizes for newly metamorphosed juvenile starfish in the laboratory ([23]; see Appendix A, Table A1). The growth model may therefore be represented as:
SizeAge = β0 × e k x Age + (SizeAge=0β0)
Three estimates of size after metamorphosis (i.e., SizeAge=0 = 0.30 mm, 0.56 mm, and 0.82 mm) from Fabricius et al. (2010) [23] were used to generate three different m2 models (m2Size at Age0=0.30, m2Size at Age0=0.56, m2Size at Age0=0.82). Best-fit parameter estimates for m1 (β0, k, and β1) and m2 (β0, k) models were obtained with associated 95% confidence intervals using the nlstools package [35]. Residuals from the preliminary models were found to display a distinct wedge pattern, indicating that variance was related to age of juveniles, and thus multiple variance functions (Age2, Age3, Age4) were trialled to optimize best-fit parameter estimates for each model (m1, m2Size at Age0=0.30, m2Size at Age0=0.56, m2Size at Age0=0.82). Best-fit parameter estimates for all 12 models were then used to perform linear mixed effect analysis of the relationship between Size and Age using the nlme package [36]. Reef complex and survey sites were included in the linear mixed effect models as nested random factors to account for variation at the site and reef complex scale, and variance structures (Age2, Age3, Age4) were included to account for the variation in size with age. Best-fit models were selected based on lowest Akaike Information Criterion (AIC). No evidence of spatial autocorrelation was found after both visual (variograms and bubble plots) and statistical inspection (incorporating spatial correlation structures into mixed effects models).
A selection of best-fit models and corresponding 95% confidence intervals was then plotted using the ggplot2 package [37]. The best-fit model of m2Size at Age0=0.56 was plotted with the upper bound of the 95% confidence interval of m2Size at Age0=0.82 and the lower bound of the 95% confidence interval of m2Size at Age0=0.30, forming a so-called “combined 95% confidence interval”. Growth rates (i.e., growth increment per unit time) were calculated for different time spans (i.e., 30-day intervals) for the upper bound of the 95% confidence interval of m2Size at Age0=0.82, and the lower bound of the 95% confidence interval of m2Size at Age0=0.30 to provide ranges of modelled growth rates.

3. Results

Size ranges of juvenile starfish increased as sampling progressed through the year (Figure 2a). Juveniles sampled in May measured between 3 and 15.5 mm in size (size range = 12.5 mm), while those sampled in December ranged from 8.5 to 52.5 mm (size range = 44 mm) (Figure 2a), representing a 3.5-fold increase in size range within this time period.
For m1 models (variable intercept), growth was indeed exponentially related to age (t3420 = 59.79, p < 0.0001), while including site (σ ≈ 0.0007) and reef complex (σ ≈ 0.0003) as random factors. Best model performance was achieved with a variance structure of Age3 (AIC = 18,057), indicating that variance increased cubically with age. However, the best-fit m1 model predicted mean size after metamorphosis (SizeAge=0) to be 5.42 mm. This appears to be erroneous, as it is in stark contrast with the range of expected mean sizes for newly settled juveniles (i.e., 0.30–0.82 mm). Consequently, the m2 models seemed to describe growth more accurately because their intercept was fixed to a biologically relevant size after metamorphosis. Again, for m2 models (fixed intercept), growth was indeed exponentially related to age (m2Size at Age0=0.82, t3420 = 59.55, p < 0.0001), and a variance structure of Age3 gave the best model performance (m2Size at Age0=0.82, AIC = 18,071). Although overall model performance was slightly reduced using the fixed intercept models (based on a higher AIC), fixing the intercept to a biologically meaningful size provides a better characterisation of the growth curves for juvenile crown-of-thorns starfish.
The growth curve analysis highlights increasing variation in size among older individuals. As shown by the distribution of size–frequency data for different sampling periods (Figure 2a) and the gradual widening of the combined 95% confidence interval (Figure 2b), variance increased considerably as juveniles grew older. The increased variation in size with age was further reflected by the increase of monthly ranges of modelled growth rates (Table 1). Ranges of modelled growth rates increased from 0.028–0.041 mm·day−1 for one-month-old juveniles to 0.108–0.216 mm·day−1 for twelve-month-old juveniles.

4. Discussion

This study provides the first estimates of monthly growth rates for 0+ year crown-of-thorns starfish on the GBR based on intensive field sampling of newly settled juvenile starfish. Juvenile crown-of-thorns starfish exhibited exponential growth over the first year on the reef and reached a size of up to 52.5 mm by mid-December. Size ranges of juveniles increased by a factor of 3.5 from May to December. The marked increase in size range was also reflected in the results of the growth curve analysis, which showed that the variation in size increased cubically with age in the best-fit models. Similarly, ranges of modelled growth rates increase with age; while one month old juveniles grow 0.028–0.041 mm·day−1, twelve-month-old juveniles grow 0.108–0.216 mm·day−1.
The increasing variation in size among older individuals may be attributed to variation in the availability of suitable coral prey within specific study sites and microhabitats. Although laboratory studies have shown that same-aged newly settled crown-of-thorns starfish vary in size from the beginning of their post-metamorphic life [23], marked variations in growth rates of juvenile starfish are generally attributed to the availability of suitable coral prey [20,38]. At settlement, crown-of-thorns starfish feed on coralline algae, and it is thought that they preferentially settle in locations (and microhabitats) where coralline algae are ubiquitous [18,39]. After an obligatory period of feeding on coralline algae (4.5—Yamaguchi 1973 [18]), juvenile starfish may or may not transition to feeding on Scleractinian corals, depending upon the local availability of suitable coral prey [10]. The fastest growth rates recorded in both field and laboratory settings are for individuals that make rapid transitions to coral feeding, resulting in accelerated growth and are reported to be significantly larger than siblings that continue to feed on algae [21]. Individual crown-of-thorns starfish that continue to feed on coralline algae after 4–5 months are thought to be more vulnerable to predation by epibenthic fauna [18], whereas fast-growing juveniles that make a rapid transition to feeding on coral—and thereby escape this predation pressure—are more likely to survive [40]. As sampling was conducted on 64 reefs across 111 sites, the availability of suitable coralline algae and coral prey would have differed considerably among microhabitats within and between sampling sites. Individual sampled starfish are likely to have been exposed to different environmental pressures (e.g., predation and food availability) in each of these microhabitats, which would have shaped their growth in the first year of development differently. Consequently, the gradual widening of the 95% confidence interval likely reflects differential growth rates between individuals that have transitioned to feeding on live coral versus those continuing to feed on coralline algae. This appears to be driven by a varying availability of suitable coral prey within microhabitats.
Ranges of modelled growth rates were broadly comparable to both laboratory-reared individuals released into the field [25] and the growth of juvenile cohorts in Japan and Fiji [10,17]. Observed mean sizes, standard deviations, and size ranges of juveniles sampled in these studies [10,17,25] were plotted to the fitted growth curve for comparison (Figure 3). Given the uncertainties related to the approach taken to estimate age in Zann et al. (1987) [10] and Habe et al. (1989) [17], and the discrepancies related to ages being estimated in months instead of days, estimated ages were not standardised across different studies. Care should therefore be taken when interpreting the results of this comparison. While Zann et al. (1987) [10] and Habe et al. (1989) [17] followed distinct cohorts of juvenile starfish in the field, Okaji (1996) [25] deployed four groups of laboratory-reared juveniles of different ages (i.e., 2 × 0-, 2-, and 3-month old juveniles) for varying periods of time (i.e., 49, 37, 57, and 92 days, respectively). For each of these groups, he calculated an initial and final mean size before and after deployment in the field (Figure 3).
Ten-day old juveniles set out in the field on the GBR for 37–49 days grew on average 0.045–0.046 mm·day−1, mostly within the range of the modelled growth rates for the same time span (i.e., 0.030–0.045 mm·day−1) [25]. Similarly, growth rates for 2-month-old starfish (deployment time = 57 days) averaged 0.053 mm·day−1 compared to 0.038–0.059 mm·day−1; while 3-month-old starfish (deployment time = 92 days) grew at a rate of 0.074 mm·day−1 compared to 0.046–0.076 mm·day−1 [25]. Growth rates derived from the findings of field studies conducted in Fiji [10] and Japan [17] are also broadly comparable to the range of modelled growth rates of this study. In Fiji, growth rates averaged 0.087 mm·day−1 for juveniles between 7 and 12 months, largely falling within the modelled range of 0.073–0.135 mm·day−1. Similarly, field studies conducted in Japan showed that juveniles (between 4 and 6 months old) from the 1986-cohort and 1987-cohort grew at 0.121 mm·day−1 and 0.139 mm·day−1 respectively, also within the modelled range of growth rates (i.e., 0.083–0.158 mm·day−1) for the same time span. These results show that growth rates of juvenile Acanthaster spp. in the field appear to be remarkably consistent over large geographic scales. However, mean sizes of juveniles of the 1984-cohort (Fiji) and the 1986-cohort (Japan) deviate considerably from the modelled mean sizes (Figure 3). In both studies, age was estimated based on the date of spawning without taking into account of potentially long planktonic larval durations (i.e., up to 43 days [33]). For instance, juveniles that were sampled in Fiji in July were estimated to be seven months old, based on the assumption of a January spawning [10]. Similarly in Japan, newly settled starfish sampled in July were assumed to be one month old, based on the assumption of a mid-June spawning [17]. Assuming a mid-June spawning and a pelagic larval duration of two weeks, settlement would have occurred at the beginning of July at the earliest. However, juveniles that were collected in July and August were already 2 and 4.30 mm, respectively [17]. These sizes seem considerably large, as we know from laboratory studies that juveniles measure between 0.3 and 0.82 mm after settlement and that it takes approximately 40–45 days to grow to 2 mm, and 80–90 days to grow to 4.3 mm [18]. As a result, ages in Zann et al. (1987) [10] and Habe et al. (1989) [17] are likely to be underestimated by 0.5–1.5 months, resulting in overestimates of growth rates.
An implicit assumption of this study was that spawning occurred within a relatively limited period (in December 2014) across the entire study area. This assumption appears valid, given that the estimated growth rates for field-deployed juveniles of known age are broadly comparable to the range of modelled growth rates. The assumption of a single spawning event or narrow spawning window is also supported by the fact that smaller juveniles became rare as sampling progressed through the year (see Figure 2), indicating that settlement and so spawning did not occur throughout the entire year. Furthermore, spawning occurred in the study area between the 10 and 21 of December 2014 (temperature recorded at Lizard Island at 0.6 m between 12 and 30 December 2014: 28.58 °C–29.29 °C [41]) according to Uthicke et al. (2015) [28]. Assuming a planktonic larval phase of 10 to 40 days [22,23,29,30,31,33], settlement would have occurred between the 20 of December 2014 and 30 of January 2015. However, new research is suggesting that peak settlement likely occurs within 22 days after spawning and fertilization [33], and few larvae persist beyond 30 days post-fertilization. Accordingly, Uthicke et al. (2015) [28] failed to detect larvae in plankton samples from 13 of January onwards. If so, estimated ages (in days) of juveniles (measured from settlement) would have an accuracy of ±12 days.
Low ocean current velocities linked to El Niño-Southern Oscillation (ENSO) hydrodynamics that cause larval retention around reefs or within reef groups are thought to increase survival of crown-of-thorns starfish larvae when they co-occur with enhanced phytoplankton concentrations [42]. According to Wooldridge and Brodie (2015) [42], the 2009 spawning event—which led to the onset of the current outbreak in 2010/2011—coincided with nutrient-enriched stagnant shelf currents. Larvae of the studied cohort would have been present in the water column between 10 December 2014 and 13 January 2015 (temperature range recorded at Lizard Island weather station between 12 December 2014 and 15 January 2015: 27.9 °C–29.5 °C [41]). Mean phytoplankton concentrations (i.e., chlorophyll a) during this period averaged in the Wet Tropics 0.55 μg·L−1 (range: 0–7.35 μg·L−1) for coastal areas, 0.31 μg·L−1 (range: 0.01–12.42 μg·L−1) for midshelf areas, and 0.16 μg·L−1 (range: 0–8.09 μg·L−1) for offshore areas [43]. In comparison, mean chlorophyll a concentrations in December 2009 averaged in the Wet Tropics 0.67 μg·L−1 (range: 0–11.61 μg·L−1) for coastal areas, 0.31 μg·L−1 (range: 0.01–13.82 μg·L−1) for midshelf areas, and 0.19 μg·L−1 (range: 0–2.90 μg·L−1) for offshore areas [43]. While the Southern Oscillation Index (SOI)—which provides an indication of ocean current velocity (neutral SOI = surrogate for low shelf currents)—was −5.5 in December 2014 (compared to −7 in December 2009) and −7.8 in January 2015 (compared to −10.1 in January 2010) [43]. Subsequent SOI values continued to decrease in 2015 to a −20.2 low in October, indicating an El Niña event. Moderate increases in chlorophyll concentrations (up to 1.0–4.0 µg·L−1) that significantly increase rates of larval development, survival, and settlement [23,32,33] would have occurred on multiple occasions in the study area during the pelagic larval phase of the studied cohort. Consequently, larval development, survival, and settlement may have been enhanced in the study area during this time period, leading to high settlement rates and the development of this seemingly conspicuous cohort in 2015.

5. Conclusions

Demographic rates are fundamental to understanding population dynamics and creating meaningful population models. However, attempts to estimate these rates for 0+ year juvenile crown-of-thorns starfish have been hindered by the ability to detect them in the field [14,15,16]. The present study not only demonstrates that 0+ year juveniles can be sampled in high numbers (n = 3532), it also provides ranges of monthly growth rates to inform population models. Here, we also provide evidence that supports the assumption that spawning and subsequent settlement occurred in 2014–2015 during a relatively narrow period of time across a vast geographic area (i.e., 350 km) on the GBR. In addition, the predicted ranges of mean sizes for different sampling periods deliver valuable information to research and management bodies for the planning of juvenile monitoring studies. Rigorous ongoing monitoring should be conducted in the future on a number of selected sites to collect field-based data on demographic rates (e.g., growth, recruitment, mortality, and reproductive output rates) that can be related to variables such as food availability and adult population densities in order to inform population models and improve our understanding of population and outbreak dynamics.

Acknowledgments

We would like to thank the Association for Marine Tourism Operators (AMPTO) for supporting this research. We would also like to thank Ken Okaji for his assistance with the literature research.

Author Contributions

J.W. conceived and designed the experiments; J.W. and D.S. performed the experiments; J.W. and S.M. analysed the data; J.W. produced the figures and tables; J.W., S.M., V.M., A.H., M.P., wrote the paper.

Conflicts of Interest

J.W. and D.S. provide marine consultancy services for crown-of-thorns starfish control and monitoring. They declare no conflict of interest.

Appendix A

Table A1. Mean sizes for newly-metamorphosed starfish reared in the laboratory under naturally occurring chlorophyll a concentrations [23].
Chlorophyll a (μg·L−1)Mean Size (mm)Standard Error (SE)95% Confidence Interval (mm)
0.280.440.070.30–0.58
2.900.660.050.56–0.76
5.200.640.090.46–0.82

References

  1. Moran, P.J. The Acanthaster phenomenon. In Oceanography and Marine Biology: An Annual Review; Aberdeen University Press: Townsville, Australia, 1986. [Google Scholar]
  2. De’ath, G.; Fabricius, K.E.; Sweatman, H.; Puotinen, M. The 27-year decline of coral cover on the Great Barrier Reef and its causes. Proc. Natl. Acad. Sci. USA 2012, 109, 17995–17999. [Google Scholar] [CrossRef] [PubMed]
  3. Osborne, K.; Dolman, A.M.; Burgess, S.C.; Johns, K.A. Disturbance and the dynamics of coral cover on the Great Barrier Reef (1995–2009). PLoS ONE 2011, 6, e17516. [Google Scholar] [CrossRef] [PubMed]
  4. Baird, A.H.; Pratchett, M.S.; Hoey, A.S.; Herdiana, Y.; Campbell, S.J. Acanthaster planci is a major cause of coral mortality in Indonesia. Coral Reefs 2013, 32, 803–812. [Google Scholar] [CrossRef]
  5. Chesher, R.H. Destruction of Pacific Corals by the Sea Star Acanthaster planci. Science 1969, 165, 280–283. [Google Scholar] [CrossRef] [PubMed]
  6. Pratchett, M.S.; Caballes, C.F.; Posada, J.A.R.; Sweatman, H.P.A. Limits to understanding and managing outbreaks of crown-of-thorns starfish (Acanthaster spp.). Oceanogr. Mar. Biol. Annu. Rev. 2014, 52, 133–200. [Google Scholar]
  7. Vanhatalo, J.; Hosack, G.R.; Sweatman, H. Spatiotemporal modelling of crown-of-thorns starfish outbreaks on the Great Barrier Reef to inform control strategies. J. Appl. Ecol. 2016. [Google Scholar] [CrossRef]
  8. Moore, R.J. Persistent and transient populations of the crown-of-thorns starfish, Acanthaster planci. In Acanthaster and the Coral Reef: A Theoretical Perspective, Proceedings of a Workshop Held at the Australian Institute of Marine Science, Townsville, Australia, 6–7 August 1988; Bradbury, R., Ed.; Springer: Berlin/Heidelberg, Germany, 1990; pp. 236–277. [Google Scholar]
  9. Pratchett, M.S. Dynamics of an outbreak population of Acanthaster planci at Lizard Island, northern Great Barrier Reef (1995–1999). Coral Reefs 2005, 24, 453–462. [Google Scholar] [CrossRef]
  10. Zann, L.; Brodie, J.; Berryman, C.; Naqasima, M. Recruitment, ecology, growth and behavior of juvenile Acanthaster Planci (L.) (Echinodermata: Asteroidea). Bull. Mar. Sci. 1987, 41, 561–575. [Google Scholar]
  11. Caballes, C.F.; Pratchett, M.S. Reproductive biology and early life history of the crown-of-thorns starfish. In Echinoderms—Ecology, Habitats and Reproductive Biology; Whitmore, E., Ed.; Nova Science Publishers, Inc.: New York, NY, USA, 2014; pp. 101–146. [Google Scholar]
  12. Morello, E.B.; Plagányi, É.E.; Babcock, R.C.; Sweatman, H.; Hillary, R.; Punt, A.E. Model to manage and reduce crown-of-thorns starfish outbreaks. Mar. Ecol. Prog. Ser. 2014, 512, 167–183. [Google Scholar] [CrossRef]
  13. MacNeil, M.A.; Mellin, C.; Pratchett, M.S.; Hoey, J.; Anthony, K.R.N.; Cheal, A.J.; Miller, I.; Sweatman, H.; Cowan, Z.L.; Taylor, S.; et al. Joint estimation of crown of thorns (Acanthaster planci) densities on the Great Barrier Reef. PeerJ 2016, 4, e2310. [Google Scholar] [CrossRef] [PubMed]
  14. Doherty, P.J.; Davidson, J. Monitoring the distribution and abundance of juvenile Acanthaster planci. In Proceedings of the 6th International Coral Reef Symposium, Townsville, Australia, 8–12 August 1988; Volume 2, pp. 131–136.
  15. Pearson, R.G.; Endean, R. A Preliminary Study of the Coral Predator Acanthaster planci (L) (Asteroidea) on the Great Barrier Reef; Fisheries Notes, Department of Harbours and Marine Queensland: Brisbane, Australia, 1969; pp. 27–68. [Google Scholar]
  16. Johnson, D.B.; Moran, P.J.; Baker, V.J.; Christie, C.A.; Miller, I.R.; Miller-Smith, B.A.; Thompson, A.A. Report on Field Surveys to Locate High Density Populations of Juvenile Crown-of-Thorns Starfish (Acanthaster Planci) within the Central Great Barrier Reef; Australian Institute of Marine Science: Townsville, Australia, 1991. [Google Scholar]
  17. Habe, T.; Yamamoto, G.; Nagai, A.; Kosaka, M.; Ogura, M.; Sawamoto, S.; Ueno, S.; Yokochi, H. Studies on the Conservation and Management of Coral Reefs and the Control of Acanthaster Planci Juveniles; Report of Grant-in-Aid for Scientific Research, Ministry of Education, Science and Culture; Japan, 1989; pp. 158–186. [Google Scholar]
  18. Yamaguchi, M. Early life histories of coral reef asteroids, with special reference to Acanthaster planci (L.). In Biology and Geology of Coral Reefs; Jones, O.A., Endean, R., Eds.; Academic Press, Inc.: New York, NY, USA, 1973; pp. 369–387. [Google Scholar]
  19. Lucas, J.S. Environmental influences on the early development of Acanthaster planci (L.). In Proceedings of the Crown-of-Thorns Starfish Seminar Proceedings, Brisbane, Australia, 6 September 1974; Australian Government Publishing Service: Canberra, Australia, 1974; pp. 109–121. [Google Scholar]
  20. Yamaguchi, M. Growth of juvenile Acanthaster planci (L.) in the laboratory. Pac. Sci 1974, 28, 123–138. [Google Scholar]
  21. Lucas, J.S. Growth, maturation and effects of diet in Acanthaster planci (L.) (Asteroidea) and hybrids reared in the laboratory. J. Exp. Mar. Biol. Ecol. 1984, 79, 129–147. [Google Scholar] [CrossRef]
  22. Henderson, J.A.; Lucas, J.S. Larval development and metamorphosis of Acanthaster planci (Asteroidea). Nature 1971, 232, 655–657. [Google Scholar] [CrossRef] [PubMed]
  23. Fabricius, K.E.; Okaji, K.; De’ath, G. Three lines of evidence to link outbreaks of the crown-of-thorns seastar Acanthaster planci to the release of larval food limitation. Coral Reefs 2010, 29, 593–605. [Google Scholar] [CrossRef]
  24. Zann, L.; Brodie, J.; Vuki, V. History and dynamics of the crown-of-thorns starfish Acanthaster planci (L.) in the Suva area, Fiji. Coral Reefs 1990, 9, 135–144. [Google Scholar] [CrossRef]
  25. Okaji, K. Feeding Ecology in the Early Life Stages of the Crown-of-Thorns Starfish, Acanthaster planci (L.). Ph.D. Thesis, James Cook University, Townsville, Australia, February 1996; p. 140. [Google Scholar]
  26. Kenchington, R.A. Growth and recruitement of Acanthaster planci (L.) on the Great Barrier Reef. Biol. Conserv. 1977, 11, 103–118. [Google Scholar] [CrossRef]
  27. Haszprunar, G.; Spies, M. An integrative approach to the taxonomy of the crown-of-thorns starfish species group (Asteroidea: Acanthaster): A review of names and comparison to recent molecular data. Zootaxa 2014, 3841, 271–284. [Google Scholar] [CrossRef] [PubMed]
  28. Uthicke, S.; Doyle, J.; Duggan, S.; Yasuda, N.; McKinnon, A.D. Outbreak of coral-eating Crown-of-Thorns creates continuous cloud of larvae over 320 km of the Great Barrier Reef. Sci. Rep. 2015, 5. [Google Scholar] [CrossRef] [PubMed]
  29. Lucas, J.S. Quantitative studies of feeding and nutrition during larval development of the coral reef asteroid Acanthaster planci (L.). J. Exp. Mar. Biol. Ecol. 1982, 65, 173–193. [Google Scholar] [CrossRef]
  30. Uthicke, S.; Pecorino, D.; Albright, R.; Negri, A.P.; Cantin, N.; Liddy, M.; Dworjanyn, S.; Kamya, P.; Byrne, M.; Lamare, M. Impacts of ocean acidification on early life-history stages and settlement of the coral-eating sea star Acanthaster planci. PLoS ONE 2013, 8, e82938. [Google Scholar] [CrossRef] [PubMed]
  31. Uthicke, S.; Logan, M.; Liddy, M.; Francis, D.; Hardy, N.; Lamare, M. Climate change as an unexpected co-factor promoting coral eating seastar (Acanthaster planci) outbreaks. Sci. Rep. 2015, 5. [Google Scholar] [CrossRef] [PubMed]
  32. Wolfe, K.; Graba-Landry, A.; Dworjanyn, S.A.; Byrne, M. Larval starvation to satiation: Influence of nutrient regime on the success of Acanthaster planci. PLoS ONE 2015, 10, e0122010. [Google Scholar] [CrossRef] [PubMed]
  33. Pratchett, M.S.; Dworjanyn, S.A.; Mos, B.; Caballes, C.F.; Thompson, C.; Blowes, S. Larval survivorship and settlement of crown-of-thorns starfish (Acanthaster cf. solaris) at varying chlorophyll concentrations. Diversity 2016. [Google Scholar] [CrossRef]
  34. R Core Team. A Language and Environment for Statistical Computing; R Foundation for Statistical Computing: Vienna, Austria, 2016. [Google Scholar]
  35. Baty, F.; Ritz, C.; Charles, S.; Brutsche, M.; Flandrois, J.-P.; Delignette-Muller, M.-L. A toolbox for nonlinear regression in R: The package nlstools. J. Stat. Softw. 2015, 66, 21. [Google Scholar] [CrossRef]
  36. Pinheiro, J.; Bates, D.; DebRoy, S.; Sarkar, D.; Team, R.C. nlme: Linear and Nonlinear Mixed Effects Models; R Package Version 3.1-128; R Foundation for Statistical Computing: Vienna, Austria, 2016. [Google Scholar]
  37. Wickham, H. ggplot2: Elegant Graphics for Data Analysis; Springer-Verlag: New York, NY, USA, 2009. [Google Scholar]
  38. Birkeland, C.; Lucas, J.S. Acanthaster planci: Major Management Problem of Coral Reefs; CRC Press, Inc.: Boca Raton, FL, USA, 1990; p. 257. [Google Scholar]
  39. Yokochi, H.; Ogura, M. Spawning period and discovery of juvenile Acanthaster planci (L.) (Echinodermata: Asteroidea) at northwestern Iriomote-Jima, Ryukyu Islands. Bull. Mar. Sci. 1987, 41, 611–616. [Google Scholar]
  40. Keesing, J.; Halford, A. Field measurement of survival rates of juvenile Acanthaster planci, techniques and preliminary results. Mar. Ecol. Prog. Ser. 1992, 85, 107–114. [Google Scholar] [CrossRef]
  41. Australian Institute of Marine Science. The Future of the Reef. Data Centre, AIMS. Available online: http://data.aims.gov.au/aimsrtds/yearlytrends.xhtml (accessed on 22 December 2016).
  42. Wooldridge, S.A.; Brodie, J.E. Environmental triggers for primary outbreaks of crown-of-thorns starfish on the Great Barrier Reef, Australia. Mar. Pollut. Bull. 2015, 101, 805–815. [Google Scholar] [CrossRef] [PubMed]
  43. Australian Bureau of Meteorology (BOM). eReefs. Available online: http://www.bom.gov.au/marinewaterquality/ (accessed on 22 December 2016).
Figure 1. Map of the north Queensland coast showing the sampling locations (n = 111) and designated reef complexes (n = 6) for the collection of 0+ year crown-of-thorns starfish.
Diversity 09 00001 g001
Figure 2. (a) Monthly size–frequency distributions of juvenile crown-of-thorns starfish sampled during May–December 2015; (b) Fitted growth curve (m2Size at Age0=0.56, black line) and combined 95% confidence interval (light blue) for the 0+ year crown-of-thorns starfish cohort sampled in the northern Great Barrier Reef (GBR). The combined 95% confidence interval is formed by the lower and upper bounds of the 95% confidence interval of m2 growth models with size at age 0 set to 0.30 mm and 0.82 mm, respectively. Individual starfish of the 2015 cohort are depicted as points, and the colours indicate the reef complex (see Figure 1). Each boxplot (by sampling month) is characterised by a mean size (horizontal middle line), ±one standard deviation (rectangle), and minimum and maximum size (vertical line). The vertical lines of the grid indicate 30-day intervals.
Diversity 09 00001 g002
Figure 3. Fitted growth curve (black line) and combined 95% confidence interval for the 2015 crown-of-thorns starfish cohort (GBR). Individual observations of the 2015 cohort are depicted as points, while boxplots represent the results of previous field studies (Zann et al., 1987 [10], n = 651; Habe et al., 1989 [17], n1986 = 683 and n1987 = 125; Okaji, 1996 [25], ninitial = 1137 and nfinal = 138). Each boxplot is characterised by a mean size (horizontal middle line), ±one standard deviation (rectangle), and minimum and maximum size (vertical line). Note that the estimated age in Zann et al. (1987) [10] and Habe et al. (1989) [17] likely represents the age after fertilisation without taking into account potentially long planktonic larval durations (PLDs); ages are therefore likely to be underestimated. In contrast, the estimated age in Okaji (1996) [25] and the present study represents the age after metamorphosis (i.e., after settlement).
Diversity 09 00001 g003
Table 1. Range of modelled mean sizes and growth rates for estimated age (in months after metamorphosis) and different time spans (30-day intervals).
Estimated Age after Metamorphosis (Months)Time Span (30-Day Interval)Range of Modelled Mean Sizes (mm)Range of Modelled Growth Rates (mm·Day−1)
10–300.30–2.040.028–0.041
230–601.15–3.460.032–0.047
360–902.11–5.120.036–0.055
490–1203.19–7.040.041–0.064
5120–1504.41–9.280.046–0.075
6150–1805.79–11.890.052–0.087
7180–2107.35–14.930.059–0.101
8210–2409.11–18.470.066–0.118
9240–27011.09–22.580.075–0.137
10270–30013.33–27.370.084–0.160
11300–33015.87–32.940.095–0.186
12330–36018.73–39.430.108–0.216

