Review

Potential Population Genetic Consequences of Habitat Fragmentation in Central European Forest Trees and Associated Understorey Species—An Introductory Survey

Department of Forest Genetics, Austrian Research Centre for Forests, Seckendorff-Gudent-Weg 8, A-1131 Vienna, Austria
*
Author to whom correspondence should be addressed.
Diversity 2017, 9(1), 9; https://doi.org/10.3390/d9010009
Submission received: 15 November 2016 / Revised: 20 January 2017 / Accepted: 7 February 2017 / Published: 14 February 2017
(This article belongs to the Special Issue Characterization and Preservation of Plant Genetic Diversity)

Abstract

:
Habitat fragmentation threatens the maintenance of genetic diversity of affected populations. Assessment of the risks associated with habitat fragmentation is a big challenge as the change in population genetic diversity is a dynamic process, often acting over long time periods and depending on various characteristics pertaining to both species (life history traits) and their populations (extrinsic characteristics). With this survey, we provide an introductory overview for persons who have to make or are interested in making predictions about the fate of forest-dwelling plant populations which have recently become fragmented and isolated from their main occurrences. We provide a concise introduction to the field of population genetics focusing on terms, processes and phenomena relevant to the maintenance of genetic diversity and vitality of plant populations. In particular the antagonistic effects of gene flow and random genetic drift are covered. A special chapter is devoted to Central European tree species (including the Carpathians) which we treat in detail with reference to an extensive literature survey on population genetic studies assembled from the whole of Europe. We further provide an overview of the population biology of associated understorey species. We conclude with recommended steps to be taken for the evaluation of potential perils of habitat fragmentation or population thinning for the genetics of tree populations. The complexity of effects exerted by life history traits and extrinsic characteristics of populations suggest population genetic development is strongly situation dependent. Therefore, we recommend following a case-by-case approach ideally supported by computer simulations to predict future population genetic development of both trees and associated understorey species.

1. Introduction

The area covered by European forests has fluctuated significantly over historic and recent times. Deforestation peaked in most European countries during the 18th and 19th centuries [1] and, since then, the forest area has increased overall [2]. In Europe, deforestation is the preponderant cause of habitat fragmentation in these ecosystems and mainly caused by man. Besides human-mediated deforestation, also wind breaks or pathogenic calamities as well as forest fires cause habitat fragmentation over extended time periods. As a consequence of long-term habitat fragmentation and accompanying isolation, the population genetic theory predicts a loss of genetic diversity, increased inbreeding and eventually inbreeding depression. In particular, allelic richness (i.e., the total number of genetic variants in a population) is sensitive to habitat fragmentation [3]. Over the long-term, the adaptation potential of populations and their fitness may be impaired in cases where selective alleles are concerned.
Evidence on the genetic consequences of habitat fragmentation for forest-dwelling plant species in Europe is contradictory. While human-mediated habitat fragmentation, for instance, in common beech (Fagus sylvatica) increased inbreeding [4] or diminished genetic variation in pedunculate oak (Quercus robur) [5], genetic effects on common ash (Fraxinus excelsior) due to fragmentation were hardly detectable [6]. Such contradictory results in forest tree species have various explanations. The ability to compensate for negative genetic effects due to fragmentation differs significantly among species [7] and situations. Individual responses by species are causally connected to characteristics pertaining to both life history traits of the species (e.g., mode of pollen and seed transfer or the breeding and mating system) and to characteristics of the affected populations (extrinsic characteristics such as spatial arrangement, shape or size of populations) [8,9,10].
The two foremost processes for the maintenance of genetic diversity of populations following fragmentation are gene flow and genetic drift, which exert antagonistic effects on genetic diversity. In the scope of this survey, we will: (1) first provide a general introduction to these processes and explain the mechanisms by which they are acting both separately and in combination; (2) then provide an introduction to traditional and more sophisticated approaches to measure gene flow, discuss their limits and summarize results available from published studies; (3) based on an extensive literature review, we will explore the role of life history traits in shaping the population genetic structure of Central European tree species and the relative sensitivity of species to habitat fragmentation; (4) further address the ultimate consequences of habitat fragmentation, i.e., the loss of genetic diversity and/or critical reduction of population size leading to inbreeding; (5) finally, we conclude on situations considered critical for long-term maintenance of genetic diversity of fragmented populations and recommend strategies which can be followed to predict future development of their genetics.
In the context of this survey, we define population fragmentation as the temporal or permanent condition of spatial separation of populations, mainly resulting from human activity, which had once been part of a more continuous and extended species occurrence. In particular, we treat tree species (i.e., woody plants reaching a height of at least 10 m) native to Central Europe (following the taxonomy and the geographic circumscription of Central Europe applied by Ehrendorfer [11]) and the Carpathians including the Carpathian basin, and assembled population genetic studies performed in natural population of these species from the whole of Europe. Further associated forest understorey species were treated in order to provide a general overview of their population biology. We focus on the local geographic scale, i.e., address interconnectedness of populations separated by up to several kilometers.

1.1. The Foundation: Basics of Population Genetics

In the following, we refer to population as the community of potentially interbreeding individuals sharing a common gene pool and belonging to a given species within a predefined restricted spatial area—as usually done by practitioners [12]. Population genetics foremost aims to collect data on qualitative and quantitative genetic variation present within populations. Nowadays genetic variation is primarily assessed using molecular techniques. Analyses of DNA sequences and DNA fragment length variation (in particular microsatellites [13]) largely replaced former assessment of variation in isozyme forms pertaining to the primary metabolism [14] and quantify genetic variation in types and numbers of observed molecular variants (alleles in the following). Based on such data, two basic population genetic measures can be calculated: the genetic diversity of populations and the genetic differentiation of populations. Population genetic diversity sensu lato is a representation of the number (allelic richness) and the frequency of alleles (e.g., Nei’s gene diversity [15] or effective gene diversity [16]) within a population. Population genetic differentiation, in contrast, is a measure of unevenness or nonrandom distribution of alleles (here in space) most commonly described in terms of Fst [17] or Gst [18] statistics (with Fst and Gst = 0 = no differentiation, and 1 = maximal differentiation).
Both population genetic diversity and differentiation are governed by four fundamental evolutionary processes: (1) genetic drift which either may be random, i.e., random genetic drift, and then refers to stochastic changes in the frequencies of alleles from one generation to the next, or, results from exceptional demographic changes in population size; (2) gene flow or the exchange of alleles among populations; (3) mutation giving rise to novel alleles; and finally (4) selection. Gene flow and mutation tend to increase whilst random genetic drift decreases population genetic diversity. As mutation occurs at rates several orders of magnitudes lower (ranging from c. 10−3–10−5 for microsatellites to 10−11 per locus and generation for conserved genes) compared to common rates of gene flow [19], it can be negligible in small populations and over short time periods, circumstances usually encountered in fragmented populations and relevant for the management of threatened populations. This is because mutation only becomes an effective force at rates ≥1/N with N being the number of individuals within a population (for further reading explaining the relation see Hartl and Clark [20] or Wang [21]). Analogously, gene flow and random genetic drift exert antagonistic effects on population genetic differentiation with the first process decreasing and the second one increasing differentiation. Selection, finally, changes the frequency of particular alleles and depends on the reigning ecological conditions [21,22]. Selection can strongly affect diversity and patterns of differentiation of a gene locus under selection. Because most segregating molecular variants used in population genetics are selectively neutral (e.g., [23], pp. 30–47), population genetic diversity and differentiation for neutral markers are not prone to be modified by selection compared to adaptive genes (e.g., [24]). Genome-wide diversity and differentiation, nevertheless, may be affected in case of selection against inbred genotypes in a population which declines in size. Selection may further be of importance for gene flow as a filter against immigrating individuals maladapted to reigning ecological conditions.

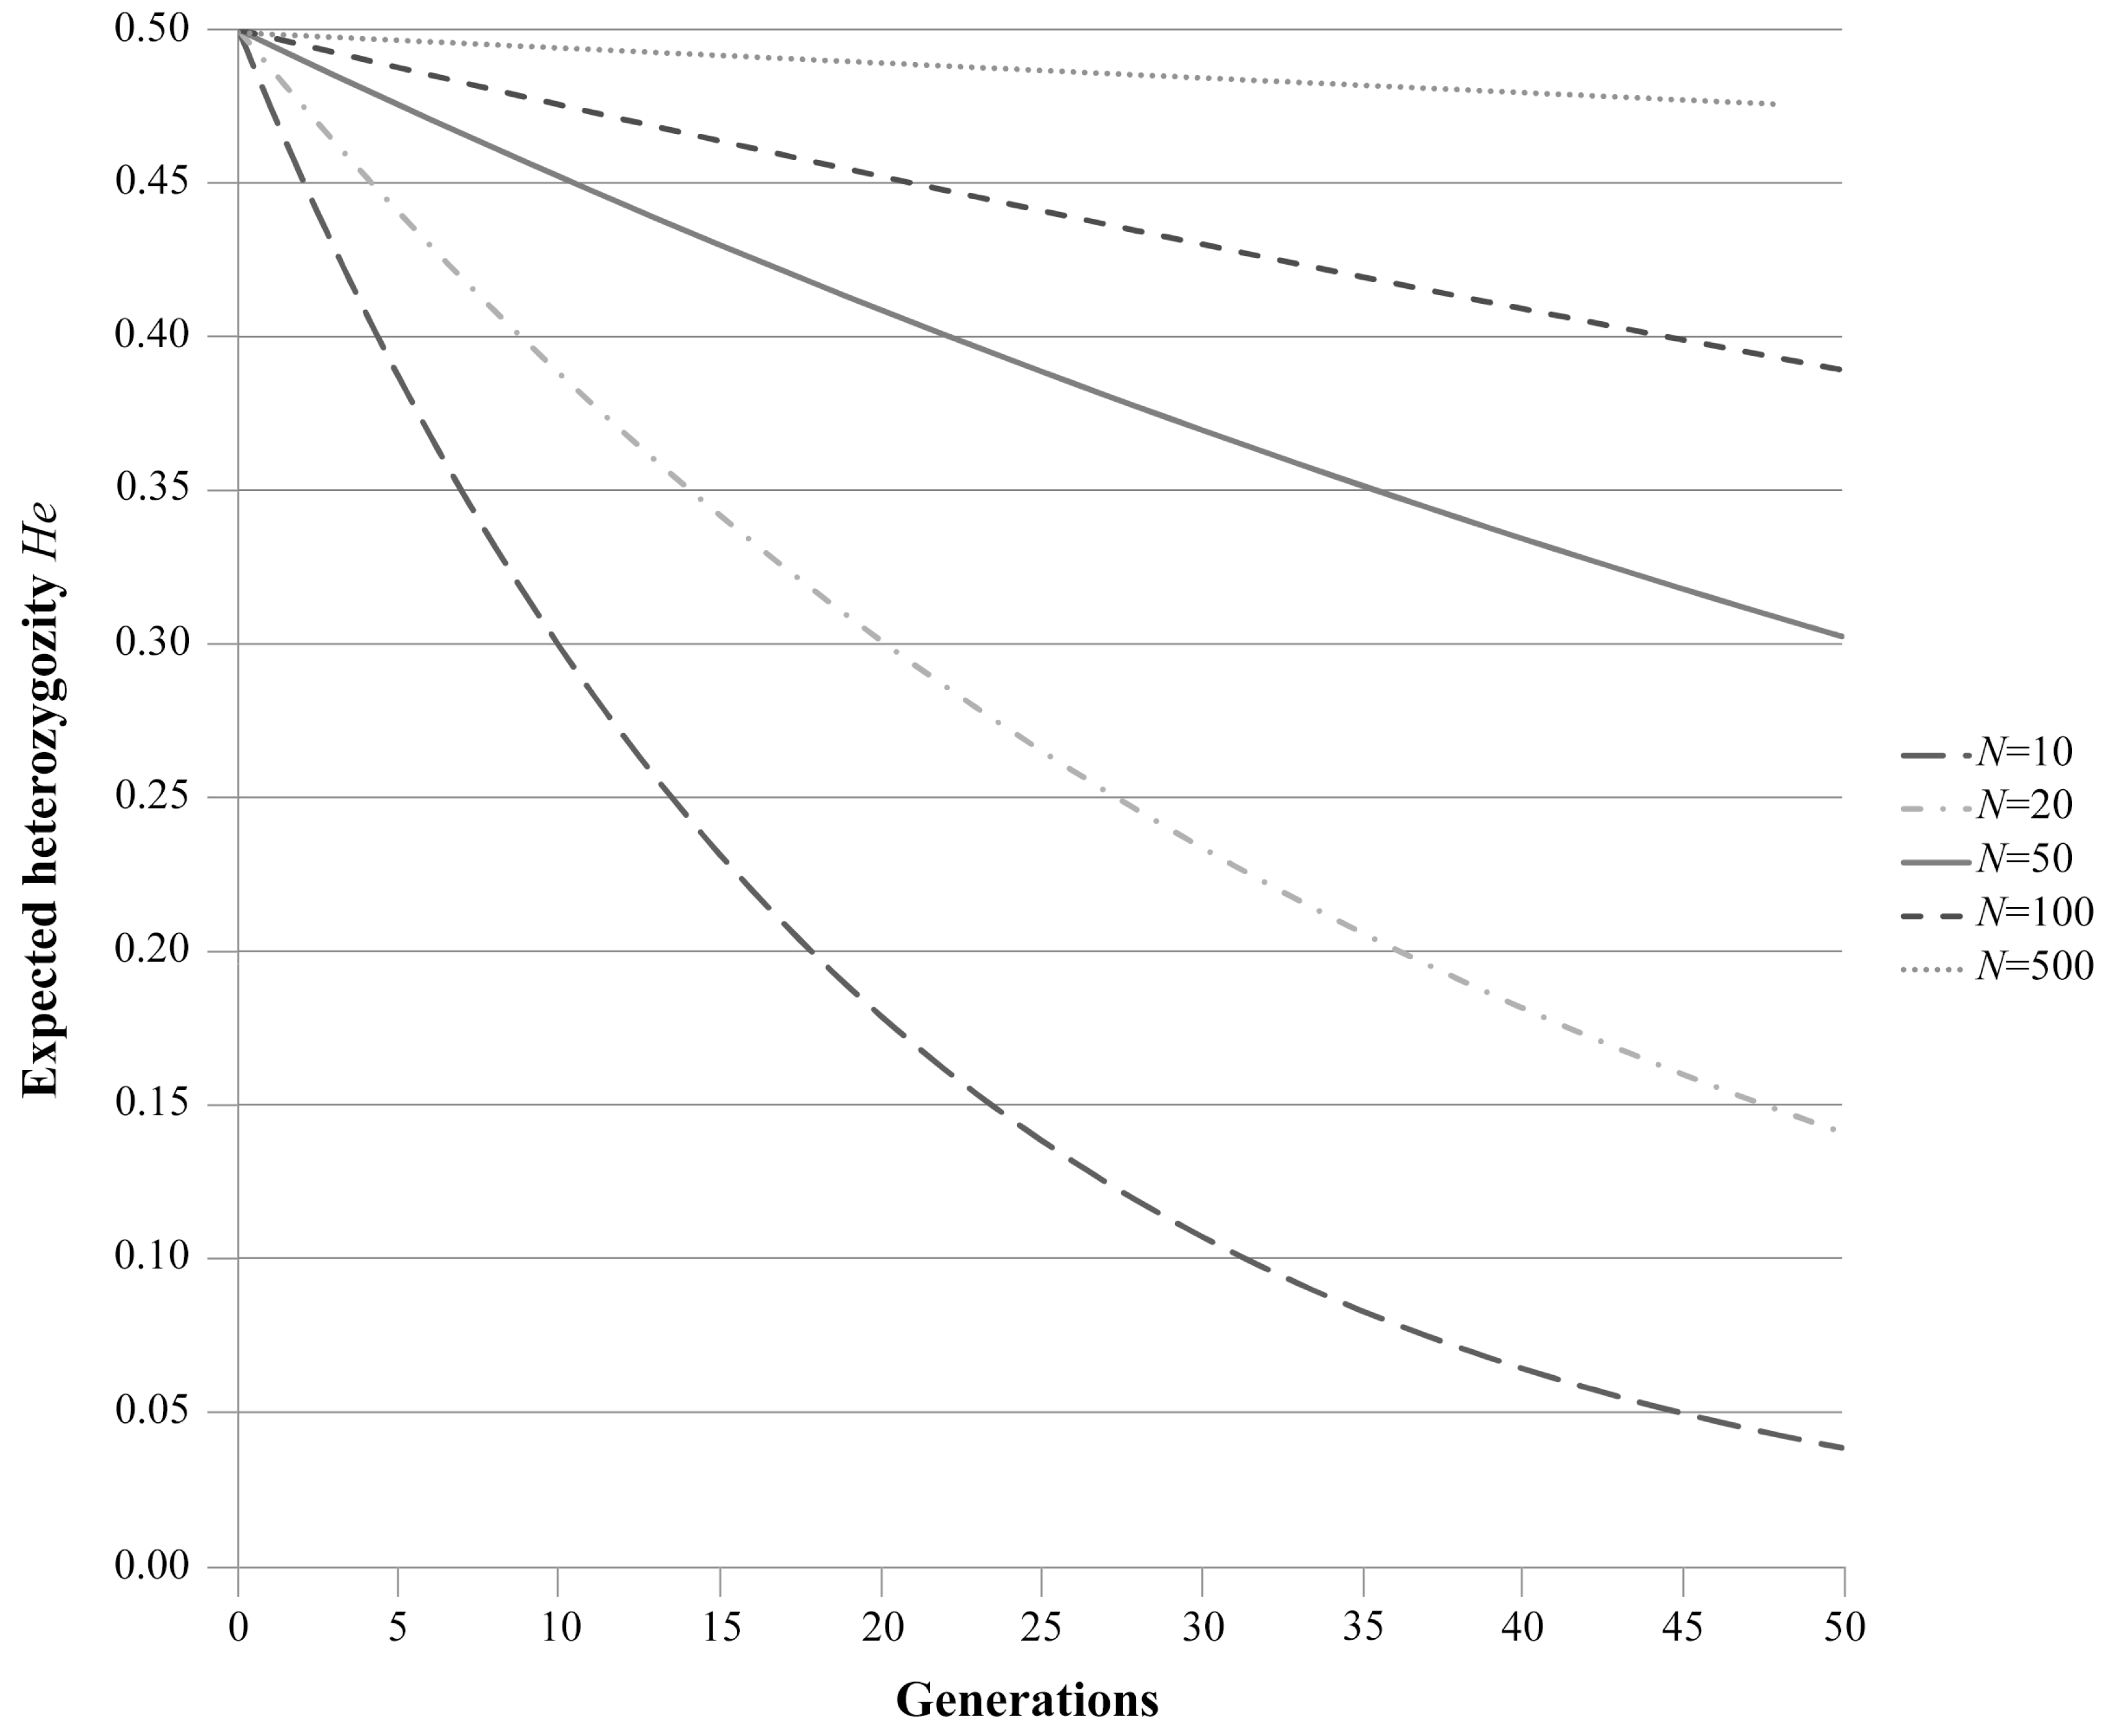
1.2. Random Genetic Drift
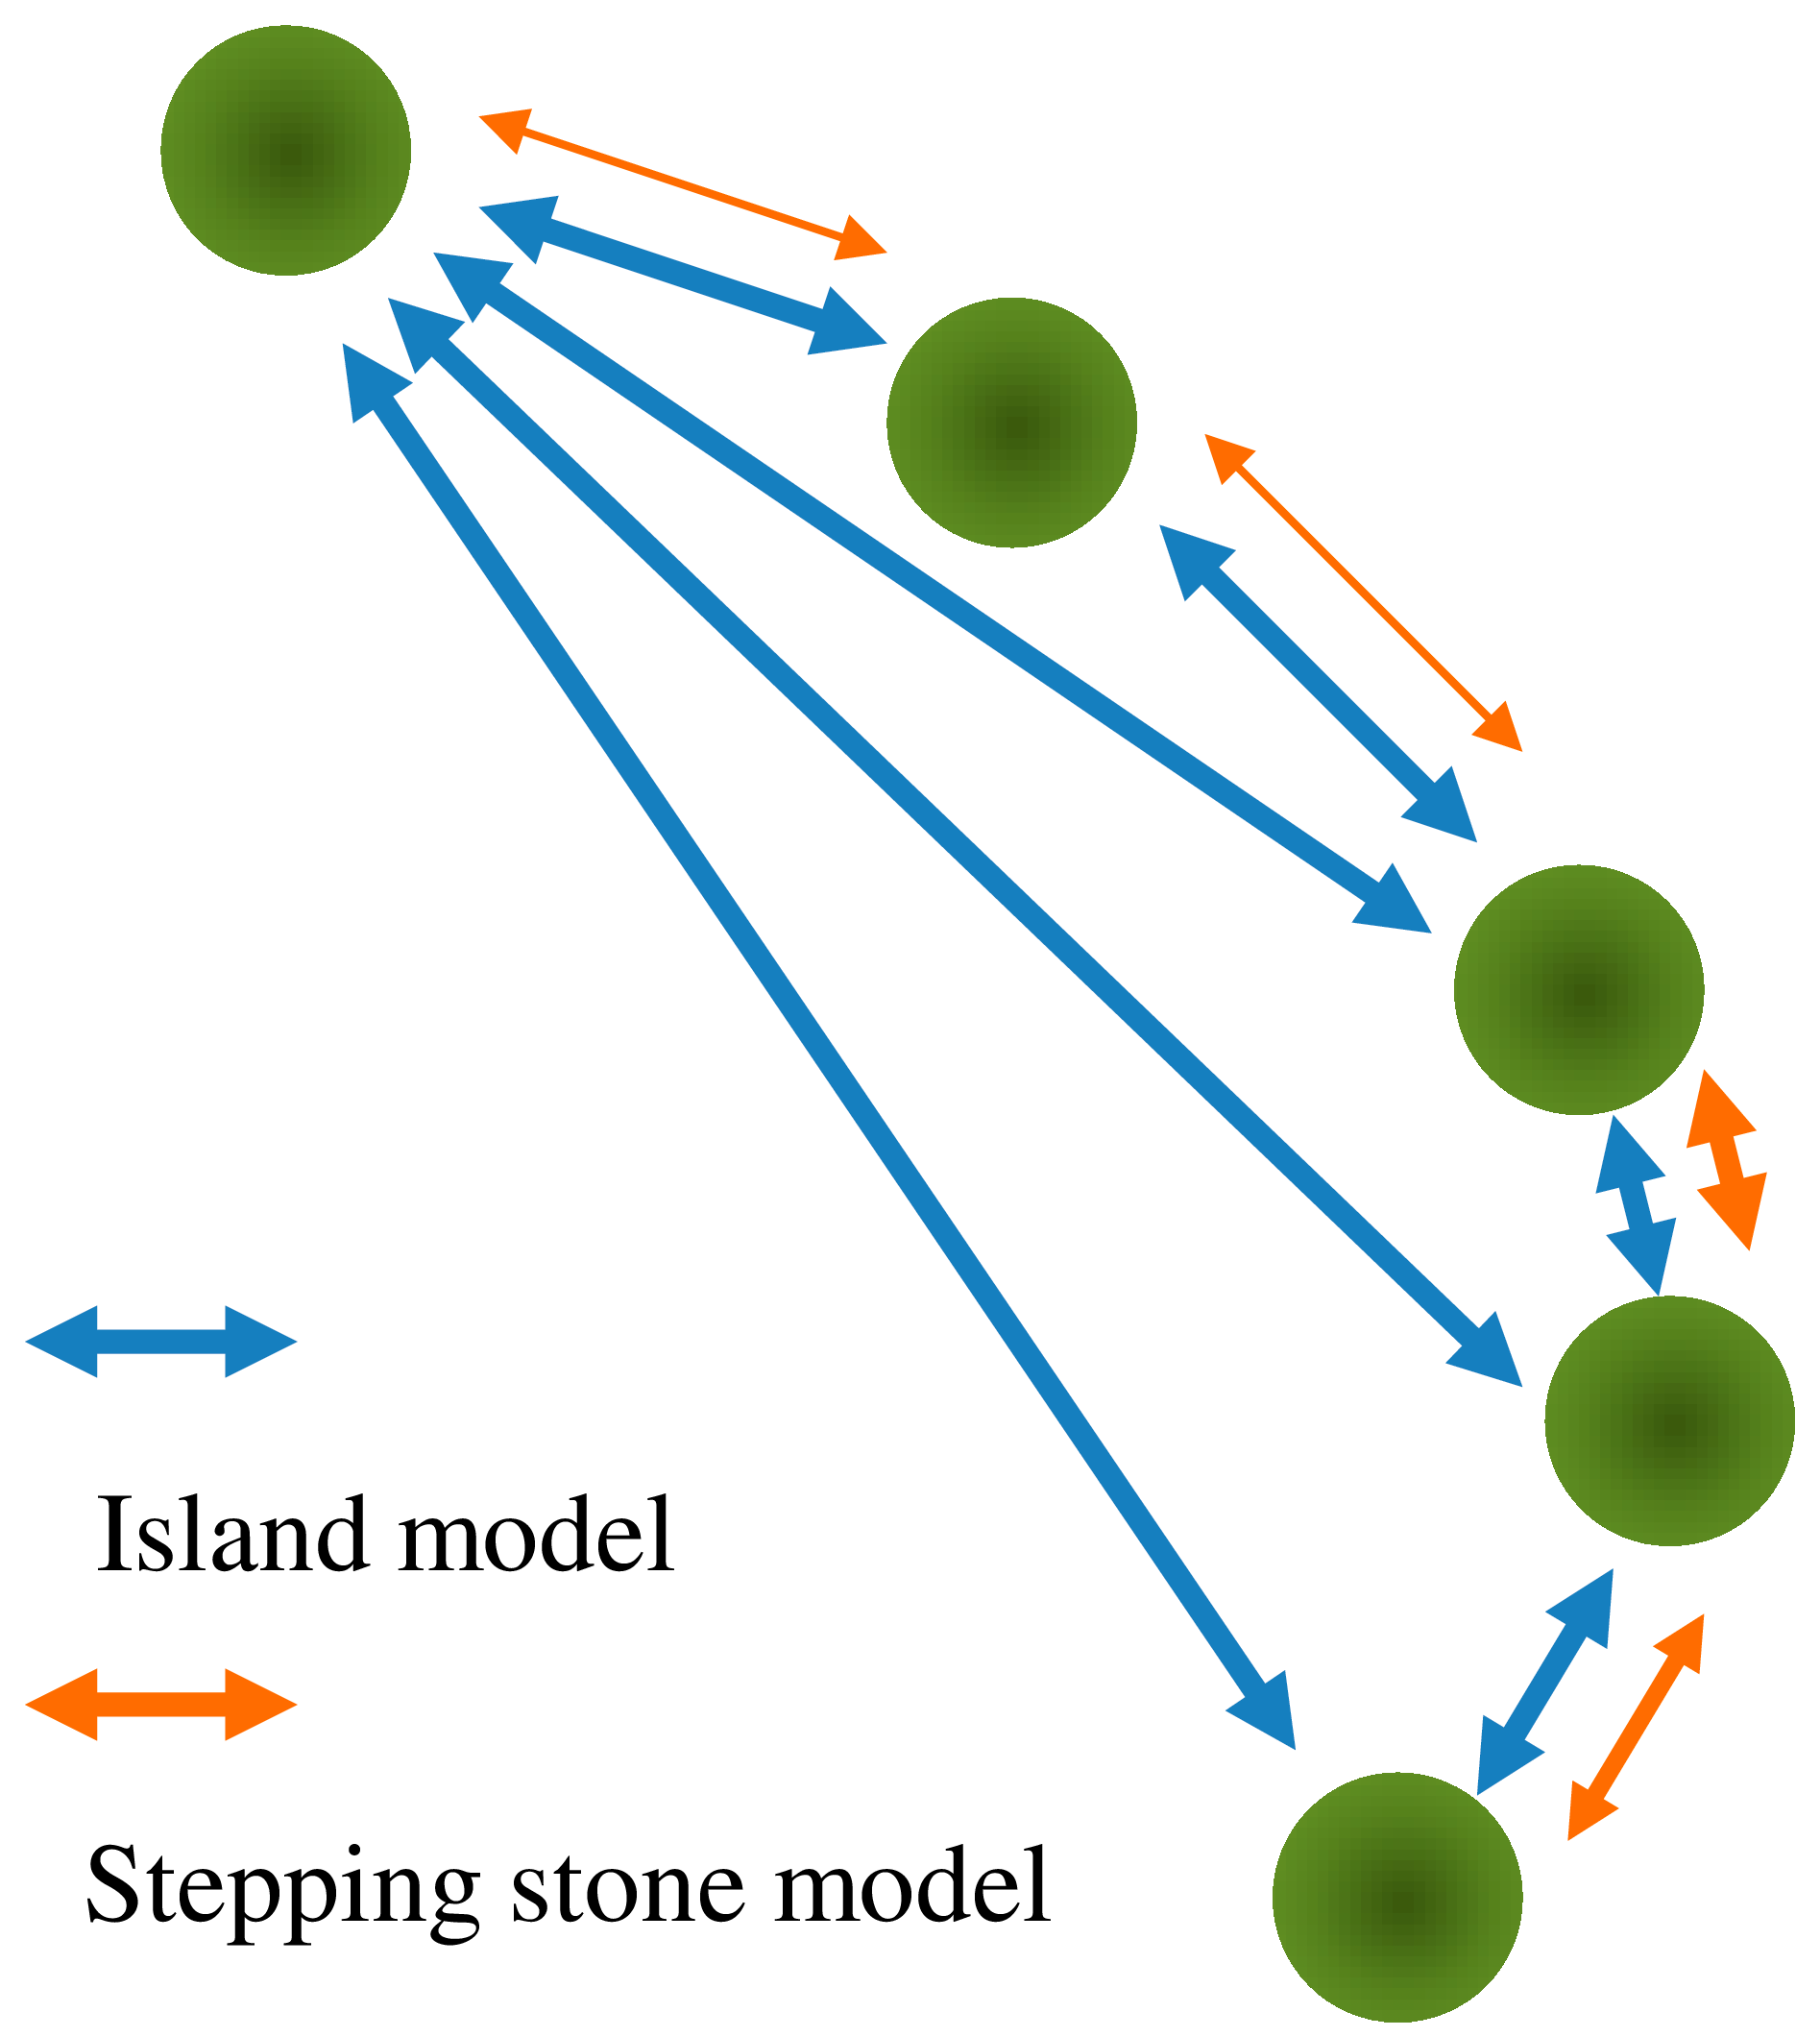
Stochastic effects change the allelic frequencies in a population, a phenomenon called random genetic drift, which basically depends on the population size N. Importantly, in the context of this review, habitat fragmentation causes a reduction in population size exerting a genetic bottleneck effect. A genetic bottleneck is defined as a sharp reduction in the size of a population due to environmental events or human activities and leads to sudden genetic drift. Random genetic drift strongly affects allelic richness by eliminating preferentially rare alleles. When R is the number of alleles at the gene locus i in an unfragmented population with allele frequencies pi, the expected allelic richness after a fragmentation event (reducing a population to size N) amounts to RF = R − ∑ (1 − pi)2N for diploid organisms [3]. The loss of population genetic diversity with genetic diversity measured as heterozygosity expected under Hardy-Weinberg-equilibrium, in contrast, is less pronounced and quantified as 1/2N per generation for genes encoded in the cell nucleus of diploids (Figure 1, [20]). However, this relationship is only valid under several assumptions, which are rarely fulfilled in natural populations. Significant differences in the fertility of individuals, non-random mating (due to selfing, dispersal limitation of pollen or asynchronous flowering of individuals), age structuring of populations, unequal sex ratios are examples, and fluctuations in population size all decrease the so-called effective number of individuals. In order to achieve realistic results, data on these parameters need to be collected and observed population sizes (the census sizes) replaced by the so-called effective population size Ne. Ne can be defined as “the number of [breeding] individuals in a theoretically ideal population having the same magnitude of random genetic drift as the actual population” [20]. The principle can be readily demonstrated for fluctuations in population size across generations with Ne calculating as the harmonic mean of the actual population sizes in the successive populations [20]. For example, Ne of a population of size N = 100 which loses 50% of its individuals in second generation out of three considered is 75 (i.e., Ne = 3/([1/100] + [1/50] + [1/100]).

1.3. Gene Flow

Exchange of alleles among plant populations mainly takes place through pollen and/or the dispersal of seeds (actually diaspores, an umbrella term for plant parts serving dispersal including all seed-carrying structures including fruits, frutescences and whole individuals) [25]. Three principle approaches can be followed to measure gene flow: (1) estimation of the dispersal ability of pollen and diaspores; (2) direct measurement of gene flow using paternity analyses; and (3) indirect inference from patterns of population genetic differentiation.
(1) Physical dispersal of propagules (i.e., pollen and diaspores) forms the very basis of gene flow. The amount of pollen and seed immigration into a population thus depends in the first instance on the dispersal abilities of propagules (in wind-dispersed species particularly on the sink rate of propagules [26,27]) and the spatial distance between the source and the target population. The relationship between dispersal of propagules and space has a mathematical representation, the dispersal curve or dispersal kernel (e.g., [26,28]). The probability of propagule dispersal calculates as a function of space, the effectiveness of adaptations to dispersal—which varies among species—and the activity of vectors (wind, animals, etc.) at experimental sites. As a general feature, most of the pollen and seeds are deposited close to the source and dispersal drops off rapidly with distance [29], although in tree species a fat-tailed dispersal curve has mostly been found in empirical studies (e.g., [30]). Integration of the dispersal curve allows calculating the probability of propagule deposition within some range (Figure 2). Knowledge of distance-dependent dispersal probabilities of propagules is useful to assess the potential of gene flow (called potential gene flow) but the amount of predicted propagule immigration cannot be equaled with the actual amount of gene flow (i.e., the realized or effective gene flow). The translation of pollen and seed flow into effective gene flow thus depends on actual rates of fertilization by immigrating pollen and subsequent germination and growth of seedlings in the target population. Fertilization and establishment in turn depend on many biological and ecological factors such as the breeding system and the phenology of individuals or adaptedness of immigrating individuals to local ecological conditions. These factors affect stochastically or selectively fertilization as well as the fitness and the competitive abilities of progenies, i.e., of seeds and later developmental stages [25].
(2) Paternity analyses have been applied to measure distance-dependent gene flow. They determine the fathers for each progeny each from a number of mothers. These methods require an extensive and complete sample of georeferenced and genotyped reproductive adults within a circumscribed area and genotyping of the progeny. The paternity of either embryos, established progeny or both may be established. Most studies hitherto focused on seeds (i.e., not yet established progeny) and hence potential gene flow (e.g., [31,32,33,34,35]), while only few case studies inferred paternity for seedlings (i.e., established progeny) (e.g., [36,37]) and hence effective gene flow (but note that further selection may take place until seedlings have reached reproductive age). Direct assessment of contemporary gene flow is of special interest because it can provide information on a population’s current dynamics and may shed light onto ecological constraints that affect gene dispersal at the time and the spatial scale of the investigation [38]. In recent years, paternity studies proliferated and underlying methods have been refined ([30,39,40]). For instance, the initial approach of Burczyk et al. [33] (the neighbourhood model) has been extended to allow the estimation of both pollen and seed dispersal, as well as individual mating patterns and thus fecundities [41]. Apart from the mere estimation of dispersal distances, these new methods allow quantifying the variation of dispersal kernels of individuals and populations, and determining the most important ecological factors contributing to this variation. Robledo-Arnuncio [42], for instance, has developed a maximum-likelihood procedure that allows the estimation of contemporary seed and pollen dispersal among plant populations, thus extending the range of paternity analysis studies to a higher spatial scale. Indeed, future development in computational possibilities and especially the inclusion of mechanistic models for dispersal may allow the estimation of contemporary pollen and seed dispersal rates over broad scales with high accuracy [38].
The major caveat of most current direct approaches comes with the difficulty of detecting propagules at low densities which almost always truncate the dispersal curve. Dispersal to higher distance classes therefore often had to be calculated by extrapolating the results obtained for the low distances (which are usually in the range of some hundred meters). Extrapolation, however, is a critical procedure since obtained estimates may be unacceptably inaccurate [25,35,43,44]. Furthermore, actual rates of dispersal critically depend on external parameters such as activity of vectors, topology, weather, or vegetation cover introducing considerable variation among estimates from experiments carried out at different time points and locations (cf. [28]). This difficulty has been exemplarily demonstrated by Austerlitz et al. [35], who observed significant differences in pollen dispersal for Sorbus torminalis in two consecutive years. The still limited numbers of studies on effective gene flow, the methodological challenge to measure long-distance gene flow, and experiment variation have unfortunately strongly restricted our current understanding of effective gene flow among spatially isolated plant populations.
(3) Indirect inference of gene flow, finally, is a traditional molecular marker-based approach already introduced in 1931 by Wright [45]. His technique calculates gene flow from the allele frequencies observed within populations based on Fst statistics. Although comparatively simple in use, the application of this technique requires fulfillment of some assumptions—premises valid under the infinite-island model for which Wright developed the approach—which may be violated under certain conditions. There must be, for instance, a balance between the counteracting effects of random genetic drift and gene flow. This prerequisite is likely violated for populations which became recently fragmented [24]. This is because genetic structure of populations established for extended time periods changes only gradually, particularly for plants with long generation times. Accordingly, equilibrium between drift and gene flow is reestablished only over long time periods [25,46]. As a consequence, the quite persistent historic population genetic structure cannot be used for calculation of recent gene flow—which likely changed compared to pre-disturbance rates—among the remaining separated parts of a formerly continuous population [47,48,49,50]. In addition, Wright’s infinite-island model is an idealization since it assumes gene flow to be independent from spatial distances among populations. For obvious reasons, in reality, dispersal of pollen and seeds and therefore gene flow is restricted by space, a phenomenon called isolation-by-distance [17]. As an ultimate outcome, under strong fragmentation populations may become completely isolated from each other (no gene flow) and, as a possible consequence, genetic diversity will be lost in small populations.
In order to overcome these limitations, models treating space explicitly have been developed: the spatial genetic structure (SGS, i.e., the spatial distribution of alleles) on a fine scale within populations can be used to determine gene dispersal provided that the effective population density is known [51] and that an appropriate sampling scheme is applied [52]. Although this approach also assumes populations to be in equilibrium, it has been shown in numerous simulations and empirical studies to provide reliable estimates of gene dispersal. Another method with fewer model assumptions has been developed by Wilson and Rannala [53], specifically to measure recent migration rates among populations. However, recent simulation studies show that this method in general is probably over-estimating rates of gene flow [54]. Accurate estimation of real-time gene flow, however, is a necessity to predict the future population genetic diversity and the associated patterns of differentiation in fragmented populations and to design conservation strategies.

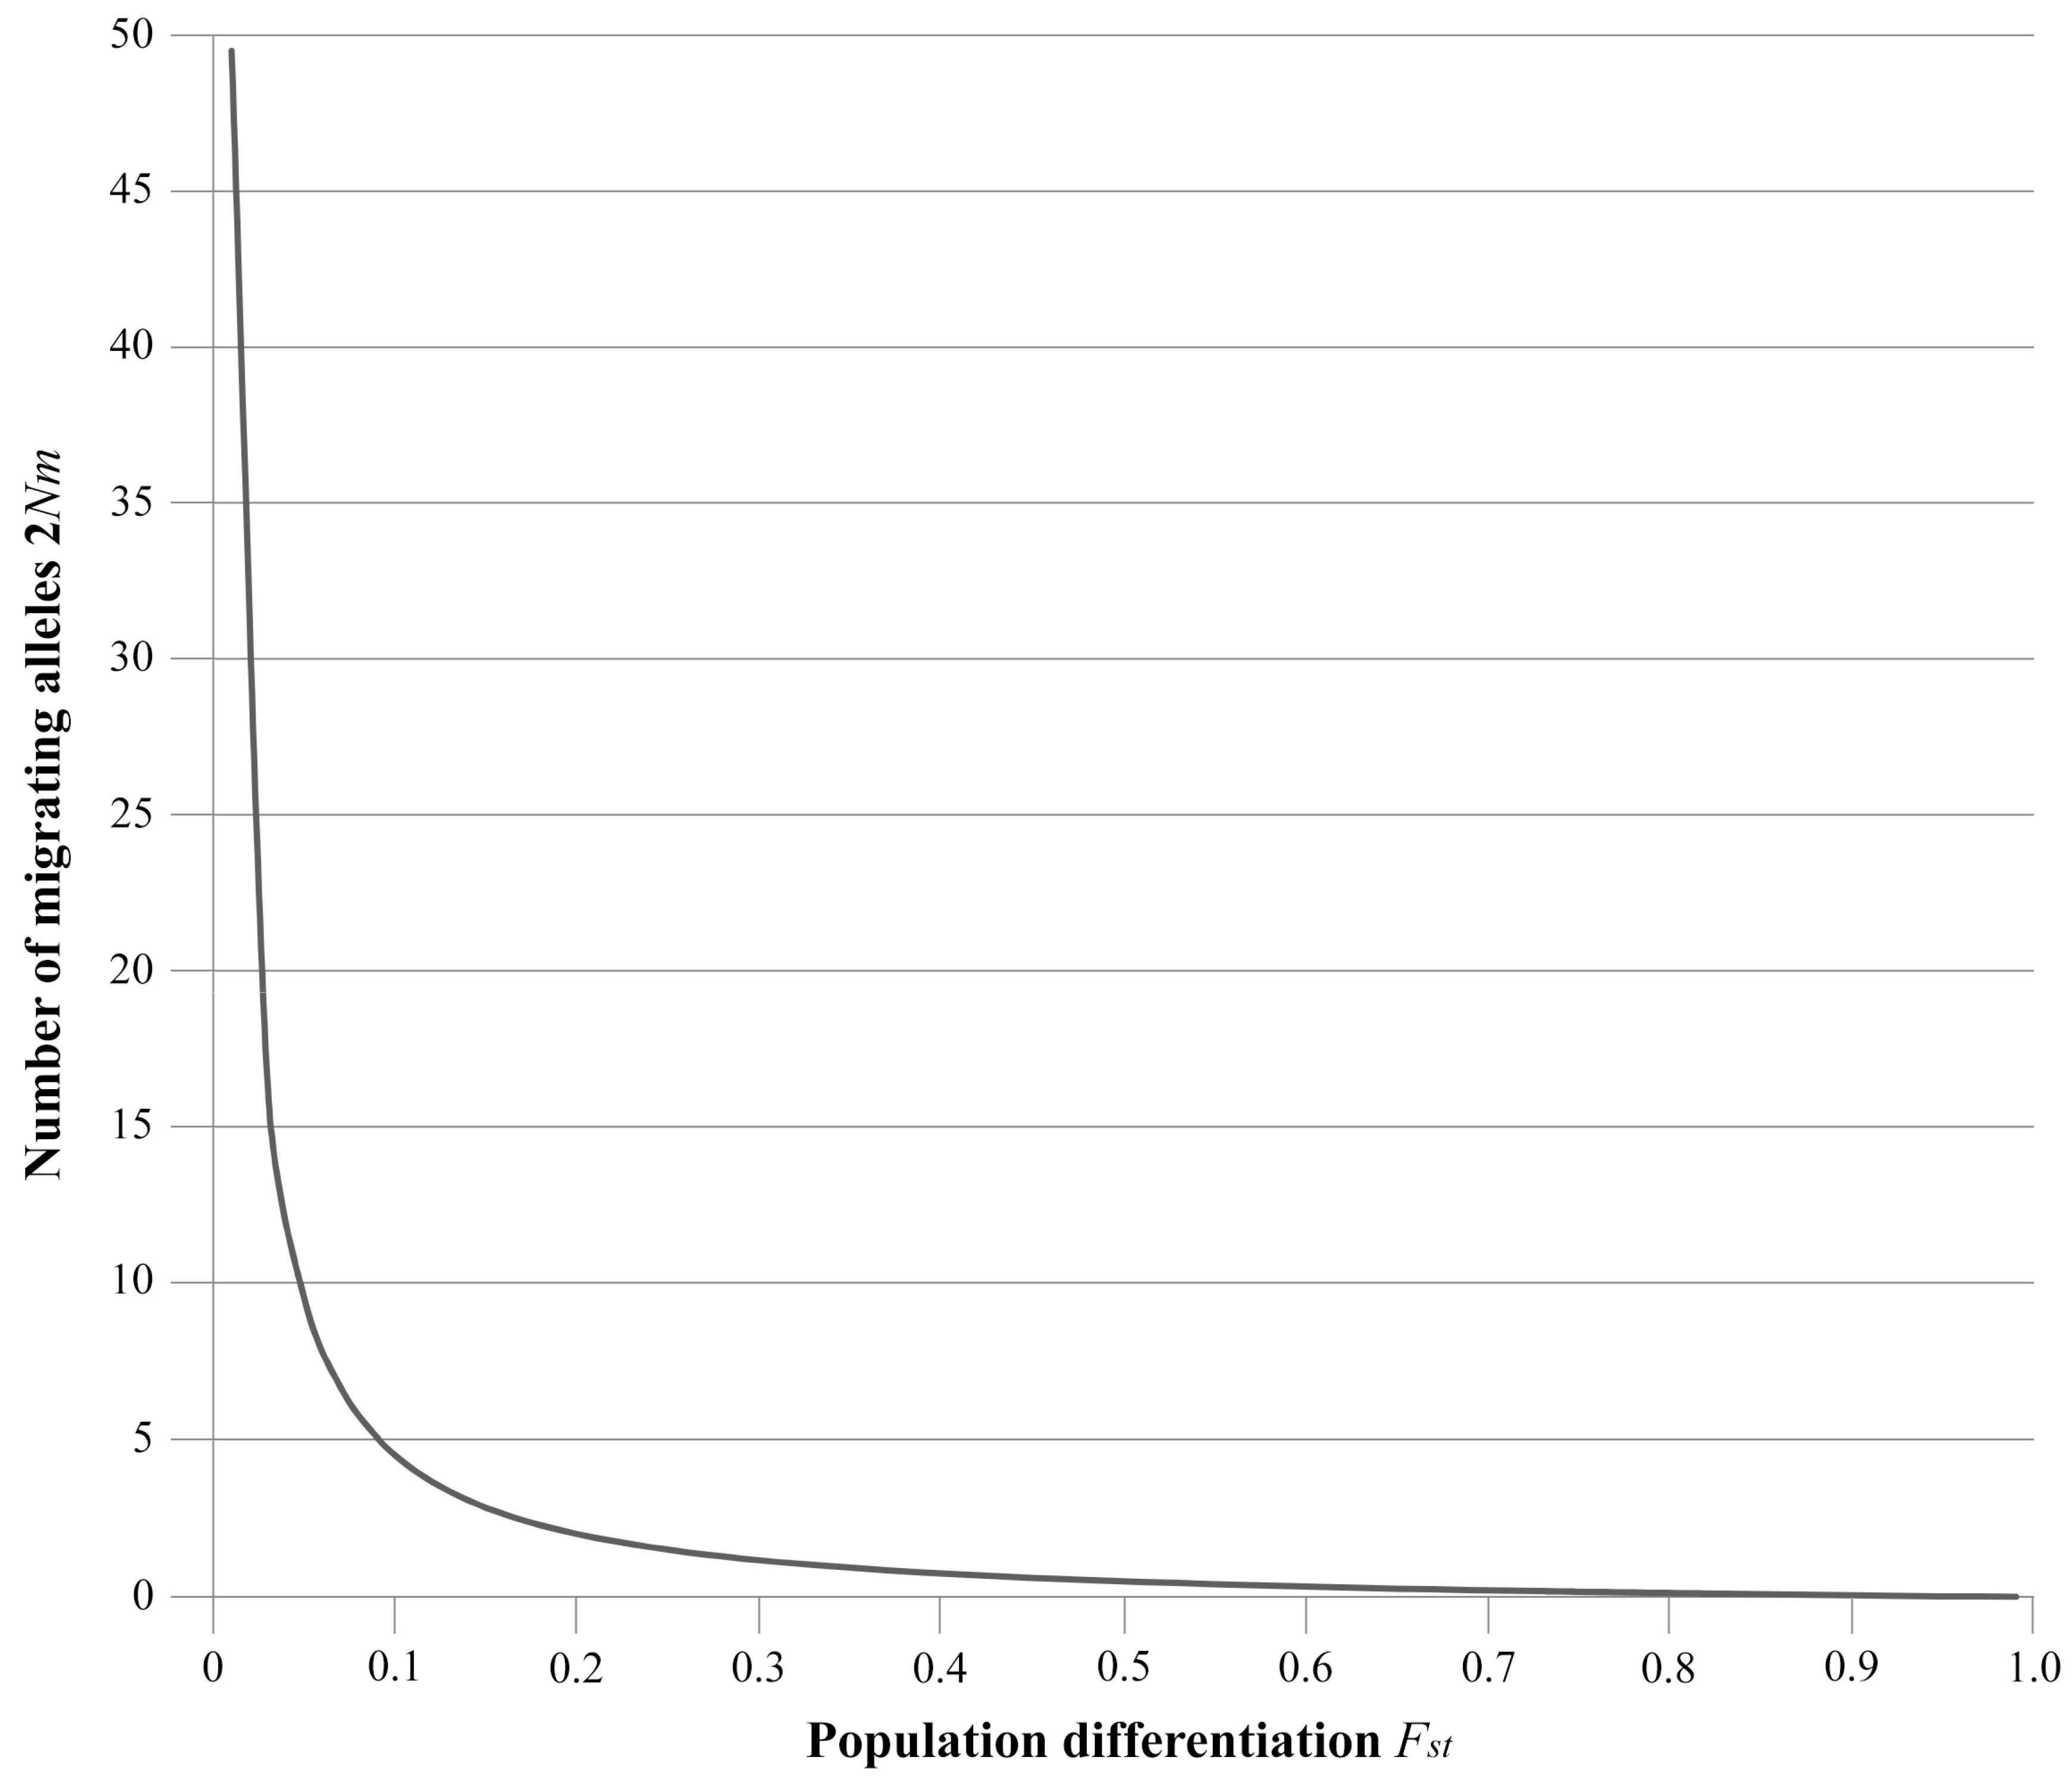
1.4. Desirable Levels of Gene Flow

In defining maintenance of pre-disturbance patterns of population genetic structure and levels of population genetic diversity as the conservation aim, we can resort to standard theory which provides us with an interesting relationship between gene flow and population genetic differentiation. The relation says that any particular level of population genetic differentiation corresponds to a particular rate of gene flow, described (for diploid organisms) by the formula Nm = 0.25[(1/Fst) − 1] with m being the migration rate and Nm the number of migrants exchanged per generation (Figure 3, [45]). In the case that observed and calculated rates of allele exchange are identical, the underlying population genetic differentiation will be maintained, as will population genetic diversity. The calculated number of migrating alleles could accordingly be used as a threshold for minimal gene flow required—to be determined experimentally—for maintenance of the pre-disturbance condition.
Wright [45] furthermore argues on theoretical grounds that immigration of one allele per generation (Nm = 0.5) guarantees, on the one hand, that populations are sufficiently differentiated from each other to allow for adaptation to local environmental conditions and minimizes, on the other hand, the probability of loss or fixation of alleles through random genetic drift. A Nm of 0.5 is a threshold (valid under Wright‘s infinite-island model) below which alleles have the highest probability to be eliminated or to become fixed, whereas under migration rates exceeding this value, the allele frequency of a population tends to approach the mean of the entire species [55]. Wright derived these relationships from a simple model of population structure based upon a host of unrealistic assumptions such as the census number of individuals equaling the effective population size, a migrant being equally likely to come from any subpopulation, or subpopulations reaching equilibrium with respect to gene flow and random genetic drift. Real populations usually show hierarchical genetic structure and often asymmetric gene flow between subpopulations, thereby violating these assumptions. Mills and Allendorf [56] identified several conditions under which higher migration rates are desirable in real situations including, among others, close genetic relatedness of local populations, sensitivity of the local subpopulation to inbreeding, and that demographic or environmental variation indicates a high danger of extinction. The authors recommend in conclusion a minimum of one and a maximum of ten migrants per generation, a suggestion approved by Wang [21] in his more quantitative assessment of optimal levels of connectivity of populations.

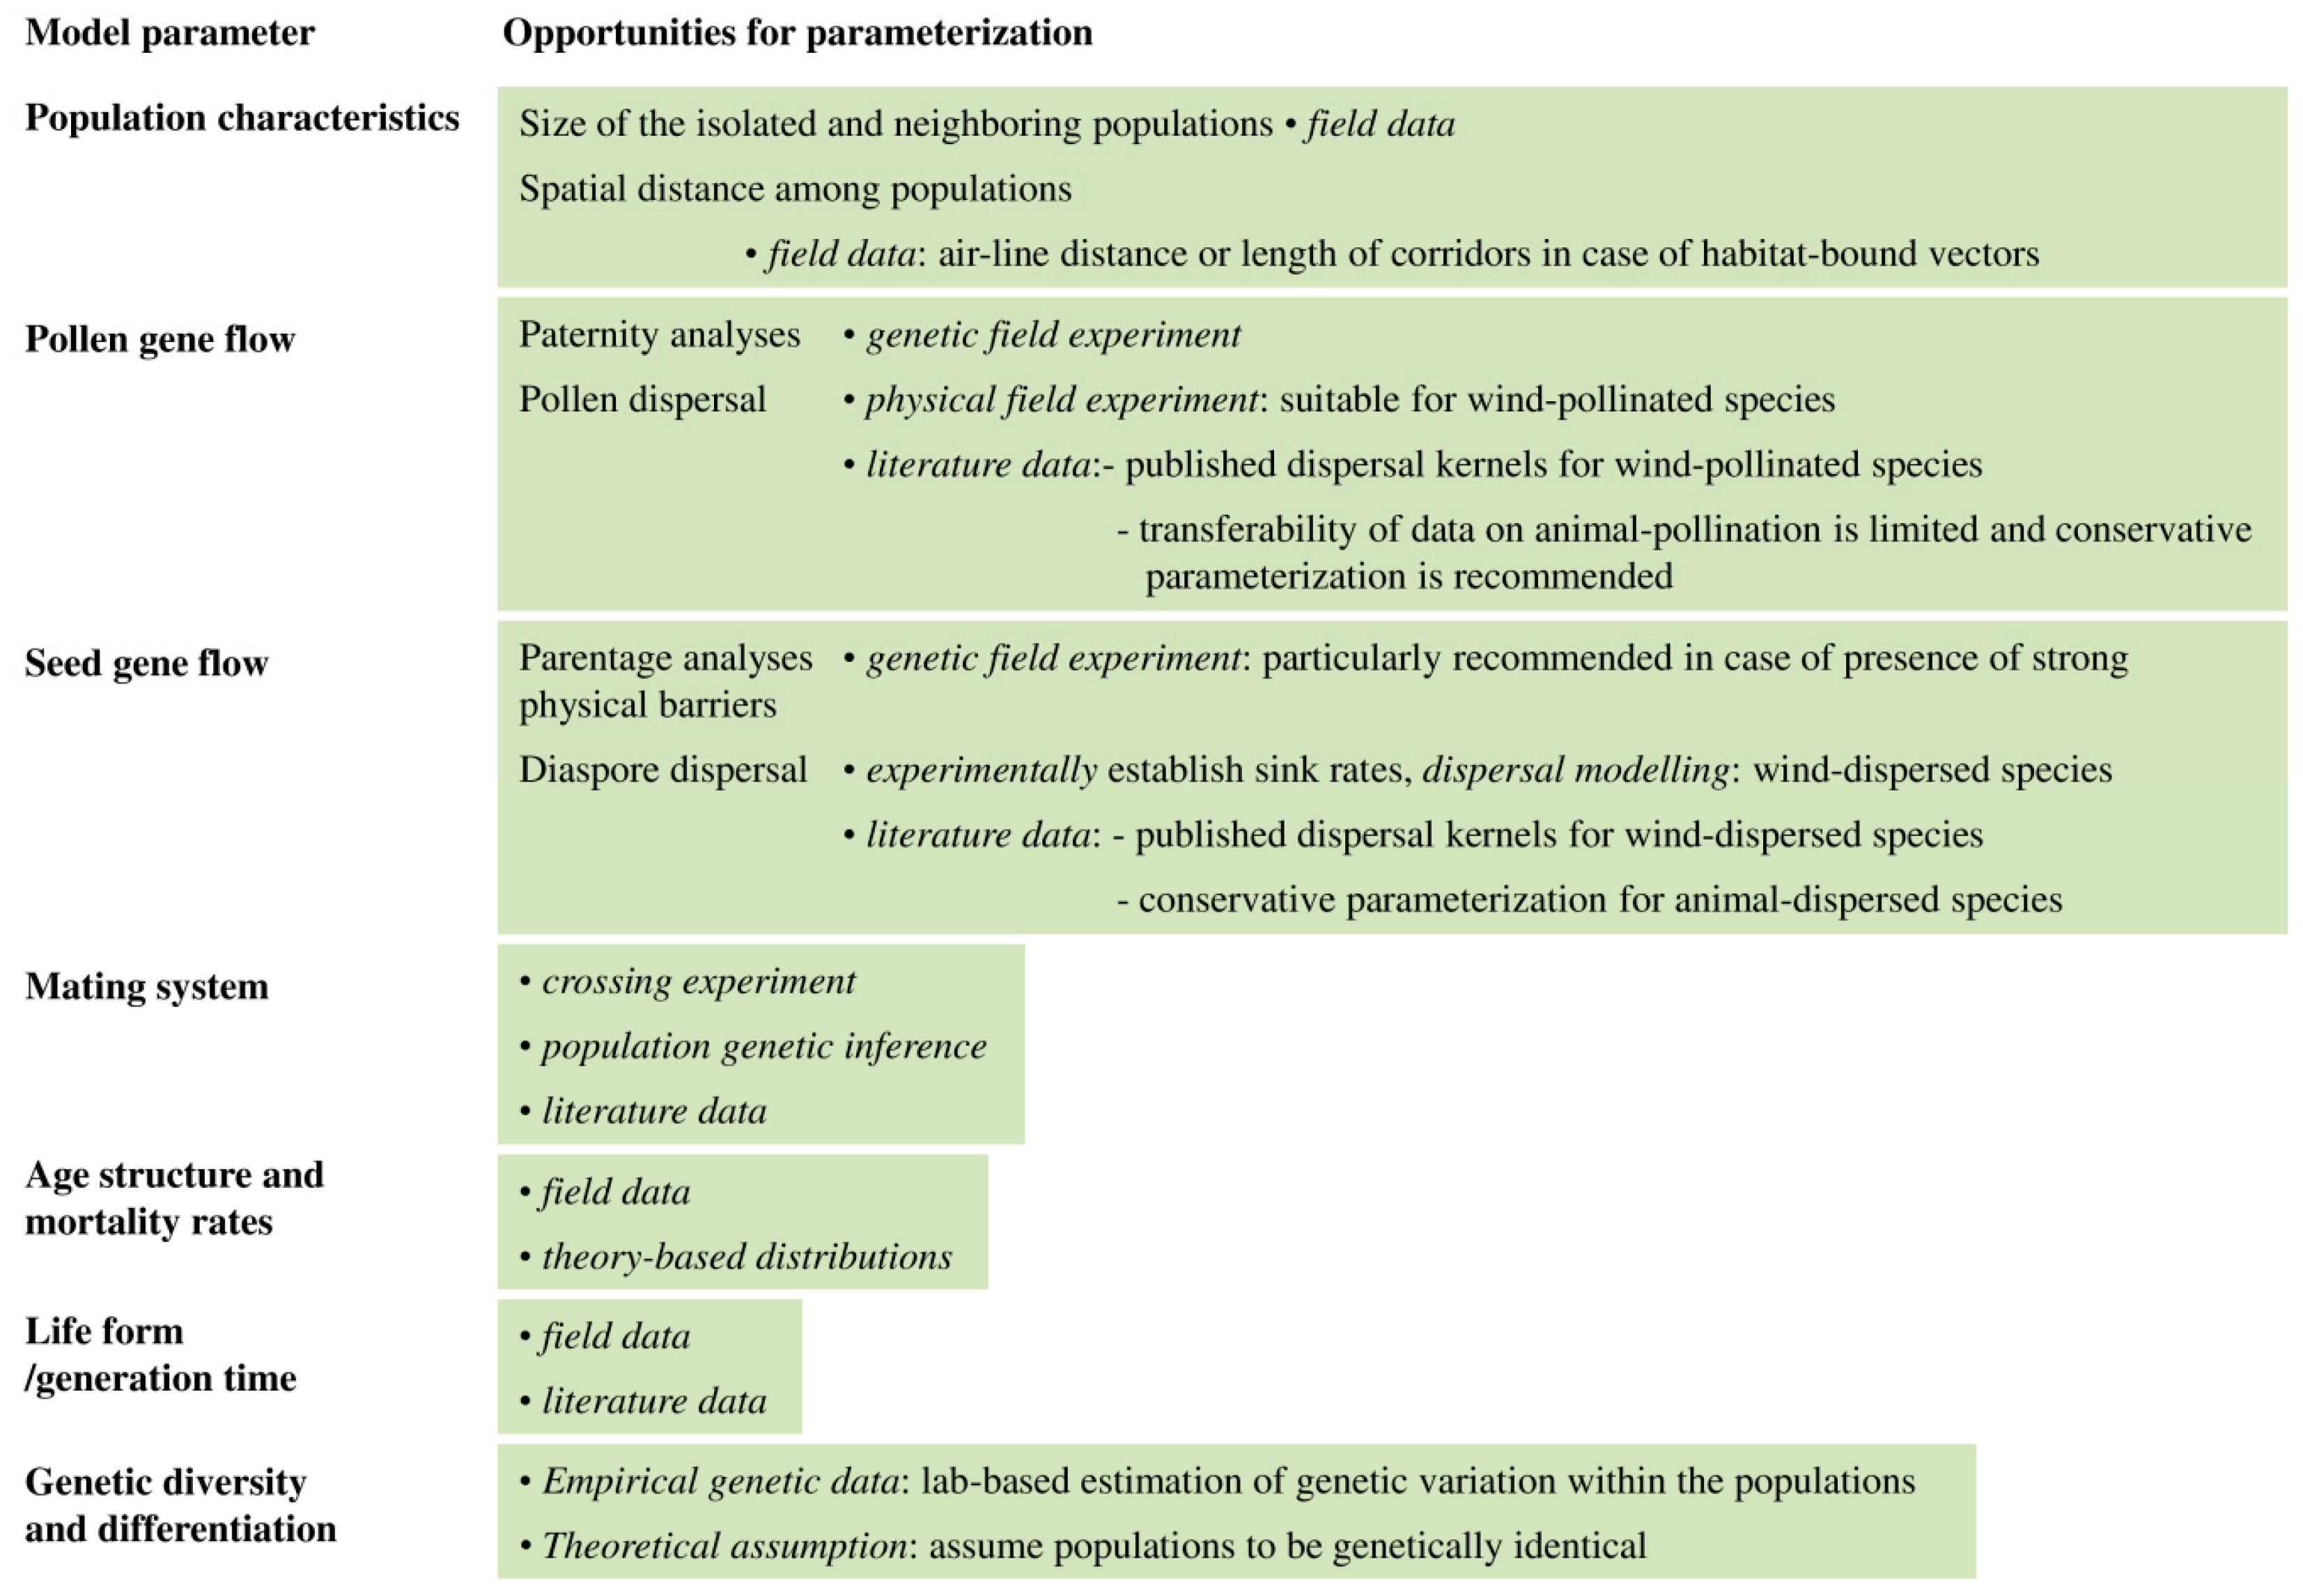
1.5. Alternative Approaches: Estimating Inbreeding and Allee Effects

As an alternative to population genetic-based inference of consequences resulting from habitat fragmentation, we can test for associations between the size and the fitness of populations. By this approach we aim to identify potential negative effects on fitness due to inbreeding depression in small populations. Inbreeding depression results from increased homozygosity [57,58] and arises from homozygosity for recessive deleterious alleles and/or overdominance (the phenomenon that heterozygous genotypes have greater fitness than homozygotes) [59]. Habitat fragmentation can increase homozygosity in two ways: through the eroding effects of genetic drift, and through elevated rates of selfing (i.e., self-fertilization), the latter particularly affecting outcrossing species [60]. Selfing can thus occur as a consequence of pollen limitation (insufficient density of foreign pollen [61,62,63]) and may limit fitness of individuals [62,64,65]. Several studies found indeed a negative relation between population size and selfing in association with reduced seed set (reviewed by Robledo-Arnuncio et al. [66]).
Lande [67] argues that, for wild populations, demography is likely to be of more immediate importance than genetics in determining population viability, a phenomenon referred to as Allee effect. Populations declining in numbers may experience diminishing viability and reproduction, and there may be a threshold density or minimum number of individuals from below which the population cannot recover. This is because stochastic demography (i.e., changes in the number of individuals) produces sampling variances of the vital rates inversely proportional to population size. Lande suggests a population size of 100 individuals as a threshold below which Allee effects become the most likely factor for population extinction.

2. Population Genetic Characteristics of Central European Forest Tree Species

Several biological and ecological characteristics are central to the genetics of plant populations, including the duration of the life cycle (in a population genetics context, referred to as generation time and used as its basic time unit) [24], the mode of diaspore and pollen dispersal [22], and the mating system (whether plants are outcrossing and/or selfing) [8]. Trees distinguish themselves from plants of other life forms in some of these life history traits. In general, trees have long generation times which implies that random genetic drift acts slowly and that population genetic equilibriums (e.g., the balance between the effects of random genetic drift and gene flow) will only establish over long time periods [46]. Central European tree species share as another common feature outcrossing as the mating system. They developed different modes of breeding (i.e., breeding systems) that enforce (like pre- and postzygotic self-incompatibility mechanisms and diocecy) or promote outcrossing through spatial separation of sexes (i.e., monoecy). The modes of diaspore and pollen dispersal and breeding system vary in trees allowing to test for association of this variability with genetic characteristics of tree populations (e.g., wind pollination characterizes the Betulaceae, Fagaceae and Pinaceae; insect pollination the Rosaceae and Salicaceae; the Betulaceae, Fagaceae and Pinaceae are monoecious; the Salicaceae and Taxaceae are dioecious, and the Rosaceae are hermaphroditic, having developed genetic pre-self-incompatibility mechanisms; Supplementary Materials 1).
Provided that rates of mutation and selection are negligible, genetic differentiation is the outcome of restrictions in gene flow reinforced by random genetic drift. Data available on gene flow and population differentiation allow drawing conclusions on which characteristics of populations influence the population genetic structure of trees most. In the following subchapters, we summarize evidence on the potential influence of life history traits and extrinsic characteristics of populations on gene flow and population genetic differentiation in woody plant species available from earlier reviews [9,10,43,50,68,69] and the results from our own survey (see Supplementary Materials 2 for methodological details). As a general finding, tree populations exhibit by trend lower levels of genetic differentiation and higher genetic diversity than all other plant life forms (annuals, hemicryptophytes etc.). Hamrick et al. [9] summarized results from 195 studies on long-lived woody species and calculated a mean population genetic differentiations of 8.4% ± 0.8% SD (annuals 35.5% ± 2.1%, long-lived hemicryptophytes 27.8% ± 3.3%). In the Müller-Starck et al. [69] survey of European tree species, population genetic differentiation rarely exceeded 15%. We observed for biparentally inherited markers a median of 4.4% (with the actual values ranging between 0.2% and 33%).

2.1. The Relative Importance of Seeds and Pollen for Gene Flow

In Central European tree species, gene flow takes place mainly through pollen. Ennos [70] introduced an indirect technique which allows quantifying and comparing gene flow through seeds and pollen based on estimates of population genetic differentiation for nuclear and cytoplasmatic markers. The technique is based on the observation that nuclear markers are transferred by both seeds and pollen while chloroplast and mitochondria markers are either transferred by seeds (the mitochondria of both angiosperms and most gymnosperms, and the chloroplast of angiosperms) or pollen (the chloroplast of gymnosperms). The ratio of pollen- to seed-mediated gene flow was 24–44:1 for Pinus species and 196:1 for Quercus petraea. The higher efficiency of pollen in mediating gene flow is furthermore seen from markedly higher population genetic differentiation for maternally inherited markers compared to biparentally transferred ones [68]. This contrast is also clearly seen in our survey data with population differentiation for maternally inherited markers being strongly elevated compared to biparentally and paternally inherited marker based estimates of differentiation (Table 1). The dominance of gene flow through pollen over that via seeds allows to use the former as an approximation for total gene flow, although there are exceptions to this pattern as observed for Sorbus torminalis [71], in which pollen did not dominate gene flow, or for an isolated population of Fraxinus excelsior, in which seed-mediated gene flow exceeded the pollen-mediated component [72].

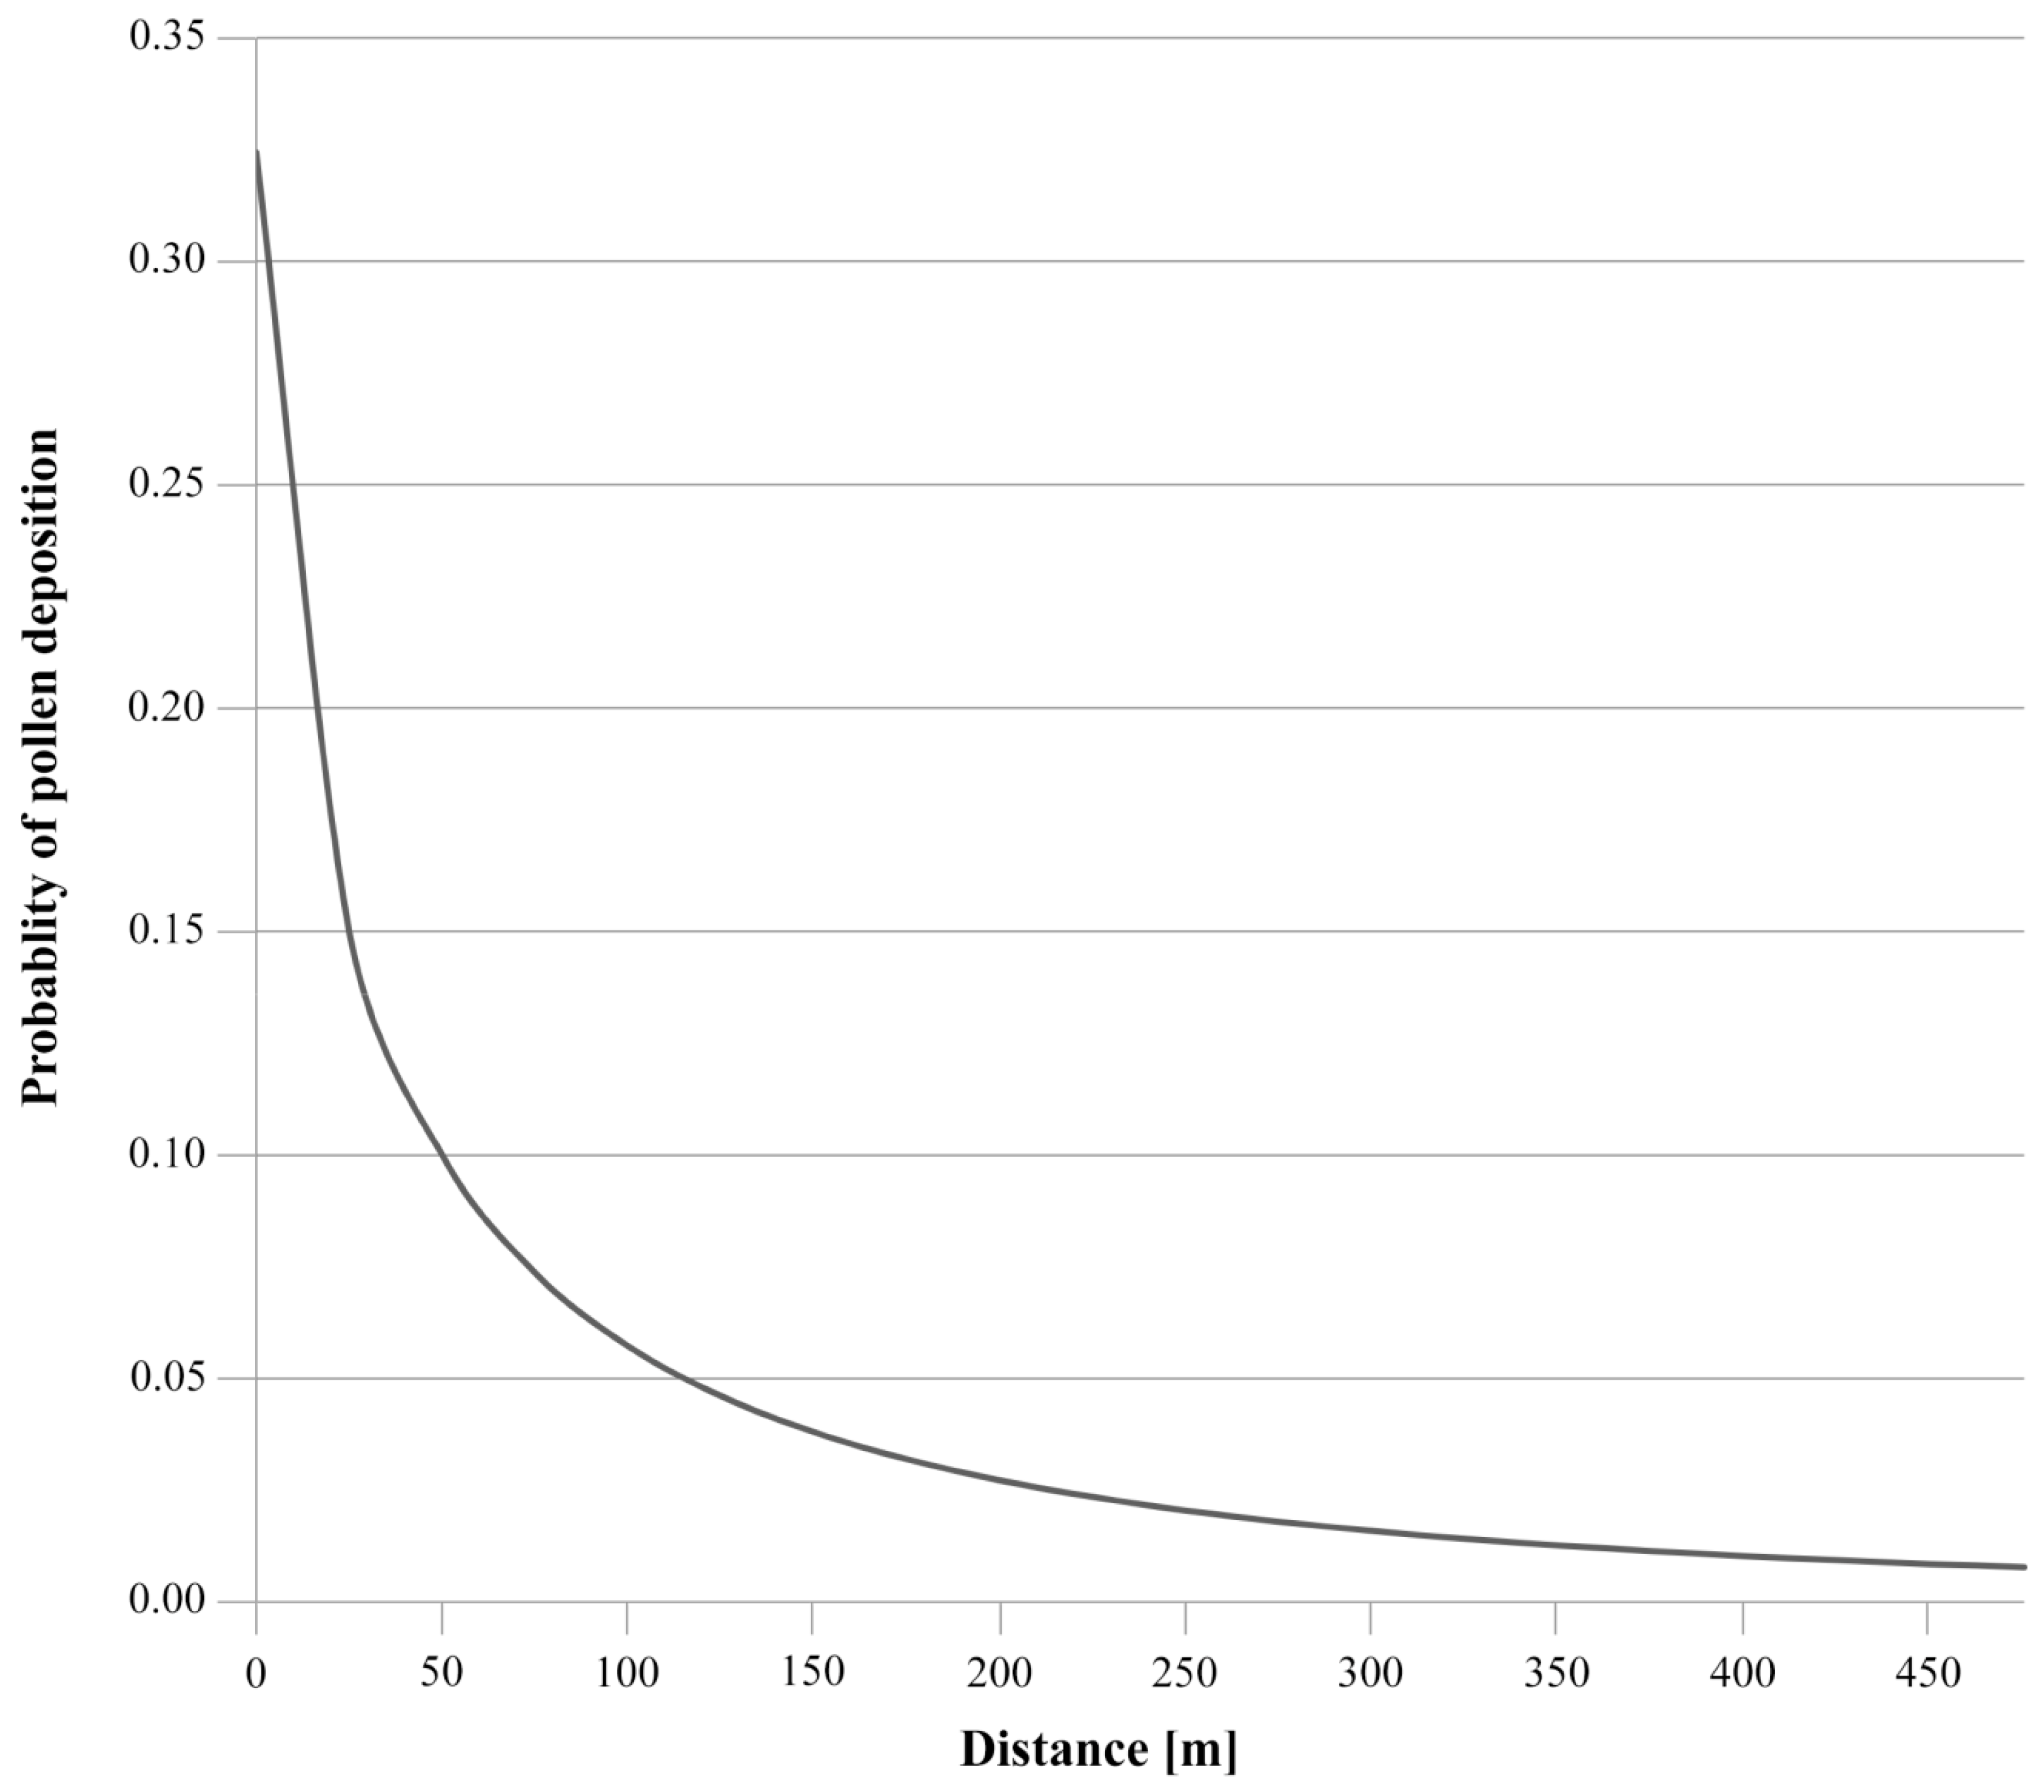
2.2. Modes of Seed and Pollen Dispersal and Its Significance for Gene Flow

Modes of dispersal appear to influence gene flow in trees (and woody plant species) as seen from patterns of population genetic differentiation. Statistically significant effects were thus inferred for the mode of diaspore dispersal (population genetic differentiation of autochors [gravity-dispersed] > anemochors [wind-dispersed] > zoochors [animal-dispersed]) and a trend emerges for the mode of pollen dispersal (animal-pollinated > wind-pollinated species). Müller-Starck et al. [69] reported mean values of 9.2%/13.1%, 7.6%, and 5.1%/6.5% for various subtypes of autochory, anemochory, and zoochory, respectively. In contrast, differences for modes of pollination are only tentative: ≤10% according to Slavov et al. [73] and Müller-Starck et al. [69], and 8% on average according to Hamrick et al. [9] for wind-pollinated species, but 10% on average in animal-pollinated species [9]. The results from our analyses of biparentally inherited markers (isozymes and microsatellites) are basically in accordance with these findings. The mode of pollen dispersal was a significant predictor of the level of population differentiation (Table S3). Wind-pollinated tree species exhibited, on average, lower population differentiation compared to insect-pollinated species, although the difference was marginally significant (Table 2). In contrast to the findings of Müller-Starck et al. [69], anemochorous trees showed a level of population differentiation similar to that of zoochorous species. This result held true for both biparentally and maternally inherited markers, respectively (Table 3).
Estimates of gene flow via pollen using direct techniques are available for only some Central European tree species. Studies which measured gene flow for wind-pollinated species as well as insect-pollinated species provide evidence for a high extent of gene flow (Table 4). Gene flow over long distances was reported for Fraxinus excelsior (ca. 1% of the total pollen deposit was recorded in a distance of 2.9 km from the pollen source [74]), Pinus sylvestris (48% pollen deposit in >2 km distance [75]; and 4.3% pollen deposit in >30 km distance [76]), Picea abies (16% in >4 km distance [77]) and Sorbus domestica (1.8% in 12–16 km distance [62,63]). The values provided for Sorbus torminalis (1.34% or 2.85% for distances >1 km [35]) have to be considered with caution since they have been obtained by extrapolation.

2.3. Mating and Inbreeding

Populations of European trees exhibit high levels of heterozygosity [9,69]. This characteristics can be explained by predominant outcrossing, long generation times, relatively intensive gene flow [22] and high mutation rates [88]. Because the mating system is rather uniform in Central European tree species (Supplementary Materials 1) we do not expect a strong effect of this plant character on patterns of population genetic differentiation in trees. Rather, it is reasonable to expect for trees a homogenizing effect through the mating system on population differentiation since outcrossing plant species exhibit higher gene flow by trend compared to selfers (and species with mixed mating systems) [17]. In comparison to other life forms, trees carry a high number of recessive deleterious alleles which contribute to the genetic load and can be quantified as lethal equivalents. These alleles exert their strongest effects in the homozygous state, while they are ineffective or only partly effective in the heterozygous state [89]. Lethal equivalents lead to inbreeding depression, which potentially affect all ontogenetic phases from the development of the embryo, through germination, vegetative growth to reproduction [90]. In Central European tree species, inbreeding has been observed due to selfing triggered by pollen limitation and as a consequence of experimental crossings of closely related individuals. In the conifers (gymnosperms), for instance, selfing is reduced by inbreeding depression which affects embryo development through a postzygotic self-incompatibility mechanism [91]. In a spatially isolated Pinus sylvestris population of only few individuals, selfing was eight-fold (25%) the value observed in individual-rich populations in the centre of the range [66]. Selfing reduces seed set and, therefore, fertility of trees. In Sorbus domestica, which possesses a gametophytic self-incompatibility system, spatially isolated individuals showed rates of selfing up to 70% [62]. Selfing was significantly negatively correlated with numbers of potential neighboring mating partners. Seeds derived from selfing were less vital than those originating from outcrossing and displayed lethal symptoms of inbreeding depression (e.g., albinism). Postembryonal symptoms of inbreeding were furthermore observed in crossing experiments with Picea abies, P. omorika and Pinus sylvestris (reduced seed set, increased mortality, and reduced growth [90]). It should be further noted that selfing reduces effective population size (e.g., [92]).

2.4. Population Fragmentation in Forest Understorey Plant Species

In conspicuous contrast to trees, there are very few studies on gene flow in forest understorey plants (but see Yuriev and Shao et al. [93,94]). We can only speculate about the reasons for the hitherto restricted interest, but low economic value of the understorey species and focus on ecosystems considered of higher conservational importance (e.g., extensively managed meadows [95,96,97,98]) are potential explanations. The understorey species, however, are of high importance for biodiversity and ecology of Central European forests since they constitute about 25%–30% of this region’s flora [99]. Furthermore, several taxa are protected by law and have become rare in some regions (orchids, hellebores, lycopods, or lilies). These circumstances confer importance to population fragmentation in forest understorey plants. The species cover a wide taxonomic diversity since they represent almost all families known for Central Europe. This diversity is also reflected by the multiplicity of traits relevant for population biology and genetics of species, including various modes of diaspore and pollen dispersal [22], life form (annual to long-lived), the breeding and mating system [8], and ploidy (the number of chromosome sets in the cell nucleus and their mode of inheritance: di- versus polysomic). In contrast to trees, herbs show, on average, higher genetic differentiation among populations compared to trees [8,22], e.g., 43% for annuals, 26% for short-lived, and 8% for long-lived herbs according to Loveless and Hamrick [22].

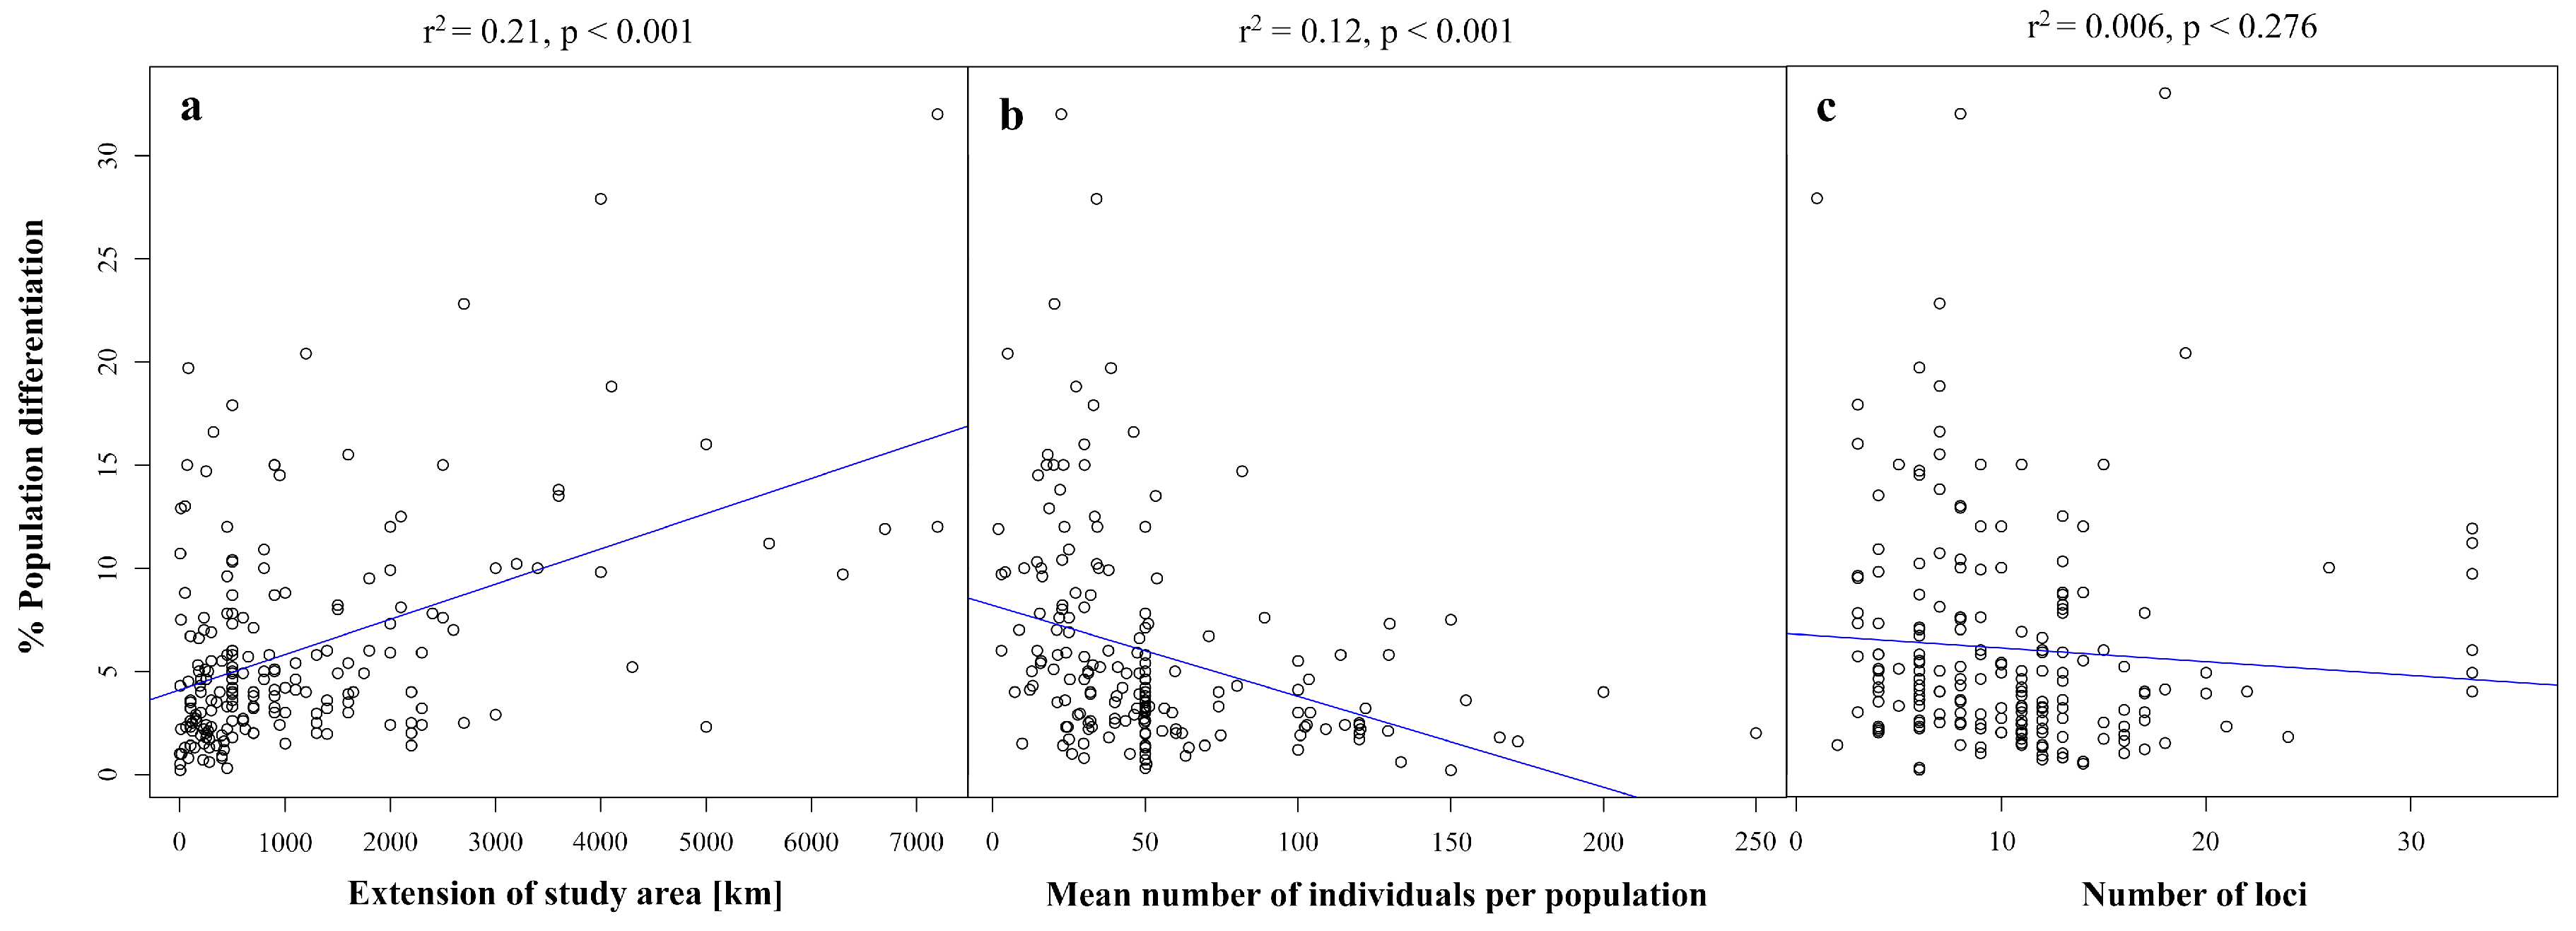
3. Effects of Study Design on Population Genetic Differentiation

Aside from life history traits of trees, we have found effects resulting from study design on the empirically obtained estimates of population differentiation. Indeed, effects from study design were more frequent and pronounced than effects from life history traits, thereby indicating lack of standardization of studies among each other (Tables S3 and S4). Although it is beyond the scope of this review to discuss this topic comprehensively, we conclude from the assembled data that the choice of marker system, the extension of the study area, the number of individuals sampled per population, and the number of utilized loci each influenced the estimate. Effects from the type of measure used to compute population genetic differentiation were first excluded in restricting analyses to Fst, Gst and Φ. These measures were the most preferred and, more importantly, did not differ significantly in their estimates of population differentiation (i.e., had no predictive value in the generalized linear models (GLM) of both bi- and uniparentally inherited markers; Supplementary Materials 2 Table S2), a result which is in accordance with earlier findings [100].
We detected a significant effect of the type of biparental marker on population differentiation (Supplementary Materials 2 Table S1). With the dominantly inherited AFLP markers (7.7% [median] of the total genetic variation resided among populations, N = 8 records), ISSRs (42.2%, N = 4), RAPDs (19.4%, N = 1), and RFLPs (8.0%, N = 2), the tendency was toward higher values than with the co-dominantly inherited isozymes (4.0%, N = 152), SNPs (0.7%, N = 18), and SSRs (5.5%, N = 46), a finding which is in agreement with several empirical and simulation studies [101]. Because the number of data sets available for most of the dominantly inherited systems was low (i.e., for the ISSRs, RAPDs, and RFLPs), we only tested for statistically significant differences between AFLPs and the three co-dominantly inherited markers. Differences between isozyme- and SSR-based estimates of population differentiation were insignificant, while differences were significant for the other pairwise comparisons of marker systems (Table S1). In order to reduce the complexity of the data, we combined the predominantly used ones (isozymes and SSRs) for further analyses while discarding the other less frequently used markers.
Furthermore, we observed a positive correlation between the spatial extension of the study area and the amount of among-population differentiation when considering all nuclear-marker based records (Figure 4a). The correlation was significant when study areas of an extension of at least 3000 km (r2 = 0.04, p = 0.008) were included, while it became non-significant when analyses were restricted to study areas smaller than this value (results not shown). This result reflects some restriction of gene flow by space, i.e., isolation-by-distance. We also uncovered a significantly negative association between population differentiation and the (mean) number of individuals studied per population (Figure 4b). The correlation was also significant for data subsets representing studies performed using isozymes and SSRs, respectively, and species of differing modes of pollen and seed dispersal (results not shown). The relationship between the two variables appeared to be logarithmic, a distribution expected for estimates approaching the true value of population differentiation [101]. The observed correlations imply that population differentiation tends to be overestimated due to limitations in sample size, an effect known in population genetics as the recruitment bias. The actual genetic differentiation of populations must generally be estimated from small samples taken from usually much larger populations. Although Fst and Gst are the most frequently used measures of population differentiation, their estimates are biased by sample size [102]. Finally, there was an effect of numbers of scored loci which was significant in the GLM (Table S3), although correlation of the parameter with population differentiation was non-significant (Figure 4c). In theory, analyzing many markers (hundreds or thousands) would reflect genome-wide neutral divergence and, once representative, estimates of differentiation would reach a plateau. However, when analyzing a restricted number of markers, as in the studies reviewed, studies may not be fully representative of the genome-wide differentiation.

4. Conclusions and Recommendations

Populations of Central European tree species exhibit on average low genetic differentiation. This pattern suggests relatively intense gene flow among populations and associated high effective population sizes. Fst values usually do not exceed 10% in tree species of contiguous geographic distribution corresponding to ≥5 migrating alleles per generation (Figure 3). Mills and Allendorf [56] and Wang [21] recommend a tentative minimum of one and a maximum of ten migrants per generation. Gene flow rates established by means of direct and more sophisticated indirect methods for Central European tree species were within or exceeded these recommended values even for distances of several kilometers (Table 4), although studies are still limited in number. As a tentative result, loss of genetic diversity in tree populations appears, relying on the recommended rates of gene flow, only likely in extreme situations, particularly regarding the spatial position and size of populations.

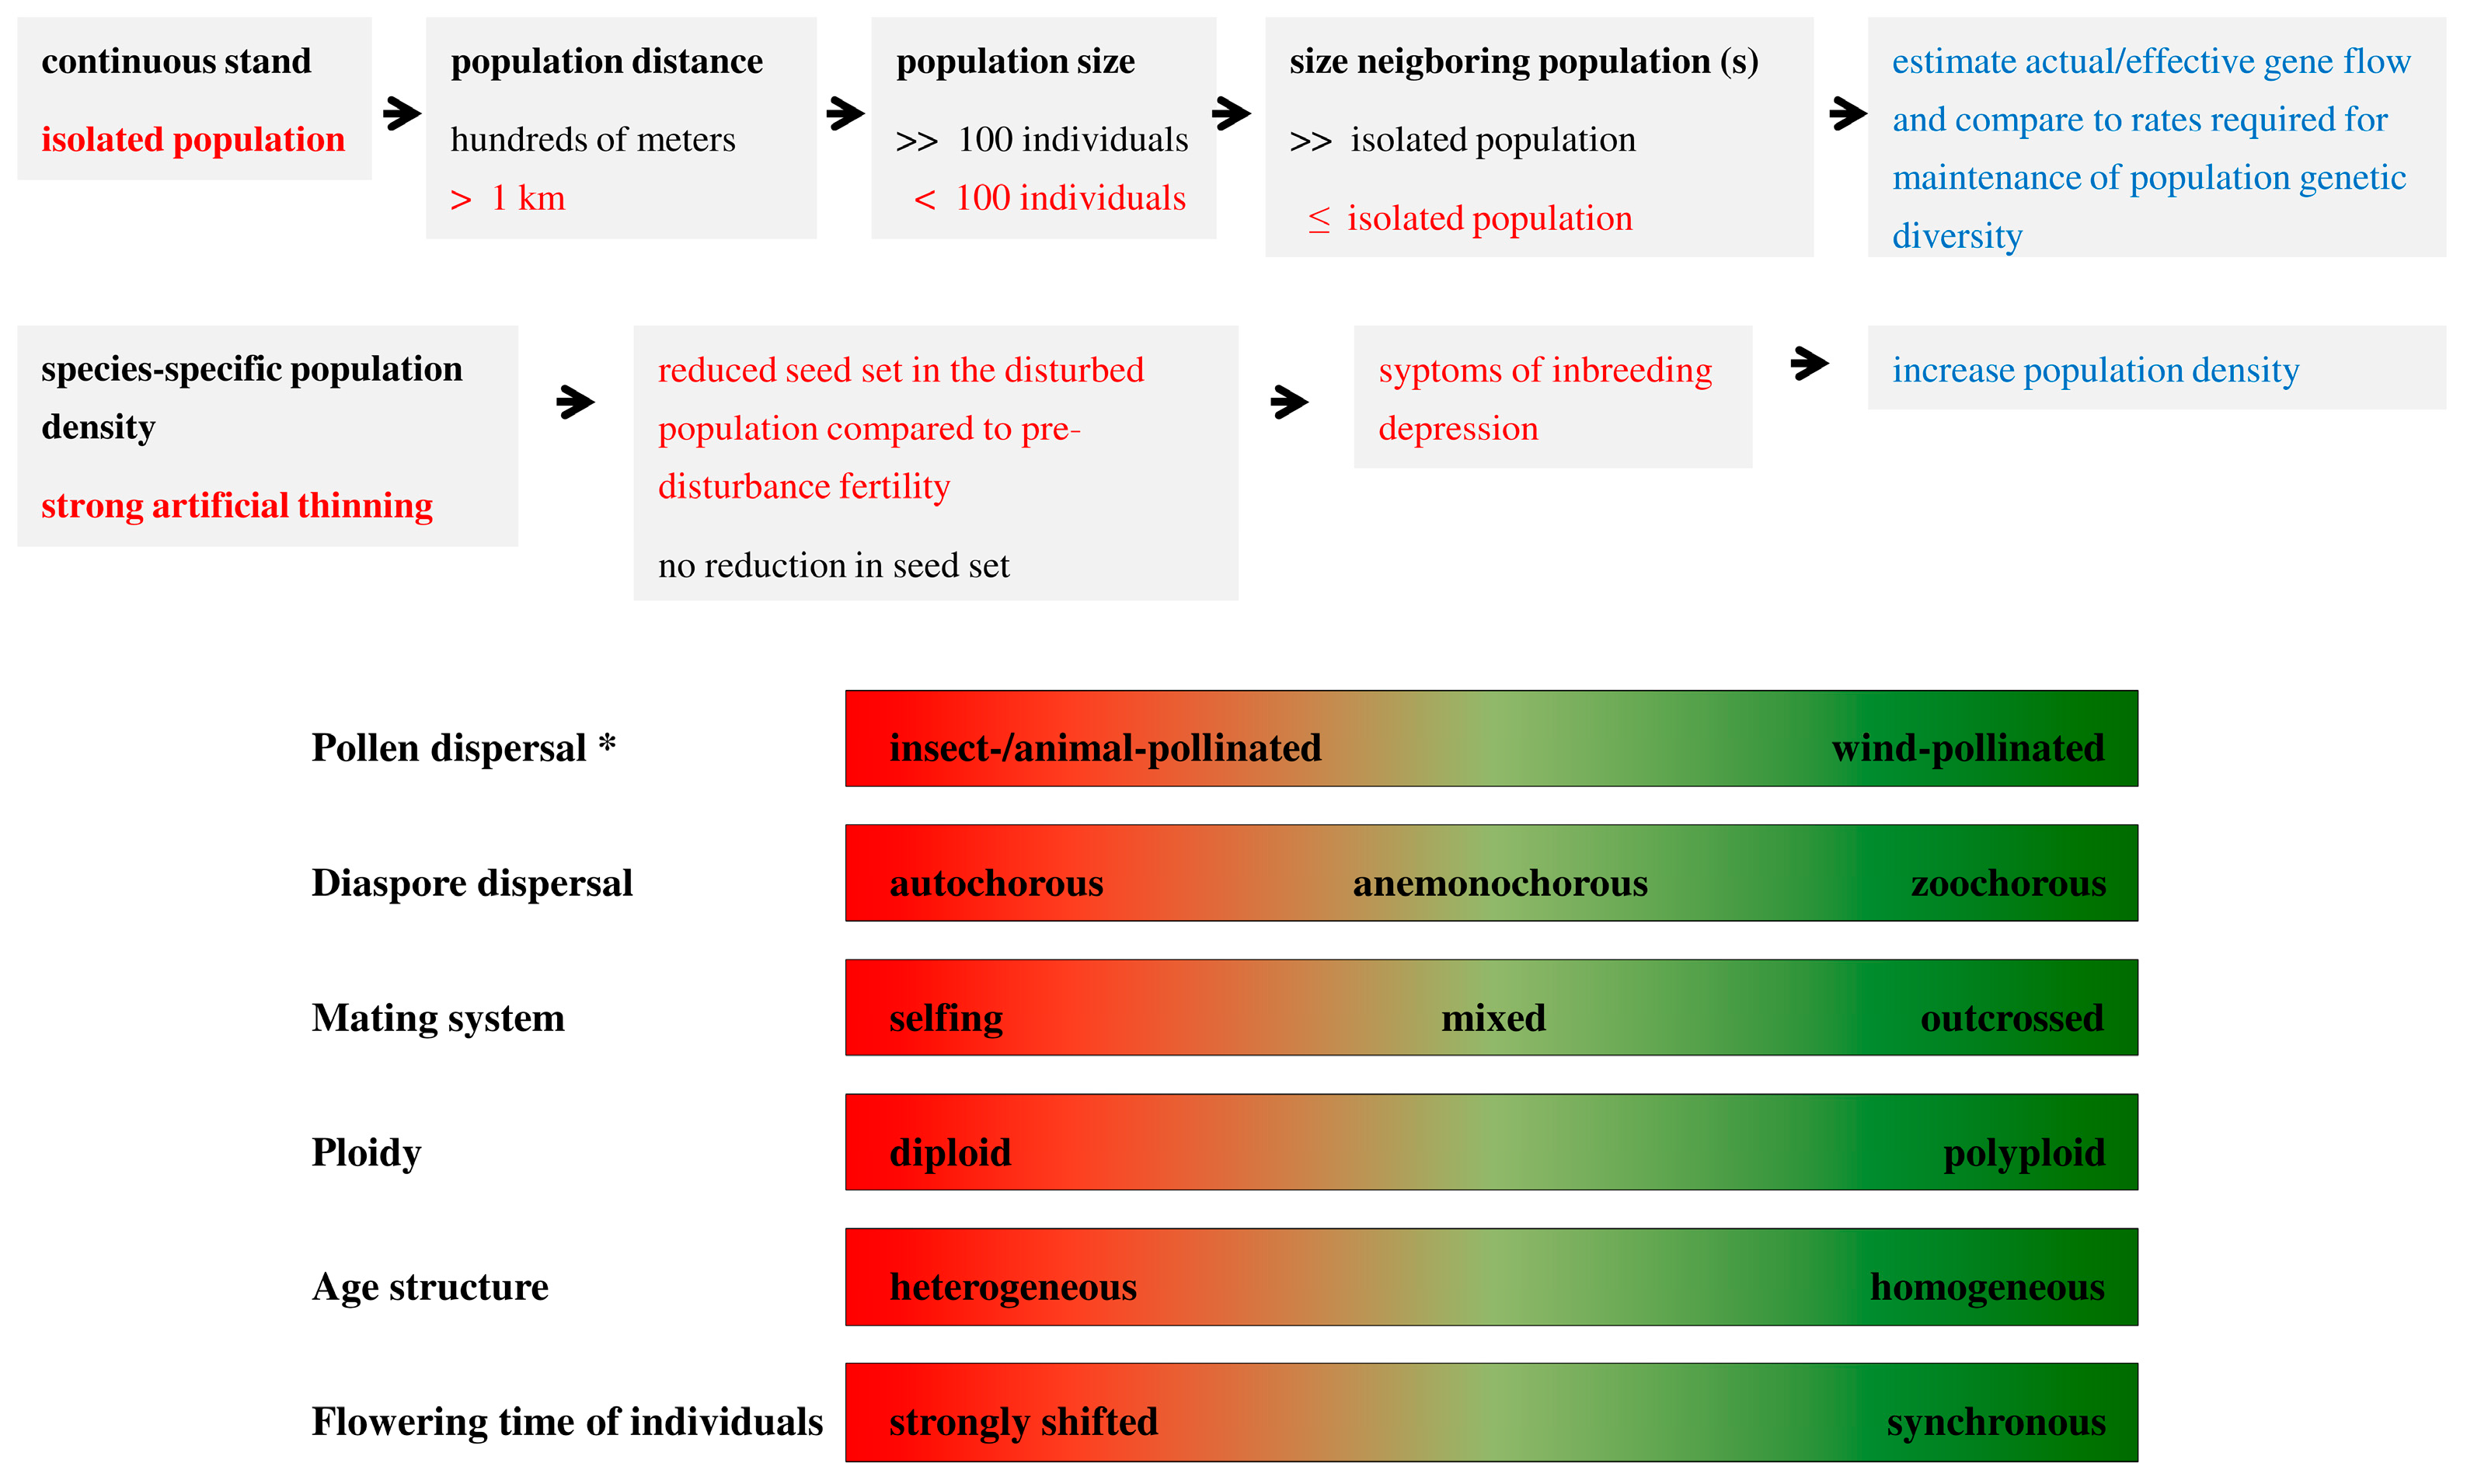
4.1. Spatial Distance among and Arrangement of Populations Reduce Gene Flow

Various parameters influence gene flow down- and upwardly. Spatial distance among populations and their spatial arrangement relative to each other play a particularly decisive role for gene flow. The effect of distance can be deduced from increasing population genetic differentiation with the extent of the study area (Figure 4a). This parameter had the highest significance in predicting genetic differentiation among populations in the GLM (Table S3). Analogously, a distance-dependent decrease in effective gene flow is apparent for Picea abies and Sorbus domestica, species for which gene flow has been measured for different distance classes (Table 4).
As for spatial arrangement, Govindaraju [22] found an increase in population genetic differentiation due to linear arrangement of populations. The effect has been explained by lower gene flow among spatially distant populations compared to neighboring ones. This phenomenon is of importance for gene flow among real populations—in contrast to Wright’s infinite-island model, which assumes an idealized gene flow independent from distance—and has been implemented in the stepping stone model [103] (Figure 5). Therefore, higher gene flow is required under the stepping stone model compared to the infinite-island model—on which the discussed indirect estimates of gene flow are based—to counterbalance random genetic drift and to maintain population genetic diversity, a conclusion also drawn by Mills and Allendorf [56]. The models differ in their predictions only for more than two populations and deviations become only significant for scenarios dealing with larger numbers of populations [21]. As a consequence, estimates of gene flow inferred using indirect methods should be based on values of population genetic differentiation representative of the extent of the area of interest. This is mandatory to correctly rate pre-disturbance gene flow in scope of studies aiming to predict genetic consequences of population fragmentation. As already discussed, Fst values increase by trend with the distance between populations or the size of the study area (Supplementary Materials 1, Figure 4a). As a consequence, application of values obtained for geographically large studies may likely underestimate the amount of historic gene flow among local populations. In addition, we observed a decrease in the estimates of population genetic differentiation with sample size (i.e., the number of individuals studied per population; Figure 4b). This effect pertaining to the design of population genetic studies should be considered in order to obtain accurate estimates of this measure. The required sample size depends in particular on the type of used marker system and presumably also on the level of detectable polymorphism. Estimates stabilize at a certain upper number of individuals analyzed per population. Whether saturation has been reached or not within a given study can be evaluated by systematically increasing sample size (drawn from the available data) using computer simulations (e.g., [101]).

4.2. Superimposition of Pollen Increases Gene Flow

The amount of immigrating pollen decreases asymptotically with distance from its source. However, in wind-pollinated species, superimposition of pollen emitted by more trees (the number of which increases with distance) creates a pollen background [104]. The pollen background describes the density of airborne pollen which builds up in adding the contributions of the single trees. Consequently, the pollen background depends on the size and the density of pollen-emitting populations. Eventually, a strong pollen background potentially secures between-population-pollinations (e.g., [105,106]). This numeric effect of superimposition, which markedly surpasses the probabilities of pollen immigration expected from classical dispersal curves (i.e., dispersal from a single source), has been observed in several studies. In Fraxinus excelsior, for instance, gene flow between a population remnant (N = 4 individuals) and an individual–rich population (N = 30) was asymmetric [74]: 1% contribution to the large population by fathers from the small population versus 26% contribution to the small population by fathers from the large population.
Populations of animal-pollinated species tend to exhibit higher population genetic differentiation compared to wind-pollinated species (Table 1, [9]). The mechanisms of long-distance gene flow in animal-pollinated trees are yet insufficiently understood. The movement of most pollen vectors is primarily determined by foraging economy. Animals preferentially visit flowers of neighboring individuals, an observation which superficially contradicts the relatively low levels of population genetic differentiation inferred for insect-pollinated trees (Table 1). However, pollen carry-over, the stepwise transport of pollen from one flower to another, has been put forward as an explanation for long-distance gene flow in animal-pollinated plants [25,29].
As a result, increased spatial distances among individuals due to population fragmentation or thinning does not necessarily—as an ostensible paradox—reduce gene flow [7]. Raised rates of dispersed pollen have been observed in insect-pollinated tree populations following habitat fragmentation [107,108], as well as in thinned populations of wind-pollinated tree species [6,47,109]. These effects result from the ability of pollinators to purposefully seek out, within their flight distance, flowering individuals and the high pollen background of wind-pollinated species, respectively. As a consequence seed set only becomes a limiting factor at very low tree densities. Nevertheless, such limits apply. Robledo-Arnuncio et al. [66] discusses for Pinus sylvestris a minimal density of 20 trees per hectare as a threshold. This threshold has been proposed for a species which typically reaches high population densities. It is important to recognize that 20 trees per hectare represent in other species (e.g., in Malus and Sorbus species or Taxus baccata) an upper level of natural densities. This natural variation in population density has to be considered when evaluating consequences of thinning on the fitness and the genetics of tree populations. Given the lower pollen dispersal abilities of insect-pollinated trees compared to wind-pollinated trees [9], particularly dependency of insect-pollinated species on vital populations of the pollinators [22], we consider thinning and disturbances of their populations more critical than for wind-pollinated trees.

4.3. Gene Flow versus Random Genetic Drift

We can attest to considerable levels of gene flow among populations of Central European tree species which appear sufficient to counteract random genetic drift in fragmented populations, at least under non-extreme circumstances and provided that there is no strong selection against immigrating seeds and pollen. This is mainly due to effective pollen dispersal mediated by superimposition of pollen emitted by individual trees in wind-pollinated trees which usually build up high-density populations, and likely pollen-carry over in animal-pollinated species in combination with the ability of pollinators to search within their flight distance purposefully for spatially isolated flowering individuals. Long generation times of trees slow down the eroding effects of random genetic drift. A similar conclusion was drawn in a survey by Kramer et al. [7]. They found negative population genetic effects on the fitness in fragmented tree populations in temperate and tropic climates to be—because of benefits from long-distance pollination and seed dispersal as well as from high generation times—the exception rather than the rule. The authors further point at the possibility that it is rather demography (Allee effects [7,67]) than genetics of populations which limit fertility and drive decline or extinction. Nevertheless, demography strongly influences long-term genetic development of populations as a determinant of effective population size and consequently of the extent of random genetic drift. Reductions in population size (occurrence of bottle necks), asynchronous flowering of individuals, strong age structuring of populations, and unequal sex ratios, among other factors, diminish effective population size [20,45,110]. Various formulas have been developed to infer effective population size from census sizes under nonrandom mating, unequal sex ratios or overlapping generations which estimate loss of genetic diversity through drift. However, all occurring complexities that control effective population size cannot be methodologically covered yet [92].

4.4. Recommendations

We can only make tentative statements on the effect of spatial distance isolating a particular fragmented tree population and the size of the population which would be critical for its long-term survival. We are constrained in our conclusions because there are only exemplary studies estimating realized or effective gene flow in Central European tree species. Results obtained in such case studies can hardly be generalized. Gene flow does not only depend on the dispersal abilities of pollen or diaspores and the spatial distance among populations, but in addition is influenced by a variety of additional parameters including the population density of trees, the spatial arrangement of populations to each other, the availability and the activity of vectors, the reproductive compatibility of individuals, and adaptedness of progeny to the environmental conditions in which they are dispersed [22,29]. Analogously, predictions about the loss of genetic diversity from fragmented populations through random genetic drift—which needs to be compensated by gene flow in order to maintain predisturbance levels of diversity—requires knowledge of various demographic characteristics of populations including data on overlap of generations, variability in the genetic contribution to progeny by parental individuals, or variance of population size across generations. The relative importance of the various parameters governing population genetic development is not fully understood yet for Central European tree species. The complexity of exerted effects suggests effective gene flow and random genetic drift to be strongly case-dependent, at least under the condition of permanent fragmentation. For these reasons, we refrain from the definition of minimal population sizes (minimal viable populations), a concept of conservation biology which has come under criticism as of late [118]. Instead, we recommend following a case-by-case approach which evaluates the relevant actual circumstances pertaining to a given fragmentation, ideally over several years and in combination with computer simulations to predict the future development of the population in question. We thus consider the following circumstances as particularly critical with respect to the long-term maintenance of population genetic diversity and fitness: high distances among populations (in the scale of kilometers); absence of nearby individual-rich populations, serving as a potential pollen source, in combination with a small size of isolated populations (<~100 individuals); disturbances deteriorating the environmental conditions preferred or needed by pollinators or vectors of diasporas; and the observation of a strong reduction in seed set as an indicator of inbreeding depression. We summarized these aspects and our reasoning in Figure 6. The figure is intended as a guideline to assist judgments about potential threats from fragmentation on the genetic diversity of tree populations.
The prediction of population genetic changes following habitat fragmentation is even more challenging for the forest understorey species compared to trees due to the higher numbers of species, the associated larger variation in expression of characters pertaining to the biology and reproductive system of the species, and the almost complete lack of studies on gene flow. The complexity in the expression and combination of population genetic-relevant plant traits largely precludes the drawing of general conclusions on the future development of fragmented populations of understorey species. A concrete barrier, for instance, may thus have quite different consequences for inter-population gene flow depending on the ecology of the species and that of its vectors. Therefore, we recommend to follow again a case-by-case approach using computer simulations (individually parameterized for a concrete situation) when aiming to predict future population genetic development. Intrinsic and extrinsic parameters used for simulation are summarized in Table 5, which also provides links to databases or surveys on the expression of the intrinsic traits in various species. Several programs are available for simulating the genetics of populations (e.g., [119,120]), of which we would recommend NEWGARDEN [121] and METAPOP [122]. Unfortunately, METAPOP is no longer supported (personal communication Nathalie Machon, Muséum National d’Histoire Naturelle, Paris), but a succeeding program is planned to be issued in 2017 (personal communication Pauline Garnier-Géré et al., INRA, Cestas). Possibilities for parameterization are summarized in Figure 7. Provided that extrinsic parameters governing population genetics have been empirically established for a concrete situation and data on intrinsic parameters are available, the development of populations over a convenient number of generations can be simulated. The understorey species are an integrative part of forest ecosystems and some are rare and protected by law, thus conferring importance to population fragmentation at least at local scales. The increased sensitivity of society in light of worldwide loss of biodiversity is in favor of undertaking such efforts.

Supplementary Materials

The following files are available online at www.mdpi.com/1424-2818/9/1/9/s1, Supplementary Materials 1 Reproductive system and ploidy of Central European tree species and observed population genetic differentiations. Supplementary Materials 2 Statistic analyses.

Acknowledgments

We are grateful to the following persons from the Austrian Research Centre for Forests, Vienna: to Franz Starlinger for help with the selection and taxonomic delimitation of tree species treated in the review, to Gudrun Csikos and Sylvia Puharic for their steady support in the organization of literature, and to Thomas Thalmayr for the transformation of printed tables of allele frequencies into electronically readable forms and help with figures. We are further grateful to two anonymous reviewers for critical and constructive comments on an earlier version of the manuscript.

Author Contributions

C.D., H.K. and T.G. assembled data and wrote the manuscript.

Conflicts of Interest

The authors declare no conflict of interest.

References

  1. Williams, M. Deforesting the Earth. From Prehistory to Global Crisis; University of Chicago Press: Chicago, IL, USA, 2003; p. 689. [Google Scholar]
  2. Mather, A. The transition from deforestation to reforestation in Europe. In Agricultural Technologies and Tropical Deforestation; Angelsen, A., Kaimowitz, D., Eds.; Center for International Forestry Research (CIFOR): Bogor, Indonesia, 2001; pp. 35–52. [Google Scholar]
  3. Nei, M.; Maruyama, T.; Chakraborty, R. The bottleneck effect and genetic variability in populations. Evolution 1975, 29, 1–10. [Google Scholar] [CrossRef]
  4. Jump, A.; Peñuelas, P. Genetic effects of chronic habitat fragmentation in a wind-pollinated tree. Proc. Natl. Acad. Sci. USA 2006, 103, 8096–8100. [Google Scholar] [CrossRef] [PubMed]
  5. Vakkari, P.; Rusanen, M.; Raisio, J.; Toivonen, H. Genetic variability of fragmented stands of pedunculate oak (Quercus robur) in Finland. Genetica 2006, 127, 231–241. [Google Scholar] [CrossRef] [PubMed]
  6. Bacles, C.F.E.; Burczyk, J.; Lowe, A.J. Historical and contemporary mating patterns in remnant populations of the forest tree Fraxinus excelsior L. Evolution 2005, 59, 979–990. [Google Scholar] [CrossRef] [PubMed]
  7. Kramer, A.T.; Ison, J.L.; Ashley, M.V.; Howe, H.F. The paradox of forest fragmentation genetics. Conserv. Biol. 2008, 22, 878–885. [Google Scholar] [CrossRef] [PubMed]
  8. Hamrick, J.L.; Godt, M.J.W. Effects of life history traits on genetic diversity in plant species. Philos. Trans. R. Soc. Lond. B 1996, 351, 1291–1298. [Google Scholar] [CrossRef]
  9. Hamrick, J.L.; Godt, M.J.W.; Sherman-Broyles, S.L. Factors influencing levels of genetic diversity in woody plant species. New For. 1992, 6, 124. [Google Scholar] [CrossRef]
  10. Petit, R.J.; Duminil, J.; Fineschi, S.; Hampe, A.; Salvini, D.; Vendramin, G.G. Comparative organization of chloroplast, mitochondrial and nuclear diversity in plant populations. Mol. Ecol. 2005, 14, 689–701. [Google Scholar] [CrossRef] [PubMed]
  11. Ehrendorfer, F. (Ed.) Liste der Gefäßpflanzen Mitteleuropas, 2nd ed.; Gustav Fischer: Stuttgart, Germany, 1973; p. 318.
  12. Johannsen, W. Über die Erblichkeit in Populationen und in reinen Linien. In Ein Beitrag zur Beleuchtung Schwebender Selektionsfragen; Fischer-Verlag: Jena, Germany, 1903; p. 76. [Google Scholar]
  13. Schlötterer, Ch. Microsatellites. In Molecular Genetic Analysis of Populations, 2nd ed.; Hoelzel, A.R., Ed.; Oxford University Press: New York, NY, USA, 1998; pp. 237–261. [Google Scholar]
  14. Rothe, G.M. Electrophoresis of enzymes. Laboratory Methods; Springer: Berlin, Germany, 1994; p. 307. [Google Scholar]
  15. Nei, M. Molecular Evolutionary Genetics; Columbia University Press: New York, NY, USA, 1987; p. 512. [Google Scholar]
  16. Gregorius, H.-R. The concept of genetic diversity and its formal relationship to heterozygosity and genetic distance. Math. Biosci. 1978, 41, 253–271. [Google Scholar] [CrossRef]
  17. Wright, S. Isolation by distance. Genetics 1943, 28, 114–138. [Google Scholar] [PubMed]
  18. Nei, M. Analysis of gene diversity in subdivided populations. Proc. Natl. Acad. Sci. USA 1973, 70, 3321–3323. [Google Scholar] [CrossRef] [PubMed]
  19. Hewitt, G.M. Speciation, hybrid zones and phylogeography—Or seeing genes in space and time. Mol. Ecol. 2001, 10, 537–549. [Google Scholar] [CrossRef] [PubMed]
  20. Hartl, D.L.; Clark, A.G. Principles of Population Genetics, 3rd ed.; Sinauer: Sunderland, MA, USA, 1997; p. 542. [Google Scholar]
  21. Wang, J. Application of the One-Migrant-per-Generation Rule to conservation and management. Conserv. Biol. 2004, 18, 332–343. [Google Scholar] [CrossRef]
  22. Loveless, M.D.; Hamrick, J.L. Ecological determinants of genetic structure in plant populations. Ann. Rev. Ecol. Syst. 1984, 15, 65–95. [Google Scholar] [CrossRef]
  23. Avise, J.C. Molecular Markers, Natural History and Evolution, 2nd ed.; Sinauer: Sunderland, MA, USA, 2004; p. 684. [Google Scholar]
  24. Petit, R.J.; Hampe, A. Some evolutionary consequences of being a tree. Ann. Rev. Ecol. Evol. Syst. 2006, 37, 187–214. [Google Scholar] [CrossRef]
  25. Ellstrand, N.C. Gene flow among seed plant populations. New For. 1992, 6, 241–256. [Google Scholar] [CrossRef]
  26. Katul, G.G.; Porporato, A.; Nathan, R.; Siqueira, M.; Soons, M.B.; Poggi, D.; Horn, H.S.; Levins, S.A. Mechanistic analytical models for long-distance seed dispersal by wind. Am. Nat. 2005, 166, 368–381. [Google Scholar] [PubMed]
  27. Straka, H. Pollen- und Sporenkunde; Gustav Fischer: Sunderland, MA, USA, 1975; p. 238. [Google Scholar]
  28. Eisenhut, G. Untersuchungen über die Morphologie und Ökologie der Pollenkörner heimischer und fremdländischer Waldbäume. Forstwiss. For. 1961, 15, 1–68. [Google Scholar]
  29. Handel, S.N. Pollination Ecology, Plant Population Structure, and Gene Flow. Pollination Biology; Real, L., Ed.; Academic Press: Orlando, FL, USA, 1983; pp. 163–211. [Google Scholar]
  30. Goto, S.; Shimatani, K.; Yoshimaru, H.; Takahashi, Y. Fat-tailed gene flow in the dioecious canopy tree species Fraxinus mandshurica var. japonica revealed by microsatellites. Mol. Ecol. 2006, 15, 2985–2996. [Google Scholar] [PubMed]
  31. Streiff, R.; Ducousso, A.; Lexer, Ch.; Steinkellner, H.; Glössl, J.; Kremer, A. Pollen dispersal inferred from paternity analysis in a mixed oak stand of Quercus robur L. and Q. petraea (Matt.) Liebl. Mol. Ecol. 1999, 8, 831–841. [Google Scholar] [CrossRef]
  32. Adams, W.T.; Griffin, A.R.; Moran, G.F. Using paternity analysis to measure effective pollen dispersal in plant populations. Am. Nat. 1992, 140, 762–780. [Google Scholar] [CrossRef] [PubMed]
  33. Burczyk, J.; Adams, W.T.; Moran, G.F.; Griffin, A.R. Complex patterns of mating revealed in a Eucalyptus regnans seed orchard using allozyme markers and the neighborhood model. Mol. Ecol. 2002, 11, 2379–2391. [Google Scholar] [CrossRef] [PubMed]
  34. Smouse, P.E.; Meagher, T.R.; Kobak, C.J. Parentage analysis in Chamaelirium luteum (L.): Why do some males have disproportionate reproductive contributions? J. Evol. Biol. 1999, 12, 1069–1077. [Google Scholar] [CrossRef]
  35. Austerlitz, F.; Dick, C.W.; Dutech, C.; Klein, E.K.; Oddou-Muratorio, S.; Smouse, P.E.; Sork, V.L. Using genetic markers to estimate the pollen dispersal curve. Mol. Ecol. 2004, 13, 937–954. [Google Scholar] [CrossRef] [PubMed]
  36. Grivet, D.; Robledo-Arnuncio, J.J.; Smouse, P.E.; Sork, V.L. Relative contribution of contemporary pollen and seed dispersal to the effective parental size of seedling population of California valley oak (Quercus lobata Née). Mol. Ecol. 2009, 18, 3967–3979. [Google Scholar] [CrossRef] [PubMed]
  37. Gerber, S.; Chadoeuf, J.; Gugerli, F.; Lascoux, M.; Buiteveld, J.; Cottrell, J.; Dounavi, A.; Fineschi, S.; Forrest, L.L.; Fogelqvist, J.; et al. High rates of gene flow by pollen and seed in oak populations across Europe. PLoS ONE 2014, 9, e85130. [Google Scholar] [CrossRef]
  38. Robledo-Arnuncio, J.J.; Klein, E.K.; Muller-Landau, H.C.; Santamaria, L. Space, time and complexity in plant dispersal ecology. Mov. Ecol. 2014, 2, 1–17. [Google Scholar] [CrossRef] [PubMed]
  39. Burczyk, J.; Adams, W.T.; Birkes, D.S.; Chybicki, I.J. Using genetic markers to directly estimate gene flow and reproductive success parameters in plants on the basis of naturally regenerated seedlings. Genetics 2006, 173, 363–372. [Google Scholar] [CrossRef] [PubMed]
  40. Moran, E.V.; Clark, J.S. Estimating seed and pollen movement in a monoecious plant: A hierarchical Bayesian approach integrating genetic and ecological data. Mol. Ecol. 2011, 20, 1248–1262. [Google Scholar] [CrossRef] [PubMed]
  41. Chybicki, I.J.; Burczyk, J. Seeing the forest through the trees: Comprehensive inference on individual mating patterns in a mixed stand of Quercus robur and Q. petraea. Ann. Bot. (Lond.) 2013, 112, 561–574. [Google Scholar] [CrossRef] [PubMed]
  42. Robledo-Arnuncio, J.J. Joint estimation of contemporary seed and pollen dispersal rates among plant populations. Mol. Ecol. Res. 2012, 12, 299–311. [Google Scholar] [CrossRef] [PubMed]
  43. Burczyk, J.; DiFazio, S.P.; Adams, W.T. Gene flow in forest trees: How far do genes really travel? For. Genet. 2004, 11, 179–192. [Google Scholar]
  44. Krutovsky, K.V.; Burczyk, J.; Chybicki, I.; Finkeldey, R.; Pyhäjärvi, T.; Robledo-Arnuncio, J.J. Gene Flow, Spatial Structure, Local Adaptation, and Assisted Migration in Trees. In Genomics of Tree Crops; Schnell, R.J., Priyadarshan, P.M., Eds.; Springer: New York, NY, USA, 2012; pp. 71–116. [Google Scholar]
  45. Wright, S. The evolution in Mendelian populations. Genetics 1931, 16, 97–159. [Google Scholar] [PubMed]
  46. Slatkin, M.; Barton, N.H. A comparison of three different methods for estimating average levels of gene flow. Evolution 1989, 43, 1349–1368. [Google Scholar] [CrossRef]
  47. Smouse, P.E.; Sork, V.L. Measuring pollen flow in forest trees: an exposition of alternative approaches. For. Ecol. Manag. 2004, 197, 21–38. [Google Scholar] [CrossRef]
  48. Sork, V.L.; Nason, J.; Campell, D.R.; Fernández, J.F. Landscape approaches to historical and contemporary gene flow in plants. Trends Ecol. Evol. 1999, 14, 219–224. [Google Scholar] [CrossRef]
  49. Hudson, R.R. Island models and the coalescent process. Mol. Ecol. 1998, 7, 413–418. [Google Scholar] [CrossRef]
  50. Govindaraju, D.R. Estimates of gene flow in forest trees. Biol. J. Linn. Soc. 1989, 37, 345–357. [Google Scholar] [CrossRef]
  51. Vekemans, X.; Hardy, O.J. New insights from fine-scale spatial genetic structure analyses in plant populations. Mol. Ecol. 2004, 13, 921–935. [Google Scholar] [CrossRef] [PubMed]
  52. Hardy, O.; Maggia, L.; Bandou, E.; Breyne, P.; Caron, H.; Chevallier, M.-H.; Doligez, A.; Dutech, C.; Kremer, A.; Latouche-Hallé, C.; et al. Fine-scale genetic structure and gene dispersal inferences in 10 Neotropical tree species. Mol. Ecol. 2006, 15, 559–571. [Google Scholar] [CrossRef] [PubMed]
  53. Wilson, G.A.; Rannala, B. Bayesian inference of recent migration rates using multilocus genotypes. Genetics 2003, 163, 1177–1191. [Google Scholar] [PubMed]
  54. Samarasin, P.; Shuter, B.J.; Wright, S.I.; Rodd, F.H. The problem of estimating recent genetic connectivity in a changing world. Conserv. Biol. 2016, 31, 126–135. [Google Scholar] [CrossRef] [PubMed]
  55. Wright, S. Breeding structure of populations in relation to speciation. Am. Nat. 1940, 74, 232–248. [Google Scholar] [CrossRef]
  56. Scott Mills, L.; Allendorf, F.W. The one-migrant-per generation rule in conservation and managment. Conserv. Biol. 1996, 10, 1509–1518. [Google Scholar] [CrossRef]
  57. Charlesworth, D.; Charlesworth, B. Inbreeding depression and its evolutionary consequences. Ann. Rev. Ecol. Syst. 1987, 18, 237–268. [Google Scholar] [CrossRef]
  58. Richards, A.J. Plant Breeding Systems, 2nd ed.; Chapman & Hall: London, UK, 1997; p. 529. [Google Scholar]
  59. Young, A.; Boyle, T.; Brown, T. The population genetic consequences of habitat fragmentation for plants. Trends Ecol. Evol. 1996, 11, 413–418. [Google Scholar] [CrossRef]
  60. Oostermeijer, J.G.B.; Berholz, A.; Poschlod, P. Genetical aspects of fragmented populations. In Species Survival in Fragmented Landscapes; Settele, J.C.R., Margules, P., Poschlod, P., Henle, K., Eds.; Kluwer: Dordrecht, The Netherlands, 1996; pp. 93–101. [Google Scholar]
  61. De Nettancourt, D. Incompatibility and Incongruity in Wild and Cultivated Plants, 2nd ed.; Springer: Berlin, Germany, 2001; p. 322. [Google Scholar]
  62. Kamm, U.; Gugerli, F.; Rotach, P.; Edwards, P.; Holderegger, R. Seltenes und zerstreutes Vorkommen: Auswirkungen auf den Paarungserfolg des Speierlings. Schweiz. Z. Forstwes. 2012, 163, 130–136. [Google Scholar] [CrossRef]
  63. Kamm, U.; Rotach, P.; Gugerli, F.; Siroky, M.; Edwards, P.; Holderegger, R. Frequent long-distance gene flow in a rare temperate forest tree (Sorbus domestica) at the landscape scale. Heredity 2009, 103, 476–482. [Google Scholar] [CrossRef] [PubMed]
  64. Nason, J.D.; Hamrick, J.L. Reproductive and genetic consequences of forest fragmentation: Two case studies of Neotropical canopy trees. J. Hered. 1997, 88, 264–276. [Google Scholar] [CrossRef]
  65. Ellstrand, N.C.; Elam, D.R. Population genetic consequences of small population size for plant conservation. Ann. Rev. Ecol. Syst. 1993, 24, 217–242. [Google Scholar] [CrossRef]
  66. Robledo-Arnuncio, J.J.; Alía, R.; Gil, L. Increased selfing and correlated paternity in a small population of a predominantly outcrossing conifer, Pinus sylvestris. Mol. Ecol. 2004, 13, 2567–2577. [Google Scholar] [CrossRef] [PubMed]
  67. Lande, R. Genetics and demography in biological conservation. Science 1988, 241, 1455–1460. [Google Scholar] [CrossRef] [PubMed]
  68. Aguinagalde, I.; Hampe, A.; Mohanty, A.; Martín, J.P.; Duminil, J.; Petit, R.J. Effects of life history traits and species distribution on genetic structure at maternally inherited markers in European trees and shrubs. J. Biogeogr. 2005, 32, 329–339. [Google Scholar] [CrossRef] [Green Version]
  69. Müller-Starck, G.; Baradat, Ph.; Bergmann, F. Genetic variation within European tree species. New For. 1992, 6, 23–47. [Google Scholar] [CrossRef]
  70. Ennos, R.A. Estimating the relatives rates of pollen and seed migration among plant populations. Heredity 1994, 72, 250–259. [Google Scholar] [CrossRef]
  71. Oddou-Muratorio, S.; Petit, R.J.; Le Guerroué, B.; Guesnet, D.; Demesure, B. Pollen- versus seed-mediated gene flow in a scattered forest tree species. Evolution 2001, 55, 1123–1135. [Google Scholar] [CrossRef] [PubMed]
  72. Bacles, C.F.E.; Lowe, A.J.; Ennos, R.A. Effective seed dispersal across a fragmented landscape. Science 2006, 311, 628. [Google Scholar] [CrossRef] [PubMed]
  73. Slavov, G.T.; DiFazio, S.P.; Strauss, S.H. Gene flow in forest trees: from empirical estimates to transgenic risk assessment. In Scientific Methods Workshop: Ecological and Agronomic Consequences of Gene Flow from Transgenic Crops to Wild Relatives; Snow, A., Mallory-Smith, C., Ellstrand, N., Holt, J., Quemada, H., Eds.; Ohio State University: Colombus, OH, USA, 2002; pp. 113–133. [Google Scholar]
  74. Bacles, C.F.E.; Ennos, R.A. Paternity analysis of pollen-mediated gene flow for Fraxinus excelsior L. in a chronically fragmented landscape. Heredity 2008, 101, 368–380. [Google Scholar] [CrossRef] [PubMed]
  75. Harju, A.M.; Nikkanen, T. Reproductive success of orchard and nonorchard pollens during different stages of pollen shedding in a Scots pine seed orchard. Can. J. For. Res. 1996, 26, 1096–1102. [Google Scholar] [CrossRef]
  76. Robledo-Arnuncio, J.J.; Gil, L. Patterns of pollen dispersal in a small population of Pinus sylvestris L. revealed by total exclusion paternity analysis. Heredity 2005, 94, 13–22. [Google Scholar] [CrossRef] [PubMed]
  77. Xie, C.; Knowles, P. Mating system and effective pollen immigration in a Norway spruce (Picea abies (L.) Karst) plantation. Silvae Genet. 1994, 43, 48–52. [Google Scholar]
  78. Wang, K.S. Gene flow in European beech (Fagus sylvatica L.). Genetica 2004, 122, 105–113. [Google Scholar] [CrossRef] [PubMed]
  79. Piotti, A.; Leonardi, S.; Buiteveld, J.; Geburek, T.; Gerber, S.; Kramer, K.; Vettori, C.; Vendramin, G.G. Comparison of pollen gene flow among four European beech (Fagus sylvatica L.) populations characterized by different management regimes. Heredity 2012, 108, 322–331. [Google Scholar] [CrossRef] [PubMed]
  80. Thomasset, M.; Hodkinson, T.R.; Restoux, G.; Frascaria-Lacoste, N.; Douglas, G.C.; Fernandez-Manjarres, J.F. Thank you for not flowering: Conservation genetics and gene flow analysis of native and non-native populations of Fraxinus (Oleaceae) in Ireland. Heredity 2014, 112, 596–606. [Google Scholar] [CrossRef] [PubMed]
  81. Pakkanen, A.; Nikkanen, T.; Pulkkinen, P. Annual variation in pollen contamination and outcrossing in a Picea abies seed orchard. Scand. J. For. Res. 2000, 15, 399–404. [Google Scholar]
  82. Burczyk, J.; Lewandowski, A.; Chalupka, W. Local pollen dispersal and distance gene flow in Norway spruce (Picea abies (L.) Karst.). For. Ecol. Manag. 2004, 197, 39–48. [Google Scholar] [CrossRef]
  83. Nikolic, D.; Tucic, N. Isoenzyme variation within and among populations of European black pine (Pinus nigra Arnold). Silvae Genet. 1983, 32, 80–89. [Google Scholar]
  84. Kinloch, B.B.; Westfall, R.D.; Forrest, G.I. Caledonian scots pine: origins and genetic structure. New Phytol. 1986, 104, 703–729. [Google Scholar] [CrossRef]
  85. Buiteveld, J.; Bakker, E.G.; Bovenschen, J.; de Vries, S.G.M. Paternity analysis in a seed orchard of Quercus robur L. and estimation of the amount of background pollination using microsatellite markers. For. Genet. 2001, 8, 331–337. [Google Scholar]
  86. Barton, N.H.; Slatkin, M. A quasi-equilibrium theory of the distribution of rare alleles in a subdivided population. Heredity 1986, 56, 409–415. [Google Scholar] [CrossRef] [PubMed]
  87. Crow, J.F. Basic Concepts in Population, Quantitative, and Evolutionary Genetics; W.H. Freeman and Company: New York, NY, USA, 1986; p. 273. [Google Scholar]
  88. Klekowski, J. Genetic load and its causes in long-lived plants. Trees 1988, 2, 195–203. [Google Scholar] [CrossRef]
  89. Tinner, W.; Lotter, A.F. Holocene expansions of Fagus silvatica and Abies alba in central Europe: Where are we after eight decades of debate? Quat. Sci. Rev. 2006, 526–549. [Google Scholar] [CrossRef]
  90. Williams, C.G.; Savolainen, O. Inbreeding depression in conifers: Implications for breeding strategy. For. Sci. 1996, 42, 102–117. [Google Scholar]
  91. Sorensen, F.C. The roles of polyembryony and embryo viability in the genetic system of conifers. Evolution 1982, 36, 725–733. [Google Scholar] [CrossRef]
  92. Caballero, A. Developments in the prediction of effective population size. Heredity 1994, 73, 657–679. [Google Scholar] [CrossRef] [PubMed]
  93. Yuriev, A.I. Interpopulation gene flow in Hepatica nobilis and Corydalis cava at the border of their range. Zhurnal Obshchei Biol. 1997, 58, 84–93. [Google Scholar]
  94. Shao, J.-W.; Wang, J.; Xu, Y.-N.; Pan, Q.; Shi, Y.; Kelso, S.; Lv, G.-S. Genetic diversity and gene flow within and between two different habitats of Primula merrilliana (Primulaceae), an endangered distylous forest herb in eastern China. Bot. J. Linn. Soc. 2015, 179, 172–189. [Google Scholar] [CrossRef]
  95. Amler, K.; Bahl, A.; Henle, K.; Kaule, G.; Poschlod, P.; Settele, J. (Eds.) Populationsbiologie in der Naturschutzpraxis. Isolation, Flächenbedarf und Biotopansprüche von Pflanzen und Tieren; Ulmer: Stuttgart, Germany, 1999; p. 336.
  96. Aavik, T.; Holderegger, R.; Edwards, P.J.; Billeter, R. Patterns of contemporary gene flow suggest low functional connectivity of grasslands in a fragmented agricultural landscape. J. Appl. Ecol. 2013, 50, 395–403. [Google Scholar] [CrossRef]
  97. Stebbins, G.L. Flowering Plants: Evolution above the Species Level; Harvard University Press: Cambridge, MA, USA, 1974. [Google Scholar]
  98. Godt, M.J.W.; Hamrick, J.L. Patterns and levels of pollen-mediated gene flow in Lathyrus latifolius. Evolution 1993, 47, 98–110. [Google Scholar] [CrossRef]
  99. Fischer, M.A.; Adler, W.; Oswald, K. Exkursionsflora für Österreich, Lichtenstein und Südtirol, 3rd ed.; Biologiezentrum des Oberösterreichischen Landesmuseums: Linz, Austria, 2008; p. 1392. [Google Scholar]
  100. Meirmans, P.G.; Hedrick, P.W. Assessing population structure: Fst and related measures. Mol. Ecol. Res. 2011, 11, 5–18. [Google Scholar] [CrossRef] [PubMed]
  101. Krutovskii, K.V.; Erofeeva, S.Y.; Aagaard, J.E.; Strauss, S.H. Simulation of effects of dominance on estimates of population genetic diversity and differentiation. J. Hered. 1999, 90, 499–502. [Google Scholar] [CrossRef]
  102. Jost, L. Gst and its relatives do not measure differentiation. Mol. Ecol. 2008, 17, 4015–4026. [Google Scholar] [CrossRef] [PubMed]
  103. Kimura, M.; Weiss, G.H. The stepping stone model of population structure and the decrease of genetic correlation with distance. Genetics 1964, 49, 561–576. [Google Scholar] [PubMed]
  104. Adams, W.T. Gene dispersal within forest tree populations. New For. 1992, 6, 217–240. [Google Scholar] [CrossRef]
  105. Lanner, R.M. Needed: A new approach to the study of pollen dispersion. Silvae Genet. 1966, 15, 50–52. [Google Scholar]
  106. Silen, R.R. Pollen dispersal consideration for Douglas-fir. J. For. 1962, 60, 790–795. [Google Scholar]
  107. Dick, C.W. Genetic rescue of remnant tropical trees by an alien pollinator. Proc. R. Soc. Biol. Sci. Ser. B 2001, 268, 2391–2396. [Google Scholar] [CrossRef] [PubMed]
  108. White, G.M.; Boshier, D.H.; Powell, W. Increased pollen flow counteracts fragmentation in a tropical dry forest: An example from Swietenia humilis Zuccarini. Proc. Natl. Acad. Sci. USA 2002, 99, 2038–2042. [Google Scholar] [CrossRef] [PubMed]
  109. Robledo-Arnuncio, J.J.; Smouse, P.E.; Gil, L.; Alia, R. Pollen movement under alternative silvicultural practices in native populations of Scots pine (Pinus sylvestris L.) in central Spain. For. Ecol. Manag. 2014, 197, 245–255. [Google Scholar] [CrossRef]
  110. Kimura, M.; Crow, J.F. The measurement of effective population numbers. Evolution 1963, 17, 279–288. [Google Scholar] [CrossRef]
  111. Klotz, S.; Kühn, I.; Durka, W. Biolflor—Eine Datenbank mit biologisch-ökologischen Merkmalen zur Flora von Deutschland. Schrift. Vegetationskunde 2002, 38, 1–334. [Google Scholar]
  112. Rohmeder, E. Das Saatgut in der Forstwirtschaft; Paul Parey: Hamburg, Germany; Berlin, Germany, 1972; p. 273. [Google Scholar]
  113. Hintze, C.; Heydel, F.; Hoppe, C.; Cunze, S.; König, A.; Tackenberg, O. D3: The dispersal and diaspore database—Baseline data and statistics on seed dispersal. Perspect. Plant Ecol. 2013, 15, 180–192. [Google Scholar] [CrossRef]
  114. The Tree of Sex Consortium. Tree of Sex: A database of sexual systems. Sci. Data 2014, 1, 140015. [Google Scholar]
  115. Yampolsky, C.; Yampolsky, H. Distribution of sex forms in the phanaerogamic flora. Bibliogr. Genet. 1922, 3, 1–62. [Google Scholar]
  116. Barton, L.V. Seed Preservation and Longevity; Hill: London, UK, 1961. [Google Scholar]
  117. Baskin, C.C.; Baskin, J.M. Seeds. Ecology, Biogeography, and Evolution of Dormancy and Germination; Academic Press: Amsterdam, The Netherlands, 2014; p. 1600. [Google Scholar]
  118. Flather, C.H.; Hayward, G.D.; Beissinger, S.R.; Stephens, P.A. Minimum viable populations: Is there a ‘magic number’ for conservation practitioners? Trends Ecol. Evol. 2011, 26, 307–316. [Google Scholar] [CrossRef] [PubMed]
  119. Balloux, F. EASYPOP (version 1.7): A computer program for population genetics simulations. J. Hered. 2001, 92, 301–302. [Google Scholar] [CrossRef] [PubMed]
  120. Excoffier, L.; Heckel, G. Computer programs for population genetics data analysis: A survival guide. Nat. Rev. Genet. 2006, 7, 745–758. [Google Scholar] [CrossRef] [PubMed]
  121. Pelikan, S.; Rogstad, S.H. NEWGARDEN: A computer program to model the population dynamics and genetics of establishing and fragmented plant populations. Conserv. Genet. Res. 2013, 5, 857–862. [Google Scholar] [CrossRef]
  122. Machon, N.; Baradat, D.; Godelle, B. METAPOP a Program Simulating Evolutionary Processes Acting on Metapopulations; Laboratoire ES, Paris-Sud: Paris, France, 1995. [Google Scholar]
Figure 1. The effects of random genetic drift on the genetic diversity of a population expressed as expected heterozygosity He (which is the probability to draw two different alleles from the gene pool of the population just by chance) dependent on population size N (10 to 500 individuals). The change in population genetic diversity has been calculated for a He of 0.50 in generation 0 and 50 consecutive generations.
Diversity 09 00009 g001
Figure 2. Probability of pollen dispersal as a function of distance from its source. The example is based upon results for direct estimates of effective gene flow via pollen obtained from paternity analysis in wild service tree (Sorbus torminalis): exponential fit of the data from the year 2000 provided in Austerlitz et al. [35]. Probabilities are calculated for distance classes of 25 m each. The total probability of pollen dispersal up to 500 m has been set to 1.
Diversity 09 00009 g002
Figure 3. Number of migrating alleles (2Nm with N being the number of diploid individuals and m being the migration rate) under the condition of constant population genetic differentiation. The number of migrating alleles calculates as (0.5/Fst) − 0.5 and is independent from population size.
Diversity 09 00009 g003
Figure 4. Association between population differentiation (combined values for Fst, Gst, and Φ) obtained from biparental co-dominant markers (isozymes and SSRs) and (a) spatial extent of the study area; (b) number of individuals analysed per population; (c) number of screened loci. Linear regressions, probability of correlations and r2 are provided above graphs.
Diversity 09 00009 g004
Figure 5. Idealized scheme of gene flow under the island model and the stepping stone model. The island model assumes that all populations have identical probabilities to exchange genes. In contrast, gene flow decreases under the stepping stone model among population with spatial distance according to dispersal abilities of pollen and seeds. As a consequence gene flow among distantly spaced populations is mediated by intermediate populations. Thickness of arrows corresponds to the intensity of gene flow under the two alternative models. For the sake of simple demonstration gene flow under the island model only is indicated for some population pairs and under the stepping stone model only for neighboring populations.
Diversity 09 00009 g005
Figure 6. Flow chart summarizing the sequence of steps recommended to be taken for the evaluation of potential threats of habitat fragmentation or population thinning for the genetics of tree populations. Critical conditions are highlighted by use of red font, countermeasures to be taken are provided in blue. Evaluation proceeds from left to right through the grey boxes. In the lower part of the diagram, parameters potentially influencing the genetics of populations are presented. States which are relatively favorable for the maintenance of genetic diversity are underlain with green, relatively unfavorable states with red. The relevance of mode of pollen dispersal was marginally significant in our analyses (indicated by the asterisk; cf. Table 2). Note that modes of dispersal affect gene flow while the remaining parameters are determinants of effective population size and thereby random genetic drift.
Diversity 09 00009 g006
Figure 7. Parameters for simulating the genetics of populations as used in the programs NEWGARDEN and METAPOP. The opportunities for parameterization have been chosen with focus on predicting consequences of habitat fragmentation. Data sources are provided in italics. See Table 5 for further reading.
Diversity 09 00009 g007
Table 1. Comparison of estimates of genetic differentiation (combined values for Fst, Gst, and Φ) of tree populations for modes of inheritance. Tests for differences among modes are provided in the right part of the table (ANOVA Bonferroni post-hoc test, df = 289; significance codes: *** 0.001.
Mode of InheritanceNMedianMinMax12
biparental (1)2314.20.255.0
paternal (2)157.02.030.8n.s.
maternal (3)8561.01.2103.4******
Table 2. Estimates of genetic differentiation of tree populations (combined values for Fst, Gst, and Φ) for biparentally inherited markers for modes of pollen dispersal. Tests for differences among modes are provided in the right part of the table (ANOVA Bonferroni post hoc test, df = 195, significance codes: ** 0.01; ‘.’ 0.1).
Mode of Pollen DispersalNMedianMinMax12
wind-pollinated (1)1573.800.232.0
insect-pollinated (2)205.851.422.8.
mixed (3)218.700.833.0**n.s.
Table 3. Estimates of genetic differentiation of tree populations (combined values for Fst, Gst, and Φ) for biparentally and maternally inherited markers for modes of diaspore dispersal. Tests for differences among modes are provided in the right part of the table: ANOVA Bonferroni post hoc test, none of the comparisons were significant at p ≤ 0.05).
Mode of Diaspore DispersalNMedianMinMax1df
biparentally inherited
anemochorous (1)944.10.233
endozoochorous (2)1044.60.332n.s.194
maternally inherited
anemochorous (1)4959.601.7100.0
endozoochorous (2)3662.451.2103.4n.s.81
Table 4. Effective gene flow through pollen in Central European tree species. Paternity analyses are based on identification of genotyped fathers of known spatial position. In case of paternity exclusion experiments, gene flow refers to contributions of fathers from outside a circumscribed area of genotyped trees. Gene flow estimates based on indirect methods have been inferred from population genetic differentiation for rare alleles.
SpeciesDistance (m)Gene FlowMethodReferences
Fagus sylvatica>300/>5000.7/0.9 apaternity exclusion[78]
n.a.52.6–79.8 apaternity exclusion[79]
Fraxinus excelsior>60046–95 apaternity exclusion[6]
n.a.43–68 apaternity analysis[74]
<100/300–1900/290085/15/<1 a
<100/>400<35/>30 apaternity analysis[80]
Picea abiesn.a.70 apaternity exclusion[81] b
>4,000 c16 apaternity exclusion[77] b
>10083 apaternity exclusion[82]
Pinus nigran.a.21.83 d/4.15 eindirect[83] b
Pinus sylvestris>2000 c48 apaternity exclusion[75] b
n.a.4.55 d/8.05 eindirect[84] b
≥30,0004.3 apaternity exclusion[76]
Quercus petraean.a.69 apaternity exclusion[31] b
Quercus roburn.a.65 apaternity exclusion[31] b
>400 c70 apaternity exclusion[85] b
Quercus robur and Q. petraea gn.a.20.9–81.1 apaternity exclusion[37]
Quercus petraea and Q. pubescens gn.a.39.2 apaternity exclusion[37]
Sorbus domestica1000/3000/12,000–16,000>33/8/1.8 apaternity analysis[62,63]
Sorbus torminalis>1000 c1.34/2.85 fpaternity analysis[35]
a percent immigrating pollen; b data taken from [43,50]; c minimal spatial distance among populations; d number of migrating individuals Nm were calculated following Barton and Slatkin [86]; e number of migrating individuals Nm were inferred following Crow [87]; f percent emitted pollen calculated through extrapolation of the geometric (first value) and exponential dispersal curve (second value) provided by Austerlitz et al. [35]; g mixed population.
Table 5. Species life history traits of plants and extrinsic characteristics of plant populations and associated potential effects of unfavorable character states (relative to the other possible states) on the population genetic diversity of the species.
Life History Traits (Intrinsic)Unfavorable StatesExpected Effects
mode of pollen transfer 1animal-pollinated• lower dispersal abilities compared to wind-pollinated species
species relying on specialized pollinators• reduced pollination and possibly occurrence of pollen limitation in case of low population densities or activities of pollinators
mode of diaspore transfer 2barochor, vectors of low mobility• reduced gene flow due to low dispersal abilities of diaspores
breeding system 3dioecy, asymmetric distribution of sexes• increased random genetic drift due to lower effective population size
mating system (selfing, outcrossing, apomixis) 4selfing; apomixis
life form 5annual, short-lived• random genetic drifts act quickly due to short generation times
durability of the seed bank 6low• genetic bottleneck effects (i.e., random genetic drift) in case of fluctuating seed set
ploidy 7diploidy• lower effective population size and lower in tendency reduced heterozygosity compared to polyploids (polysomatic inheritance provided)
Population characteristics (extrinsic)
size and density (habitat quality)low• high random genetic drift connected to low effective population size
• reduced seed set due to insufficient supply of resources needed by pollinators
• reduced gene flow through pollen and/or diaspores due to low emission by potential source populations
population distanceshigh• distance reduces the probability of pollen and diaspore immigration
type of barrier to gene flowstrong physical barrier for non-volant or poorly volant vectors; corridors of changed environment hampering movement of stenoecious vectors• reduced or blocked gene flow
Literature surveys and databases: 1 [111]; for pollen size and properties: www.paldat.org, [112]; for calculation of distance-dependent dispersal probabilities of wind-dispersed pollen: [28]; 2 [111,113]; for calculation of distance-dependent dispersal probabilities of wind-dispersed diaspores: [26,112]; 3 [111,114,115]; 4 [111,114]; 5 [99,111]; 6 [116,117]; 7 The Chromosome Counts Database (CCDB): http://ccdb.tau.ac.il/; Plant DNA C-values Database http://data.kew.org/cvalues/, [111].

