Species Richness and Relative Abundance of Reef-Building Corals in the Indo-West Pacific

Coral Reef Research, 10 Benalla Rd., Oak Valley, Townsville 4810, QLD, Australia
*
Author to whom correspondence should be addressed.
Diversity 2017, 9(3), 25; https://doi.org/10.3390/d9030025
Submission received: 5 May 2017
/
Revised: 23 June 2017
/
Accepted: 27 June 2017
/
Published: 29 June 2017
(This article belongs to the Special Issue Tropical Marine Biodiversity)
Abstract
:Scleractinian corals, the main framework builders of coral reefs, are in serious global decline, although there remains significant uncertainty as to the consequences for individual species and particular regions. We assessed coral species richness and ranked relative abundance across 3075 depth-stratified survey sites, each < 0.5 ha in area, using a standardized rapid assessment method, in 31 Indo-West Pacific (IWP) coral ecoregions (ERs), from 1994 to 2016. The ecoregions cover a significant proportion of the ranges of most IWP reef coral species, including main centres of diversity, providing a baseline (albeit a shifted one) of species abundance over a large area of highly endangered reef systems, facilitating study of future change. In all, 672 species were recorded. The richest sites and ERs were all located in the Coral Triangle. Local (site) richness peaked at 224 species in Halmahera ER (IWP mean 71 species Standard Deviation 38 species). Nineteen species occurred in more than half of all sites, all but one occurring in more than 90% of ERs. Representing 13 genera, these widespread species exhibit a broad range of life histories, indicating that no particular strategy, or taxonomic affiliation, conferred particular ecological advantage. For most other species, occurrence and abundance varied markedly among different ERs, some having pronounced “centres of abundance”. Conversely, another 40 species, also with widely divergent life histories, were very rare, occurring in five or fewer sites, 14 species of which are ranked as “Vulnerable” or “Endangered” on the International Union for Conservation of Nature (IUCN) Red List. Others may also qualify in these Threatened categories under criteria of small geographic range and population fragmentation, the utility of which is briefly assessed.
1. Introduction
Reef building corals, the zooxanthellate Scleractinia, collectively form a widespread and diverse taxonomic group across the tropical Indian, Pacific and Atlantic Oceans. More than 830 species are extant [1], at least 600 of which occur in the Indo-West Pacific (IWP) centre of diversity, the Coral Triangle (CT), with a second, less diverse centre present in the western Indian Ocean [2,3,4]. Diversity attenuates both latitudinally and longitudinally away from these centres. The Atlantic diversity centre in the Caribbean Sea has a unique fauna at species level, beyond the scope of this study.
Individual species range widely in their distributions, with a small number of endemics restricted to particular regions, often at the geographical extremities of reef development or coral growth. These regions include the Red Sea, Arabia and western Indian Ocean, Japan, southern Australia and eastern Pacific [3]. Other species are widespread across much of the Indo-Pacific. Within their distribution ranges, individual species vary widely in abundance in space and time, reflecting local, regional and meta-population dynamics. Since the 1980s, researchers have become increasingly concerned about the perceived declines in coral diversity and abundance [5,6], usually measured as reduction in coral cover.
Most such studies have focused on small geographic scales, usually a small part (10s–100s m2) of a single reef [7,8,9,10], several larger scale, long-term monitoring programs (in e.g., Great Barrier Reef, Indonesia, Caribbean Sea) collectively forming part of the Global Coral Reef Monitoring Network [11] notwithstanding. Individually, such studies have provided useful insights about ecological processes and trends in coral and reef state at local and regional scale [12,13], and collectively have contributed to the emerging picture of the deteriorating state of coral reefs globally [14,15]. However, they are not ideal studies for evaluating conservation status of individual species, nor for identifying specific centres of diversity or abundance, necessary responses to increasing concern for the future viability of corals, as reefs continue to be polluted and overexploited, and oceans warm and acidify [16,17,18].
The initial International Union for Conservation of Nature (IUCN) Red List assessment [19] found that a lack of data on coral population sizes and trends required using loss of reef area as a proxy for population declines. This approach led to approximately one-third of the species assessed being listed in threatened categories, and inspired various assessments of extinction risk at regional or global scales [20,21,22,23]. The Red List assessment also highlighted the lack of accessible information on the richness and abundance of corals that exists at local to global geographic scales, despite our own and others’ work over the past two decades in widespread IWP regions [2,3,10,23,24,25,26,27,28,29,30,31,32,33,34,35,36].
In this paper we provide robust estimates of the local and regional species richness and relative abundance of most species of reef-building coral in the IWP from 1994 to 2016. Using a standard sampling regime, we have compiled species lists and ranked relative abundance estimates from survey sites distributed at the Red Sea, Arabian Sea and Madagascar in the west to Micronesia and Fiji in the east (Figure 1, Table 1). Four large IWP regions received particular focus, with multiple surveys in Arabia, Eastern Australia, Micronesia and the Coral Triangle, the latter widely recognized as the centre of diversity both for corals [3,37], and for tropical marine biota more generally [38,39,40].
The more than two-decadal time span of this study encompassed a broad range of disturbances operating at local to regional to global scales. Most notable among these was the 1997–1998 El Niño event which caused mass coral bleaching and mortality across large areas of the IWP [17,41], with cascading effects on recovery and the subsequent composition of coral communities. Hence our results describe the richness and relative abundance of IWP reef-building corals during a period of significant change, although excluding the much more recent global bleaching event of 2016–2017.
In considering the implications of these impacts, we also examine how our abundance estimates relate to the results of the IUCN Red List assessment [19]. This was based on assessing population trends, specifically rates of population decline from loss of reef area through disturbance. Of particular interest, because of their potential vulnerability, are the rarer species, which we classify here as follows:
- Diffusive—typically sparsely distributed across a broad geographic range;
- Geo-suffusive—geographically limited (occurring in a relatively small geographic area, e.g., northern Red Sea);
- Habitat-suffusive—habitat limited (confined to one or few habitats, e.g., reef flat, mesophotic zone).
It is important to note that these categories are not exclusive, and that some species may exhibit more than one form of rarity, illustrated later herein.
2. Methods
A standard method of Rapid Ecological Assessment (REA, [26]) was employed from 1994 to 2016 at 3,075 individual reef sites, their specific coordinates being recorded using portable GPS. Sites were assigned to an ecoregional classification [3] (Figure 1, Table 1). The 31 ERs collectively represent approximately 45% of Indo-Pacific reef area, based on GIS mapping (Tom Bridge, personal communication, Townsville, Australia) and include the major population centres of most IWP corals [2,3]. Some restricted range endemics, such as those of the Hawaiian Islands, East Pacific, Japan and South-West Australia, were not surveyed.
While sampling frequency and intensity were not standardized within or among ERs, the survey method was constant and a series of methodological issues were considered and addressed (see Table 2). Sampling was opportunistic, in most instances based on the requirements of specific surveys for a variety of research and conservation projects conducted for government and non-government organizations. On some surveys we worked together, on others only one surveyor was present. With these constraints, individual survey sites in each ER were selected, as far as practicable, to provide the broadest range of reef habitat types exposed to different environmental conditions. Surveys covered all main reef types, including fringing, patch, platform and barrier reefs, atolls, and non-reefal coral communities.
Our goal at each site was to compile during a roving diver survey a taxonomic inventory of coral species, including a visual estimate of the relative abundance of each taxon, in an area of no greater than 5000 m2 (typically approximately 50 m across-slope × 100 m along-slope). This area is much larger than the 200–300 m2 usually recommended as sufficient for sampling local species richness [32]. We also made visual estimates of the size frequency distributions and levels of injury of the species present, and of overall coral cover, none of which is presented herein.
The majority of surveys were conducted on self-contained underwater breathing apparatus (SCUBA), other than where logistics did not permit (e.g., some sites on Roti in Lesser Sunda ER), when the compressor failed and snorkel was used. Survey swims were typically initiated towards the base of the reef slope (typically < 50 m maximum depth where reef topography and/or regulations allowed). Sites also included reef lagoons and back reef margins where accessible. The mesophotic zone below 40 m depth was not adequately sampled, because of restricted dive time, and neither was the inner reef flat intertidal zone in water shallower than 0.5 m depth.
Wherever the reef slope had sufficient depth and breadth, two adjacent sites were sampled, on the deeper and shallower slopes respectively. The division between neighbouring deep and shallow sites was based on the more-or-less abrupt depth-related shift in coral community structure. This typically occurs at around 8–10 m depth below reef crest, but the actual depth varied among sites in relation to local topographic and physico-chemical conditions, notably attenuation in illumination and wave energy. Adjacent deep and shallow sites did not overlap.
During each survey swim, the primary observer recorded an inventory of the reef-building corals present on water-proof datasheets, to species level wherever possible [2,25,42,43,44,45,46,47,48,49,50,51,52,53,54,55] (among other taxonomic references), but otherwise to genus and growth form (e.g., Porites sp. of massive growth-form, but see later in Methods). When present, the secondary observer acted as dive buddy, taking photographs and, where permitted, collecting specimens as necessary. Whenever practicable, these roles were interchanged to minimize fatigue, in accordance with safe diving practice. Time of survey at each site was not fixed, but rather was dependent on local species richness. Hence depauperate sites were surveyed more rapidly than speciose ones.
At the end of each survey swim, the compiled species inventory was reviewed, and each taxon was ranked in terms of its relative abundance in the local coral community, where rank 1 represented locally rare corals, rank 2 locally uncommon corals, rank 3 locally common corals, rank 4 locally abundant corals, and rank 5 locally dominant corals. The dominant rank also included, though only rarely, very large mono-specific coral stands that may have been formed by clones, in which it can prove difficult to determine numbers and extent of individual colonies.
These ordinal ranked categories approximate a log 4 scale and provide an estimate of the numbers of coral colonies (or individuals for solitary taxa) in each taxon, rather than its contribution to benthic cover. These ranks are similar to those long employed in vegetation analysis [56,57,58].
2.1. Coral Identification
It was not possible, visually, to identify all corals to species level in the field. Many species, particularly in the speciose genus Acropora, share close morphological similarities with others, and taxonomic disagreements regarding species boundaries continue to exist among specialists, an issue confounded by episodic hybridization [33]. We have listed species for which we have taxonomic or other identification concerns in Table S1.
Extensive use of underwater photography, initially using Nikonos cameras and subsequently digital equipment, aided confirmation of field identifications of taxonomically difficult species. Where additional information was necessary for identification, and with permission of relevant management authorities, small samples, usually < 20 cm on longest axis, were removed from living coral colonies in situ, leaving the majority of most sampled colonies in place. Living tissue was later removed from the specimens by bleaching with household bleach. The dried specimens were labelled, examined and identified, as far as possible to species level. Many of these specimens were identified during and immediately after the field surveys, and remain in museums or universities in their countries of origin. Other specimens provided significant taxonomic challenges, and were shipped, with appropriate Convention on International Trade in Endangered Species of Wild Fauna and Flora (CITES) documentation, to the Australian Institute of Marine Science and/or Museum of Tropical Queensland, Australia, for detailed study. This has, to date, resulted in the publication of some 20 previously undescribed species [2,59,60].
Some broadly distributed species, and others that encompass a range of morphologies, can form species complexes of sibling and/or cryptic species. Some such species have recently been subdivided based on genetic and morphological analyses [53,55,61,62,63]. We have incorporated, where practicable, the recent revisions, as accepted in the Corals of the World website [1], ascribing new names to prior records based on our photographic records and/or samples.
2.2. Assessing Abundance of Massive Porites
This important reef-building group is comprised of at least six species attaining very large colony sizes and ages in the Indo-Pacific [45,67]. These include Porites lobata, P. lutea, P. australiensis, P. solida, P. mayeri and P. myrmidonensis. Unless specifically identified from specimens, these species are particularly difficult to identify in a reliable manner to species level in the field, and hence were usually recorded as “massive Porites” in our dataset. Other massive species in the IWP (e.g., P. murrayensis, P. densa) do not attain large size, typically being < 20 cm colony width, and have distinct morphological characters facilitating field identification [2,25,45,52].
For the six large, colony-forming massive Porites species, we have estimated the species-specific abundance rank scores for all sites where specimen-based data were lacking. These were derived from the grouped massive Porites abundance score in each site in each ER in which each species is known to occur [3] (Table 3). The species-specific scores in Table 3 are based on published assessments of the relative abundance of each species, our specimen records, and on expert opinion [2,25,52] (Charlie (J.E.N.) Veron personal communication). For example, P. lutea and P. lobata are the most widespread and abundant of the group, often forming large mono-specific stands on reef flats and upper reef slopes, sometimes dominated by clones [67]. In the ERs where they occur, Porites lobata and P. lutea were considered the two most common species, followed by P. australiensis, P. myrmidonensis, P. solida and P. mayeri. The individual species scores are all within the range of the log 4 scale of the original grouped massive Porites abundance estimates.
2.3. Analysis
To illustrate relations between sampling intensity and species richness, species rarefaction curves were plotted for selected ERs, using randomized reordering of sites [68].
Occurrence (O) of each species in each ER and across all 31 ERs was calculated as the percentage of sites in which that species was present. Mean abundance (MAbn) of each species in each ER and across all ERs was calculated as the sum of individual site abundance scores (1–5) divided by the number of sites in which that species was present. Overall abundance (OA) of each species was calculated as the product of their O and MAbn scores. Hypothetically if a species occurred in every site it would score 100 for O, and if it was locally dominant (abundance score of 5) in every one of those sites, it would have a MAbn of 5, and a maximum OA score of 500 in an ER or across the 31 ERs. In reality, no species achieves this level of ubiquity.
This simple OA metric provides a standard way of assessing species abundance across the IWP. As a measure of the overall distribution of relative abundance, each species was assigned to one of the following categories based on its IWP-wide OA score: Very Rare: OA < 0.1; Rare: OA of 0.1– < 1.0; Uncommon: OA of 1.0– < 10.0; Common: OA of 10.0– < 50.0; Very Common: OA of 50– < 100; Near ubiquitous: OA of 100–500.
Relations between species’ occurrence and abundance were illustrated and trends assessed with linear regression. Differences in species richness and abundance between deep sites (typically from > 10– < 50 m depth) and shallow sites (typically < 1–10 m depth), and the depth preferences of individual species were also assessed. Tests of the significance of depth-related differences in richness and abundance were conducted using the paired sample non-parametric Wilcoxon signed-rank test in the XLSTAT statistical package. In this overview we have not assessed relations among alpha, beta and gamma diversity, a topic for future work.
Finally, we compared our abundance estimates with the findings of recent global and regional vulnerability assessments.
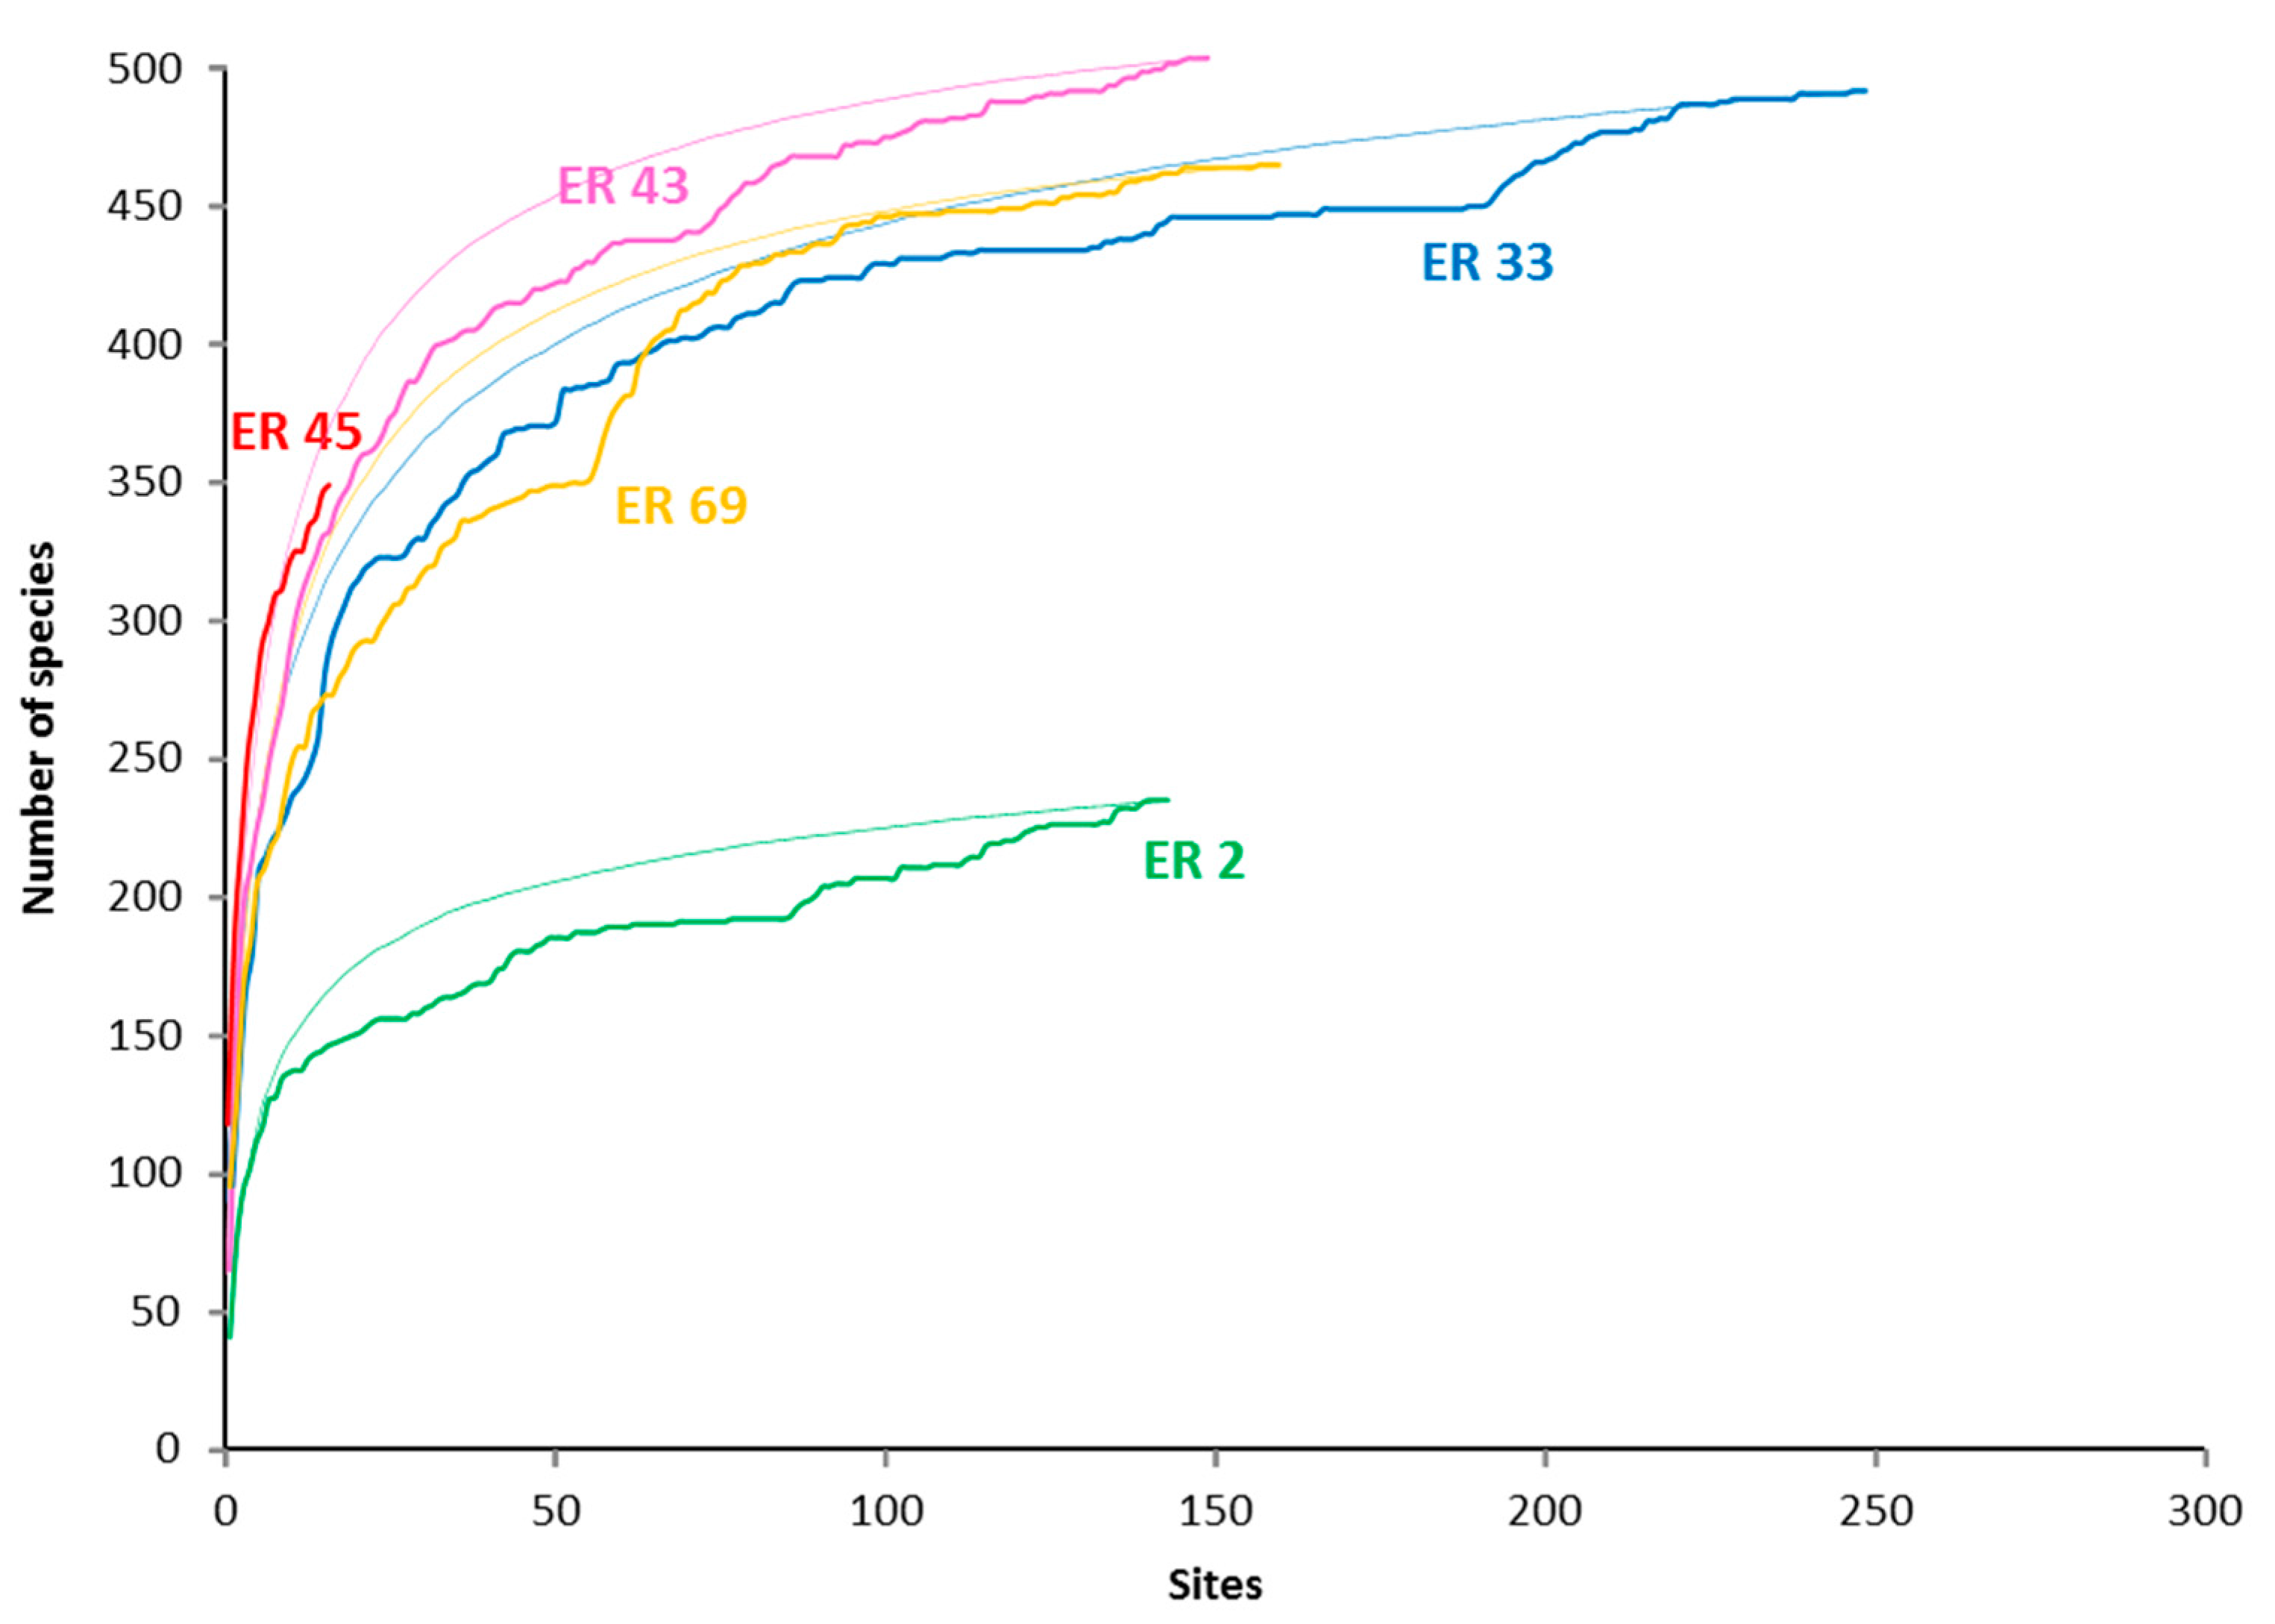
Figure 2.
Species accumulation and rarefaction curves for selected Ecoregions. The accumulation curves reflect the order in which data were collected and added to the database, while the rarefaction curves (the thin lines) are based on repeated, randomized reordering of sites [68]. ER 2—Red Sea North-central; ER 33—Lesser Sunda Islands and Savu Sea; ER 43—Sulu Sea; ER 45 Philippines north; ER 69—Bismarck Sea (see Table 1 for details).
3. Results
3.1. Species Distributions
There was a broad range in the scale of species’ distributions across the IWP. A large number of species were geographically restricted, with 157 species occurring in five or fewer of the 31 ERs, of which 47 species were found in only one ER. Conversely, 142 species were very widespread across the IWP, occurring in 25 or more ERs (Figure 3, Table S2). Of the 47 species restricted to only one ER, many are considered endemic to particular regions, notably the Red Sea (e.g., Erythrastrea flabellata, various Echinopora and Montipora spp.), Arabian Sea (Fungia puishani, Parasimplastrea omanensis, Sclerophyllia maxima), or ERs within the CT (Lesser Sunda Islands and Savu Sea for Acropora suharsonoi and Euphyllia baliensis, Cenderawasih Bay for three Astreopora spp.). These varied patterns of endemicity are consistent with speciation both at the periphery (e.g., Red Sea) and centre (e.g., CT) of diversity.
3.2. Species Richness
Across all 3075 sites, a total of 672 confirmed species of reef-building coral were recorded. The highest ER richness, 505 species from Sulu Sea, was compiled from two comprehensive surveys, of the Derawan area off the east coast of Indonesian East Kalimantan, and of the north-west and north-east coasts of Palawan Island in the Philippines (Table 1), both areas with high habitat diversity [1]. All the richest ERs, with more than 450 reef-building coral species present (Table 1), were in the CT, and also included Raja Ampat, Lesser Sunda Islands and Savu Sea, Celebes Sea, Cenderawasih Bay, Halmahera, Papua south-west coast, Bismarck Sea and Sunda Shelf.
Our score for ER richness for the North Philippines of 348 species is a significant underestimate (compare with [3,37]), affected by lack of sampling (Table 1, Figure 2).The opportunistic survey (16 sites) was undertaken during the IUCN reef coral Red List meeting at Batangas Bay, west Luzon and so focused on easily accessible local reefs (Table 1).
Both site and ER richness attenuated away from the CT (Table 1 and Figure 4), increasing again in Madagascar, Socotra and Northern Red Sea. The major latitudinal and longitudinal declines, north to Japan, south along Western Australia and east to Far Eastern Pacific, were not captured in our dataset.
3.3. Marginal ERs
Several ERs are comprised of marginal reef habitat, including the Gulf of Aden (Yemen), Moreton Bay (Eastern Australia) and Hong Kong (China). Despite their low species richness, these ERs play important roles in sustaining populations, respectively, of Arabian Sea endemics (Gulf of Aden) and otherwise rare taxa (e.g., Platygyra acuta and P. carnosus in Hong Kong, and Acropora bushyensis in Moreton Bay). These were also the most faunistically unusual ERs. For example, at Moreton Bay, the five most abundant corals were Goniastrea australiensis, Plesiastrea versipora and three species of Turbinaria. These species did not attain such high levels of abundance elsewhere in our study, but are common components of the coral fauna of other high latitude locations and turbid environments. Our ER richness tally of 114 species (Table 1) is a major increase on previous estimates [69], likely resulting from both successful recent recruitment into these subtropical waters from southern GBR, and our search methodology (Table 2).
Local (site) richness peaked at 224 species at one shallow site in Halmahera ER. At that particular location, the richness tally for the adjacent deep and shallow sites combined topped 280 species ha−1, representing more than one-third of all IWP reef-building corals on a small patch of one reef. The 10 richest sites, all with more than 190 species, were located in the CT, within Halmahera, Cenderawasih Bay and Papua south-west coast ERs. These three ERs, along with North Philippines, Sulu Sea and Sunda Shelf, had highest mean site richness scores of > 100 species, compared with an overall mean site richness of 71 spp. (SD 38 spp.). Approximately one-third of all sites had < 50 species present, two-thirds of sites had < 100 species and most of the remainder had < 150 species, with less than 3% of sites hosting > 150 species (Figure 5).
3.4. Effects of Depth on Richness and Abundance
For 1,808 sites that comprised adjacent deep–shallow pairs, there was little difference in site richness between shallow and deep sites (Figure 6A) with the mean for shallow sites being 89 spp. (SD = 35) and for deep sites being 88 spp. (SD = 31) (Wilcoxon P = 0.254). Mean site abundance (calculated as the sum of species’ local abundance scores in each site) was, however, significantly higher in the shallower sites (Figure 6B) with mean abundance score for shallow sites being 144, (SD = 61) and for deep sites being 130 (SD = 52) (Wilcoxon p < 0.0001, Table S3).
The strength of these depth-related differences in site abundance varied among different ERs (Figure 6B). For example, higher coral abundance was documented in shallow sites of Milne Bay and Papua south-west coast ERs, and higher abundance in deeper sites of Palau ER. Red Sea north-central ER showed little difference in site abundance with depth.
The vast majority of species in the paired sites, 622 species (representing 93% of total species pool), were found in both shallow and deep sites (Figure 7, Table S2), consistent with relatively broad tolerances to local ambient environmental conditions, notably illumination, wave energy and sediments. For 90 of these species there was little (<25%) difference in OA scores between deep and shallow sites. Most species of Acanthastrea, for example, exhibited this tolerance pattern. For most other species, however, there were substantial differences in OA scores, with 397 and 185 species preferring deeper or shallow sites respectively (>25% difference in OA scores). Overall, differences in species OA scores between shallow and deep sites were highly significant (Wilcoxon p < 0.0001, Table S3).
As would be expected, the speciose genera Acropora, Montipora and Porites were well represented in both depth ranges. Examples of Acropora species with strong preferences for shallow habitat included Acropora aspera, A. digitifera and A. elseyi. In deeper sites, Acropora granulosa, A. plumosa and A. speciosa were much more abundant. Notably, all recorded species of Blastomussa, Caulastrea, Coscinaraea, Ctenactis, Diaseris, Echinophyllia, Euphyllia, Fungia, Galaxea, Merulina, Mycedium, Oulophyllia, Oxypora, Pachyseris, Pectinia, Plerogyra, Podabacia and Polyphyllia, were more abundant in deeper habitats, as were most species of Alveopora, Anacropora, Astreopora and Echinopora (Table S2). Fifty species showed stronger niche differentiation, with 25 species being recorded only from shallow sites, and another 25 species only from deeper sites (Table 4), with implications for future population viability.
Of these 50 species, several have significant taxonomic issues or have major distributions outside our surveyed ERs (Table S1). In respect to their abundances, almost all were rare or very rare, with OA scores of <1. On the IUCN Red List, seven of these species have not yet been assessed and 16 species are Data Deficient. Of the remaining 27 species, three are considered of Least Concern, four are Near Threatened, 12 are Vulnerable and eight are Endangered (Table 4), their threatened status consistent with their apparent rarity and niche specialization.
3.5 Relative Abundance
At site level, more than 600 species were locally uncommon or rare overall (mean abundance scores of 2 or less), with only a few more locally common taxa (mean score > 2, Figure 8A). This result is also reflected in the shape of the OA species curve, with 67 species, only 10% of the total species pool, scoring OA > 50 (Figure 8B). Based on our classification of OA scores (Figure 9), approximately 62% of the total species pool were classified in the following categories: uncommon (40%), rare (19%) or very rare (3%); and 38% of species were classified in the following: common (29% of species), very common (8%) or near-ubiquitous (1%).
For individual species, IWP-wide OA scores ranged from <0.1 (six species) to 182.7 for Porites massive (compared to a possible maximum OA score of 500). Within the Porites massive species group, the two most common species were Porites lutea and P. lobata (Figure 10). These were the most abundant in our study, as reflected in their OA scores overall and for individual ERs (Table 5 and Table S2).
Other near-ubiquitous reef coral species included Galaxea fascicularis, Goniastrea pectinata, Platygyra daedalea, Stylophora pistillata and Cyphastrea serailia, all with IWP-wide OA scores > 100. These were followed closely by Favia favus, Pocillopora verrucosa, and P. damicornis (including cryptic species, Table S1, [63]), Fungia fungites and Pavona varians, all with IWP-wide OA scores > 90 (Table 5).
There was general concordance between our high OA scores for these species and their IUCN Red List categories (Table 5), with all 30 species being either of Least Concern (21 spp.) or Near Threatened (9 spp.), and with none in the more threatened categories.
Within individual genera, OA scores ranged widely (Table S2), one example being Pectinia (Table 6). Three species were common (OA scores of 20 to 46), four species were uncommon (scores between 1 and 8), and two species were rare (scores of 0.8). For Pectinia spp. there was much less concordance between OA scores and their Red List categories. For example, the two most common and widespread species, Pectinia lactuca and P. alcicornis, were listed as Vulnerable, and the third common species, P. paeonia, as Near Threatened. Three of the four uncommon species were listed as Near Threatened, the fourth, P. maxima, as Endangered. Of the two rare species, one, P. africanus, was listed as Vulnerable and the other, P. pygmaeus as Near Threatened.
3.6. Rare Taxa
At the opposite end of the OA spectrum, 91 species were recorded in 10 or fewer of the 3075 sites. Of these, some have taxonomic or other identification issues and their abundance estimates are not considered reliable (Table S1). The 40 rarest taxa, occurring in five sites or less (Table 7), represented a broad mix of geo-suffusive, habitat-suffusive and diffusive species. Geo-suffusive taxa, namely restricted range endemics, included recently described species, such as Euphyllia baliensis. This species may also be habitat-suffusive, favouring the upper mesophotic zone [60]. Other very rare, habitat-suffusive, mesophotic specialists included Craterastrea levis. This species could also be considered as diffusive, with a widespread distribution range across the Indian Ocean, although its true abundance has likely been underestimated, because its preferred habitat of > 35 m depth has not been well sampled. This species was also initially considered as geo-suffusive, a Red Sea endemic, prior to its discovery outside the Red Sea, in other parts of the western Indian Ocean [49,71,72] and in the CT (this study). Other apparently diffusive species included Duncanopsammia axifuga, Echinopora ashmorensis and Micromussa diminuta (Table 7).
These rarest taxa presently have a broad range of IUCN Red List assessments, with approximately half in Threatened categories: five species are Endangered; nine are Vulnerable; six are Near Threatened; four are Least Concern; 11 are Data Deficient; and five have not yet been assessed [70]. In respect of modeled vulnerability to climate change [22], all but three of the 35 assessed species scored highly under at least two of three broad criteria (Table 7). All species had high sensitivity, based on specific habitat preferences, life histories and symbiont associations. Twenty-one species also scored highly for “unadaptability”, reflecting limited dispersal and adaptive capacity. Seventeen species had high exposure to climate impacts of bleaching and acidification, affecting range sizes through increasing habitat marginalization. Seven species, each of different genera, scored highly on all three criteria, and with their apparent rarity, must be considered at significant risk. Two are presently listed as Endangered, three as Vulnerable, one as Near Threatened and one as Data Deficient (Table 7).
3.7. Centres of Abundance
The relative abundance of different coral species varied widely among different ERs (Table S2). This is illustrated by comparing different island groups within Micronesia and Polynesia (Table S4, incorporating data from [23] and Douglas Fenner and Peter Houk, unpublished). Porites lutea and P. lobata scored highly at most locations. P. rus ranked 24th on the IWP OA score, but was within the top 10 species at four Pacific locations, and was the most abundant coral at Pohnpei and Kosrae. Galaxea fascicularis ranked third on the IWP OA score, and its more localized rankings were 6th in Fiji, 12th in American Samoa, 18th in Palau, 29th on Pohnpei, 72nd on Kosrae, 161st on Marshall Islands, and not recorded at Yap. Isopora palifera ranked 17th on the IWP OA score, ranked first in Marshall Islands, and was also relatively common in Yap (ranking 21st). However it was lowly ranked at the other Micronesian islands of Kosrae, Pohnpei and Palau (57th, 58th and 77th respectively), and only 107th in American Samoa and 125th in Fiji. Among these same western Pacific locations, by contrast, Goniastrea pectinata and Favia matthaii showed relatively little variation in their ranking, although mostly scoring below their IWP-wide OA ranks.
Many reef-building coral species, even those with widespread IWP distribution ranges, had particular centres of abundance at time of survey, illustrated here with three widespread, distinctive species (Figure 11A–C).
Diploastrea heliopora (IWP OA 68.5) was recorded from 25 ERs, occurring in 48% of all sites, with centres of abundance in Madagascar and from the Andaman Sea to Fiji. It was uncommon to very rare in the Red Sea and NW Indian Ocean. The relative ubiquity of this species, occurring in nearly half of all sites, countered its typically low local abundance scores, being rare, or uncommon, in most sites in which it occurred. We did not find it in Red Sea south, Gulf of Aden or Yap Islands ERs, although it is confirmed or expected to occur there [1].
Physogyra lichtensteini (IWP OA 41.3) was recorded from 22 ERs, in 31% of all sites. It was not recorded from marginal ERs of the NW Indian Ocean, Hong Kong and Moreton Bay. It had highest levels of abundance in the Andaman Sea, and was common across the CT, in Pohnpei and in Madagascar. We did not find it in Red Sea north-central, Great Barrier Reef south or Fiji ERs, although it is confirmed to occur there [1].
Porites rus (IWP OA 78.0) was recorded in 26 of the 31 ERs and 40% of all sites. It ranged from 0 to 282.9 in OA scores, ranking as the most abundant species in several ERs, and with widespread centres of abundance from the Red Sea to the Sunda Shelf to Fiji. It was less common throughout much of the CT, with ER OA scores of < 100. We did not find it in Gulf of Aden or Great Barrier Reef south-east ERs, although it is confirmed to occur there [1].
4. Discussion
4.1. Species Richness
Our tally of 672 species across 31 ERs, although substantial, is some 50 species less than the total species pool for these ERs listed in the most recent global compilation of species distributions [1]. The latter study includes all confirmed records from numerous authors [3]. At the level of individual ERs, our tallies are also lower, to be expected given the wealth of additional studies [3].
For comparison, a large coral biogeographic study ranging from the CT to the western-central Pacific that employed sets of replicate 10 m line transects recorded a total of only 333 reef-building coral species [30,32,73]. The last study considered that transects are sufficient to adequately characterize regional richness, yet their IWP tally of 333 species is much lower than the number of species that occur within a single island group in many ERs of the CT. For example, Bunaken National Park (Celebes Sea ER, Table 1) was sampled using transects in the above study [30,32,73] and by the present method [29]. Our study recorded 390 species there, 57 species more than the total IWP-wide species pool of the transect study. This again illustrates the major differences in richness estimates that can arise from different sampling methods (Table 2).
The richest ERs and individual sites were all found in the CT, consistent with other studies [3,40]. This biogeographic province hosted more than 75% of species recorded here, and a significant number of species that remain undescribed (Emre Turak, Lyndon DeVantier unpublished). Within the CT, the richest ER, Sulu Sea, is highly habitat-diverse. It was also well sampled (Table 1). Despite its highest score, we do not consider this ER to be the centre of reef coral diversity; rather it is one of several ERs with high local and regional richness. Similarly, the richest individual site was found in Halmahera ER, but we do not consider that this is the “bulls-eye” of local richness. Processes governing population dynamics, including complex interactions among episodic and/or chronic disturbances and individual coral tolerances, reproduction, dispersal and recruitment, together ensure that such sites are ephemeral in space and time. What can be concluded, however, is that over the two decadal period of this study the CT hosted both sites and ERs of exceptional species richness, and showed attenuation away from the centre. The reasons for this have been long debated, and will not be addressed here (but see e.g., [30,37,38,40,74]).
4.2. Relative Abundance
Our study also documents major differences in the relative abundance of different coral taxa across the IWP. Most species ranged widely in abundance among different ERs (Table S2). This manifests as differential contributions to the assembly of coral communities and reef-building at local and regional scales across each species’ range (Table S4). Although such differences have been well known, at least at local scales, the reasons why certain corals are much more abundant or rare than others, locally, regionally or globally, remain perplexing. It would appear to be contingent on specific sets of life history traits that confer advantage to a population in particular ecological circumstances [22].
These traits may provide tolerance to a broad range of ambient environmental conditions, including fluctuations in temperature, turbidity, salinity and alkalinity, as exemplified by Porites spp., massive forms of which were the most abundant taxa, occurring commonly in all ERs. Other traits may confer regular reproductive success (e.g., brooding and planulae release) and rapid recruitment (growth to reproductive maturity). Such traits [22] are exemplified by some pocilloporids (Stylophora pistillata, Pocillopora damicornis, P. verrucosa, Table 5), and other near-ubiquitous species, ensuring continued local—meta-population viability. These traits, when linked with successful dispersal and recruitment, would appear crucial.
Yet even among these two taxonomic groups, only certain species attained near ubiquity, while other highly abundant species represented numerous other scleractinian genera (Table 5). These exhibit a very broad range of life histories, with different morphologies, growth rates, reproductive modes, symbiont associations and other traits [22,25,51,75,76,77]. These species also display a broad range across the autotrophy-heterotrophy spectrum [78], indicating that no strategy or taxonomic affiliation confer universal advantage.
Conversely a large number of species were rare to very rare (Table 7, Figure 9 and Table S2). These also represented a broad range of genera and life histories. Many have relatively restricted global distributions [1,3], some in regions poorly sampled in this study, while others prefer habitats not well sampled (Table 2), notably the mesophotic zone [79].
4.3. Different Forms of Rarity
Highly diverse ecosystems, including coral reefs, have many species that are locally and regionally rare, well-illustrated by our ER species accumulation curves, which continued to increase, albeit slowly, over the duration of our surveys (Figure 2). Such rarity can be categorized as diffusive, geo- or habitat-suffusive (Table 7). Major recent revision of distribution range mapping [1,3] has enabled improved understanding of geo-suffusive species. The habitat-suffusive nature of some species is also relatively well understood. Examples of apparently geo-suffusive taxa include Acropora suharsonoi and Euphyllia baliensis. Both are morphologically distinctive (Figure 12A, B) with highly restricted distribution ranges, presently known only from Lesser Sunda ER. We recorded A. suharsonoi from six sites in all, always locally rare. The more recently described E. baliensis is known only from the type locality, in the upper mesophotic zone of a clear-water reef. Habitat-suffusive species include those that prefer shallow or deeper reef slopes (Table 4), some of which were never found in high local abundance (but see later).
Diffusive and habitat-suffusive rarity were exemplified in our study by Craterastrea levis, a mesophotic species (Figure 12C) originally described from the Red Sea (reviewed by [72]). We did not find it in the western Indian Ocean, but did record it in Halmahera and Papua south-west coast ERs in the CT, a major range extension. Another apparently diffusive species, at least in the surveyed reef habitats, is Duncanopsammia axifuga (Figure 12D). This species is also widespread across the IWP, occurring rarely on sandy edges of reef slopes. It may be more abundant in sandy inter-reefal habitats, not surveyed during the present study.
The number and identity of truly diffusive species remains to be determined, a task hindered by the significant limitations of underwater survey. All dedicated surveys, since the advent of SCUBA, would cover much less than one-thousandth of one percent of available reef habitat. It may well be that species presently considered as diffusive have locations of high local abundance yet to be discovered. Two examples are the widespread Caulastrea tumida and Echinomorpha nishihirai. C. tumida was recorded from 10 ERs, with a mean OA score of 4.21 (Table S2). In eight ERs it was uncommon or rare (OA between 0.63 and 9.28), and in one ER it was common (Sunda Shelf, OA 22.33). E. nishihirai was recorded from nine ERs, with a mean OA score of 5.12 (Table S2). In eight ERs it was uncommon or rare (OA between 0.65 and 7.22), and in one ER it was common (Fiji, OA 28.26).
Other apparently rare species were described long ago but were not recorded during our surveys. For example, Simplastrea vesicularis and Boninastrea boninensis were not found, despite considerable search effort within their known distribution ranges [2]. These species are either exceedingly rare, highly cryptic or occur in habitats not well sampled (inner reef flats, reef slopes > 40 m depth). Both species were described from ERs (Java Sea and Bonin Islands respectively) not sampled during the present study, and may be geo-suffusive, although both have been found elsewhere, albeit rarely [1]. Hence, although we are confident that our method records most reef-building coral species present at site and ecoregion levels (Figure 2), some species were not found in ERs where they were found in prior studies, including initial taxonomic descriptions.
This is a function of sampling effort, which was not equal across ERs (Table 1), detectability and rarity. For sampling effort, even our most comprehensive surveys covered only a tiny fraction of available reef habitat (<< 0.001%). Detectability is influenced by inter-specific differences in morphological “plasticity”, with some species showing little variation across their ranges (e.g., Diploastrea heliopora) while others are remarkably “protean” or cryptic, closely resembling sibling taxa in phenotypic expression (e.g., many species of Acropora). With colleagues, we have recently categorized species based on their ease and reliability of identification, and some species recorded here are considered difficult, and hence their abundance estimates are not considered reliable (Table S1).
4.4. Centres of Abundance
Many, if not all, coral species have centres of abundance within their meta-populations - particular locations hosting significant sub-populations, likely crucial for maintenance and replenishment. Conversely, other ERs within a species’ range hosted only sparse sub-populations (Figure 11 and Table S2), in some cases only a single record. In the latter locations, such species may not achieve effective population sizes, their presence being dependent on the vagaries of long-distance dispersal.
We have identified such contemporary centres of abundance and rarity for numerous IWP species during a period of significant ecological change. Of the three examples illustrated in Figure 11, Porites rus and Diploastrea heliopora had similar overall patterns of distribution, yet D. heliopora was uncommon to rare in the Red Sea and NW Indian Ocean, whereas P. rus was abundant in the northern Red Sea, one of several major centres of abundance for this species. Physogyra lichtensteini has both a more restricted IWP distribution range and lower OA scores across most of its range, with contemporary centres of abundance in the Andaman Sea and Cenderawasih Bay.
Such centres have shifted, and presumably will continue to shift, through ecological and geological time, in an analogous, although not necessarily similar, way to centres of diversity [80]. For example, studies combining contemporary surveys of coral communities with shallow reef coring have demonstrated significant changes in community structure on decadal to millennial time scales [81], the result of differential survivorship and recovery following disturbance.
4.5. Refugia
It is not likely, however, that there will be significant shifts into more temperate regions in response to global warming, given the latitude-limiting effects of light, among other factors [82,83,84,85]. This is not to discount the present increase in richness at latitudinal edges of reef development and in non-accretional coral communities, including Moreton Bay ER, where our tally of 114 species is a major increase on previous surveys [69]. Rather it is to recognize the latitudinal limits to reef growth [18,84].
There has been considerable recent discussion over the role that depth may play in providing refuge for corals from high sea temperatures and other disturbances [79,86]. During the period of our study, highest coral abundances occurred in shallow sites (Figure 6B). This will likely change in coming decades, with increasing disturbance focused on shallow reef habitat causing loss of corals and their replacement by other taxonomic groups, particularly algae. Most common IWP reef-building corals have a broad tolerance for different ambient environmental conditions, their populations extending from shallow reef slopes to the upper mesophotic zone. Of the 672 species surveyed here 622 spp. occurred in both deep and shallow sites.
This apparent lack of niche-specialization is one reason for the application of neutral theory to coral reefs [87,88]. Yet even among these tolerant taxa, most had greater abundances either on shallow or deeper reef slopes. Of these species, more than twice as many exhibited apparent preference for deeper rather than shallow sites, suggesting that preferred habitat for most IWP coral species is the mid to lower reef slope, below 10 m depth. Even among the 90 species that did not show strong depth preferences, 54 species were more common in deeper than shallower sites (Table S2). In 50 species, these depth preferences are sufficiently strong to be considered a form of niche specialization (Table 4). Species with strong preferences for shallow habitats, such as Acropora aspera, A. digitifera and A. spathulata (Table S2), may be at particular risk from predicted future change, given that the impact of disturbance, including coral bleaching from elevated sea temperatures or other stressors (e.g., freshwater influx), is often most severe in shallow waters. Mitigating against such risk is the inherent phenotypic and genotypic capacity of such species to acclimate and/or adapt, contingent in part on the complex relation between the coral host, zooxanthellae and other symbionts.
4.6. Species Vulnerability
Several recent analyses, using markedly different approaches, have assessed coral vulnerability at global [19,21,22,89] and regional scales ([17]—western Indian Ocean; [20]—Caribbean Sea; [23]—Marshall Islands). Given the continuing predicted decline in area, extent and/or quality of reef habitat globally [16,19,90], some 40 species could potentially qualify in an IUCN Threatened category (Table 7), under the Red List geographic range criterion (extent of occurrence or area of occupancy). This criterion requires a species to be known to exist at no more than five locations.
Qualification under IUCN criteria of small geographic range and small and reducing population size is, however, contingent on the assumption that there are no unsampled populations. Clearly this is a difficult, if not impossible, criterion to meet for reef-building corals. Indeed, the general utility of these criteria for corals is limited by several important caveats:
- our surveys, or indeed any work to date, have not sampled the entire ranges of many species, not even the main distribution ranges of some, with the most accurate and up-to-date compilation of such data being shown in the distribution maps of “Corals of the World” [1].
- most corals have the potential for widespread dispersal as planktonic larvae or via rafting [75] on the decadal time scales relevant to assessing extinction risk, both within and among ecoregions.
- some species prefer habitats not well sampled, by us or others, including the mesophotic zone (e.g., Craterastrea levis) or deep sandy areas (e.g., Heterocyathus aequicostatus and Heteropsammia cochlea), or live cryptically under boulders on shallow reef flats (e.g., Stylaraea punctata), limiting assessment of their true abundance.
These limitations may become of less concern, however, as the spatial and temporal scales of disturbances continue to increase throughout this century, with expected concomitant reductions in ranges, as suggested by projections of future habitat marginalization [16,90]. These studies found that suitable habitat will become increasingly restricted, from the combined effects of high sea temperatures and acidification (among other impacts) by mid-21st century. This will test the inherent capacities of different coral species for acclimation and adaptation, in respect of their life histories, notably physiological tolerances and flexibility in symbiosis.
Some of the rarest corals in this study (Table 7) also qualified as highly vulnerable to future climate change impacts, using a traits-based approach, and incorporating habitat marginalization under various scenarios of bleaching and acidification [22]. That study found that up to 253 species were highly vulnerable, 73 species of which are listed in threatened categories on the IUCN Red List. Conversely, up to 150 coral species could qualify as “potential adapters”. These do not have the high sensitivity and low adaptability traits that, in combination, could otherwise render them highly vulnerable [22].
For most species, increasing disturbance will likely reduce sub-population connectivity, increasing isolation and risk of local extinction. A regional analysis of the Marshall Islands [23] used IUCN Red List criterion (VU D2). In this criterion, a population is considered vulnerable if it is very restricted in the number of locations (typically five or fewer) such that it is prone to the effects of human activities or stochastic events within a very short time period in an uncertain future. As these authors noted, this criterion can be employed at regional scales provided that the population to be assessed is isolated from conspecific populations. Notably, only one of the species identified as regionally vulnerable from the Marshall Islands (Acropora bushyensis) qualified as potentially threatened in our broader scale study under VU D2, contrasting with its Least Concern ranking in the IUCN Red List assessment [19]. As shown herein, many coral species have pronounced centres of abundance, whilst otherwise being uncommon or rare across much of their distribution ranges, an important consideration when applying IUCN geographic range criteria.
In the initial Red List assessment, approximately half of the species listed in Table 7 fulfilled threatened species criteria [19]. Some, the geo-suffusive taxa, have restricted distributions, all are rare, and all are predicted to suffer major loss of suitable habitat in coming decades [16,19,90]. A case in point, Euphyllia baliensis, is a highly distinctive species discovered during this study (Figure 11B). It is only known from the type locality, which is threatened by development proposals including sand mining and a port. The corollary, that more widespread and abundant species are less at risk, at least to regional impacts, is also true, as reflected in the IUCN rankings of Least Concern or Near Threatened for the most abundant and widespread corals (Table 5).
Yet there are increasingly important exceptions that may well override these criteria in respect to corals. These include epidemic disease outbreaks in otherwise non-threatened species, or other global impacts at meta-population scales [91]. Density-independent effects of global changes to sea temperature and ocean chemistry that cause physiological stress and resultant mortality across the meta-population can decouple stock abundance from recruitment. This may induce a downward spiral in reproductive rates, even in the most widespread and abundant taxa [91]. This is a pertinent warning as sea temperatures continue to warm and oceans acidify and become increasingly depleted of oxygen, with a concomitant increase in diseases [92]. Any major reductions in population sizes and reproductive output will limit the capacity for dispersal in and among heavily impacted reef tracts. In this situation, the approach [23] of assessing vulnerability at regional scale clearly holds merit.
4.7. Extinction Risk
There is little argument that corals, and the reefs they build, continue to decline, even in managed marine protected areas [5,13,14,15,16,18]. Both proximate and ultimate causes for the declines are well understood, and include a wide array of local, regional and global impacts, some acting in synergy, some antagonistic (see e.g., [92,93,94]). Coral species, and indeed individual populations and sub-populations, vary in their specific response(s) to impact. At present, we know little of this intra- and interspecific variability, resistance and resilience. Nor do we have any clear indication of the meta-population sizes required for each species to meet these impacts.
Yet the Scleractinia as an Order has a long evolutionary history dating some 200 million years, having successfully survived several of earth’s mass extinctions. It seems probable that future extinctions will differ among species groups and regions, at least initially [17,20,21,22]. A pertinent example is provided by the relatively high levels of endemism and long evolutionary history of some geo-suffusive western Indian Ocean corals [4]. Several Arabian and western Indian Ocean endemics, including Sclerophyllia maxima, Montipora saudii, Horastrea indica, Fungia puishani and Stylophora madagascarensis, ranked among the rarest of corals in this study (Table 7), and must be considered at particular risk. Another suite of very rare species is, as far as is known, endemic to particular ERs within the CT. These include the aforementioned Acropora suharsonoi and Euphyllia baliensis (Lesser Sunda Islands and Savu Shelf) and Astreopora acroporina, A. cenderawasih, and A. montiporina from Cenderawasih Bay (Table S2). All have very small populations and must be considered particularly vulnerable.
Extinctions of the most evolutionarily distinct corals, exemplified by the monotypic genera, will also increase the loss of evolutionary diversity [21]. In the present study, this risk is demonstrated by the apparent rarity of the monotypic Duncanopsammia axifuga and Horastrea indica (Table 7), or indeed by Simplastrea vesicularis or Boninastrea boninensis, neither of which was recorded. Concern over some other evolutionary distinctive taxa, such as Diploastrea heliopora [17,41], is however alleviated to some degree by their higher OA score, and their widespread centres of abundance in different regions (Figure 11A). D. heliopora has a long evolutionary history dating to the Oligocene [2], is tolerant of a wide variety of disturbances, with life history traits [22], including reproductive mode, that presumably provide it with a level of evolutionary “insurance against extinction” that is greater than some other taxa. And yet our present understanding of the roles that different life histories will play in influencing coral demography and hence vulnerability under changing environmental conditions in coming decades remains rudimentary.
In conclusion, this study provides an overview and baseline (albeit a shifted one), of the richness and abundance of reef-building corals on increasingly endangered IWP reef systems at the end of the 20th and beginning of the 21st century. This should contribute to future sub- and meta-population analyses examining vulnerability, resistance and resilience of species to disturbance. Future collaborative work will also address potential refugia, including the upper mesophotic zone, relations among abundance, range size and life history traits, alpha, beta and gamma diversity and community assembly. Together, it is hoped these will inform appropriate policy and contribute to successful conservation action.
Supplementary Materials
The following are available online at www.mdpi.com/1424-2818/9/3/25/s1: Table S1: Species with taxonomic issues; Table S2: Species abundance summary; Table S3. Effects of depth on richness and abundance; Table S4. Comparison of the Overall Abundance (OA) ranking of the 30 most abundant IWP corals in various NW and SW Pacific ERs and areas.
Acknowledgments
Firstly, we thank Charlie Veron for his long-standing, continuing contribution to the science and conservation of reef-building corals. This work—its taxonomy and biogeographic basis—would simply not otherwise be possible. We also gratefully acknowledge Carden Wallace for her taxonomic expertise and help over many years in dealing with numerous challenging specimens of Acropora, among other taxa. Mary Stafford-Smith provided very thoughtful suggestions and technical expertise across a range of data and other issues. Terry Done, another valued colleague, was instrumental in the development of the field method used here, and for collecting some of the data from the GBR, along with Mary Wakeford. Similarly, Denise McCorry collected some of the data from Hong Kong. Douglas Fenner and Peter Houk kindly provided their unpublished estimates of relative abundance from American Samoa and Kosrae respectively. Suharsono and Erdi Lazuardi, among many others, provided valued assistance in Indonesia, as did Malek Abdul-Aziz and Khaled Al Hariri in the Yemen, and Vo Si Tuan, Phan Kim Hoang and team in Vietnam. Mark Erdmann kindly brought interesting specimens and/or photographs from the mesophotic zone on some surveys. We also thank Tom Bridge for providing estimates of reef area in each ER. Terry Done, Rob van Woesik, three anonymous reviewers and the Academic Editor Rupert Ormond provided very useful comments on earlier versions of this manuscript.
This work, spanning some 25 years of field research and 8000 h of diving, has been supported over the years by numerous governments, organizations and individuals. These include: the Australian Institute of Marine Science, Museum of Tropical Queensland and University of Queensland in Australia; Conservation International and The Nature Conservancy in many locations including Madagascar, Indonesia, Philippines, Papua New Guinea, Palau and the Federated States of Micronesia and Solomon Islands; the National Commission for Wildlife Conservation and Development and Japanese International Cooperation Agency in Saudi Arabia; United Nations Development Program and Environmental Protection Authority in Yemen; The International Union for Conservation of Nature, World Wildlife Fund and Ministry of Fisheries in Vietnam; IUCN in the Philippines; The Fisheries Department in Brunei Darussalam; The Agriculture, Fisheries and Conservation Department in Hong Kong; and the University of the South Pacific in Fiji. The dataset that informed the results presented here, along with other components, including species’ size frequency and injury estimates, will form the basis of abundance mapping and analyses, including vulnerability assessments, on the open access website www.coralsoftheworld.org. This website is currently under development by Charlie Veron, Mary Stafford-Smith and ourselves, with technical assistance from Gaia Resources.
Author contributions
L.D. and E.T. conceived, designed and conducted the surveys that form the basis of this study; both also analyzed the data; and wrote the paper.
Conflicts of Interest
The authors declare no conflict of interest.
References
- Veron, J.E.N.; Stafford-Smith, M.G.; Turak, E.; DeVantier, L.M. Corals of the World; Version 0.01 Beta. Available online: http://www.coralsoftheworld.org (accessed on 11 April 2017).
- Veron, J.E.N. Corals of the World; Australian Institute of Marine Science: Townsville, Australia, 2000; Volume 3, p. 1410.
- Veron, J.E.N.; Stafford-Smith, M.G.; DeVantier, L.M.; Turak, E. Overview of distribution patterns of zooxanthellate Scleractinia. Front. Mar. Sci. 2015, 1, 81. [Google Scholar] [CrossRef]
- Obura, D.O. An Indian Ocean centre of origin revisited: Palaeogene and Neogene influences defining a biogeographic realm. J. Biogeogr. 2015, 43, 229–242. [Google Scholar] [CrossRef]
- Ginsburg, R.N.; Smith, F.G.W. Proceedings of the colloquium on global aspects of coral reefs: Health, hazards, and history, June 1993. Oceanogr. Lit. Rev. 1995, 42, 673. [Google Scholar]
- Jackson, J.B.C. Reefs since Columbus. Coral Reefs 1997, 16, S23–S32. [Google Scholar] [CrossRef]
- Birkeland, C.; Randall, R.S.; Amesbury, S.S. Coral and Coral-Fish Assessment of the Fagatele Bay National Marine Sanctuary; Report to the National Oceanographic and Atmospheric Administration; US Department of Commerce: Washington, DC, USA, 1994; p. 126.
- Done, T.J.; Turak, E.; Wakeford, M.; DeVantier, L.M.; McDonald, A.; Fisk, D. Decadal changes in turbid-water coral communities at Pandora Reef: Loss of resilience or too soon to tell? Coral Reefs 2007, 26, 789–805. [Google Scholar] [CrossRef]
- Loya, Y. Changes in a Red Sea coral community structure: A long-term case history study. In The Earth in Transition: Patterns and Processes of Biotic Impoverishment; Woodwell, G.M., Ed.; Cambridge University Press: Cambridge, UK, 1990; pp. 369–384. [Google Scholar]
- Connell, J.H.; Hughes, T.P.; Wallace, C.C. A 30-year study of coral abundance, recruitment, and disturbance at several scales in space and time. Ecol. Monogr. 1997, 67, 461–488. [Google Scholar] [CrossRef]
- Global Coral Reef Monitoring Network. Available online: http://www.icriforum.org/gcrmn (accessed on 13 June 2017).
- Ninio, R.; Meekan, M. Spatial patterns in benthic communities and the dynamics of a mosaic ecosystem on the Great Barrier Reef, Australia. Coral Reefs 2002, 21, 95–104. [Google Scholar] [CrossRef]
- De’ath, G.; Fabricius, K.E.; Sweatman, H.; Puotinen, M. The 27–year decline of coral cover on the Great Barrier Reef and its causes. Proc. Natl. Acad. Sci. USA 2012, 109, 17995–17999. [Google Scholar] [CrossRef] [PubMed]
- Gardner, T.A.; Côté, I.M.; Gill, J.A.; Grant, A.; Watkinson, A.R. Long-term region-wide declines in Caribbean corals. Science 2003, 301, 958–960. [Google Scholar] [CrossRef] [PubMed]
- Bruno, J.F.; Selig, E.R. Regional decline of coral cover in the Indo-Pacific: Timing, extent, and subregional comparisons. PLoS ONE 2007, 2, e711. [Google Scholar] [CrossRef] [PubMed]
- Hoegh-Guldberg, O.; Mumby, P.J.; Hooten, A.J.; Steneck, R.S.; Greenfield, P.; Gomez, E.; Harvell, C.D.; Sale, P.F.; Edwards, A.J.; Caldeira, K.; et al. Coral reefs under rapid climate change and ocean acidification. Science 2007, 318, 1737–1742. [Google Scholar] [CrossRef] [PubMed]
- McClanahan, T.; Ateweberhan, M.; Graham, N.; Wilson, S.; Sebastian, C.; Guillaume, M.M.; Bruggemann, J. Western Indian Ocean coral communities: Bleaching responses and susceptibility to extinction. Mar. Ecol. Prog. Ser. 2007, 337, 1–13. [Google Scholar] [CrossRef]
- Veron, J.E.N. A Reef in Time: The Great Barrier Reef from Beginning to End; Harvard University Press: Cambridge, MA, USA, 2008; p. 289. [Google Scholar]
- Carpenter, K.E.; Abrar, M.; Aeby, G.; Aronson, R.B.; Banks, S.; Bruckner, A.; Chiriboga, A.; Cortés, J.; Delbeek, J.C.; DeVantier, L.; et al. One-third of reef-building corals face elevated extinction risk from climate change and local impacts. Science 2008, 321, 560–563. [Google Scholar] [CrossRef] [PubMed]
- Van Woesik, R.; Franklin, E.C.; O’Leary, J.; McClanahan, T.R.; Klaus, J.S.; Budd, A.F. Hosts of the Plio-Pleistocene past reflect modern-day coral vulnerability. Proc. R. Soc. B Biol. Sci. 2012, 279, 2448–2456. [Google Scholar] [CrossRef] [PubMed]
- Huang, D. Threatened reef corals of the world. PLoS ONE 2012, 7, e34459. [Google Scholar] [CrossRef] [PubMed]
- Foden, W.B.; Butchart, S.H.M.; Stuart, S.N.; Vié, J.-C.; Akçakaya, H.R.; Angulo, A.; DeVantier, L.M.; Gutsche, A.; Turak, E.; Cao, L.; et al. Identifying the world’s most climate change vulnerable species: A systematic trait-based assessment of all birds, amphibians and corals. PLoS ONE 2013, 8, e65427. [Google Scholar] [CrossRef] [PubMed]
- Richards, Z.; Beger, M. Regional conservation status of scleractinian coral biodiversity in the Republic of the Marshall Islands. Diversity 2013, 5, 522–540. [Google Scholar] [CrossRef]
- Done, T.J. Patterns in the distribution of coral communities across the central Great Barrier Reef. Coral Reefs 1982, 1, 95–107. [Google Scholar] [CrossRef]
- Veron, J.E.N. Corals of Australia and the Indo-Pacific; Hawaii University Press: Honolulu, HI, USA, 1986; p. 642. [Google Scholar]
- DeVantier, L.M.; De’Ath, G.; Done, T.J.; Turak, E. Ecological assessment of a complex natural system: A case study from the Great Barrier Reef. Ecol. Appl. 1998, 8, 480–496. [Google Scholar] [CrossRef]
- DeVantier, L.; De’ath, G.; Klaus, R.; Al-Moghrabi, S.; Abdulaziz, M.; Reinicke, G.B.; Cheung, C. Reef-building corals and coral communities of the Socotra Archipelago, a zoogeographic ‘crossroads’ in the Arabian Sea. Fauna Arab. 2004, 20, 117–168. [Google Scholar]
- DeVantier, L.M.; De’ath, G.; Turak, E.; Done, T.J.; Fabricius, K. Species richness and community structure of reef-building corals on the nearshore Great Barrier Reef. Coral Reefs 2006, 25, 329–340. [Google Scholar] [CrossRef]
- DeVantier, L.M.; Turak, E.; Skelton, P. Ecological Assessment of the Coral Communities of Bunaken National Park: Indicators of Management Effectiveness. In Proceedings of the 10th International Coral Reef Symposium, Naha, Okinawa, Japan, 28 June–2 July 2004; Suzuki, Y., Nakamori, T., Hidaka, M., Kayanne, H., Casareto, B.E., Nadaoka, K., Yamano, H., Tsuchiya, M., Eds.; Japanese Coral Reef Society: Okinawa, Japan, 2005; pp. 175–187. [Google Scholar]
- Karlson, R.H.; Cornell, H.V.; Hughes, T.P. Coral communities are regionally enriched along an oceanic biodiversity gradient. Nature 2004, 429, 867–870. [Google Scholar] [CrossRef] [PubMed]
- Turak, E.; Brodie, J.; DeVantier, L. Reef-building corals and coral communities of the Yemen Red Sea. Fauna Arab. 2007, 23, 1–40. [Google Scholar]
- Cornell, H.V.; Karlson, R.H.; Hughes, T.P. Local-regional species richness relationships are linear at very small to large scales in west-central Pacific corals. Coral Reefs 2008, 27, 145–151. [Google Scholar] [CrossRef]
- Richards, Z.T.; van Oppen, M.J.H.; Wallace, C.C.; Willis, B.L.; Miller, D.J. Some rare Indo-Pacific coral species are probable hybrids. PLoS ONE 2008, 3, e3240. [Google Scholar] [CrossRef] [PubMed]
- Done, T.J.; DeVantier, L.M.; Turak, E.; Fisk, D.A.; Wakeford, M.; van Woesik, R. Coral growth on three reefs: Development of recovery benchmarks using a space for time approach. Coral Reefs 2010, 29, 815–833. [Google Scholar] [CrossRef]
- Fenner, D.P. Reef Corals of the Eastern Lagoon (Touho-Ponerihouen) of Grande-Terre, New Caledonia; Conservation International: Arlington, VA, USA, 2013; pp. 141–160. [Google Scholar]
- Jackson, J.; Donovan, M.; Cramer, K.; Lam, V. Status and Trends of Caribbean Coral Reefs; Global Coral Reef Monitoring Network, IUCN: Gland, Switzerland, 2014; p. 304. [Google Scholar]
- Veron, J.E.N.; Devantier, L.M.; Turak, E.; Green, A.L.; Kininmonth, S.; Stafford-Smith, M.; Peterson, N. Delineating the coral triangle. Galaxea 2009, 11, 91–100. [Google Scholar] [CrossRef]
- Briggs, J.C. Coral reefs: Conserving the evolutionary sources. Biol. Conserv. 2005, 126, 297–305. [Google Scholar] [CrossRef]
- Allen, G.R. Conservation hotspots of biodiversity and endemism for Indo-Pacific coral reef fishes. Aquat. Conserv. Mar. Freshw. Ecosyst. 2008, 18, 541–556. [Google Scholar] [CrossRef]
- Hoeksema, B.W. Delineation of the Indo-Malayan centre of maximum marine biodiversity: The Coral Triangle. In Biogeography, Time, and Place: Distributions, Barriers, and Islands; Renema, W., Ed.; Springer: Dodrecht, The Netherlands, 2007; Volume 29, pp. 117–178. [Google Scholar]
- Wilkinson, C.; Linden, O.; Cesar, H.; Hodgson, G.; Rubens, J.; Strong, A.E. Ecological and socioeconomic impacts of 1998 coral mortality in the Indian Ocean: An ENSO impact and a warning of future change? Ambio 1999, 28, 188–196. [Google Scholar]
- Veron, J.E.N.; Pichon, M. Scleractinia of Eastern Australia. Part I. Families Thamnasteriidae, Astrocoeniidae, Pocilloporidae; Australian Institute of Marine Science: Townsville, Australia, 1976; Volume 1, pp. 1–86.
- Veron, J.E.N.; Pichon, M.; Wijsman-Best, M. Scleractinia of Eastern Australia. Part II. Families Faviidae, Trachyphylliidae; Australian Institute of Marine Science: Townsville, Australia, 1977; Volume 3, pp. 1–233.
- Veron, J.E.N.; Pichon, M. Scleractinia of Eastern Australia. Part III. Families Agariciidae, Siderastreidae, Fungiidae, Oculinidae, Merulinidae, Mussidae, Pectiniidae, Caryophylliidae, Dendrophylliidae; Australian Institute of Marine Science: Townsville, Australia, 1980; Volume 4, pp. 1–422.
- Veron, J.E.N.; Pichon, M. Scleractinia of Eastern Australia. Part IV. Family Poritidae; Australian Institute of Marine Science: Townsville, Australia, 1982; Volume 5, pp. 1–159.
- Veron, J.E.N.; Wallace, C. Scleractinia of Eastern Australia. Part V. Family Acroporidae; Australian Institute of Marine Science: Townsville, Australia, 1984; Volume 6, pp. 1–485.
- Best, M.B.; Hoeksema, B.W.; Moka, W.; Moll, H.; Sutarna, I.N. Recent scleractinian coral species collected during the Snellius-II expedition in Eastern Indonesia. Neth. J. Sea Res. 1989, 23, 107–115. [Google Scholar] [CrossRef]
- Hoeksema, B.W. Taxonomy, phylogeny and biogeography of mushroom corals (Scleractinia: Fungiidae). Zool. Verh. 1989, 254, 1–295. [Google Scholar]
- Sheppard, C.R.; Sheppard, A.L. Corals and coral communities of Arabia. Fauna Arab. 1991, 12, 1–170. [Google Scholar]
- Wallace, C.C.; Wolstenholme, J. Revision of the coral genus Acropora (Scleractinia: Astrocoeniina: Acroporidae) in Indonesia. Zool. J. Linn. Soc. 1998, 123, 199–384. [Google Scholar] [CrossRef]
- Wallace, C.C. Staghorn Corals of the World. A Revision of the Genus Acropora; CSIRO Publishing: Collingwood, Australia, 1999; p. 422. [Google Scholar]
- Veron, J.E.N.; Stafford-Smith, M.G. Coral ID; Australian Institute of Marine Science: Townsville, Australia, 2002.
- Benzoni, F.; Stefani, F.; Pichon, M.; Galli, P. The name game: Morpho-molecular species boundaries in the genus Psammocora (Cnidaria, Scleractinia). Zool. J. Linn. Soc. 2010, 160, 421–456. [Google Scholar] [CrossRef]
- Turak, E.; DeVantier, L. Field Guide to Reef-Building Corals of Brunei Darussalam; Ministry of Industry and Primary Resources: Bandar Seri Begawan, Brunei Darussalam, 2011; p. 256.
- Huang, D.; Benzoni, F.; Arrigoni, R.; Baird, A.H.; Berumen, M.L.; Bouwmeester, J.; Chou, L.M.; Fukami, H.; Licuanan, W.Y.; Lovell, E.R. Towards a phylogenetic classification of reef corals: The Indo-Pacific genera Merulina, Goniastrea and Scapophyllia (Scleractinia, Merulinidae). Zool. Scr. 2014, 43, 531–548. [Google Scholar] [CrossRef]
- Van der Maarel, E. Transformation of cover-abundance values in phytosociology and its effects on community similarity. In Data-Processing in Phytosociology: Report on the Activities of the Working-Group for Data-Processing in Phytosociology of the International Society for Vegetation Science, 1969–1978; van der Maarel, E., Orlóci, L., Pignatti, S., Eds.; Springer Netherlands: Dordrecht, The Netherlands, 1980; pp. 133–150. [Google Scholar]
- Barkman, J.J.; Doing, H.; Segal, S. Kritische Bemerkungen und Vorschläge zur Quantitativen Vegetationsanalyse. Acta Bot. Neerlandica 1964, 13, 394–419. [Google Scholar] [CrossRef]
- Jongman, R.H.G.; ter Braak, C.J.F.; van Tongereren, O.F.R. Data Analysis in Community and Landscape Ecology; Cambridge University Press: Cambridge, UK, 1995. [Google Scholar]
- Wallace, C.C.; Turak, E.; DeVantier, L. Novel characters in a conservative coral genus: Three new species of Astreopora (Scleractinia: Acroporidae) from West Papua. J. Nat. Hist. 2011, 45, 1905–1924. [Google Scholar] [CrossRef]
- Turak, E.; DeVantier, L.M.; Erdmann, M. Euphyllia baliensis sp. nov. (Cnidaria: Anthozoa: Scleractinia: Euphyllidae): A new species of reef coral from Indonesia. Zootaxa 2012, 3422, 52–61. [Google Scholar]
- Fukami, H.; Chen, C.A.; Budd, A.F.; Collins, A.; Wallace, C.; Chuang, Y.-Y.; Chen, C.; Dai, C.-F.; Iwao, K.; Sheppard, C. Mitochondrial and nuclear genes suggest that stony corals are monophyletic but most families of stony corals are not (Order Scleractinia, Class Anthozoa, Phylum Cnidaria). PLoS ONE 2008, 3, e3222. [Google Scholar] [CrossRef] [PubMed]
- Benzoni, F.; Stefani, F.; Stolarski, J.; Pichon, M.; Mitta, G.; Galli, P. Debating phylogenetic relationships of the scleractinian Psammocora: Molecular and morphological evidences. Contrib. Zool. 2007, 76, 35–54. [Google Scholar]
- Schmidt-Roach, S.; Lundgren, P.; Miller, K.J.; Gerlach, G.; Noreen, A.M.; Andreakis, N. Assessing hidden species diversity in the coral Pocillopora damicornis from eastern Australia. Coral Reefs 2013, 32, 161–172. [Google Scholar] [CrossRef]
- Benzoni, F.; Arrigoni, R.; Stefani, F.; Reijnen, B.T.; Montano, S. Phylogenetic position and taxonomy of Cycloseris explanulata and C. wellsi (Scleractinia: Fungiidae): Lost mushroom corals find their way home. Contrib. Zool. 2012, 81, 125–146. [Google Scholar]
- Budd, A.F.; Fukami, H.; Smith, N.D.; Knowlton, N. Taxonomic classification of the reef coral family Mussidae (Cnidaria: Anthozoa: Scleractinia). Zool. J. Linn. Soc. 2012, 166, 465–529. [Google Scholar] [CrossRef]
- Veron, J.E.N. Overview of the taxonomy of zooxanthellate Scleractinia. Zool. J. Linn. Soc. 2013, 169, 485–508. [Google Scholar] [CrossRef] [PubMed]
- Potts, D.C.; Done, T.J.; Isdale, P.J.; Fisk, D.A. Dominance of a coral community by the genus Porites (Scleractinia). Mar. Ecol. Prog Ser. 1985, 23, 79–84. [Google Scholar] [CrossRef]
- Colwell, R.K. EstimateS: Statistical Estimation of Species Richness and Shared Species from Samples. Available online: http://purl.oclc.org/estimates (accessed on 4 May 2017).
- DeVantier, L.; Williamson, D.; Willan, R. Coastal Marine Biodiversity of the Sunshine Coast, South-East Queensland: Inventory of Corals, Fishes and Molluscs July 2010; Baseline Survey Report to the Noosa Integrated Catchment Association: Tewantin, Australia, 2010; pp. 1–111. [Google Scholar]
- IUCN. The IUCN Red List of Threatened Species. Available online: http://www.iucnredlist.org/technical-documents/categories-and-criteria/2001-categories-criteria (accessed on 12 April 2017).
- Head, S.M. An undescribed species of Merulina and a new genus and species of siderastreid coral from the Red Sea. J. Nat. Hist. 1983, 17, 419–435. [Google Scholar] [CrossRef]
- Benzoni, F.; Arrigoni, R.; Stefani, F.; Stolarski, J. Systematics of the coral genus Craterastrea (Cnidaria, Anthozoa, Scleractinia) and description of a new family through combined morphological and molecular analyses. Syst. Biodiver. 2012, 10, 417–433. [Google Scholar] [CrossRef]
- Connolly, S.R.; Hughes, T.P.; Bellwood, D.R.; Karlson, R.H. Community structure of corals and reef fishes at multiple scales. Science 2005, 309, 1363–1365. [Google Scholar] [CrossRef] [PubMed]
- Evans, S.M.; McKenna, C.; Simpson, S.D.; Tournois, J.; Genner, M.J. Patterns of species range evolution in Indo-Pacific reef assemblages reveal the Coral Triangle as a net source of transoceanic diversity. Biol. Lett. 2016, 12. [Google Scholar] [CrossRef] [PubMed]
- Harrison, P.; Wallace, C. Reproduction, dispersal and recruitment of scleractinian corals. Ecosyst. World 1990, 25, 133–207. [Google Scholar]
- Babcock, R.C. Comparative demography of three species of scleractinian corals using age- and size-dependent classifications. Ecol. Monogr. 1991, 61, 225–244. [Google Scholar] [CrossRef]
- LaJeunesse, T.; Bhagooli, R.; Hidaka, M.; DeVantier, L.M.; Done, T.J.; Schmidt, G.W.; Fitt, W.K.; Hoegh-Guldberg, O. Closely related Symbiodinium spp. differ in relative dominance in coral reef host communities across environmental, latitudinal and biogeographic gradients. Mar. Ecol. Progr. Ser. 2004, 284, 147–161. [Google Scholar] [CrossRef]
- Anthony, K.R.N.; Fabricius, K.E. Shifting roles of heterotrophy and autotrophy in coral energetics under varying turbidity. J. Exp. Mar. Biol. Ecol. 2000, 252, 221–253. [Google Scholar] [CrossRef]
- Bridge, T.C.L.; Fabricius, K.E.; Bongaerts, P.; Wallace, C.C.; Muir, P.R.; Done, T.J.; Webster, J.M. Diversity of Scleractinia and Octocorallia in the mesophotic zone of the Great Barrier Reef, Australia. Coral Reefs 2012, 31, 179–189. [Google Scholar] [CrossRef]
- Renema, W.; Bellwood, D.R.; Braga, J.C.; Bromfield, K.; Hall, R.; Johnson, K.G.; Lunt, P.; Meyer, C.P.; McMonagle, L.B.; Morley, R.J.; et al. Hopping hotspots: Global shifts in marine biodiversity. Science 2008, 321, 654–657. [Google Scholar] [CrossRef] [PubMed]
- Aronson, R.B.; Precht, W.F.; Macintyre, I.G. Extrinsic control of species replacement on a Holocene reef in Belize: The role of coral disease. Coral Reefs 1998, 17, 223–230. [Google Scholar] [CrossRef]
- Cacciapaglia, C.; van Woesik, R. Reef-coral refugia in a rapidly changing ocean. Glob. Chang. Biol. 2015, 21, 2272–2282. [Google Scholar] [CrossRef] [PubMed]
- Van Hooidonk, R.; Maynard, J.A.; Planes, S. Temporary refugia for coral reefs in a warming world. Nat. Clim. Chang. 2013, 3, 508–511. [Google Scholar] [CrossRef]
- Kleypas, J.A. Modeled estimates of global reef habitat and carbonate production since the Last Glacial Maximum. Paleoceanography 1997, 12, 533–545. [Google Scholar] [CrossRef]
- Muir, P.R.; Wallace, C.C.; Done, T.J.; Aguirre, J.D. Limited scope for latitudinal extension of reef corals. Science 2015, 348, 1135–1138. [Google Scholar] [CrossRef] [PubMed]
- Van Oppen, M.J.H.; Bongaerts, P.I.M.; Underwood, J.N.; Peplow, L.M.; Cooper, T.F. The role of deep reefs in shallow reef recovery: An assessment of vertical connectivity in a brooding coral from west and east Australia. Mol. Ecol. 2011, 20, 1647–1660. [Google Scholar] [CrossRef] [PubMed]
- Hubbell, S.P. A unified theory of biogeography and relative species abundance and its application to tropical rain forests and coral reefs. Coral Reefs 1997, 16, S9–S21. [Google Scholar] [CrossRef]
- Rosindell, J.; Hubbell, S.P.; Etienne, R.S. The Unified Neutral Theory of Biodiversity and Biogeography at Age Ten. Trends Ecol. Evol. 2011, 26, 340–348. [Google Scholar] [CrossRef] [PubMed]
- Brainard, R.E.; Birkeland, C.; Eakin, C.M.; McElhany, P.; Miller, M.W.; Patterson, M.; Piniak, G.A. Status Review Report of 82 Candidate Coral Species Petitioned Under the U.S. Endangered Species Act; NOAA Technical Memorandum, NOAA-TM-NMFS-PIFSC-27; National Oceanic and Atmospheric Administration: Washington, DC, USA, 2011; pp. 530, A-1.
- Guinotte, J.M.; Buddemeier, R.W.; Kleypas, J.A. Future coral reef habitat marginality: Temporal and spatial effects of climate change in the Pacific basin. Coral Reefs 2003, 22, 551–558. [Google Scholar] [CrossRef]
- Birkeland, C.; Miller, M.W.; Piniak, G.A.; Eakin, C.M.; Weijerman, M.; McElhany, P.; Dunlap, M.; Brainard, R.E. Safety in numbers? Abundance may not safeguard corals from increasing carbon dioxide. BioScience 2013, 63, 967–974. [Google Scholar]
- Maynard, J.; van Hooidonk, R.; Eakin, C.M.; Puotinen, M.; Garren, M.; Williams, G.; Heron, S.F.; Lamb, J.; Weil, E.; Willis, B.; et al. Projections of climate conditions that increase coral disease susceptibility and pathogen abundance and virulence. Nat. Clim. Chang. 2015, 5, 688–694. [Google Scholar] [CrossRef]
- Kleypas, J.A.; Buddemeier, R.W.; Gattuso, J.-P. The future of coral reefs in an age of global change. Int. J. Earth Sci. 2001, 90, 426–437. [Google Scholar] [CrossRef]
- Brodie, J.; Waterhouse, J. A critical review of environmental management of the ‘not so Great’ Barrier Reef. Estuar. Coast. Shelf Sci. 2012, 104–105, 1–22. [Google Scholar] [CrossRef]
Figure 1.
Map of the Indo-West Pacific showing the 31 coral ecoregions sampled. Ecoregion (ER) names are provided in Table 1. Map courtesy of “Corals of the World” [1].
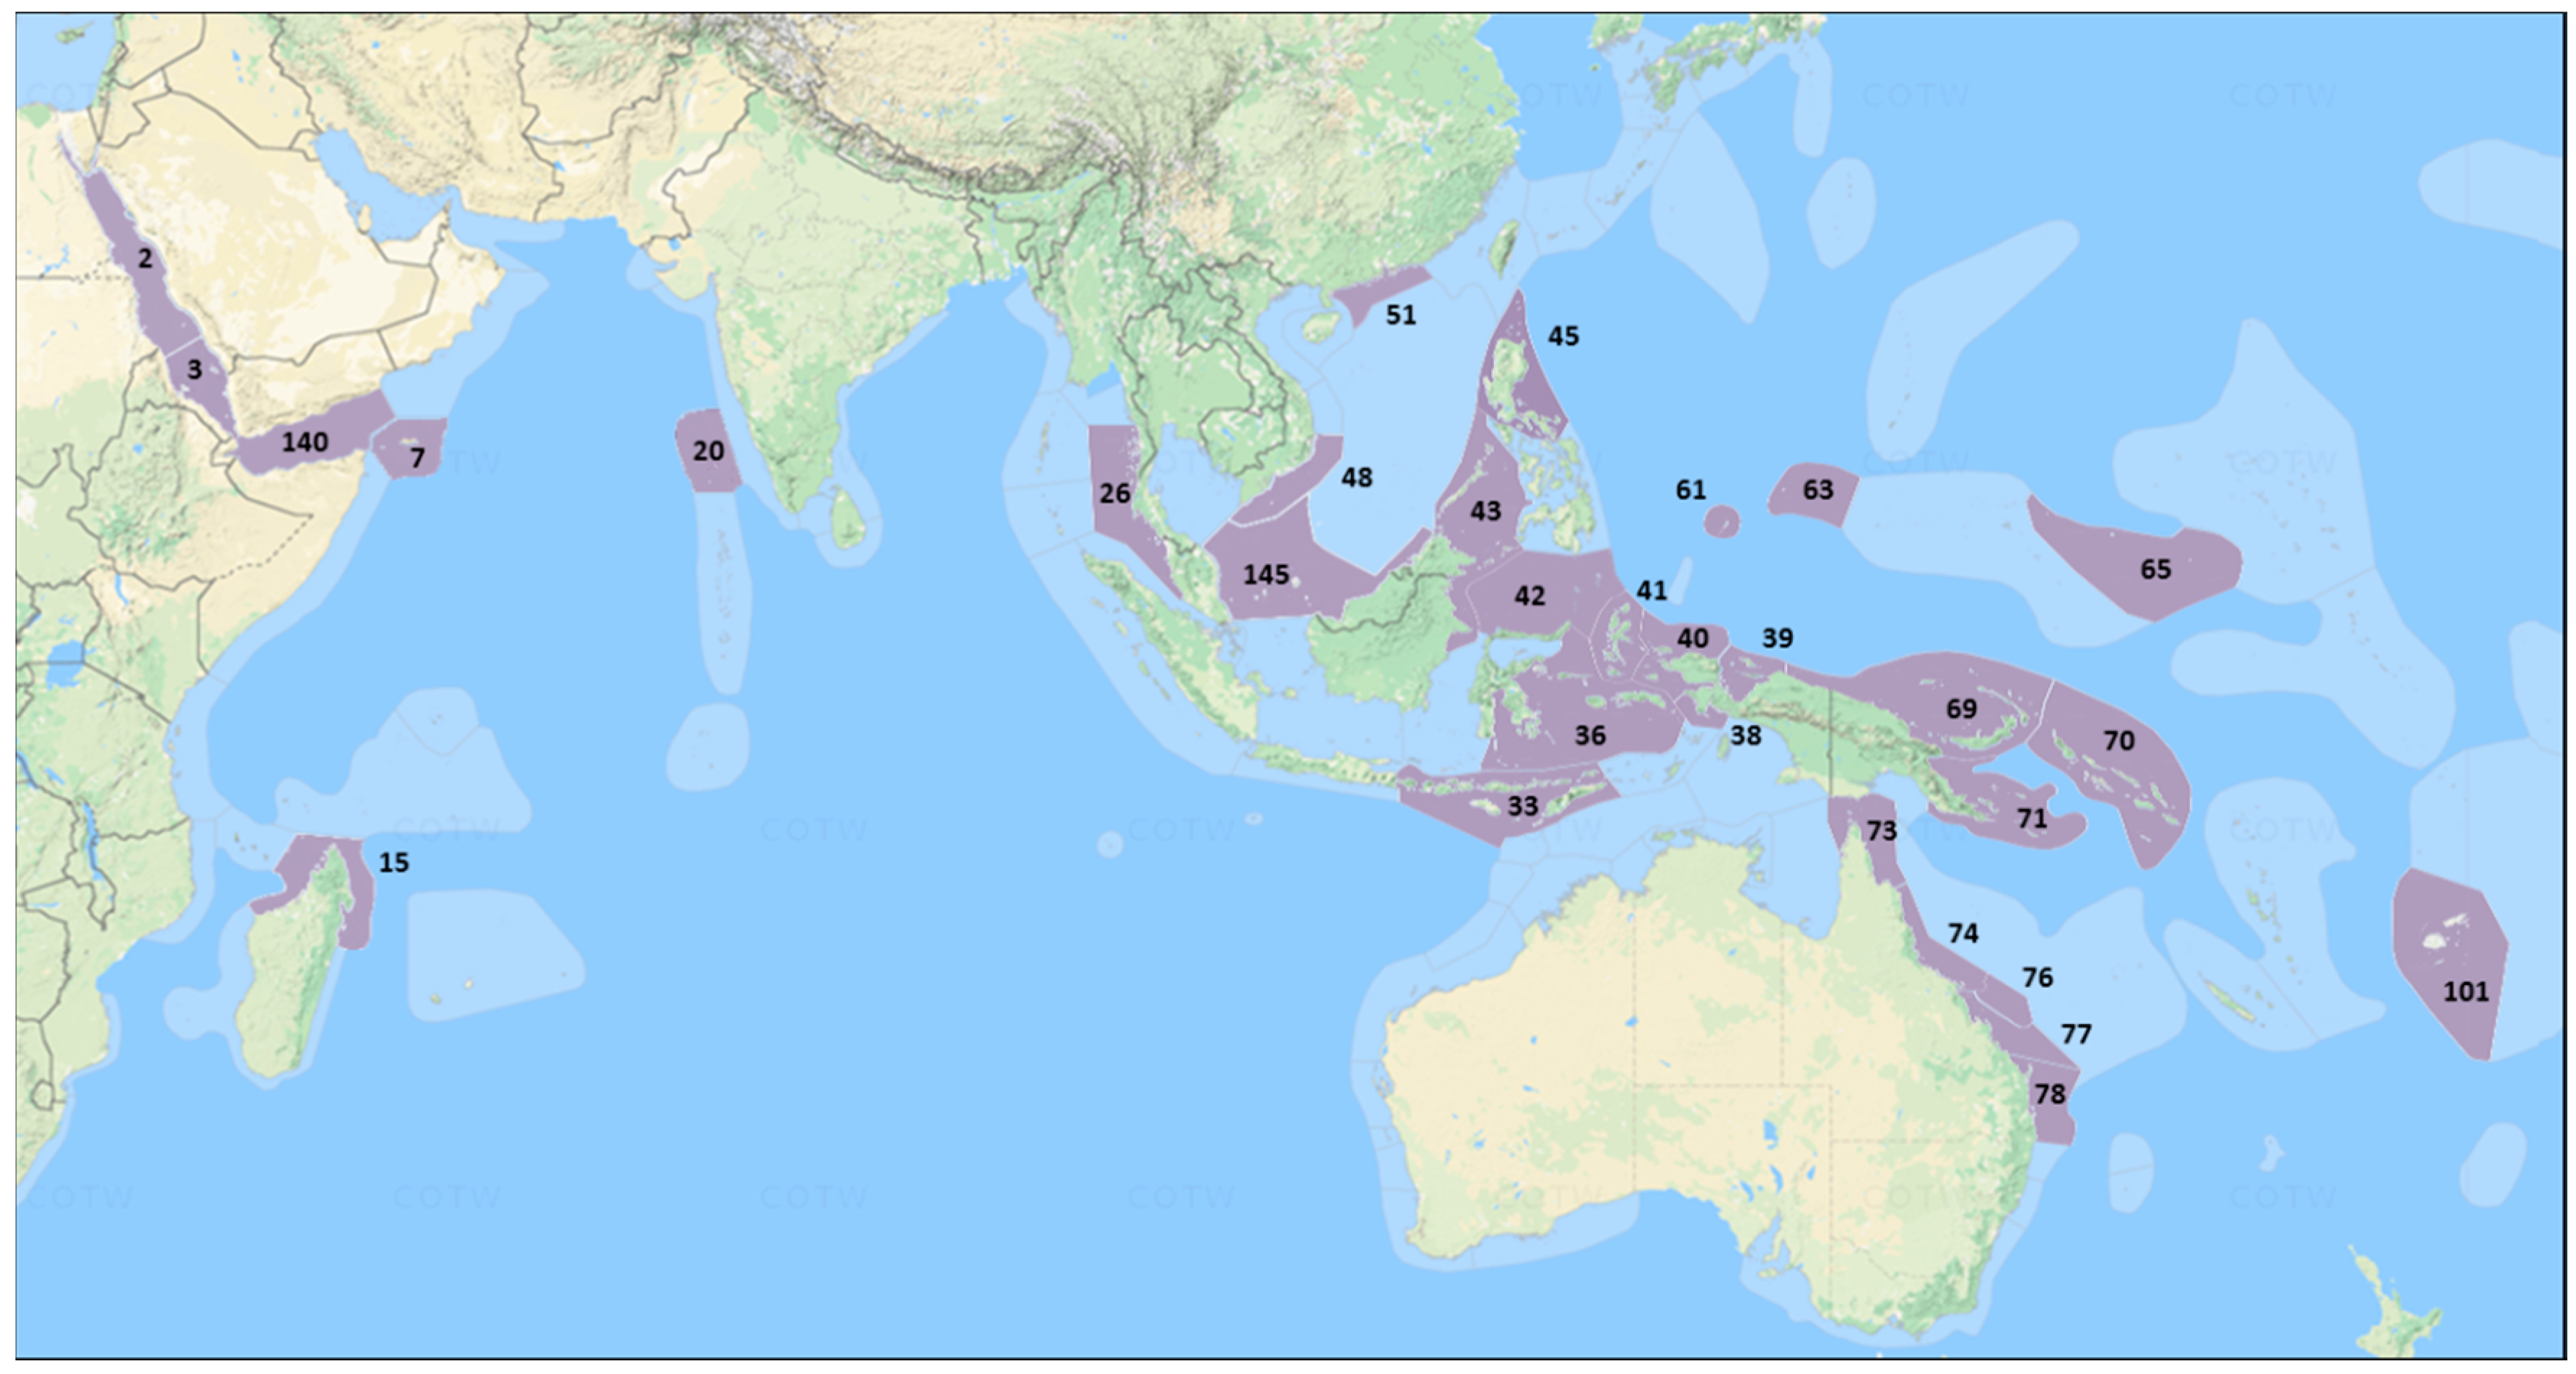
Figure 3.
The number of species that were recorded in each of an increasing number of Ecoregions (e.g., 47 species were found in only one ER, while 9 species were found in all 31 ERs), and cumulative species tally across ERs.
Figure 3.
The number of species that were recorded in each of an increasing number of Ecoregions (e.g., 47 species were found in only one ER, while 9 species were found in all 31 ERs), and cumulative species tally across ERs.

Figure 4.
Map showing species richness of Ecoregions. ER code numbers are inside or adjacent to circles (see Table 1 for details). Sizes of the inner and outer circles of each ER are scaled to indicate respectively the ER site mean and site maximum richness. For example, Halmahera ER (41) had the highest site richness (224 species). Overall ER richness is indicated by colour coding, as indicated in the Figure legend. Map courtesy of “Corals of the World” [1].

Figure 5.
Spread of species richness across 3075 sites in the Indo-West Pacific (IWP), 1994–2016.
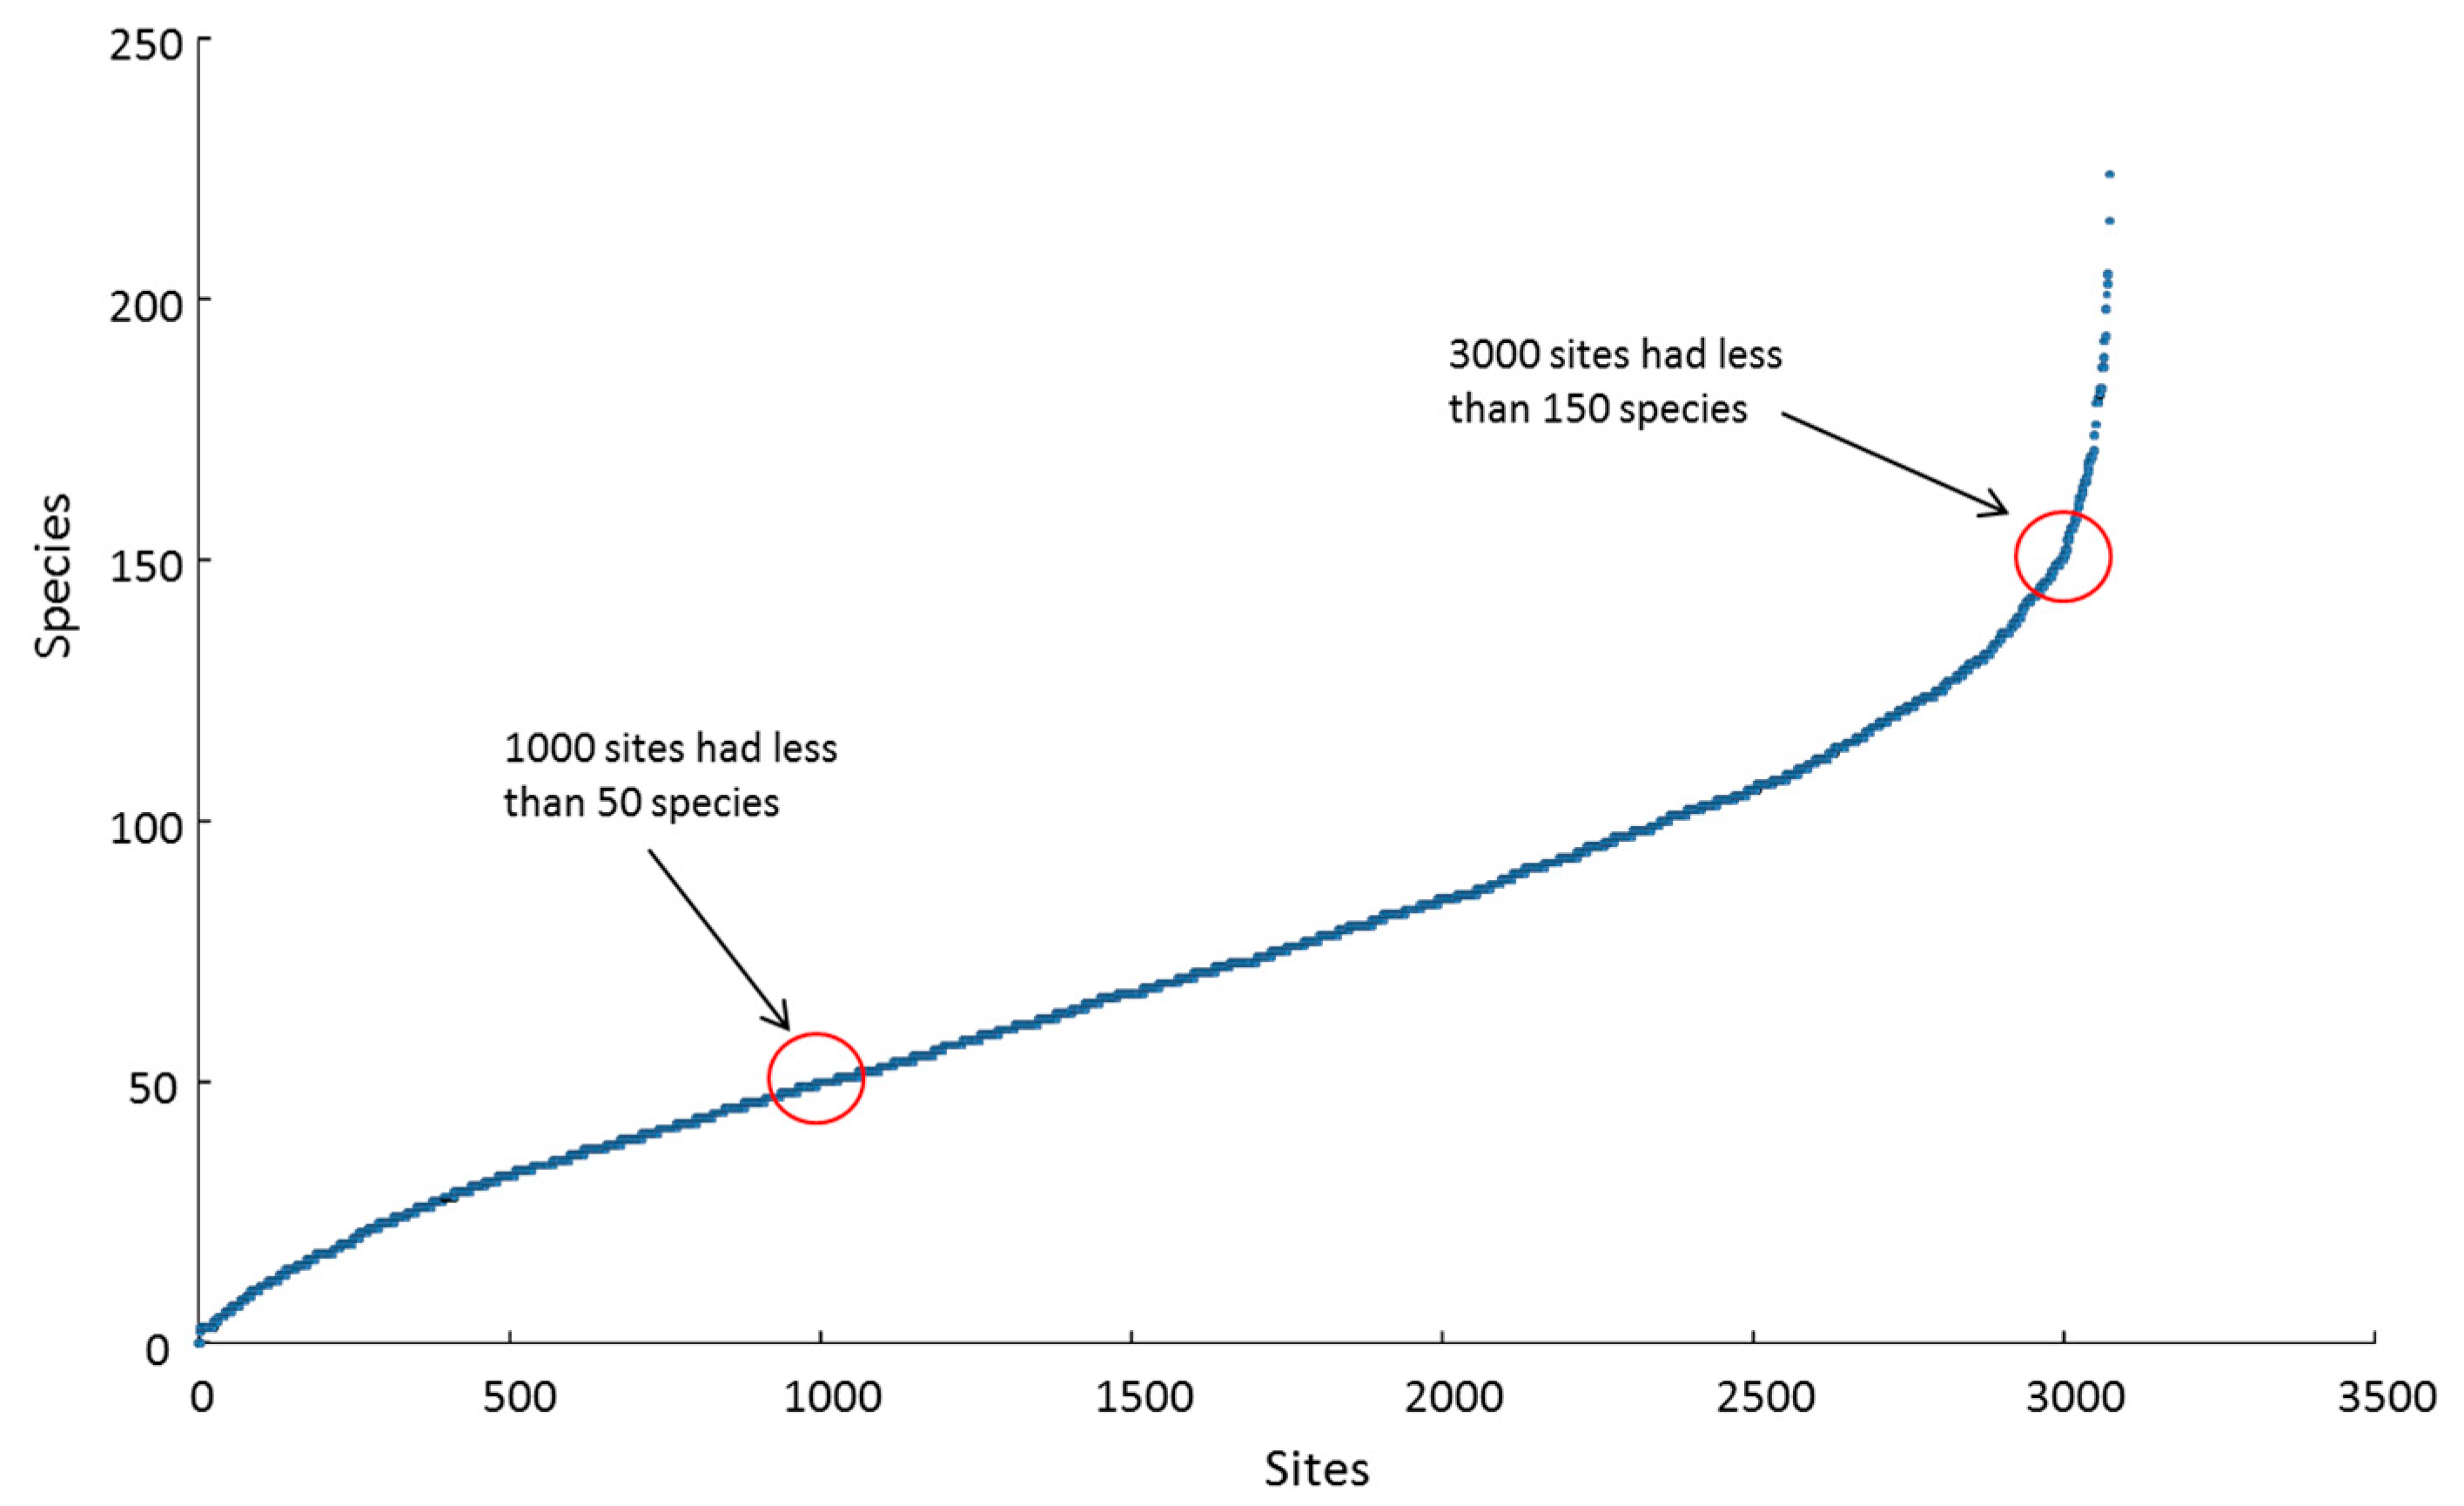
Figure 6.
Scatterplots of (A) species richness (dotted trend line, R2 = 0.54) and (B) abundance (sum of species’ abundance scores for each site; dotted trend line R2 = 0.31) in 904 pairs of shallow and deep sites. Site scores for selected Ecoregions are highlighted to illustrate intra- and inter-ER differences, where ER 2—Red Sea north-central; ER 38—Papua south-west coast; ER 61—Palau; ER 63—Yap Islands, Micronesia; ER 71—Milne Bay, Papua New Guinea (see Table 1 for ER details).

Figure 7.
Scatterplot of species’ Overall Abundance scores in all deep and shallow sites. Dotted trend line, R2 = 0.68. Selected species with preferences for deep or shallow sites, or no apparent preference, are listed.
Figure 7.
Scatterplot of species’ Overall Abundance scores in all deep and shallow sites. Dotted trend line, R2 = 0.68. Selected species with preferences for deep or shallow sites, or no apparent preference, are listed.

Figure 8.
Abundances for 672 coral species. (A) Mean local abundance scores (on an approximately log 4 scale, see Methods). (B) Overall abundance scores across all sites (Global OA with possible maximum 500, see Analysis).
Figure 8.
Abundances for 672 coral species. (A) Mean local abundance scores (on an approximately log 4 scale, see Methods). (B) Overall abundance scores across all sites (Global OA with possible maximum 500, see Analysis).

Figure 9.
Number and percentage of species in each of six IWP Overall Abundance categories. Very rare—OA < 0.1; Rare—OA 0.1– < 1.0; Uncommon—OA 1.0– < 10.0; Common—OA 10.0– < 50.0; Very common—OA 50.0– < 100.0; Near ubiquitous—OA 100.0–500.0.
Figure 9.
Number and percentage of species in each of six IWP Overall Abundance categories. Very rare—OA < 0.1; Rare—OA 0.1– < 1.0; Uncommon—OA 1.0– < 10.0; Common—OA 10.0– < 50.0; Very common—OA 50.0– < 100.0; Near ubiquitous—OA 100.0–500.0.

Figure 10.
Scatter plot for 672 species of Mean Abundance vs. Occurrence (No. of sites), showing the weak relation (R2 = 0.05) between increasing occurrence and abundance (i.e., more widespread species were only slightly more abundant). Selected species illustrate various abundance-occurrence relationships, e.g., Plerogyra discus and Acropora indonesia had relatively low levels of occurrence yet relatively high abundance in the sites in which they occurred.

Figure 11.
(A–C) Abundance maps of selected coral species, illustrated at right of maps. The darker the shading the higher the mean OA score in each ER. White shading indicates that the species was not recorded from that ER during our surveys, although it may occur there (see text for details). Grey shading indicates the known distribution range of the species [3], from “Coral of the World” [1]. Photos by Emre Turak.

Figure 12.
(A) Coral species displaying different forms of rarity. Acropora suharsonoi, Bali (geo-suffusive); (B) Euphyllia baliensis, Bali (geo- and habitat-suffusive); (C) Craterastrea levis, Halmahera (diffusive and habitat-suffusive); (D) Duncanopsammia axifuga, Timor Leste (diffusive and habitat suffusive). Photos by Emre Turak.


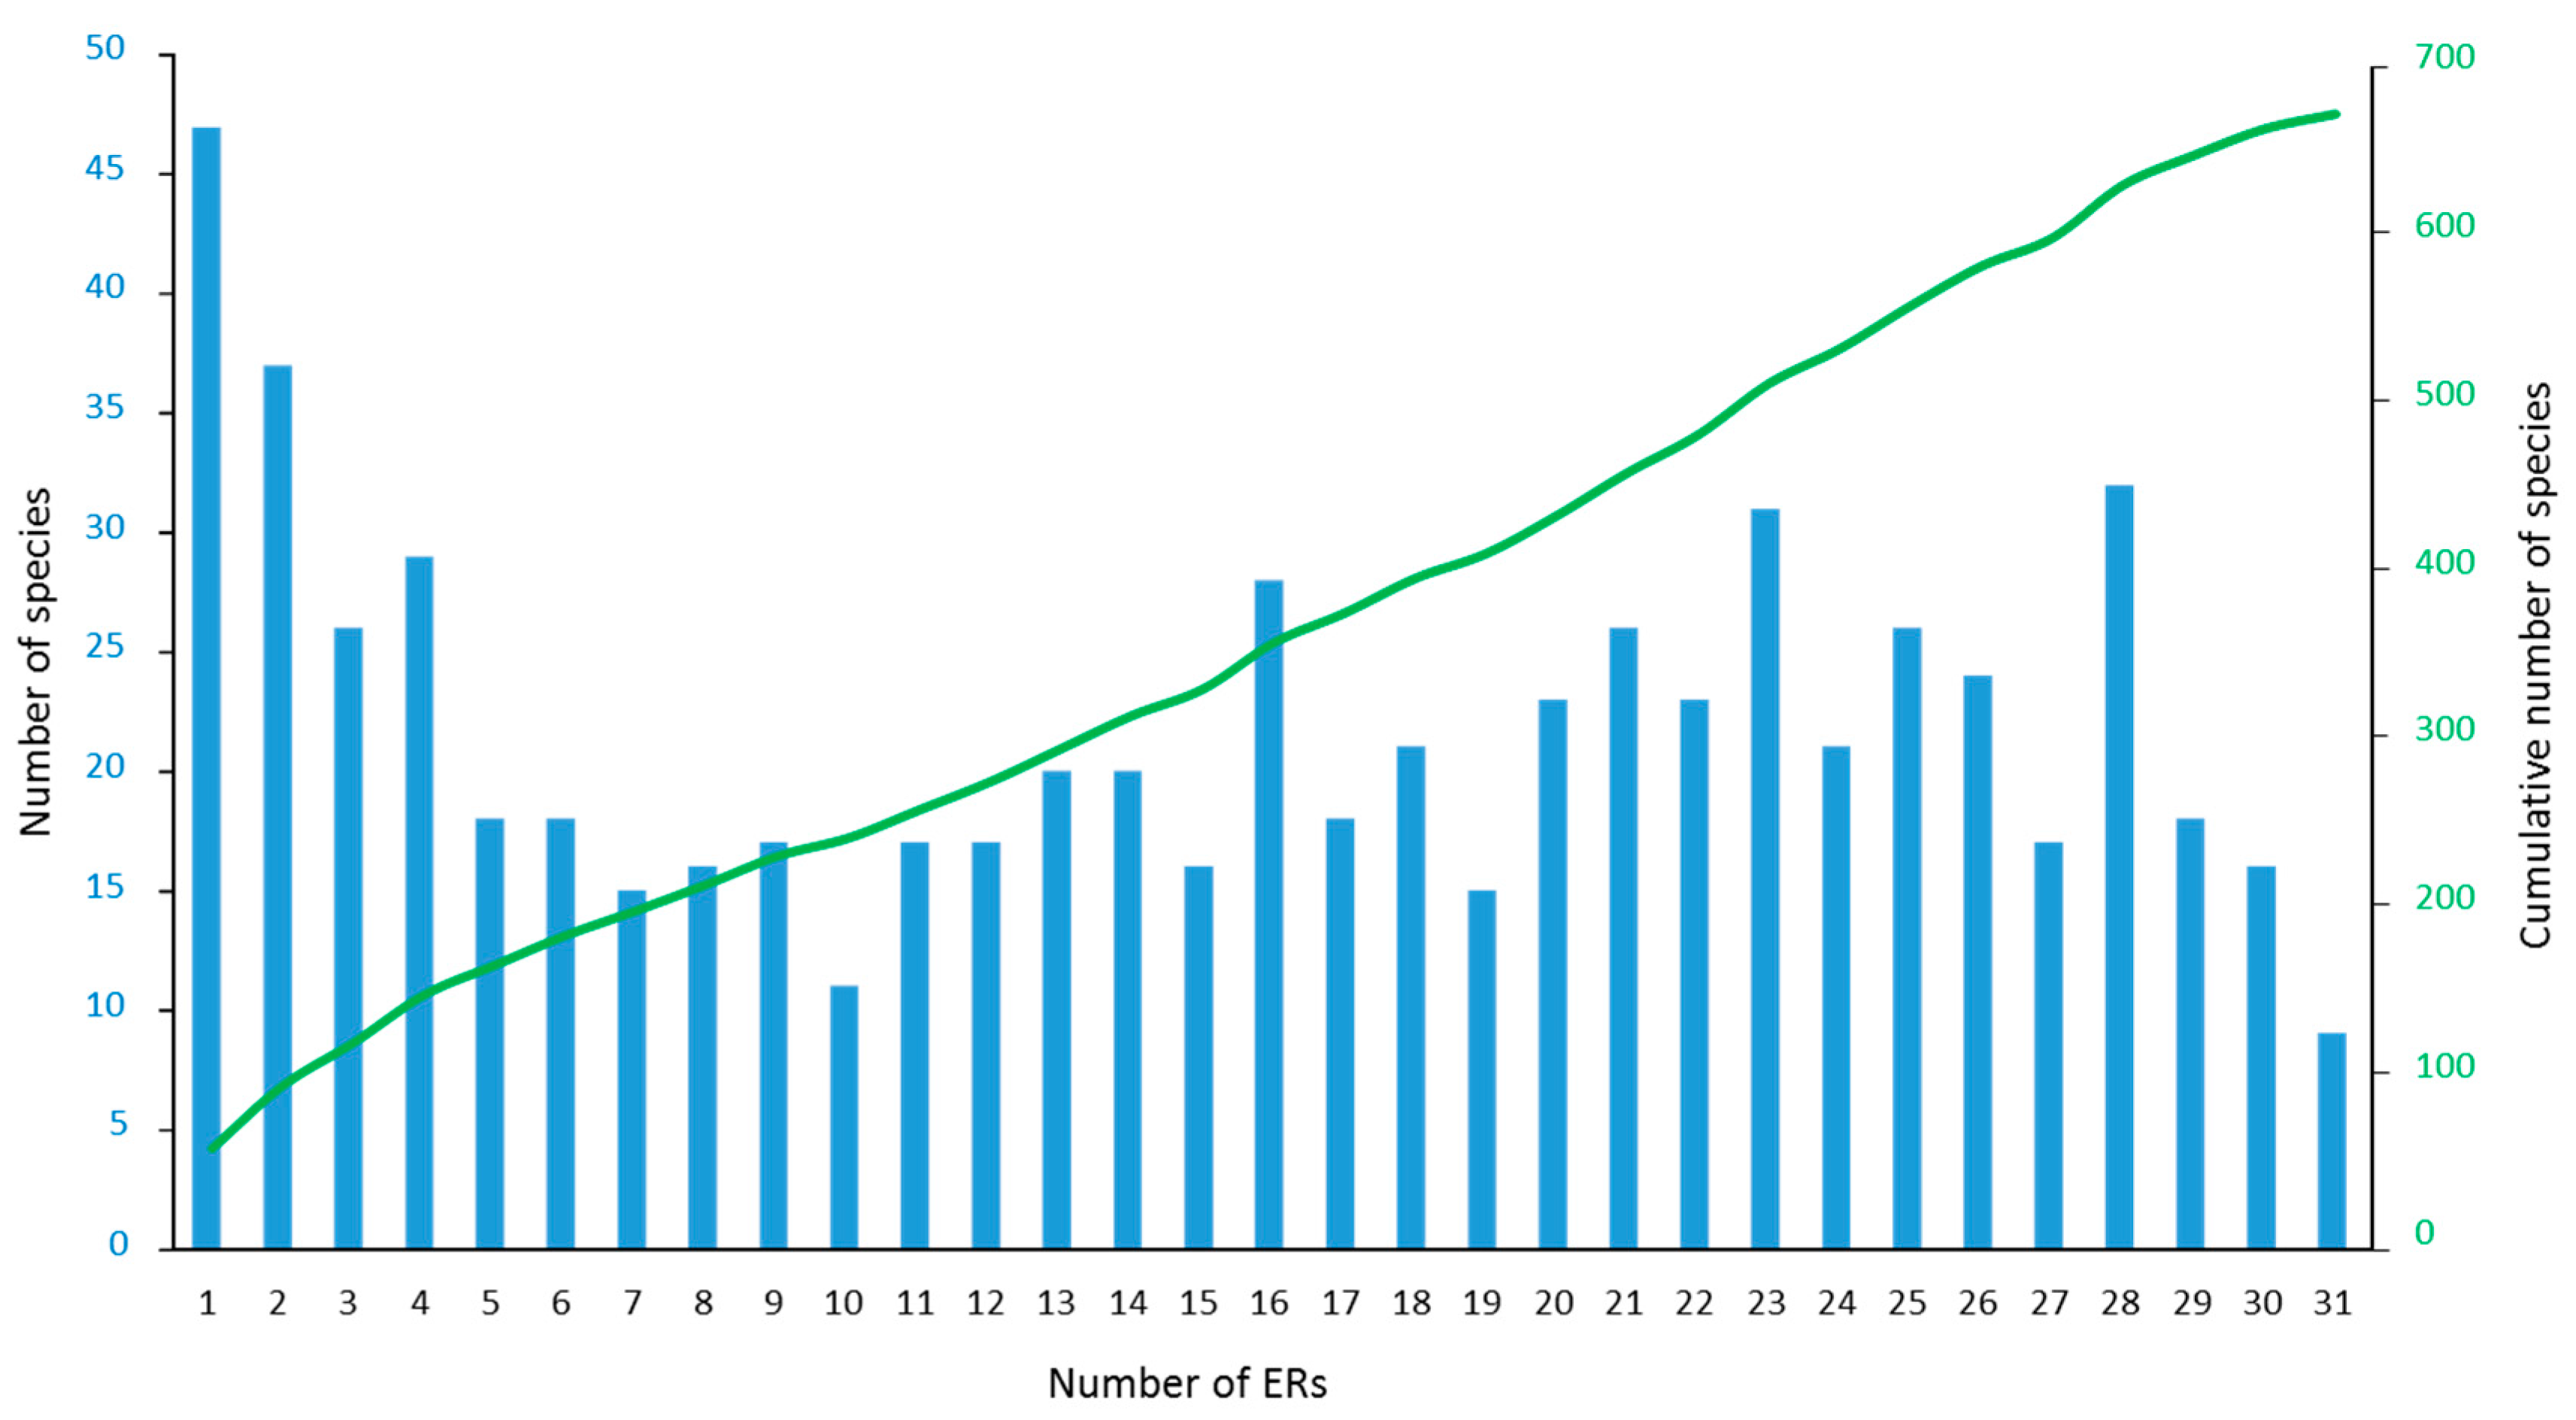
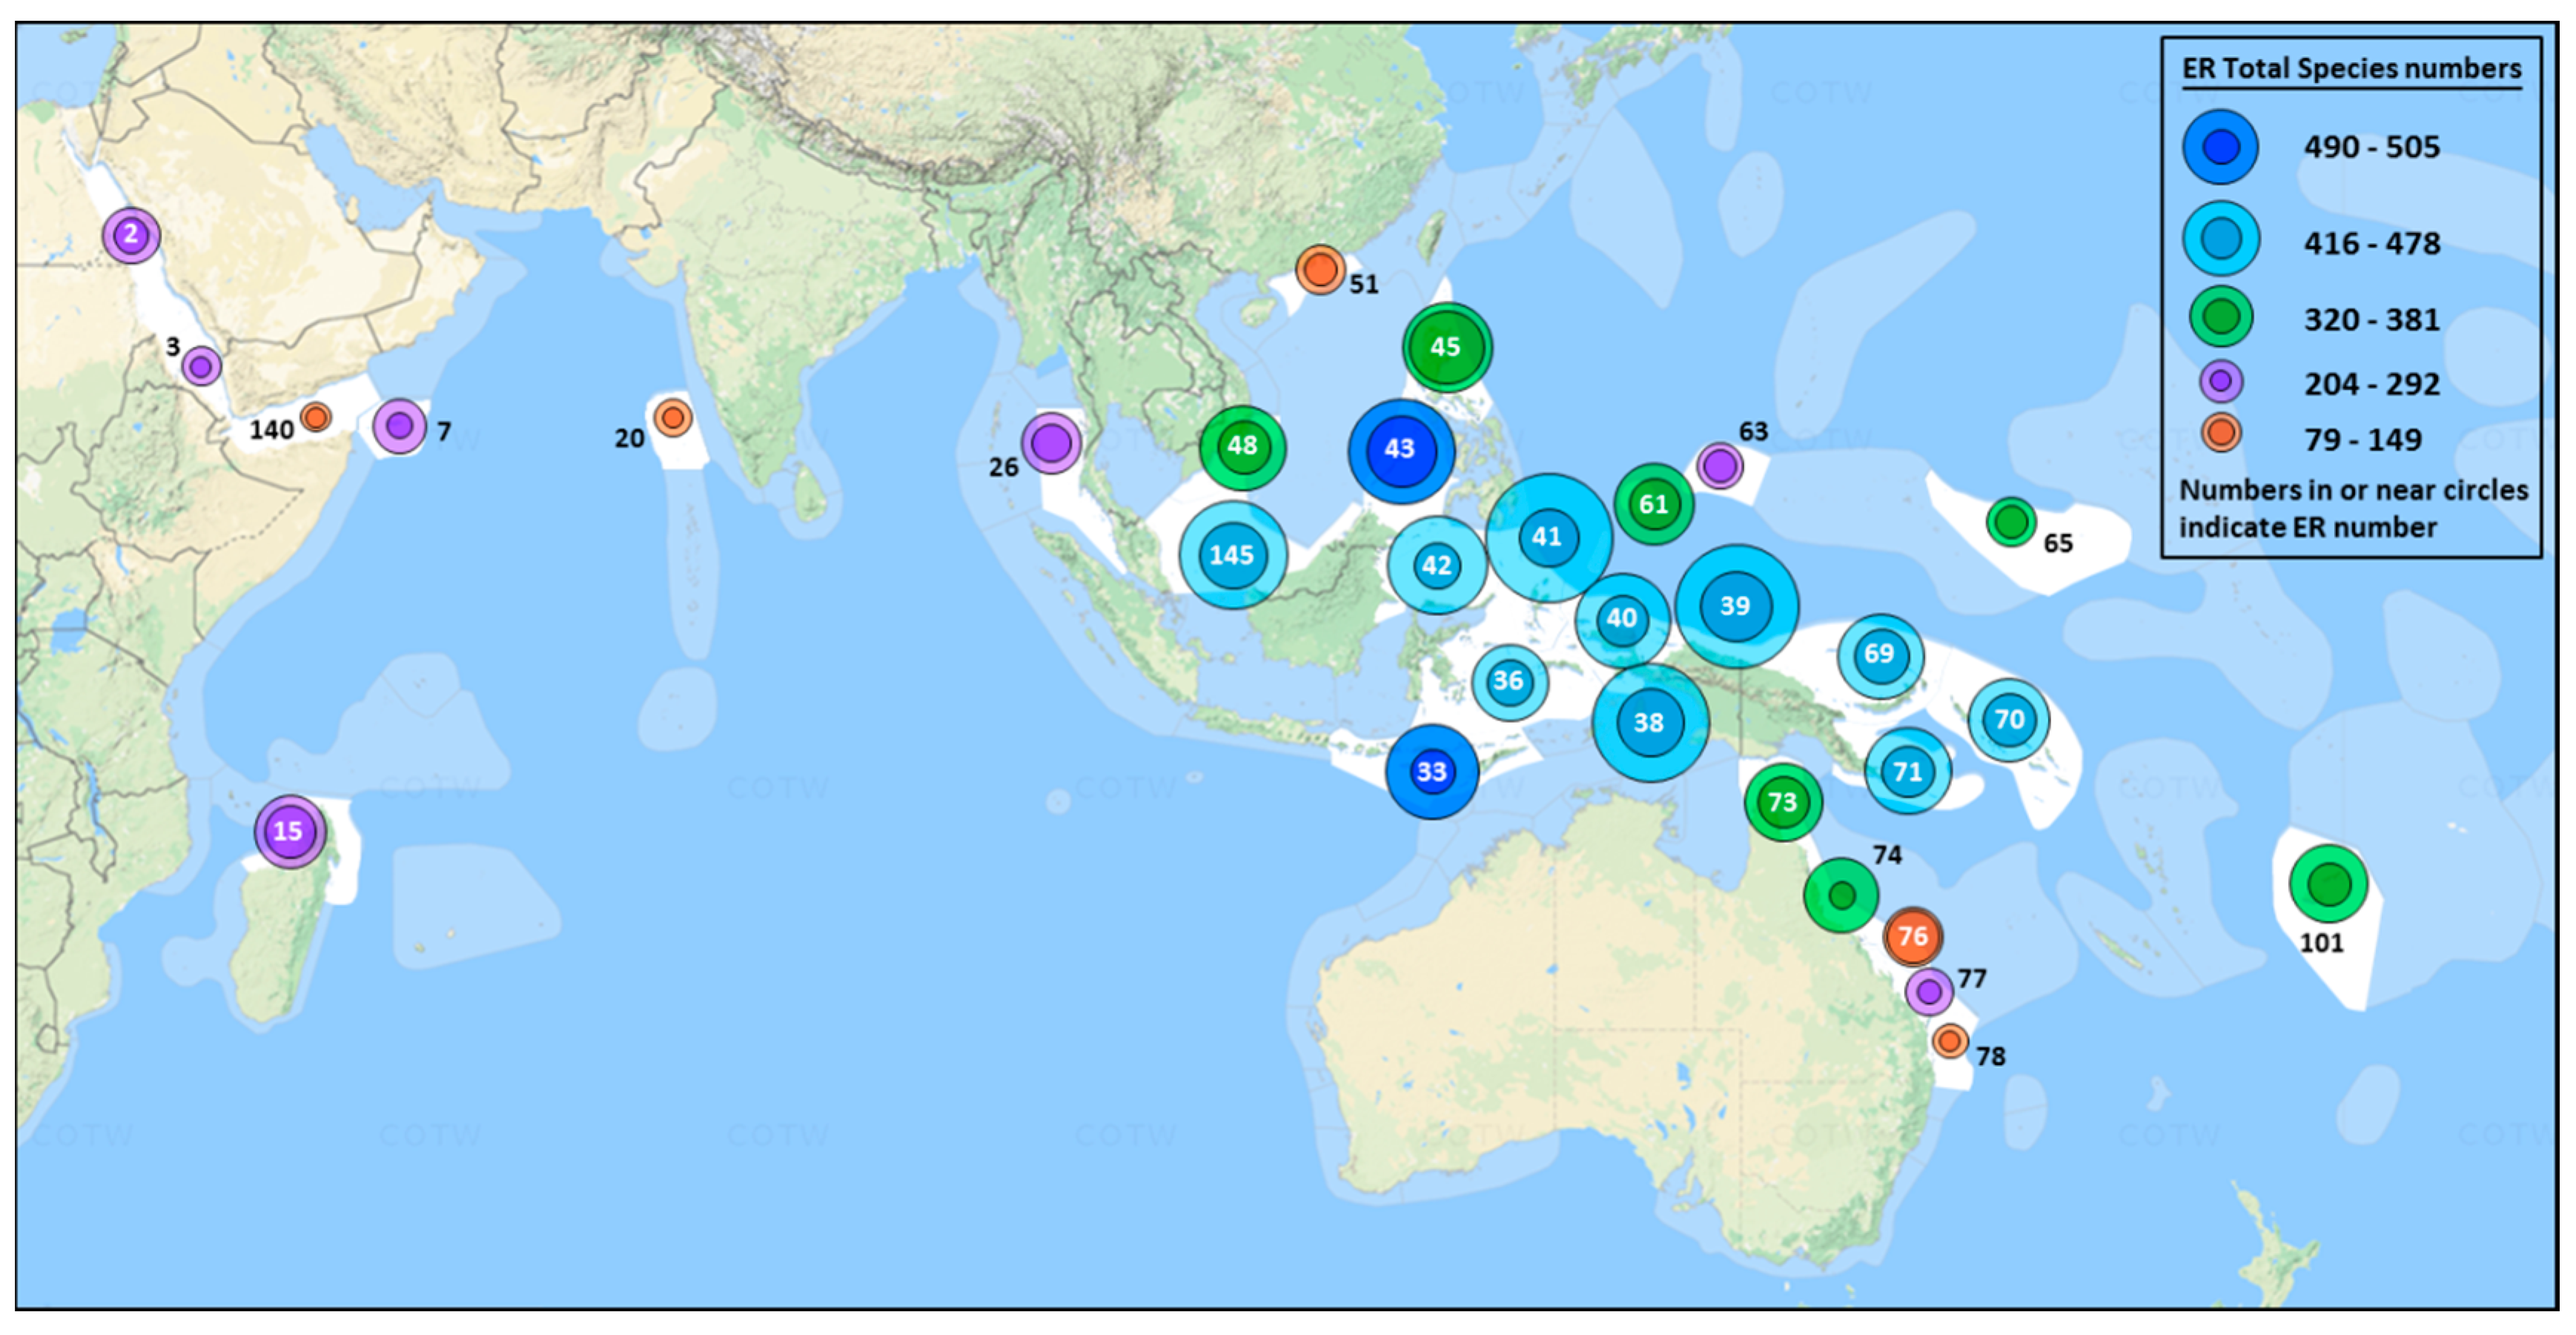
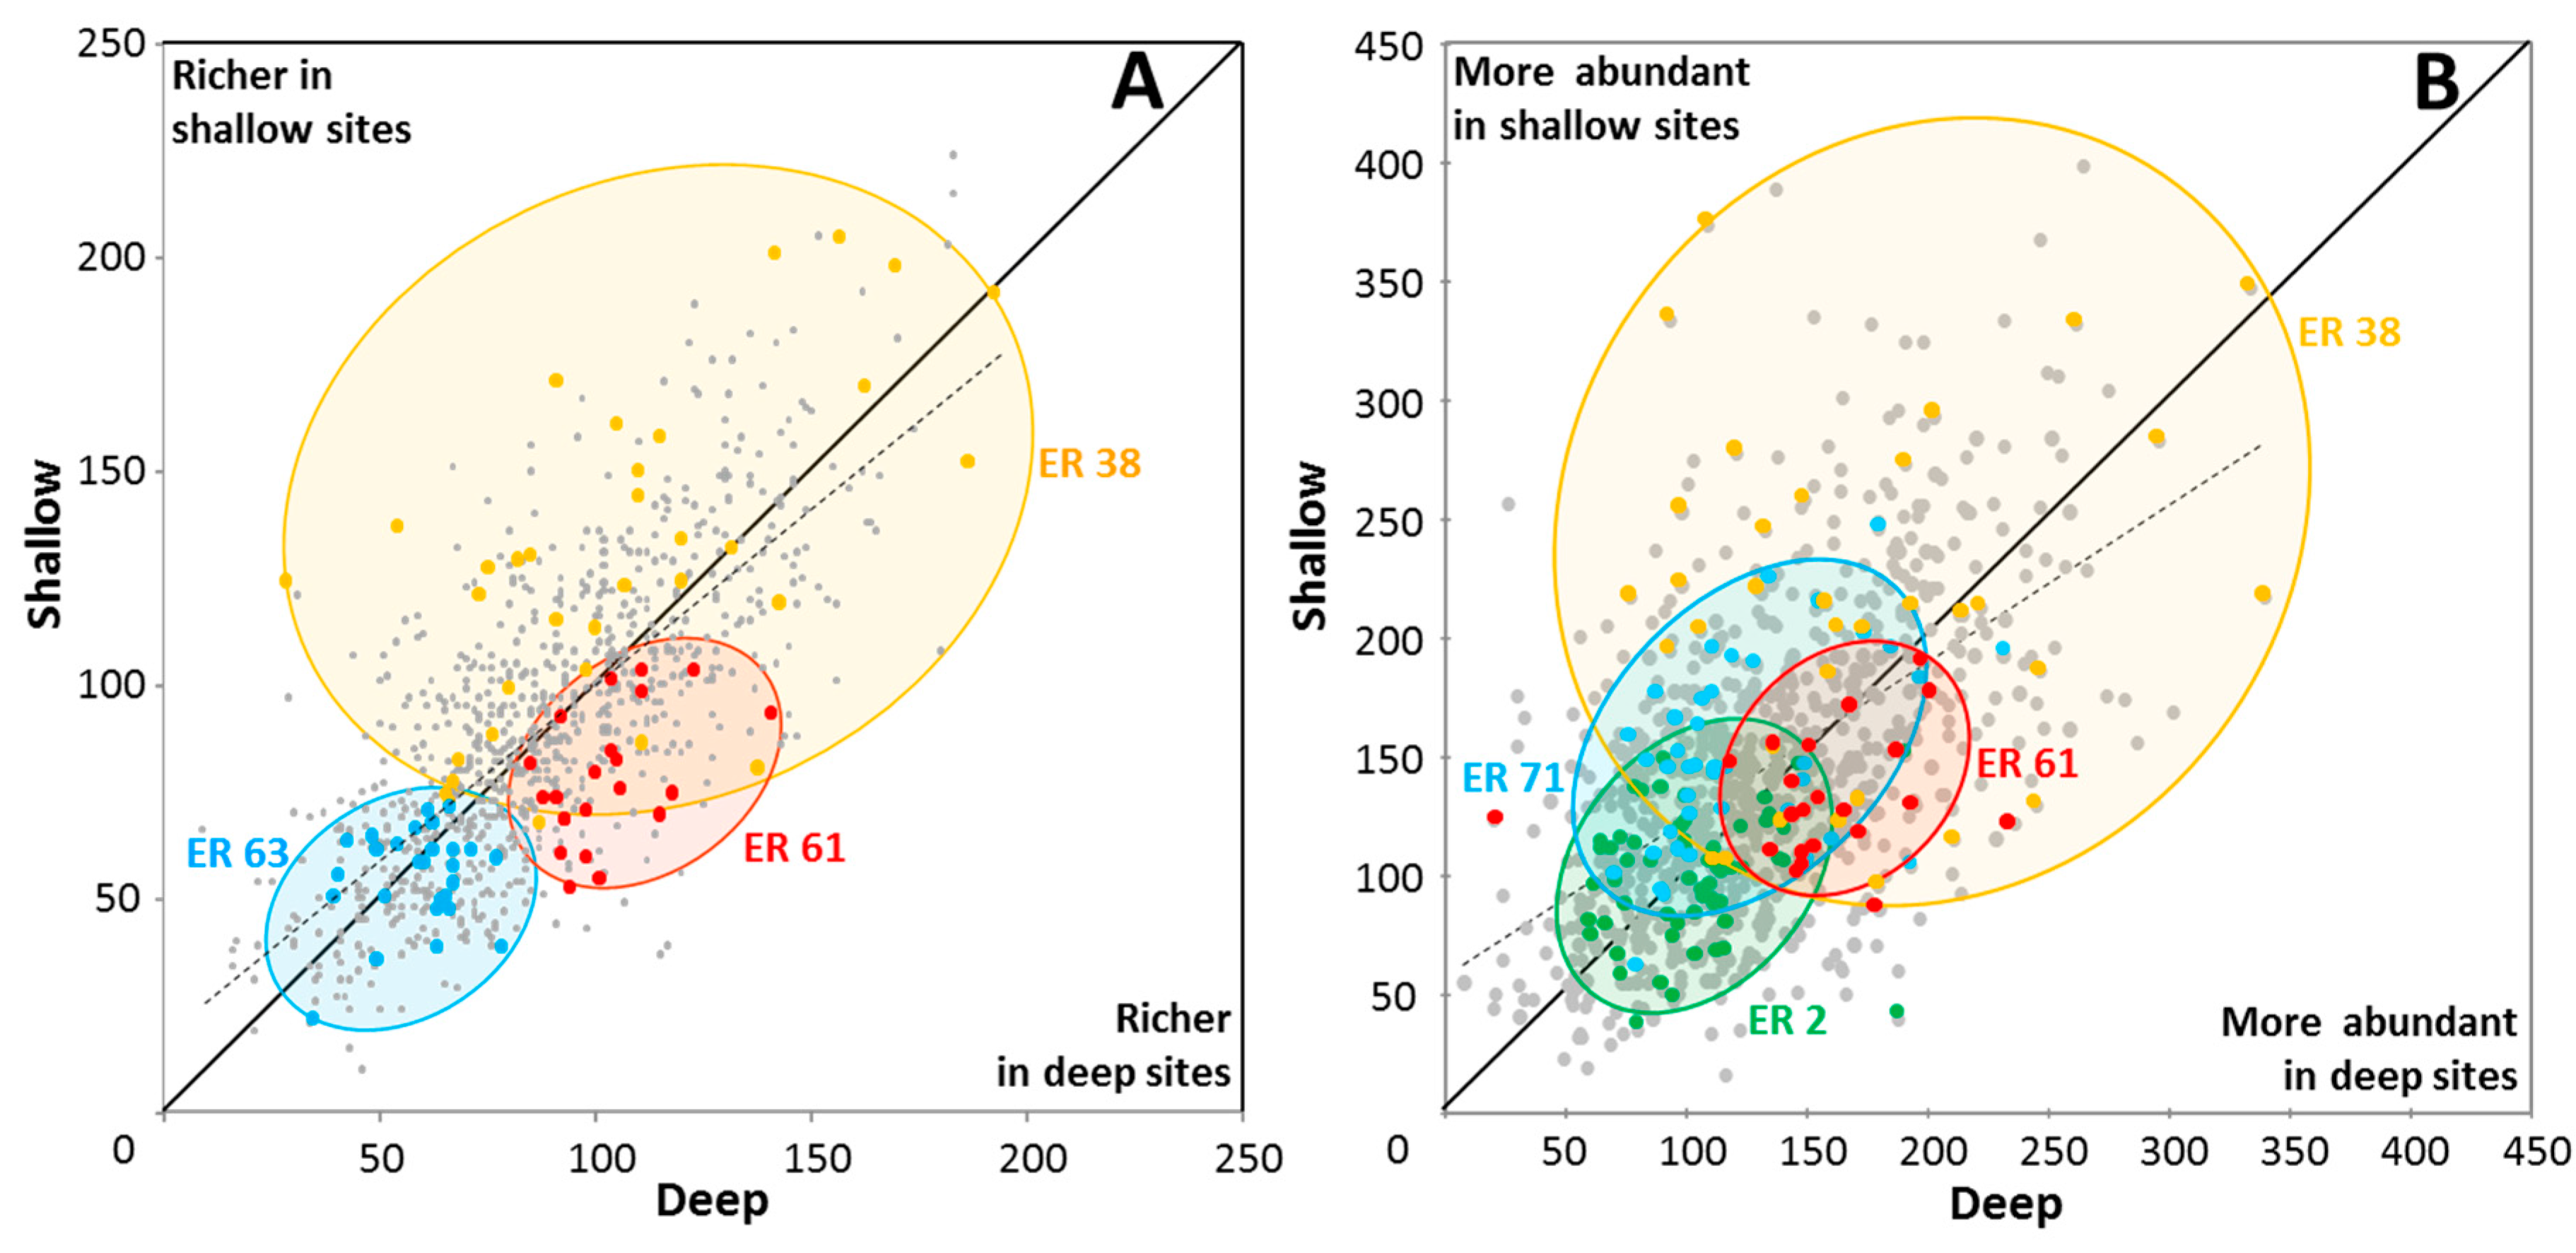
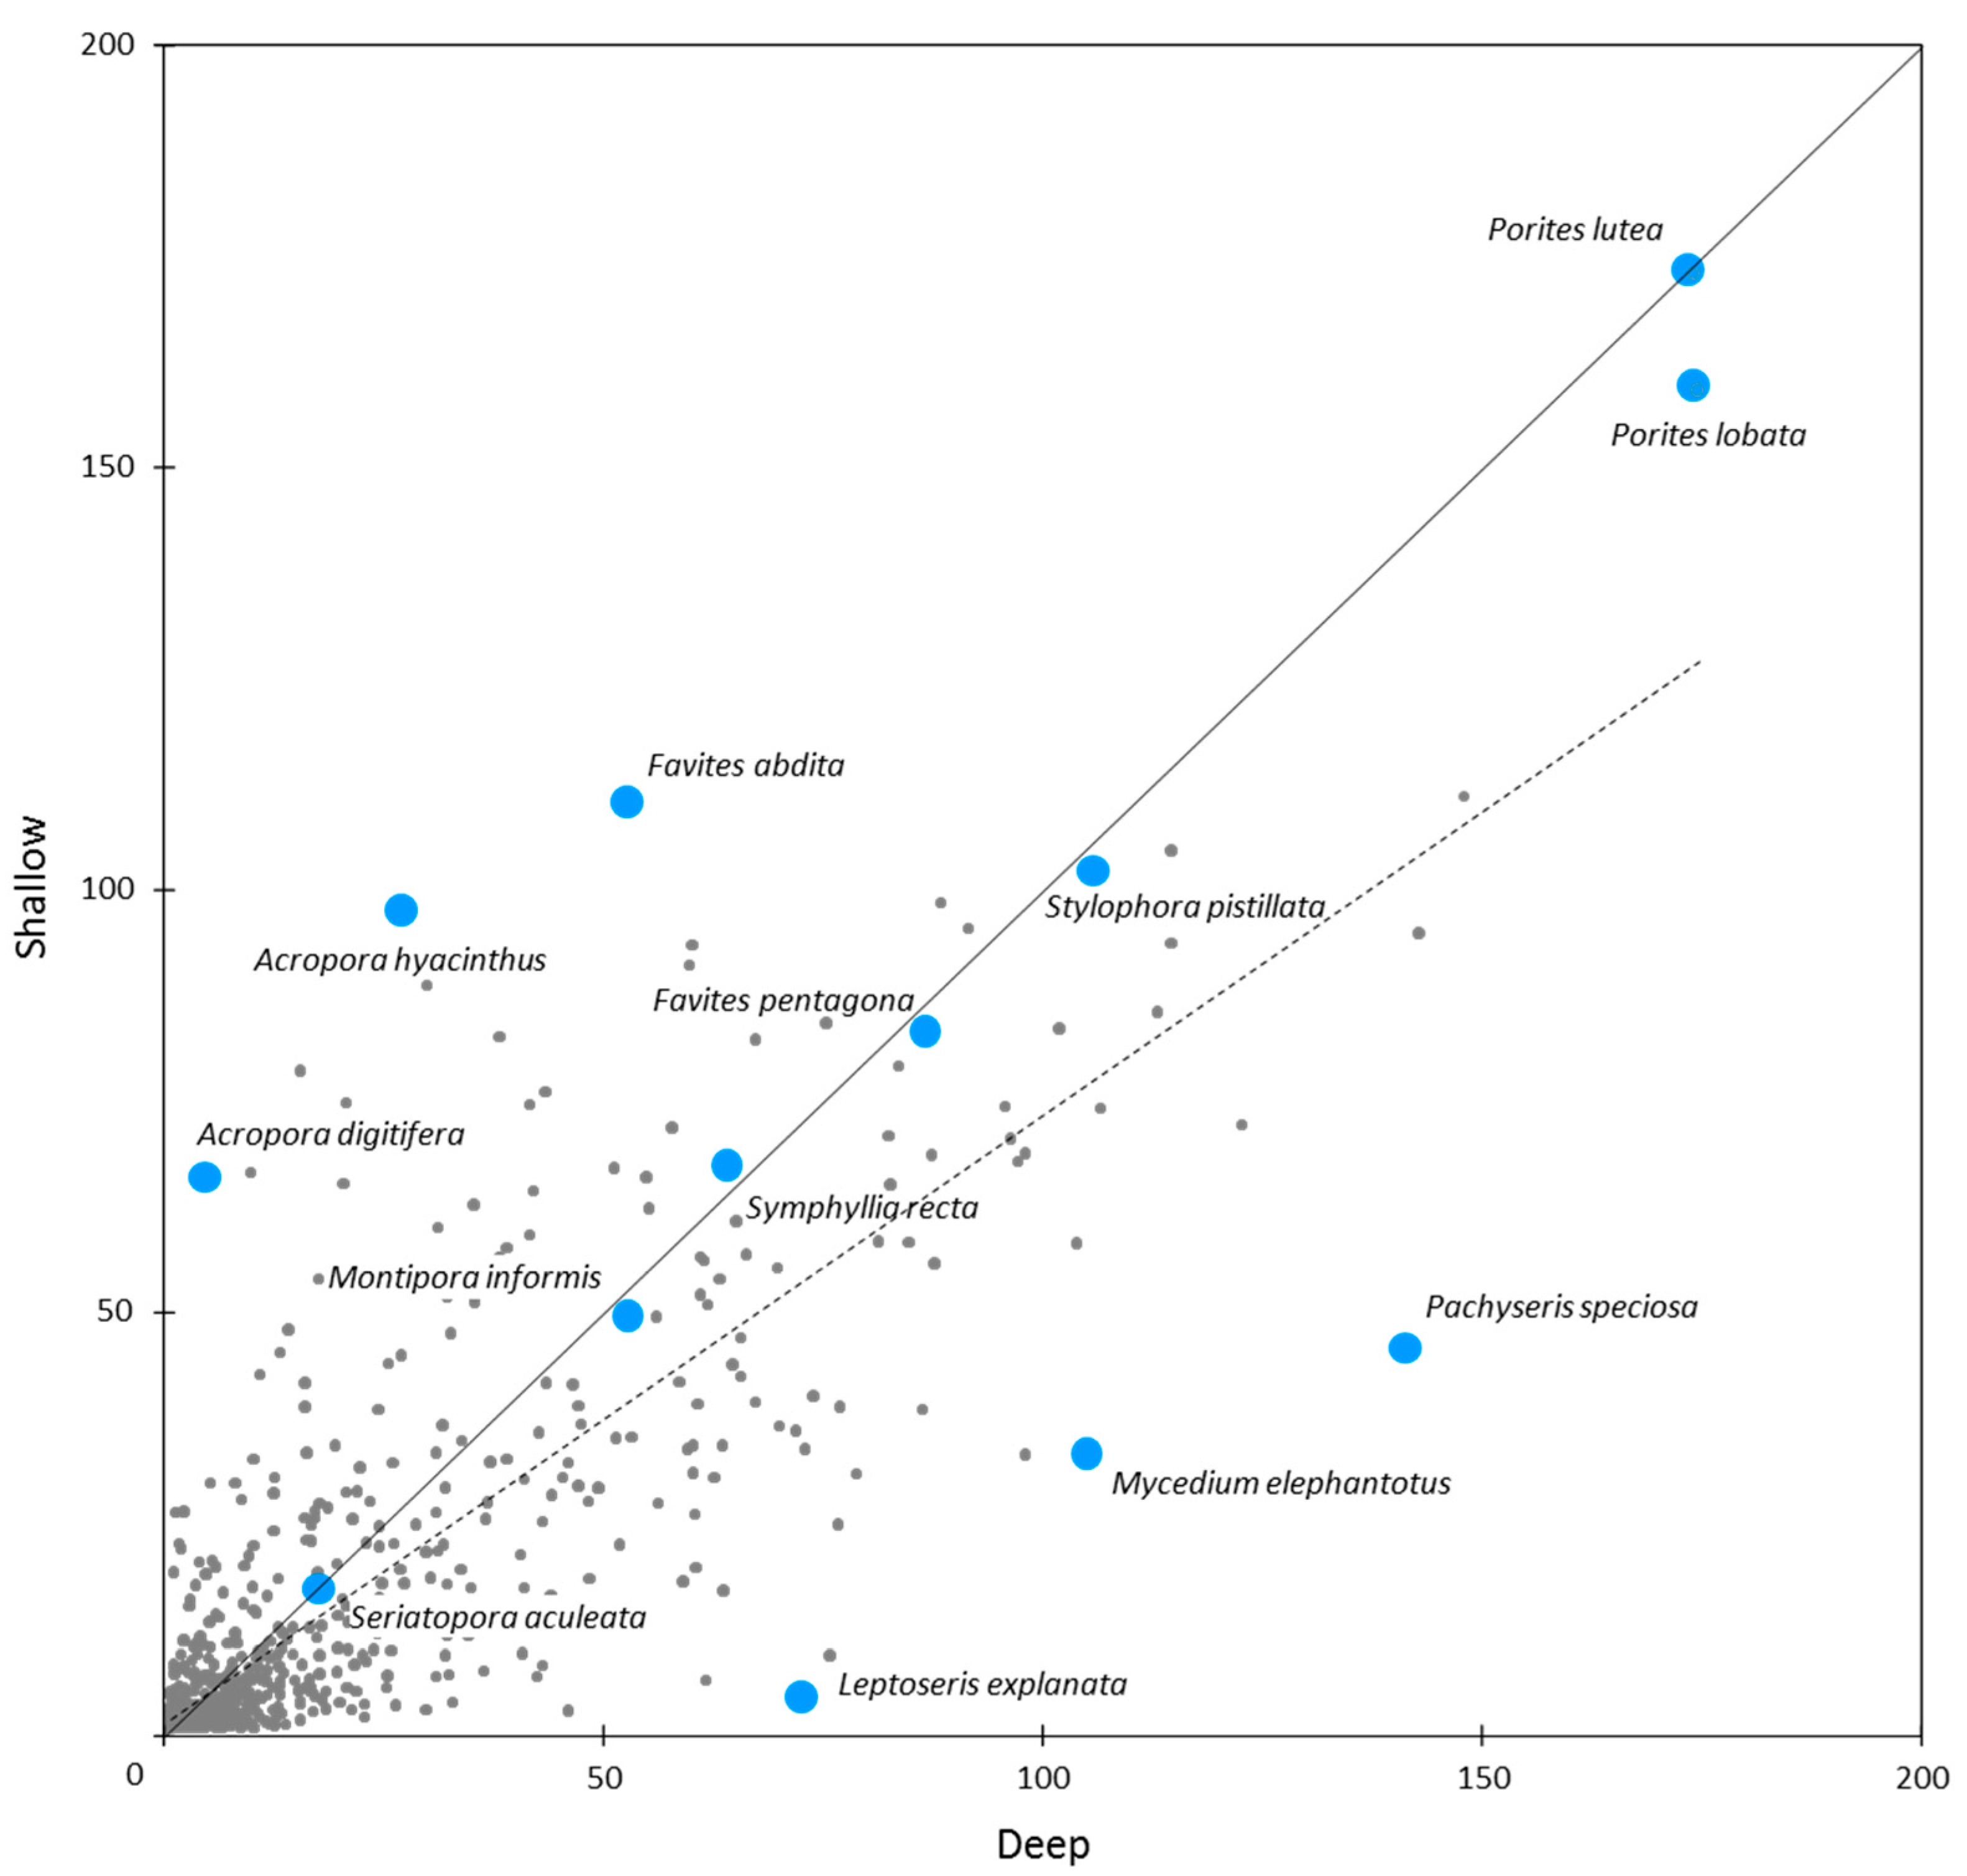
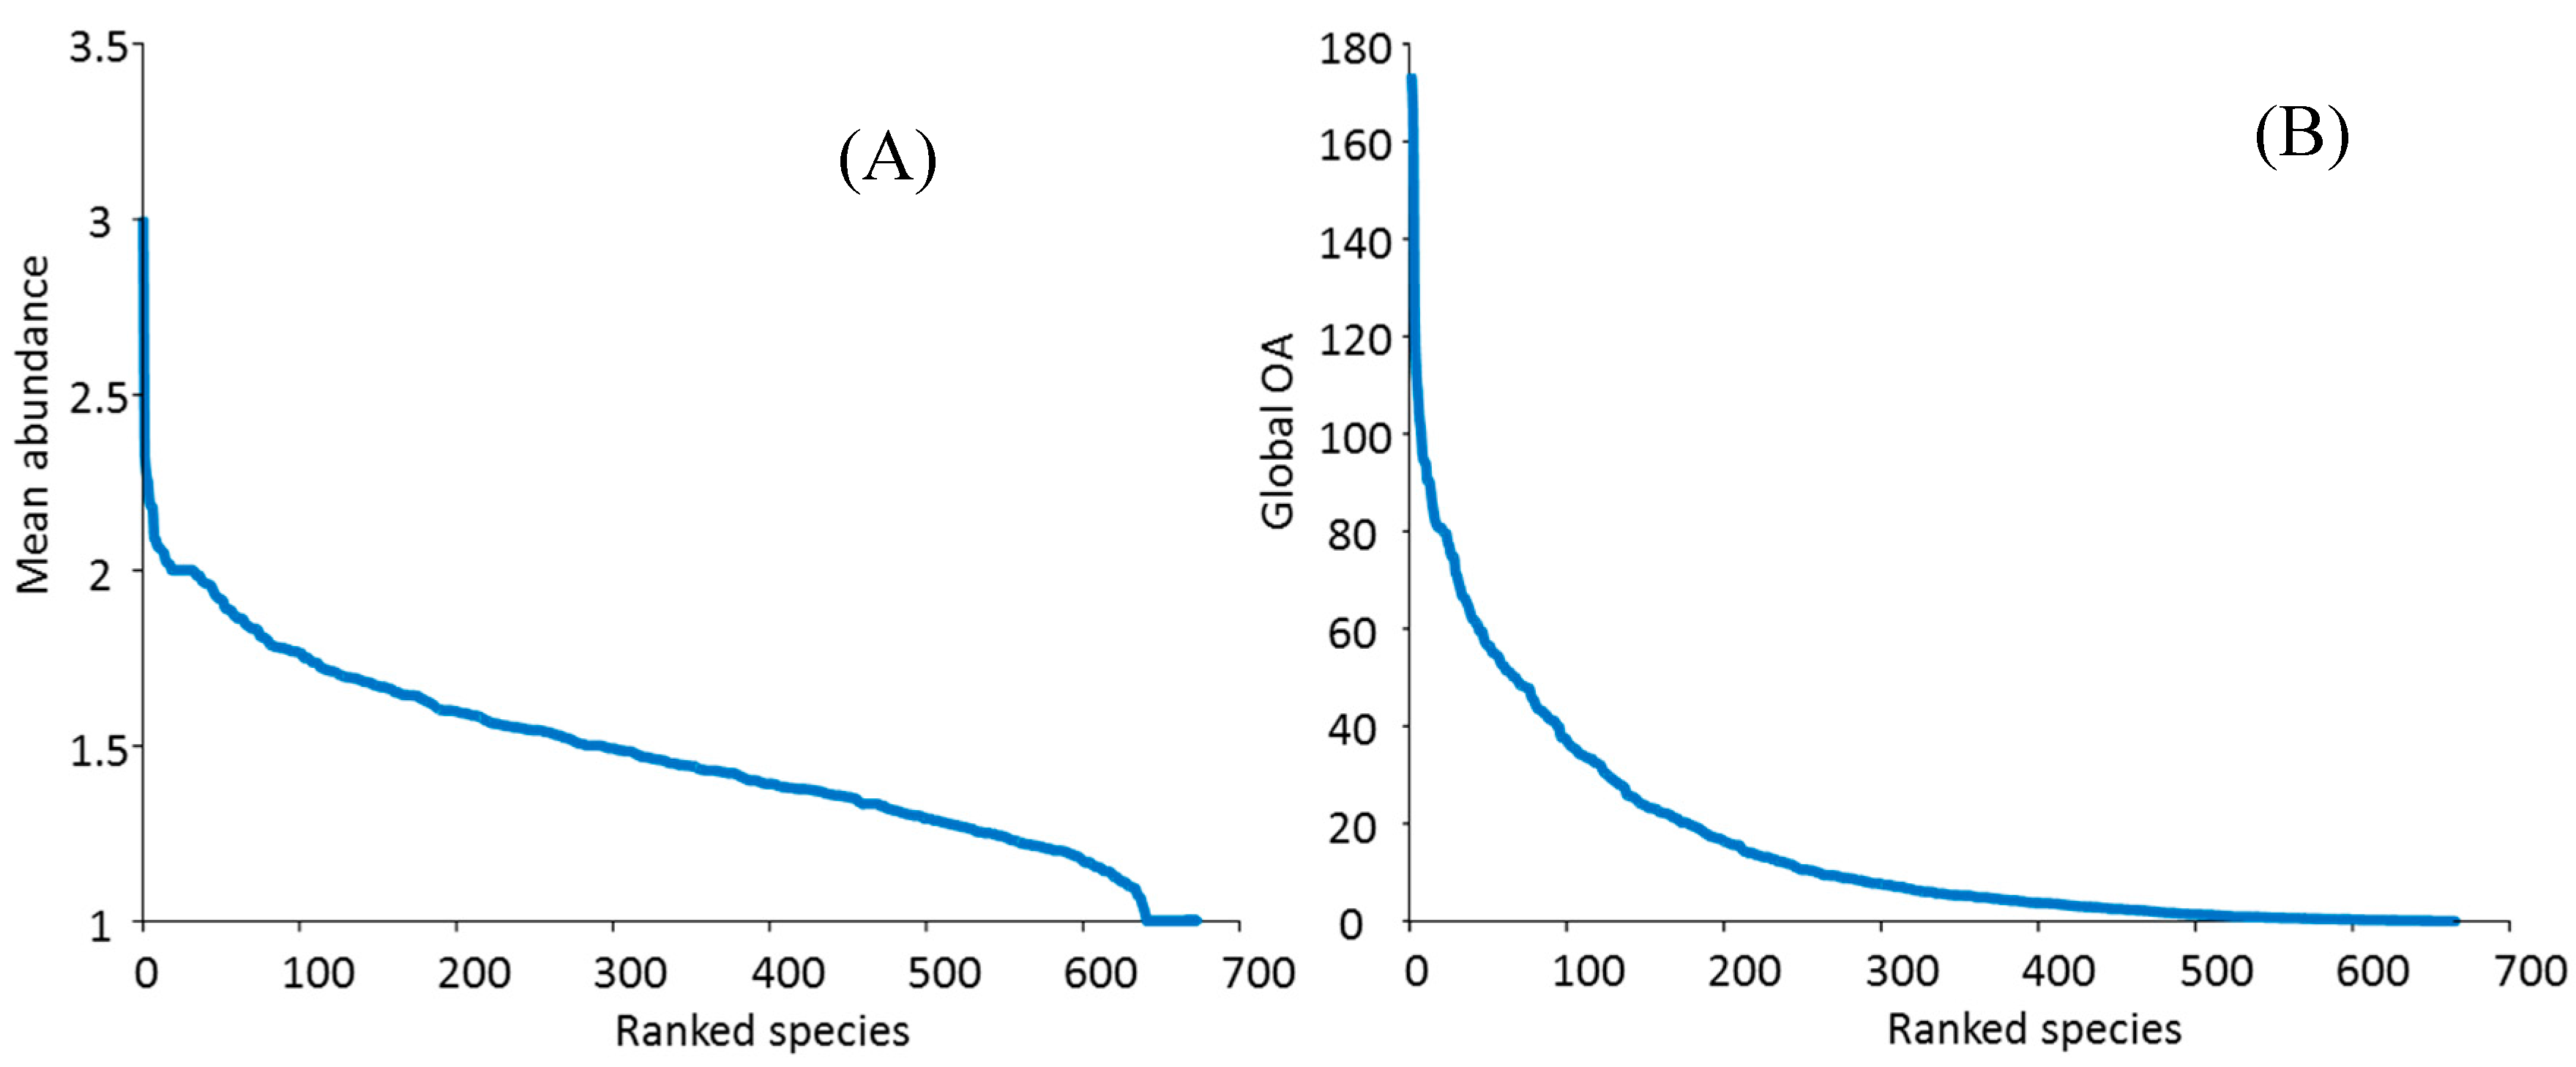
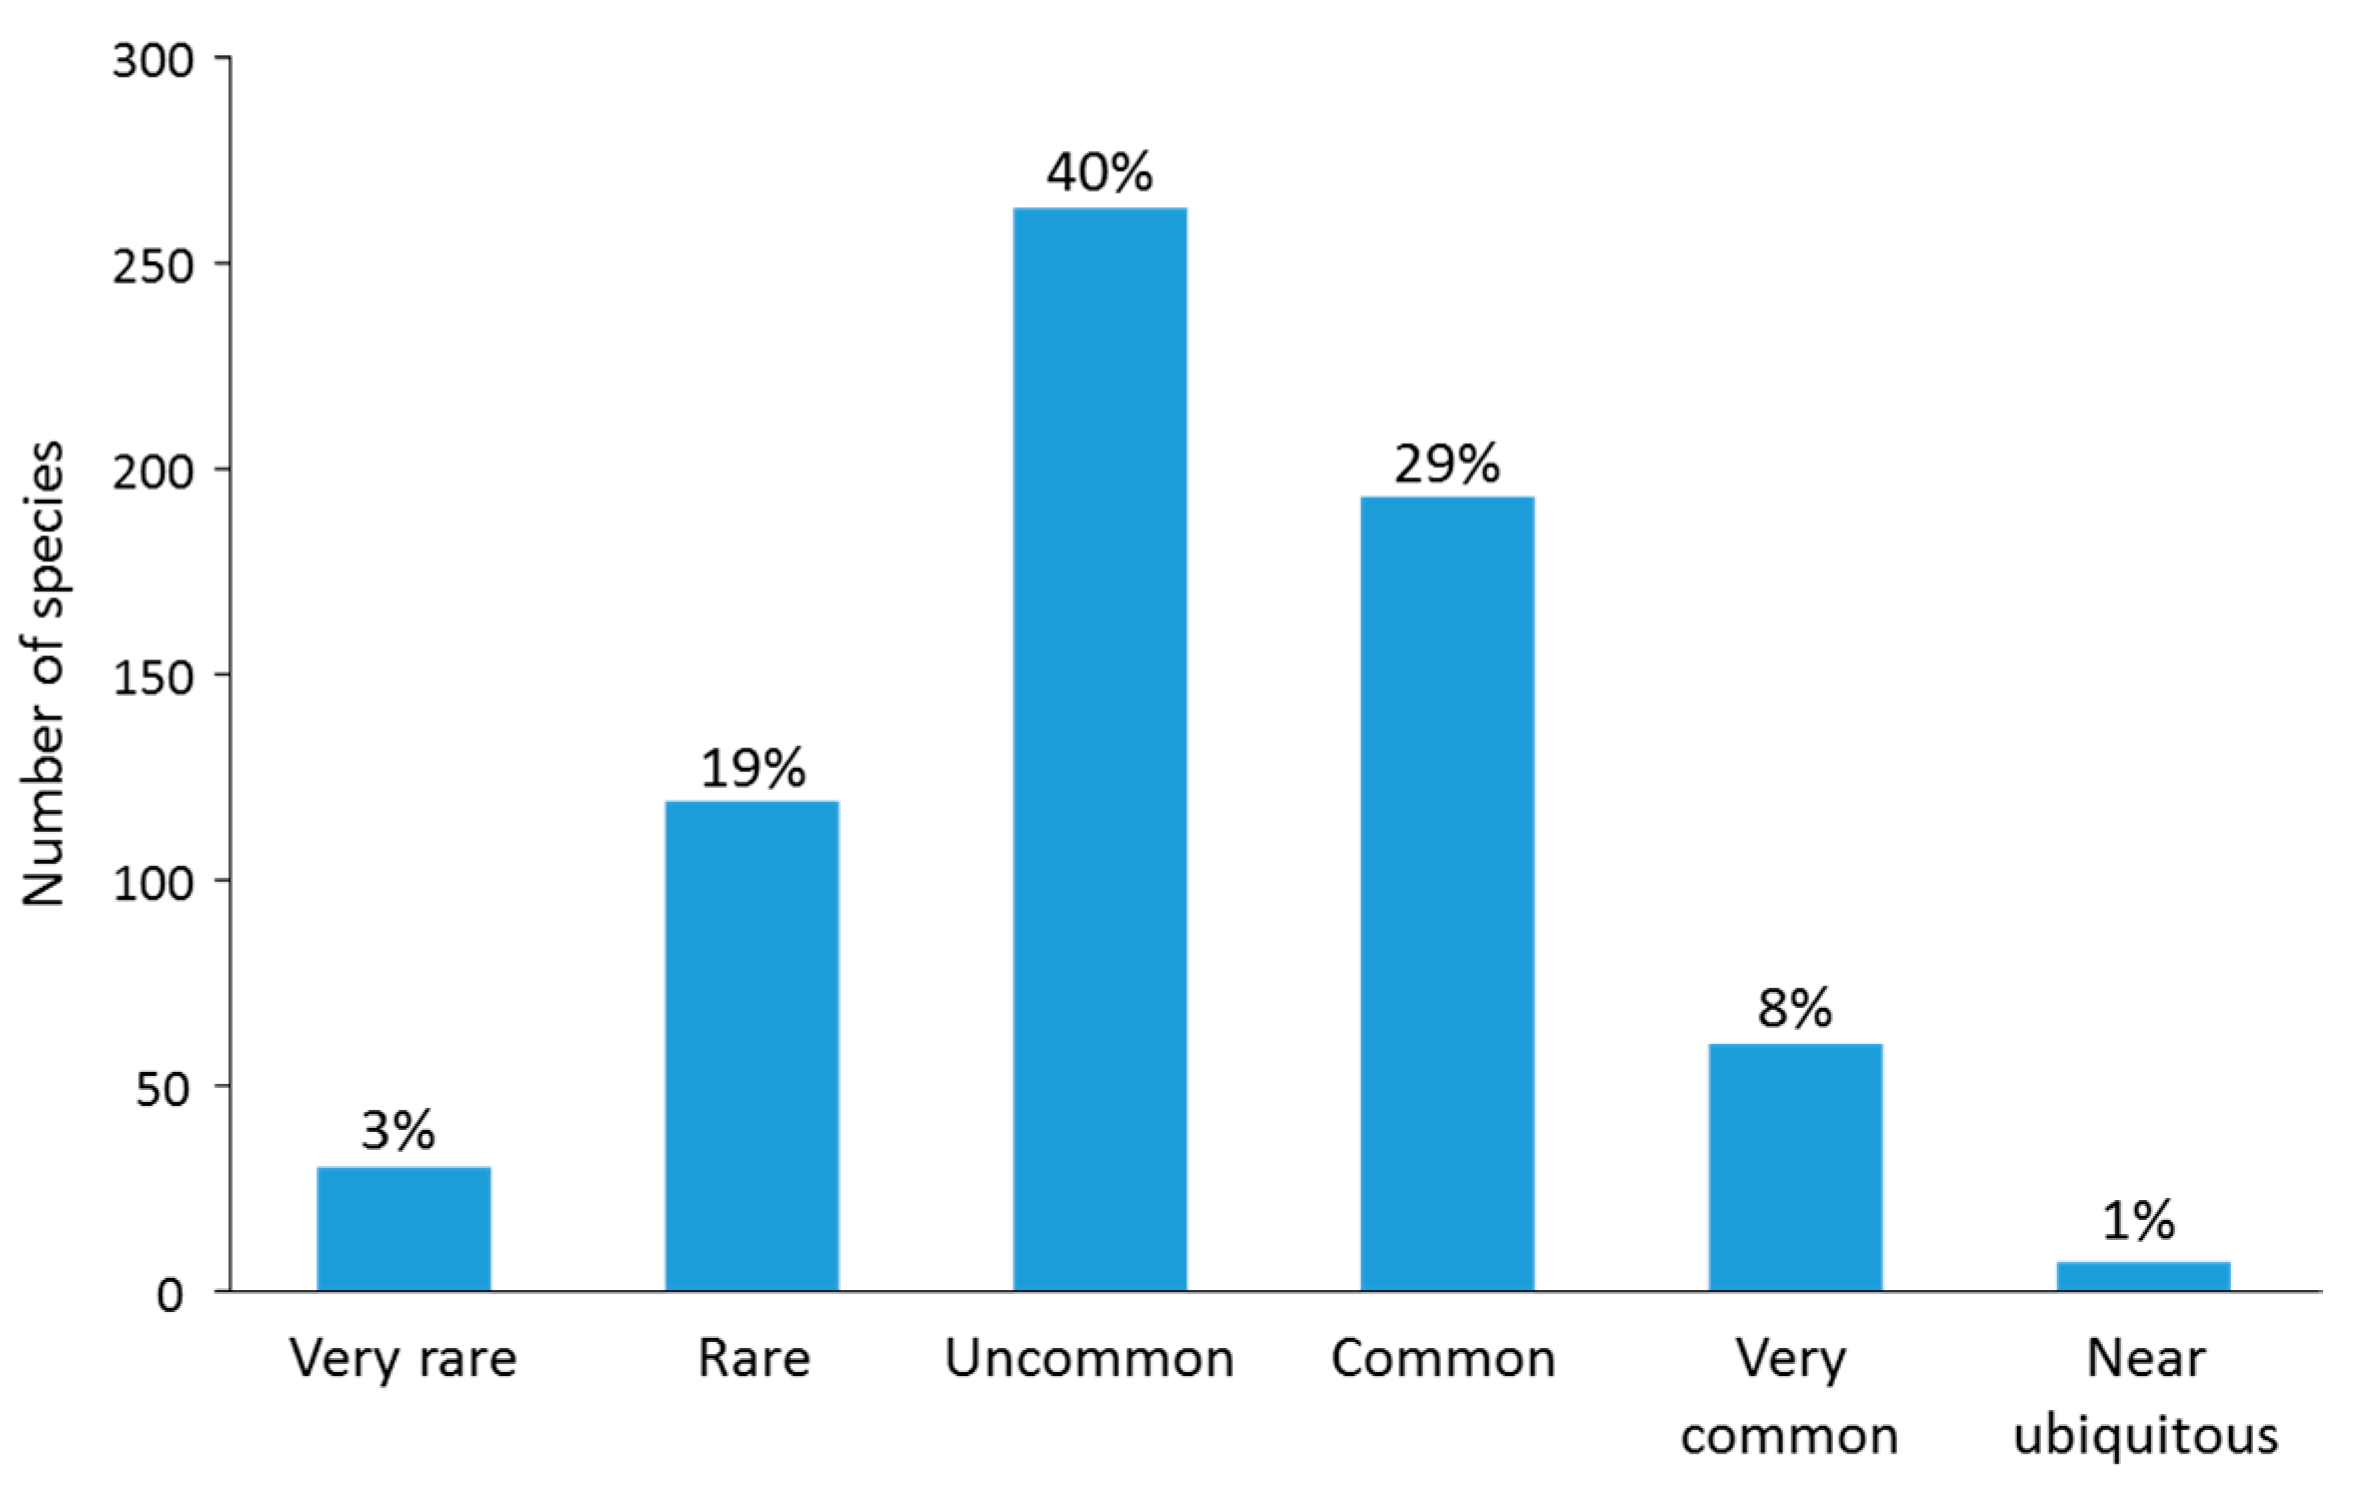
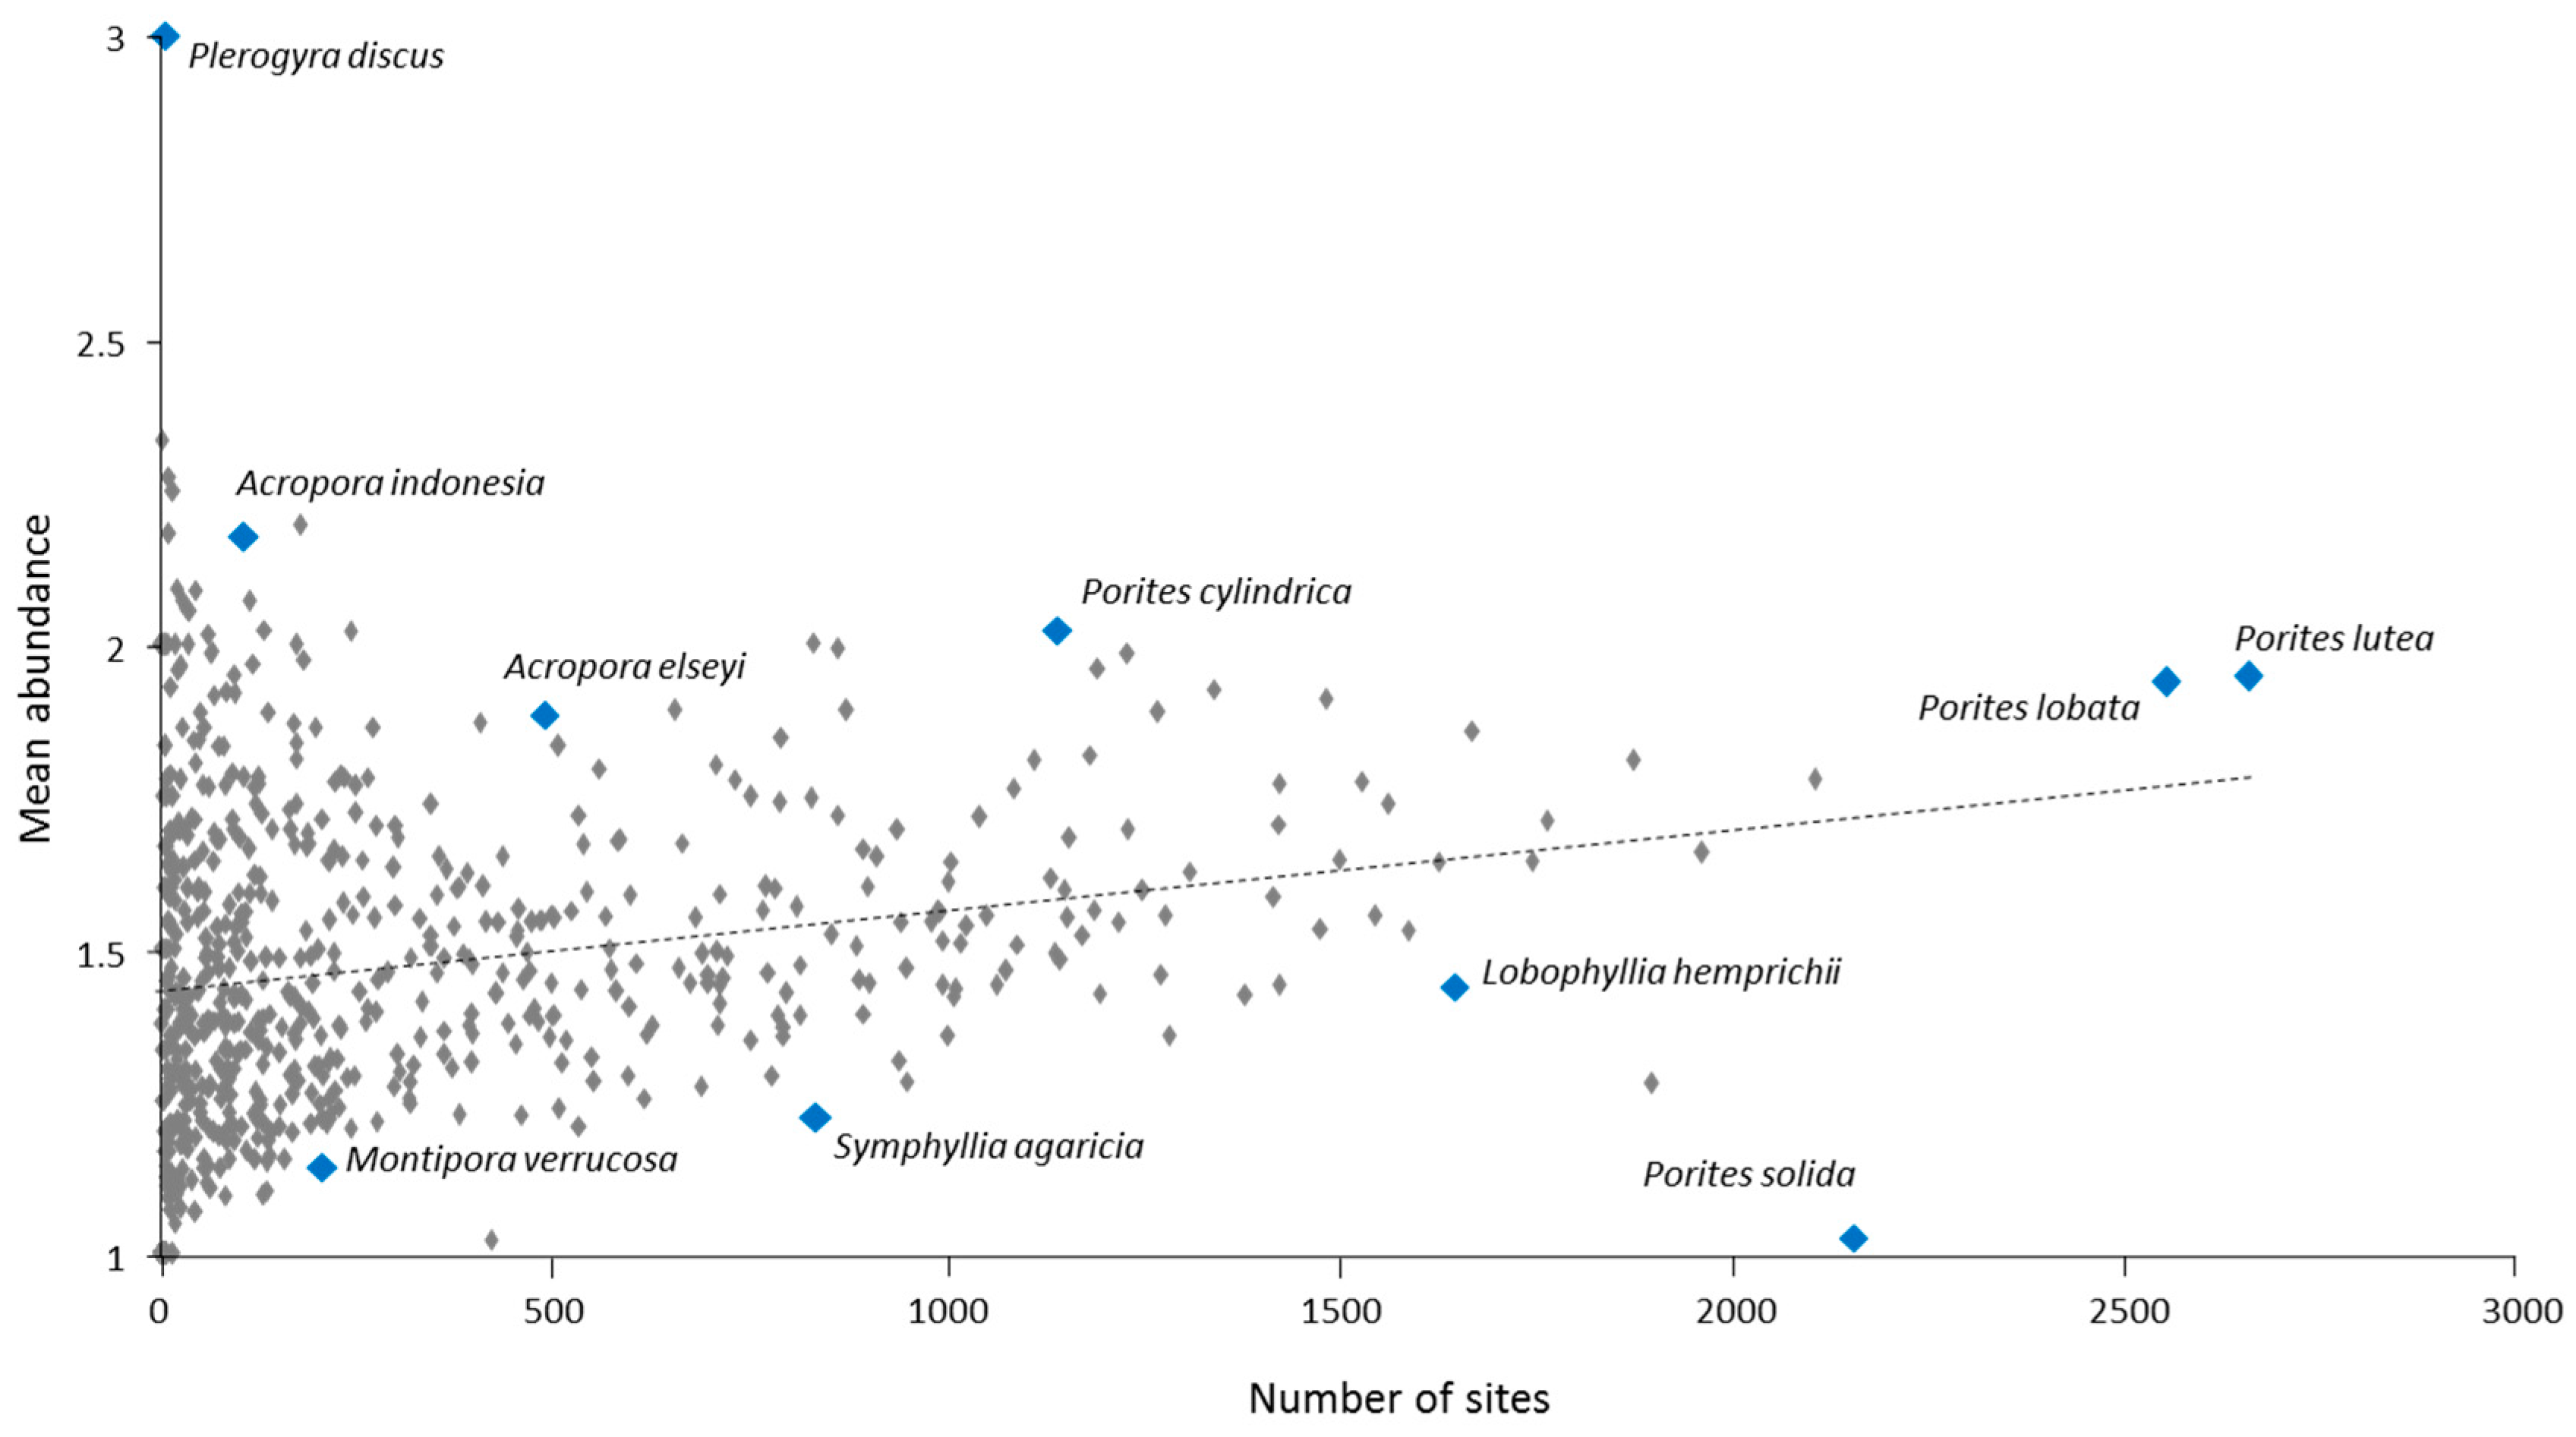
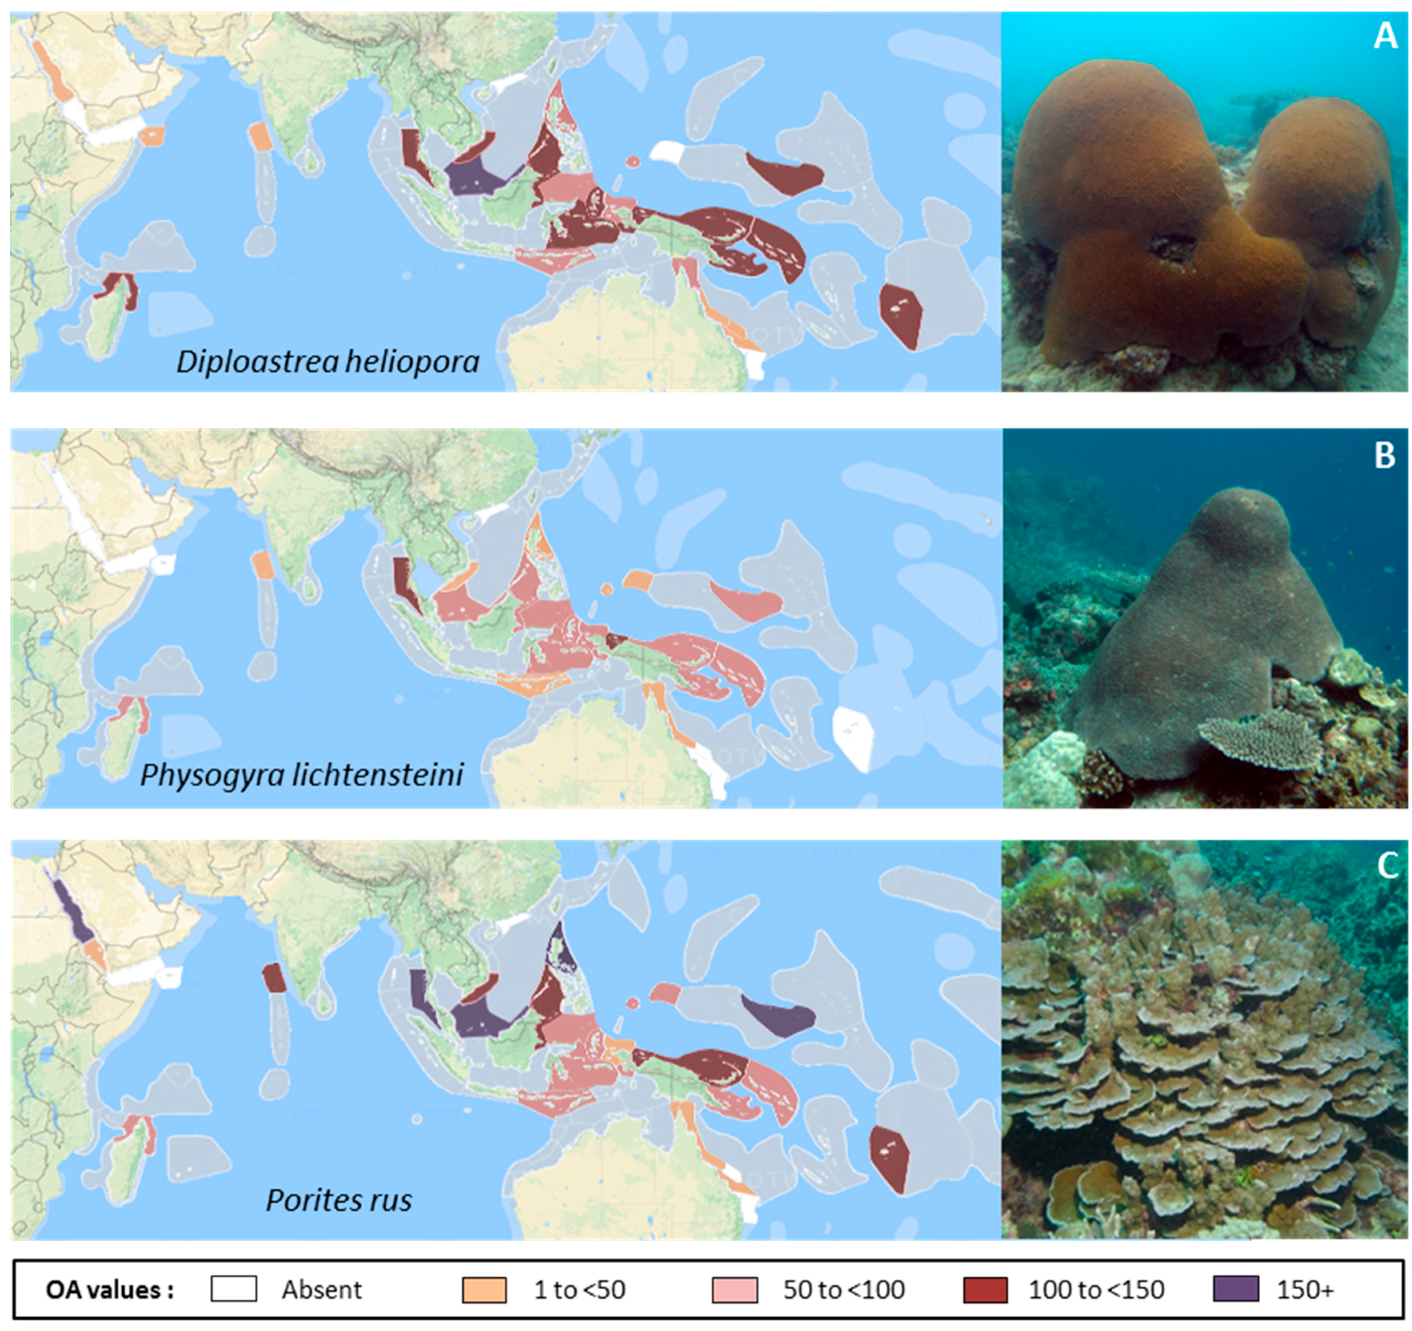
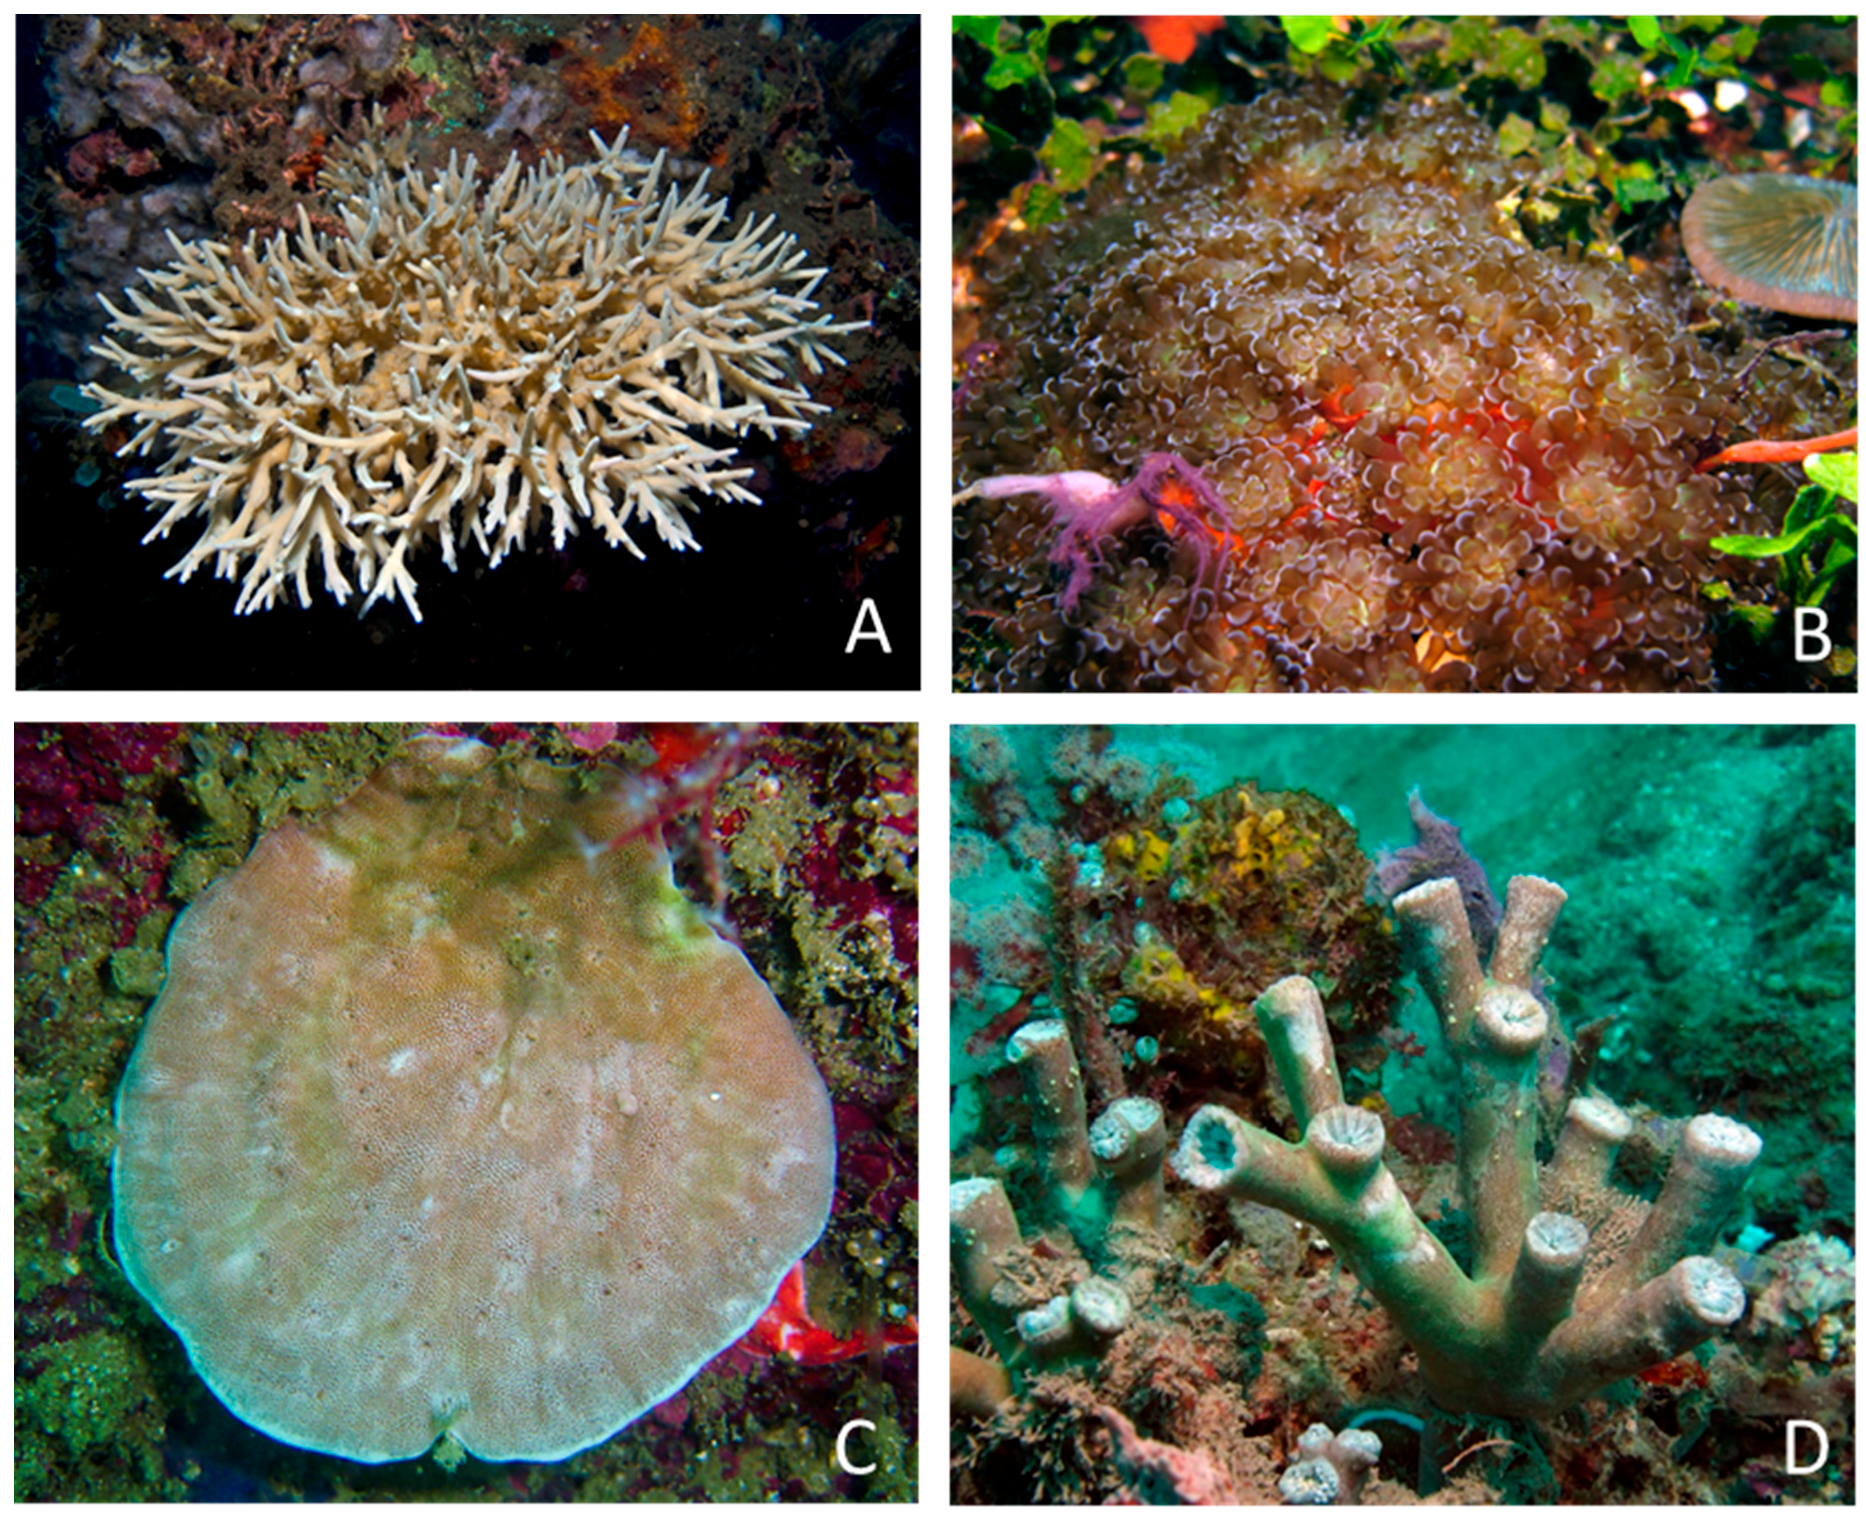
Table 1.
Summary of broad locations surveyed in each ecoregion (ER) using the “Corals of the World” ER names, together with estimated ecoregional and site coral species richness.
Table 1.
Summary of broad locations surveyed in each ecoregion (ER) using the “Corals of the World” ER names, together with estimated ecoregional and site coral species richness.
| ER Name, Number | Main Survey Locations (and Countries) | Survey Year(s) | No. of Sites | Species Richness: ER Total Number of Spp.; Site Mean (SD) and Range Across Sites |
|---|---|---|---|---|
| Red Sea north-central, ER 2 | Mainland coast and islands from near Jeddah north to Jordan border (Saudi Arabia) | 1997–1999 | 145 | 240; 60 (15) |
| 22–98 | ||||
| Red Sea south, ER 3 | Mainland coast and islands from near Saudi Arabian border south to Bab Al Mandeb (Yemen) | 1994–1995 | 43 | 166; 34 (17) |
| 3–67 | ||||
| Socotra Archipelago, ER 7 | Socotra, Abd al Kuri, Samha and Darsa islands and islets (Yemen) | 1997–1999 | 93 | 254; 44 (18) |
| 8–94 | ||||
| Gulf of Aden, ER 140 | Mainland coast and islands of Bir Ali and Balhaf area and Sikha Isl. (Yemen) | 1998 | 13 | 98; 36 (8) |
| 28–51 | ||||
| Lakshadweep, ER 20 | Kadmat and Amini Islands, Arabian Sea (India) | 2000 | 14 | 119; 36 (18) |
| 0–66 | ||||
| Madagascar north, ER 15 | Nosy Be area, from Nosy Iranja north to Nosy Hao (Madagascar) | 2003 | 36 | 292; 90 (23) |
| 33–125 | ||||
| Andaman Sea, ER 26 | Phuket area, mainland coast and islands from near Palong and Koh Phi Phi north to Similan and Koh Surin (Thailand) | 2005 | 54 | 290; 65 (18) |
| 15–104 | ||||
| Vietnam south, ER 48 | Nha Trang Bay, Nui Chua National Park, Con Dao islands (Vietnam) | 2003–2005 | 97 | 381; 92 (21) |
| 40–148 | ||||
| Sunda Shelf, ER 145 | Patch reefs and coastal islands (Brunei Darussalam), Anambas island group (Indonesia) | 2008–2009, 2012, 2014 | 103 | 467; 115 (29) |
| 21–187 | ||||
| Hong Kong, ER 51 | Hong Kong islands and mainland (China) | 2001 | 240 | 78; 20 (12) |
| 3–45 | ||||
| Philippines north, ER 45 | Batangas Bay – Verde Passage, Luzon (Philippines) | 2007 | 16 | 348; 127 (23) |
| 80–156 | ||||
| Pohnpei and Kosrae, Micronesia, ER 65 | Pohnpei island, Ant and Pakin Atolls (Federated States of Micronesia) | 2005 | 71 | 320; 56 (15) |
| 16–85 | ||||
| Yap Islands, Micronesia, ER 63 | Ngulu and Ulithi Atolls, Yap (Federated States of Micronesia) | 2007 | 54 | 204; 57 (12) |
| 21–78 | ||||
| Palau, ER 61 | North Reef, Velasco and Kayangel Atolls (Palau) | 2009 | 51 | 333; 89 (22) |
| 10–141 | ||||
| Sulu Sea, ER 43 | Derawan, East Kalimantan, including Berau Delta area, from Panjang area south to Kakaban Isl., Melalungan and Muaras Atolls and Seliman Bay (Indonesia), El Nido area and north Palawan mainland and islands (Philippines) | 2004, 2009 | 149 | 505; 123 (28) |
| 43–183 | ||||
| Lesser Sunda Islands and Savu Sea, ER 33 | Bali and Nusa Penida, west Lombok, Komodo, West Timor and Roti (Indonesia), west and north coasts and Atauro Isl. (Timor Leste) | 1995, 2006, 2008, 2011–2012, 2016 | 248 | 490; 75 (32) |
| 2–164 | ||||
| Celebes Sea, ER 42 | Bunaken islands and North Sulawesi coast, Bangka Isl., Lembeh Strait, and Sangihe-Talaud islands including Tahulandang, Siao, Sangihe, Karakelong and the Nanusa group (Indonesia) | 2000, 2004–2005 | 160 | 475; 79 (29) |
| 24–171 | ||||
| Banda Sea and Moluccas, ER 36 | Banda islands including Banda Neira, Pulau Run, Ai and Hatta, and Wakatobi islands including Pulau Wangiwangi and Tomea, Koro Maha and Kaledupa Atolls (Indonesia) | 2003–2004 | 86 | 416; 78 (15) |
| 47–133 | ||||
| Halmahera, ER 41 | Halmahera west, north and east coasts from Ternate to Buli Bay and Morotai (Indonesia) | 1997, 2008 | 89 | 472; 102 (46) |
| 30–224 | ||||
| Raja Ampat, Papua, ER 40 | All main islands and offshore reefs, including Misool, Kofiau, Batanta, Gag, Wayag, Kawe and Waigeo Isl., Papua (Indonesia) | 2002 | 94 | 478; 87 (26) |
| 19–165 | ||||
| Papua south-west coast, ER 38 | Fak Fak – Kaimana and Triton Bay coasts and islands, Papua (Indonesia) | 2006 | 68 | 473; 117 (40) |
| 28–205 | ||||
| Cenderawasih Bay, Papua, ER 39 | Biak, Numfoor and Yapen islands and inner bay (Indonesia) | 2006 | 66 | 475; 122 (32) |
| 70–215 | ||||
| Bismarck Sea, New Guinea, ER 69 | New Britain and New Ireland, including Kimbe and Stettin Bays, Manus Isl., Tigak area and New Hanover Isl. (Papua New Guinea) | 2002, 2004, 2006 | 155 | 465; 95 (24) |
| 41–150 | ||||
| Milne Bay, Papua New Guinea, ER 71 | Mullins Harbour area, Goodenough and Collingwood Bays, d’Entrecasteaux and Amphlett Island groups, Fergusson and Normanby Isl. (Papua New Guinea) | 2000, 2007 | 85 | 432; 89 (21) |
| 43–150 | ||||
| Solomon Islands and Bougainville, ER 70 | Main island groups including Florida, Isabel, Choiseul, Shortlands, New Georgia, Russell, Guadalcanal and Makira Isl. (Solomon Islands) | 2005 | 114 | 442; 91 (20) |
| 42–143 | ||||
| Great Barrier Reef far north and Torres Strait, ER 73 | Princess Charlotte Bay, nearshore islands and reefs (Australia) | 2001, 2011 | 32 | 329; 89 (23) |
| 37–133 | ||||
| Great Barrier Reef north-central, ER 74 | Lizard Island area south to Whitsunday Islands, including nearshore, mid- and outer continental shelf reefs (Australia) | 1994–1997, 2001–2002, 2011 | 582 | 369; 46 (25) |
| 0–129 | ||||
| Great Barrier Reef south-east, Pompey and Swain Reefs, ER 76 | Pompey reefs (Australia) | 2002 | 3 | 148; 92 (10) |
| 83–102 | ||||
| Great Barrier Reef south, ER 77 | Percy Islands south to Keppel Islands, including nearshore and mid continental shelf reefs (Australia) | 1995, 2002 | 43 | 216; 40 (18) |
| 6–84 | ||||
| Moreton Bay, east Australia, ER 78 | Hervey Bay and Sunshine Coast (Australia) | 2008-10 | 25 | 114; 36 (14) |
| 16–59 | ||||
| Fiji, ER 101 | Naitauba Isl., Taveuni Isl., Viti Levu Isl. (Fiji) | 2010, 2012 | 46 | 344; 75 (28) |
| 30–136 |
Table 2.
Methodological considerations and constraints, modified from Veron et al. [3].
Table 2.
Methodological considerations and constraints, modified from Veron et al. [3].
| Issue | Our Approach |
|---|---|
| Field survey method: estimating local and regional richness | All methods have their advantages and limitations. Ours is based on a long-established approach to rapid ecological assessment, pioneered by terrestrial botanists and adapted to coral reefs [24]. It does not deliver quantitative estimates of species’ abundance, but does provide robust “semi-quantitative” estimates. It is more effective than traditional quantitative methods in estimating local and regional species richness, facilitating the active searching for species at each site, rather than being restricted to a defined quadrat area or transect line. At site level, the present method has regularly returned a two- to three-fold increase in coral species records in comparison with line transects conducted concurrently (e.g., Red Sea, Great Barrier Reef and Vietnam, L.M. DeVantier unpublished; Socotra Islands [27]). |
| Taxonomic framework | Despite recent advances stabilizing coral taxonomy (e.g., taxonomic works cited above), substantial taxonomic uncertainty remains, as demonstrated by various recently published classifications and synonymies [2,53,55,61,62,64,65,66]. This has arisen, in part, because of differences between traditional morphology-based approaches and those employing molecular genetics. These nomenclatural issues are relevant mainly at taxonomic levels higher than species, although "name games” continue, and the placement of certain species within particular genera remains contentious. We have, as far as practicable, included species accepted in the major taxonomic revisions that preceded or were published over the period of this study (i.e., up to 2016), some minor specific nomenclatural differences notwithstanding. With some modification, our framework follows that of Veron et al. [3], as included in the open access website [1]. |
| Species identification and inter-observer variability | Our dataset has been compiled by experienced surveyors, mainly Emre Turak and Lyndon DeVantier, working together or independently, with assistance in particular ERs from Terry Done, Mary Wakeford and Denise McCorry. Use of standard reference works, museum collections, extensive underwater photography and limited collection of specimens has minimized variability as far as practicable. Juvenile corals < 5 cm diameter, particularly in the speciose genera Acropora, Montipora and Porites, pose particular problems, and unless identity was certain, these were not recorded in our dataset. Having adopted a cautious approach to the issue of inter-observer variability, we have not tried to incorporate similar datasets from other researchers in the present study, although we have referred to them for comparison (Table S4). |
| Discrepancies between published ER species lists and abundance data | The abundance data were compiled during our site surveys, and as far as practicable subsequently updated from photography and specimens. Published records for certain species in particular ERs were also based on non-site observations, and hence may not be supported by our site abundance data. |
| Estimating rarity | Because of the taxonomic and survey difficulties noted above (see Table S1), we consider that our abundance estimates for a few species are unreliable. That is, their true abundance may be higher than documented here because of field identification issues and occurrence in cryptic locations or habitats poorly surveyed. |
| Sampling effort among ecoregions | With the notable exceptions of North Philippines (16 sites), Lakshadweep (14 sites), Gulf of Aden (13 sites) and the Pompey and Swain Reefs (3 sites) of Australia’s Great Barrier Reef (GBR), sample sizes within ecoregions, although not standardized, were generally sufficient to approach asymptotic species richness (Figure 2). Our dataset is strongly focused on two of the main "centres of diversity” of reef corals, the CT and Arabia, and two nearby regions, notably eastern Australia and the central-western Pacific. Our dataset does not include two regions of major species’ attenuation, be they latitudinal (e.g., Ryukyu Islands—Japan, Western Australia) or longitudinal (e.g., Central – Far Eastern Pacific). These host regional endemics not surveyed in the present study. |
| Ecoregion boundaries | Boundaries were based on the best information available, both published and unpublished [3], but have different levels of support. Our dataset can, however, be interrogated at much smaller geographic scales, an undertaking largely beyond the scope of the present analysis. This is a major objective for future development of the "Corals of the World” website [1]. |
| Distribution ranges | Despite major recent advances in coral biogeography, range boundaries remain "fuzzy”, disjunctions are poorly understood, and ranges are better documented for some species than others. Recently described species typically have highly restricted distributions initially, often only the type locality. Ranges may, or may not, be extended with further work. |
| Sampling effort across habitats | Our surveys were focused on reef slopes, crests and outer-mid reef flats, and typically limited to water depths of less than 50 m or to the base of the reef slope if shallower. We were unable to survey inner reef flats in water depths < 0.5 m. |
| True and false absences | We do not assume that a species missing from our inventories in a particular ER is actually absent there, even though our surveys covered a range of habitats. |
| Estimating individual species abundance ranks for massive Porites | Except where specimens were collected, we were unable to identify the large colony-forming massive Porites to species-level in the field. The approach taken here (Table 3) provides derived estimates at species level, the best that can be achieved from our dataset. |
Table 3.
Rules for estimating specific abundances for 6 species of massive Porites in the ERs in which each species occurs [2,3]. The actual site abundance scores for Massive Porites (top row of table) were converted to the species-specific scores listed below.
| Taxon | Site Abundance Score | ||||
|---|---|---|---|---|---|
| Massive Porites | 1 | 2 | 3 | 4 | 5 |
| Porites lobata | 1 | 2 | 2 | 3 | 4 |
| Porites lutea | 1 | 2 | 2 | 3 | 4 |
| Porites australiensis | 0 | 1 | 2 | 2 | 3 |
| Porites myrmidonensis | 0 | 0 | 2 | 3 | 3 |
| Porites solida | 0 | 1 | 1 | 1 | 2 |
| Porites mayeri | 0 | 0 | 1 | 1 | 1 |
Table 4.
Coral species recorded only from deep or shallow sites. * indicates taxonomic uncertainty and/or identification issue (see Table S1). Overall Abundance (OA) scores and International Union for Conservation of Nature (IUCN) Red List rankings are also listed, where NA—Not Assessed; DD—Data Deficient; LC—Least Concern; NT—Near Threatened; Vu—Vulnerable; En—Endangered. 1 Assessed in Red List as Cynarina lacrymalis. 2 Assessed in Red List as Acropora rambleri. 3 Assessed in Red List as Lithophyllon ranjithi. 4 Assessed in Red List as Parasimplastrea sheppardi. 5 Main distribution range outside surveyed ERs. Codes in parentheses are the IUCN Red List criteria [70].
| Deep Sites | OA Score | IUCN Red List | Shallow Sites | OA Score | IUCN Red List |
|---|---|---|---|---|---|
| Acanthophyllia deshayesiana *,1 | 0.1 | NT | Acropora bushyensis | 0.23 | LC |
| Acropora fragilis 2 | 0.07 | DD | Acropora pruinosa | 1.27 | DD |
| Acropora natalensis * | 0.13 | DD | Acropora forskali * | 0.26 | DD |
| Acropora pichoni | 0.75 | NT | Acropora rufus * | 0.1 | DD |
| Acropora rongelapensis | 0.26 | DD | Acropora schmitti | 0.03 | DD |
| Acropora roseni | 0.03 | En (A4ce) | Acropora sirikitiae | 0.13 | NA |
| Acropora rudis | 0.16 | En (A4ce) | Acropora spathulata | 2.83 | LC |
| Acropora russelli | 0.52 | Vu (A4c) | Acropora torresiana | 0.62 | DD |
| Acropora simplex | 1.4 | Vu (A4ce) | Acropora tumida | 2.5 | DD |
| Acropora stoddarti | 0.07 | DD | Astreopora cenderawasih | 0.13 | NA |
| Acropora tenella | 0.72 | Vu (A4ce) | Echinopora irregularis | 0.03 | DD |
| Craterastrea levis | 0.16 | NA | Leptoseris kalayaanensis | 0.03 | NA |
| Echinophyllia tarae * | 0.03 | NA | Micromussa diminuta | 0.03 | DD |
| Echinopora robusta | 0.03 | Vu (A4c) | Montipora aspergillus | 0.03 | DD |
| Echinopora tiranensis | 0.03 | DD | Montipora echinata | 0.07 | DD |
| Euphyllia baliensis | 0.07 | NA | Montipora gaimardi | 0.52 | Vu (A4c) |
| Horastrea indica 5 | 0.13 | Vu (A4c) | Montipora pachytuberculata | 0.07 | DD |
| Isopora togianensis | 0.13 | En (A4ce) | Montipora saudii | 0.16 | NT |
| Leptoseris amitoriensis | 0.13 | NT | Pocillopora capitata *,5 | 0.23 | LC |
| Lithophyllon lobata 3 | 0.46 | En (A4c; B2ab (ii,iii)) | Pocillopora fungiformis | 0.39 | En (A4c) |
| Montipora orientalis | 0.03 | Vu (A4c) | Polycyathus chaishanensis * | 0.13 | NA |
| Nemenzophyllia turbida | 0.42 | Vu (A4cd) | Porites cocosensis | 0.16 | Vu (A4cde) |
| Parasimplastrea omanensis 4 | 0.39 | En (A4c) | Porites cumulatus | 1.6 | Vu (A4cde) |
| Plerogyra discus | 0.1 | Vu (A4c) | Porites eridani | 0.7 | En (A4cde) |
| Stylocoeniella cocosensis | 0.1 | Vu (A4c) | Porites ornata * | 0.7 | En (A4cde) |
Table 5.
Overall Abundance score (from a maximum value of 500) for the 30 highest scoring reef-building corals over 3075 sites across the IWP ERs from 1994–2016. Means and SD were calculated for only those ERs in which each species was recorded. IUCN Red List assessments are also shown, where LC = Least Concern, and NT = Near threatened. * Assessed in Red List as Acropora formosa.
| Coral Species | Overall Abundance Score | Mean OA Score Across ERs (SD) | Percent of 31 ERs | IUCN Red List |
|---|---|---|---|---|
| Porites lutea | 173.7 | 178.0 (44.3) | 100 | LC |
| Porites lobata | 165.1 | 179.2 (40.9) | 97 | LC |
| Galaxea fascicularis | 125.0 | 141.1 (51.4) | 94 | NT |
| Goniastrea pectinata | 113.3 | 134.3 (58.6) | 97 | LC |
| Platygyra daedalea | 108.6 | 129.5 (49.5) | 97 | LC |
| Stylophora pistillata | 103.5 | 123.0 (54.2) | 94 | NT |
| Cyphastrea serailia | 100.8 | 106.5 (52.9) | 100 | LC |
| Favia favus | 95.8 | 105.4 (42.3) | 100 | LC |
| Pocillopora verrucosa | 94.7 | 111.0 (48.1) | 90 | LC |
| Pocillopora damicornis | 94.3 | 111.0 (44.5) | 97 | LC |
| Fungia fungites | 90.6 | 101.9 (38.7) | 90 | NT |
| Pavona varians | 90.6 | 119.6 (57.3) | 90 | LC |
| Favites abdita | 89.1 | 92.7 (49.0) | 94 | NT |
| Seriatopora hystrix | 86.2 | 97.7 (59.1) | 84 | LC |
| Favites pentagona | 84.2 | 92.9 (51.2) | 100 | LC |
| Favia matthaii | 82.4 | 94.7 (51.8) | 97 | NT |
| Isopora palifera | 81.5 | 95.4 (38.8) | 87 | NT |
| Porites australiensis | 81.0 | 103.8 (30.9) | 84 | LC |
| Favia pallida | 81.0 | 85.8 (44.9) | 100 | LC |
| Pachyseris speciosa | 80.9 | 99.9 (47.2) | 84 | LC |
| Astreopora myriophthalma | 80.2 | 99.2 (42.9) | 94 | LC |
| Acropora muricata * | 79.9 | 87.8 (38.0) | 94 | NT |
| Lobophyllia hemprichii | 79.9 | 96.2 (34.9) | 94 | LC |
| Porites rus | 78.0 | 101.8 (54.2) | 84 | LC |
| Porites cylindrica | 77.2 | 95.4 (36.2) | 74 | NT |
| Hydnophora exesa | 75.5 | 85.6 (43.6) | 100 | NT |
| Merulina ampliata | 75.0 | 103.0 (40.3) | 81 | LC |
| Porites solida | 75.0 | 90.7 (34.3) | 97 | LC |
| Acropora hyacinthus | 71.7 | 76.0 (53.9) | 94 | NT |
| Echinopora lamellosa | 71.1 | 80.6 (37.4) | 90 | LC |
Table 6.
Abundance scores and IUCN Red List assessments for species of Pectinia. Codes in parentheses are the IUCN Red List criteria [70].
Table 6.
Abundance scores and IUCN Red List assessments for species of Pectinia. Codes in parentheses are the IUCN Red List criteria [70].
| Species of Pectinia | Occurrence (% of sites) | Mean Abundance | Overall Abundance | IWP OA Category | IUCN Red List |
|---|---|---|---|---|---|
| Pectinia africanus | 0.7 | 1.3 | 0.9 | Rare | Vu (A4c) |
| Pectinia alcicornis | 16.6 | 1.6 | 25.9 | Common | Vu (A4c) |
| Pectinia ayleni | 3.1 | 1.4 | 4.4 | Uncommon | NT |
| Pectinia elongata | 1.0 | 1.6 | 1.6 | Uncommon | NT |
| Pectinia lactuca | 31.7 | 1.5 | 46.5 | Common | Vu (A4cd) |
| Pectinia maxima | 3.9 | 1.5 | 5.7 | Uncommon | En (A4cd) |
| Pectinia paeonia | 15.7 | 1.5 | 23.0 | Common | NT |
| Pectinia pygmaeus | 0.5 | 1.8 | 0.8 | Rare | NT |
| Pectinia teres | 4.2 | 1.8 | 7.5 | Uncommon | NT |
Table 7.
Species recorded from 5 sites or less, which may qualify under IUCN threatened category criteria (e.g., EN B1a, VU B1a, VU D2) in terms of extent of occurrence and population size (i.e., population very restricted in the number of locations, typically five or fewer, such that it is prone to the effects of human activities or stochastic events within a very short time period in an uncertain future). The IUCN Red List classification [19] is also provided, where: En—Endangered, Vu—Vulnerable, NT—Near Threatened, LC—Least Concern, DD—Data Deficient, NA—Not Assessed. Codes in parentheses are the IUCN Red List criteria [70]. Ratings for vulnerability to climate change [22], assessed under criteria of Sensitivity (Se), Unadaptability (Ua) and Exposure (Ex), are also provided, where H = high, L = low and U = unknown. * Species with main distribution ranges outside the present study. Species for which abundance estimates were considered unreliable (Table S1) were excluded.
| Species | O (% of sites) | Mean Abn. | OA | Form of Rarity | IUCN Red List Classification | Climate Change Vulnerability | ||
|---|---|---|---|---|---|---|---|---|
| Se | Ua | Ex | ||||||
| Acropora bushyensis | 0.1 | 2.3 | 0.23 | Diffusive | LC | H | L | H |
| Acropora fragilis | 0.07 | 1 | 0.07 | Diffusive | DD (as A. rambleri) | H | L | L |
| Acropora roseni | 0.03 | 1 | 0.03 | Geo-suffusive | En (A4ce) | H | H | H |
| Acropora rudis | 0.13 | 1.25 | 0.16 | Geo-suffusive | En (A4ce) | H | H | L |
| Acropora sirikitiae | 0.07 | 2 | 0.13 | Geo-suffusive | NA | NA | ||
| Acropora teres | 0.03 | 1.5 | 0.1 | Diffusive | DD | H | L | L |
| Alveopora viridis | 0.13 | 1 | 0.13 | Diffusive | NT | H | H | H |
| Anacropora pillai | 0.13 | 1.5 | 0.2 | Diffusive | DD | H | L | H |
| Astreopora cenderawasih | 0.07 | 2 | 0.13 | Geo-suffusive | NA | NA | ||
| Astreopora scabra | 0.13 | 1.25 | 0.16 | Diffusive | LC | H | H | L |
| Craterastrea levis | 0.16 | 1 | 0.16 | Habitat-suffusive | NA | NA | ||
| Duncanopsammia axifuga | 0.16 | 1.2 | 0.2 | Diffusive | NT | H | L | H |
| Echinopora ashmorensis | 0.16 | 1.4 | 0.23 | Diffusive | Vu (A4c) | H | L | H |
| Echinopora irregularis | 0.03 | 1 | 0.03 | Geo-suffusive | DD | H | H | U |
| Echinopora robusta | 0.03 | 1 | 0.03 | Geo-suffusive | Vu (A4c) | H | L | L |
| Echinopora tiranensis | 0.03 | 1 | 0.03 | Geo-suffusive | DD | H | H | U |
| Euphyllia baliensis | 0.03 | 2 | 0.07 | Geo- and habitat-suffusive | NA | NA | ||
| Fungia puishani | 0.16 | 1.6 | 0.26 | Geo-suffusive | DD | H | H | L |
| Goniopora cellulosa * | 0.07 | 1 | 0.07 | Geo-suffusive | Vu (A4c) | H | H | H |
| Goniopora polyformis | 0.13 | 1.5 | 0.2 | Diffusive | Vu (A4c) | H | L | H |
| Goniopora sultani | 0.13 | 1 | 0.13 | Geo-suffusive | LC | H | H | U |
| Horastrea indica * | 0.1 | 1.33 | 0.13 | Geo-suffusive | Vu (A4c) | H | H | L |
| Isopora togianensis | 0.07 | 2 | 0.13 | Geo-suffusive | En (A4ce) | H | L | H |
| Leptoseris amitoriensis | 0.13 | 1 | 0.13 | Diffusive | NT | H | L | H |
| Leptoseris kalayaanensis | 0.03 | 1 | 0.03 | Geo-suffusive | NA | NA | ||
| Micromussa diminuta | 0.03 | 1 | 0.03 | Diffusive | DD | H | H | H |
| Montipora aspergillus | 0.03 | 1 | 0.03 | Geo-suffusive | DD | H | H | U |
| Montipora echinata | 0.07 | 1 | 0.07 | Geo-suffusive | DD | H | H | U |
| Montipora orientalis | 0.03 | 1 | 0.03 | Diffusive | Vu (A4c) | H | H | H |
| Montipora pachytuberculata | 0.07 | 1 | 0.07 | Geo-suffusive | DD | H | H | U |
| Montipora saudii | 0.13 | 1.25 | 0.16 | Geo-suffusive | NT | H | H | U |
| Montipora verrilli * | 0.07 | 1 | 0.07 | Diffusive | DD | H | H | L |
| Plerogyra discus | 0.03 | 3 | 0.1 | Habitat-suffusive | Vu (A4c) | H | L | H |
| Pocillopora capitata * | 0.13 | 1.75 | 0.23 | Range extension to Fiji from Eastern Pacific | LC | H | L | L |
| Porites cocosensis | 0.13 | 1.25 | 0.16 | Diffusive | Vu (A4cde) | H | H | H |
| Porites eridani | 0.07 | 1 | 0.07 | Diffusive | En (A4cde) | H | L | H |
| Porites somaliensis * | 0.07 | 1 | 0.07 | Geo-suffusive | NT | H | H | L |
| Sclerophyllia maxima * | 0.13 | 1.5 | 0.2 | Geo-suffusive | NT (as Acanthastrea maxima) | H | H | U |
| Stylocoeniella cocosensis | 0.1 | 1 | 0.1 | Diffusive | Vu (A4c) | H | L | H |
| Stylophora madagascarensis | 0.16 | 1.4 | 0.23 | Geo-suffusive | En (A4c) | H | H | H |
© 2017 by the authors. Licensee MDPI, Basel, Switzerland. This article is an open access article distributed under the terms and conditions of the Creative Commons Attribution (CC BY) license (http://creativecommons.org/licenses/by/4.0/).
Share and Cite
MDPI and ACS Style
DeVantier, L.; Turak, E. Species Richness and Relative Abundance of Reef-Building Corals in the Indo-West Pacific. Diversity 2017, 9, 25. https://doi.org/10.3390/d9030025
AMA Style
DeVantier L, Turak E. Species Richness and Relative Abundance of Reef-Building Corals in the Indo-West Pacific. Diversity. 2017; 9(3):25. https://doi.org/10.3390/d9030025
Chicago/Turabian StyleDeVantier, Lyndon, and Emre Turak. 2017. "Species Richness and Relative Abundance of Reef-Building Corals in the Indo-West Pacific" Diversity 9, no. 3: 25. https://doi.org/10.3390/d9030025
Note that from the first issue of 2016, this journal uses article numbers instead of page numbers. See further details here.