Article

Venetian Local Corn (Zea mays L.) Germplasm: Disclosing the Genetic Anatomy of Old Landraces Suited for Typical Cornmeal Mush Production

1
Department of Agronomy, Food, Natural Resources, Animals and Environment, University of Padova, 35020 Legnaro PD, Italy
2
Department of Crop and Soil Sciences, University of Georgia, Athens, GA 30602, USA
*
Author to whom correspondence should be addressed.
Diversity 2017, 9(3), 32; https://doi.org/10.3390/d9030032
Submission received: 14 July 2017 / Revised: 8 August 2017 / Accepted: 13 August 2017 / Published: 16 August 2017
(This article belongs to the Special Issue Plant Genetics and Biotechnology in Biodiversity)

Abstract

:
Due to growing concern for the genetic erosion of local varieties, four of the main corn landraces historically grown in Veneto (Italy)—Sponcio, Marano, Biancoperla and Rosso Piave—were characterized in this work. A total of 197 phenotypically representative plants collected from field populations were genotyped at 10 SSR marker loci, which were regularly distributed across the 10 genetic linkage groups and were previously characterized for high polymorphism information content (PIC), on average equal to 0.5. The population structure analysis based on this marker set revealed that 144 individuals could be assigned with strong ancestry association (>90%) to four distinct clusters, corresponding to the landraces used in this study. The remaining 53 individuals, mainly from Sponcio and Marano, showed admixed ancestry. Among all possible pairwise comparisons of individual plants, these two landraces exhibited the highest mean genetic similarity (approximately 67%), as graphically confirmed through ordination analyses based on PCoA centroids and UPGMA trees. Our findings support the hypothesis of direct gene flow between Sponcio and Marano, likely promoted by the geographical proximity of these two landraces and their overlapping cultivation areas. Conversely, consistent with its production mainly confined to the eastern area of the region, Rosso Piave scored the lowest genetic similarity (<59%) to the other three landraces and firmly grouped (with average membership of 89%) in a separate cluster, forming a molecularly distinguishable gene pool. The elite inbred B73 used as tester line scored very low estimates of genetic similarity (on average <45%) with all the landraces. Finally, although Biancoperla was represented at K = 4 by a single subgroup with individual memberships higher than 80% in almost all cases (57 of 62), when analyzed with an additional level of population structure for K = 6, it appeared to be entirely (100%) constituted by individuals with admixed ancestry. This suggests that the current population could be the result of repeated hybridization events between the two accessions currently bred in Veneto. The genetic characterization of these heritage landraces should prove very useful for monitoring and preventing further genetic erosion and genetic introgression, thus preserving their gene pools, phenotypic identities and qualitative traits for the future.

1. Introduction

The concepts of genetic erosion and conservation of plant genetic resources are rooted in the first decade of the twentieth century. Since then, several authors have warned of the consequences of the reduction of genetic variability in crop species mainly due to the dramatic loss of traditional landraces [1,2,3]. A landrace is an ancient population of a cultivated crop plant that has become adapted to the local conditions and to the agronomic practices of farmers. Most frequently, landraces are characterized by high diversity and thus provide a valuable source for potentially useful traits and an irreplaceable bank of co-adapted genotypes [4]. In practical terms, genetic diversity allows farmers and plant breeders to adapt a crop to heterogeneous and changing environments by, for example, providing it with resistance to pests and diseases [5].
Since modern, highly productive cultivars are irreversibly replacing many traditional varieties, the first priority is to arrest this loss of genetic diversity. Over the last decade, the rediscovery of local and traditional food products in the market has strengthened interest in local varieties. A fascinating case study is represented by “polenta”, a traditional dish of the Italian cuisine, and by the four main corn landraces grown in Veneto (Italy) used for its production: Sponcio, Marano, Biancoperla and Rosso Piave. In the last few years, the demand of “polenta’ from local varieties, has shown a steady increase due to the deeper attention that consumers pay to the autochthonous, locally cultivated crops, usually grown according to low-input agronomic practices, and to their consciousness towards the current dualism existing between conventional and novel foods [6]. In 2016 the total production of maize in Italy was approximately 6.84 million tons [7], and even if the amount destined to the human consumption is very small (few percentage points), the total market value of this product is estimated in millions of euro.
Assessing the genetic diversity and genetic structure of landraces could help to limit genetic erosion as well as to conserve landraces [8]. Several studies have been performed worldwide to assess the genetic diversity of local landraces of corn using molecular markers [9,10,11,12], but as far as we know, only one has been devoted to local varieties of Italian corn [13]. The four main corn landraces grown in Veneto (Italy) and examined in this work, namely, Sponcio, Marano, Biancoperla and Rosso Piave, represent a case study.
Sponcio is an ancient corn variety grown by a consortium of 20 farmers in a small plot that covers approximately 13 hectares in the area of the Val Belluna, specifically in the towns of Feltre, Cesiomaggiore and Santa Giustina [14]. This landrace, distinguishable by its sharp kernels, seems to have been known since the sixteenth century under variants of the name, but the first concrete documentation of its existence is a nineteenth century manuscript [15]. By the 1950s, the production of Sponcio had been reduced, and it was confined to marginal areas. Thanks to a few farmers and millers, the original germplasm was carefully preserved and later used to restart the current production, according to strict sustainable and environmentally friendly regulations determining the stages of cultivation, drying, grinding and packing. The yellow flour is the main ingredient of “polenta”, one of the most typical products of the Belluno cuisine.
An article dated 1939 reports that in 1890 Antonio Fioretti, a farmer from Marano Vicentino (Veneto, Italy), crossed two local varieties, Nostranino and Pignoletto d’Oro, and called this new hybrid Marano [16]. Although Marano was particularly esteemed during the 1970s in Veneto and Friuli Venezia Giulia and widely employed to produce new hybrids (e.g., ITALO 225, ITALO 260 and ITALO 270) and pure lines (Cinquantino San Fermo and Cinquantino Bianchi), the cultivation of this local variety was progressively abandoned and replaced by more productive lines. Currently, it survives only in the area of Val Leogra, specifically in the towns of Marano Vicentino, Malo, Schio, San Vito di Leguzzano, Torrebelvicino, Valli del Pasubio, Santorso and Piovene Rocchette [17]. The “polenta maranelo”, a typical dish of this area, is produced starting from the orange flour of this landrace.
A book published at the end of seventeenth century reports that a white “sorgoturco” [dialectal word referring to corn] was widespread in Veneto at that time, and that white variety probably represents the ancestor of the current Biancoperla [18]. Several documented sources state that this landrace, which owes its name to the vitreous and pearly white color of its kernels, was widely grown (>50,000 hectares) in the eastern part of Veneto and in Friuli Venezia Giulia in the first half of the twentieth century [19]. As with the aforementioned landraces, this local variety was progressively replaced by more profitable corn varieties from the USA immediately after the Second World War. Currently, thanks to a consortium of approximately 13 member producers promoting its conservation, this variety survives on less than 50 hectares in some rural areas of Vicenza, Treviso and the northern part of Padua district. It is strongly appreciated for the production of white “polenta” [20].
Little is known about the fourth landrace, Rosso Piave. Miniscalco [19] reports that, unlike the other three local varieties, this landrace was rarely grown even in the past, since its color permanently soiled mills. Today, it is grown mainly in the Venice area in the towns of Musile di Piave, Fossalta di Piave, Noventa di Piave and San Donà di Piave. Its peculiar burgundy color, which also characterizes its “polenta”—the main derivative product of this landrace—comes from the presence of anthocyanins that have been recently recognized as compounds able to reduce the risk of myocardial infarction [21].
In this study, the genetic diversity of the four main corn landraces in Veneto was assessed by means of simple sequence repeat (SSR) markers. The assembled molecular data were used to evaluate their population genetic structure and their genetic relationships. The characterization of these old local varieties supports a more general discussion of possibilities for avoiding genetic erosion, promoting and safeguarding local populations, thereby maintaining stable seed yields, and preserving phenotype and qualitative identity.

2. Materials and Methods

2.1. Plant Material and Genomic DNA Isolation

Four different Venetian Institutes for Agricultural Research kindly donated the corn samples used in the present study. The germplasm collection conserved in each institute was originally constituted combining hundreds of kernels from as many ears selected on the basis of their morphology. Marano seeds were provided by the “N. Strampelli Institute” (Lonigo, VI, Italy), whereas Sponcio seeds were obtained from the “A. Della Lucia Institute” (Feltre, BL, Italy). The “D. Sartor Institute” (Castelfranco Veneto, TV, Italy) and Veneto Agricoltura (Legnaro, PD, Italy) supplied Biancoperla and Rosso Piave seeds, respectively.
For germination, 40 to 70 seeds of each variety were placed in Petri dishes on two layers of filter paper moistened with water. After fifteen days of incubation, a total of 197 seedlings (64 Marano, 32 Sponcio, 62 Biancoperla and 39 Rosso Piave) were collected and used for the analyses described below. The elite public inbred line B73, initially developed from the Iowa Stiff Stalk Synthetic (BSSS) populations and commonly used for the development of heterotic F1 hybrids, was chosen as reference corn germplasm accession in order to test the relatedness and distinctiveness of the four local varieties with and from modern varieties.
Then, 100 mg of fresh leaf tissue was used to isolate genomic DNA using a DNeasy plant kit (Qiagen, Valencia, CA, USA), following the procedure provided by the suppliers. Electrophoresis on an 0.8% agarose/1× TAE gel containing 1× Sybr Safe DNA stain (Life Technologies, Carlsbad, CA, USA) allowed estimation of the integrity of extracted DNA samples. The purity and quantity of DNA extracts were evaluated with a NanoDrop 2000c UV-Vis spectrophotometer (Thermo Scientific, Pittsburgh, PA, USA).

2.2. Analysis of SSR Markers

PCR amplifications were performed using the M13-tailed SSR method described by Schuelke [22], with some minor modification. Briefly, the amplification procedure is based on a three-primer system consisting of a specific SSR-targeting forward primer with a 5′-M13 tail, a specific SSR-targeting reverse primer and an M13-labelled primer (5′-TTGTAAAACGACGGCCAGT-3′). The set of 10 SSR marker loci investigated in this study was obtained from Register et al. [23] and, based on the highest Polymorphic Information Content (PIC) values, one SSR marker per linkage group was selected (Table 1).
The PCR reaction consisted of a 20 µL final volume containing 1× NH4 Reaction Buffer, 3 mM MgCl2, 1 IU of BioTAQ™ DNA polymerase (Bioline, London, UK), 0.25 mM each dNTPs, 0.25 µM tailed forward primer, 0.75 µM reverse primer, 0.5 µM M13-labelled primer (Invitrogen, Carlsbad, CA, USA), 20 ng of DNA, and dH2O up to the final volume. Amplifications were performed in a 96-well plate using a 9600 thermal cycler (Applied Biosystems, Carlsbad, CA, USA). The following thermal conditions were used: 5 min at 94 °C for the initial denaturing; 5 cycles at 94 °C for 30 s, at 62 °C for 30 s decreasing by 0.8 °C with each cycle, and at 72 °C for 45 s; and 35 cycles at 94 °C for 30 s, 58 °C for 30 s and 72 °C for 45 s. A final extension at 72 °C for 10 min terminated the reaction to fill in any protruding ends of the newly synthesized strands. Capillary electrophoresis with an ABI PRISM 3130xl Genetic Analyzer, adopting LIZ500 as molecular weight standard, was used to assess the PCR products. The size of each peak was determined using Peak Scanner software 1.0 (Applied Biosystems).

2.3. Marker Data Analysis

PIC values were calculated with PICcalc software [24] to estimate the marker allele variation in microsatellite loci in the 197 corn individuals. GenAlEX v. 6.5 [25] and POPGENE v. 1.32 [26] software were used to estimate the number of observed alleles (Na), number of effective alleles (Ne), Shannon’s information index of genetic diversity (I), observed (Ho) and expected (He) heterozygosity according to Nei [27]. The presence of private alleles in each population and the occurrence of locally common alleles, defining as “locally common” those alleles with a frequency higher than 5% in a local population and occurring in less than 25% of all populations examined [28], were also considered.
F-statistics were calculated according to Wright [29] to investigate the variance of heterozygosity in our population at different levels of population structure (i.e., individual, subpopulation and population levels). Inbreeding coefficients were computed to measure the deficiency (positive values) or excess (negative values) of heterozygotes for each assessed microsatellite marker and to assess hierarchical organization of sample individuals. Similarly, inbreeding coefficients were calculated at multilocus level in order to estimate the genetic effect of total population subdivision as proportional reduction in overall heterozygosity due to variation in SSR allele frequencies among different subpopulations [30]. Finally, gene flow (Nm) was calculated from FST.
Genetic similarity (GS) was calculated in all possible pairwise comparisons of individuals by applying the simple matching coefficient [31]. A principal coordinates analysis (PCoA) was applied to compute the first two principal components of the similarity data matrix. All analyses and calculations were conducted using NTSYS-pc v. 2.21q [31]. In addition, pairwise GS values were also used to construct a dendrogram, using the unweighted pair-group arithmetic average (UPGMA) method and PAST software v. 3.14 [32] with 1000 bootstrap repetitions.
The genetic structure of the four landraces was modeled using a Bayesian clustering algorithm implemented in STRUCTURE v. 2.2 [33]. Since no prior knowledge about the origin of the populations under study was available, the “admixture model” was used and then a “correlated allele frequencies model” was selected, because it guarantees that a previously undetected correlation will be identified, without affecting the results if no such correlation exists [34]. Ten replicate simulations were conducted for each value of K, with the number of founding groups ranging from 2 to 22, using a burn-in of 2 × 10⁵ and a final run of 106 MCMC steps. The method described by Evanno et al. [35] was used to evaluate the most likely estimation of K. Estimates of membership were plotted as a histogram using an Excel spreadsheet.

3. Results

3.1. Descriptive Statistics of SSR Marker Loci

All SSR loci were determined to be polymorphic (Table 2). PIC values were considered to estimate the ability of each locus to discriminate among different genotypes and the selected SSR loci scored a mean PIC of 0.50, with a minimum of 0.32 (phi084) and a maximum of 0.71 (umc1075). A total of 36 marker alleles were detected across the four populations with an average number of observed alleles (Na) of 3.6, ranging from 2 (phi084, phi031 and phi016) to 6 (phi127). Moreover, the effective number of alleles (Ne) per locus varied from 1.68 (phi084) to 4.02 (umc1075), as reported in Table 2.
SSR loci were highly polymorphic within each landrace, except for phi084, which was monomorphic in the Marano landrace for a 177 bp marker allele. The same allele was also the most common one overall, being detected in 141 out 197 samples (71.68%, Supplementary Data S1). Six alleles of the 36 were private to single populations. Specifically, Sponcio showed two private alleles, one at the phi057 locus and one at the phi056 locus, while Rosso Piave showed four different allelic variants never detected in the other landraces, three at the phi127 locus and one at the phi024 locus (Supplementary Data S1).
Over all SSR loci, the observed (Ho) and expected (He) heterozygosity estimates were, on average, equal to 0.43 ± 0.12 and 0.58 ± 0.12, respectively (Table 2). The same parameters calculated within each landrace were, on average, equal to 0.43 ± 0.04 and 0.48 ± 0.04, respectively (Table 2). The Shannon’s index (I) was used to characterize population diversity and it was found to be, on average, equal to 0.97 ± 0.30 over all loci and 0.80 ± 0.09 within landraces. The inbreeding coefficient (FIS) had an average value of 0.08 ± 0.04 for SSR loci. Finally, FIT and FST were both positive and, on average, equal to 0.25 ± 0.03 and 0.18 ± 0.03, respectively, while the gene flow (Nm) was equal to 1.62 ± 0.40.
The same F-statistics were then applied to each landrace to assess the genetic effects of total population subdivision as proportional reduction in overall heterozygosity due to variation in SSR allele frequencies among landraces (Table 2). Overall, Wright’s inbreeding coefficients FIS and FIT scored positive values, revealing a general deficiency of heterozygotes across individual accessions and landraces. As displayed in Table 2, reduction of heterozygosity was marked for the two landraces Rosso Piave (FIS = 0.16) and Biancoperla (FIS = 0.15), whereas it was minimal for the two landraces Sponcio (FIS = 0.06) and Marano (FIS = 0.02). Interestingly, the variation observed in our estimates of FIT was much lower, as this parameter was on average equal to 0.25, ranging from 0.21 (Sponcio and Marano) to 0.35 (Biancoperla). As displayed in Table 2, FST was, on average, equal to 0.17, ranging from 0.08 (Rosso Piave) to 0.24 (Biancoperla, Table 2). Altogether, these data suggest that the proportion of genetic variation found among landraces was relatively low (17% on average) and to some extent variable across landraces (8% to 24%).

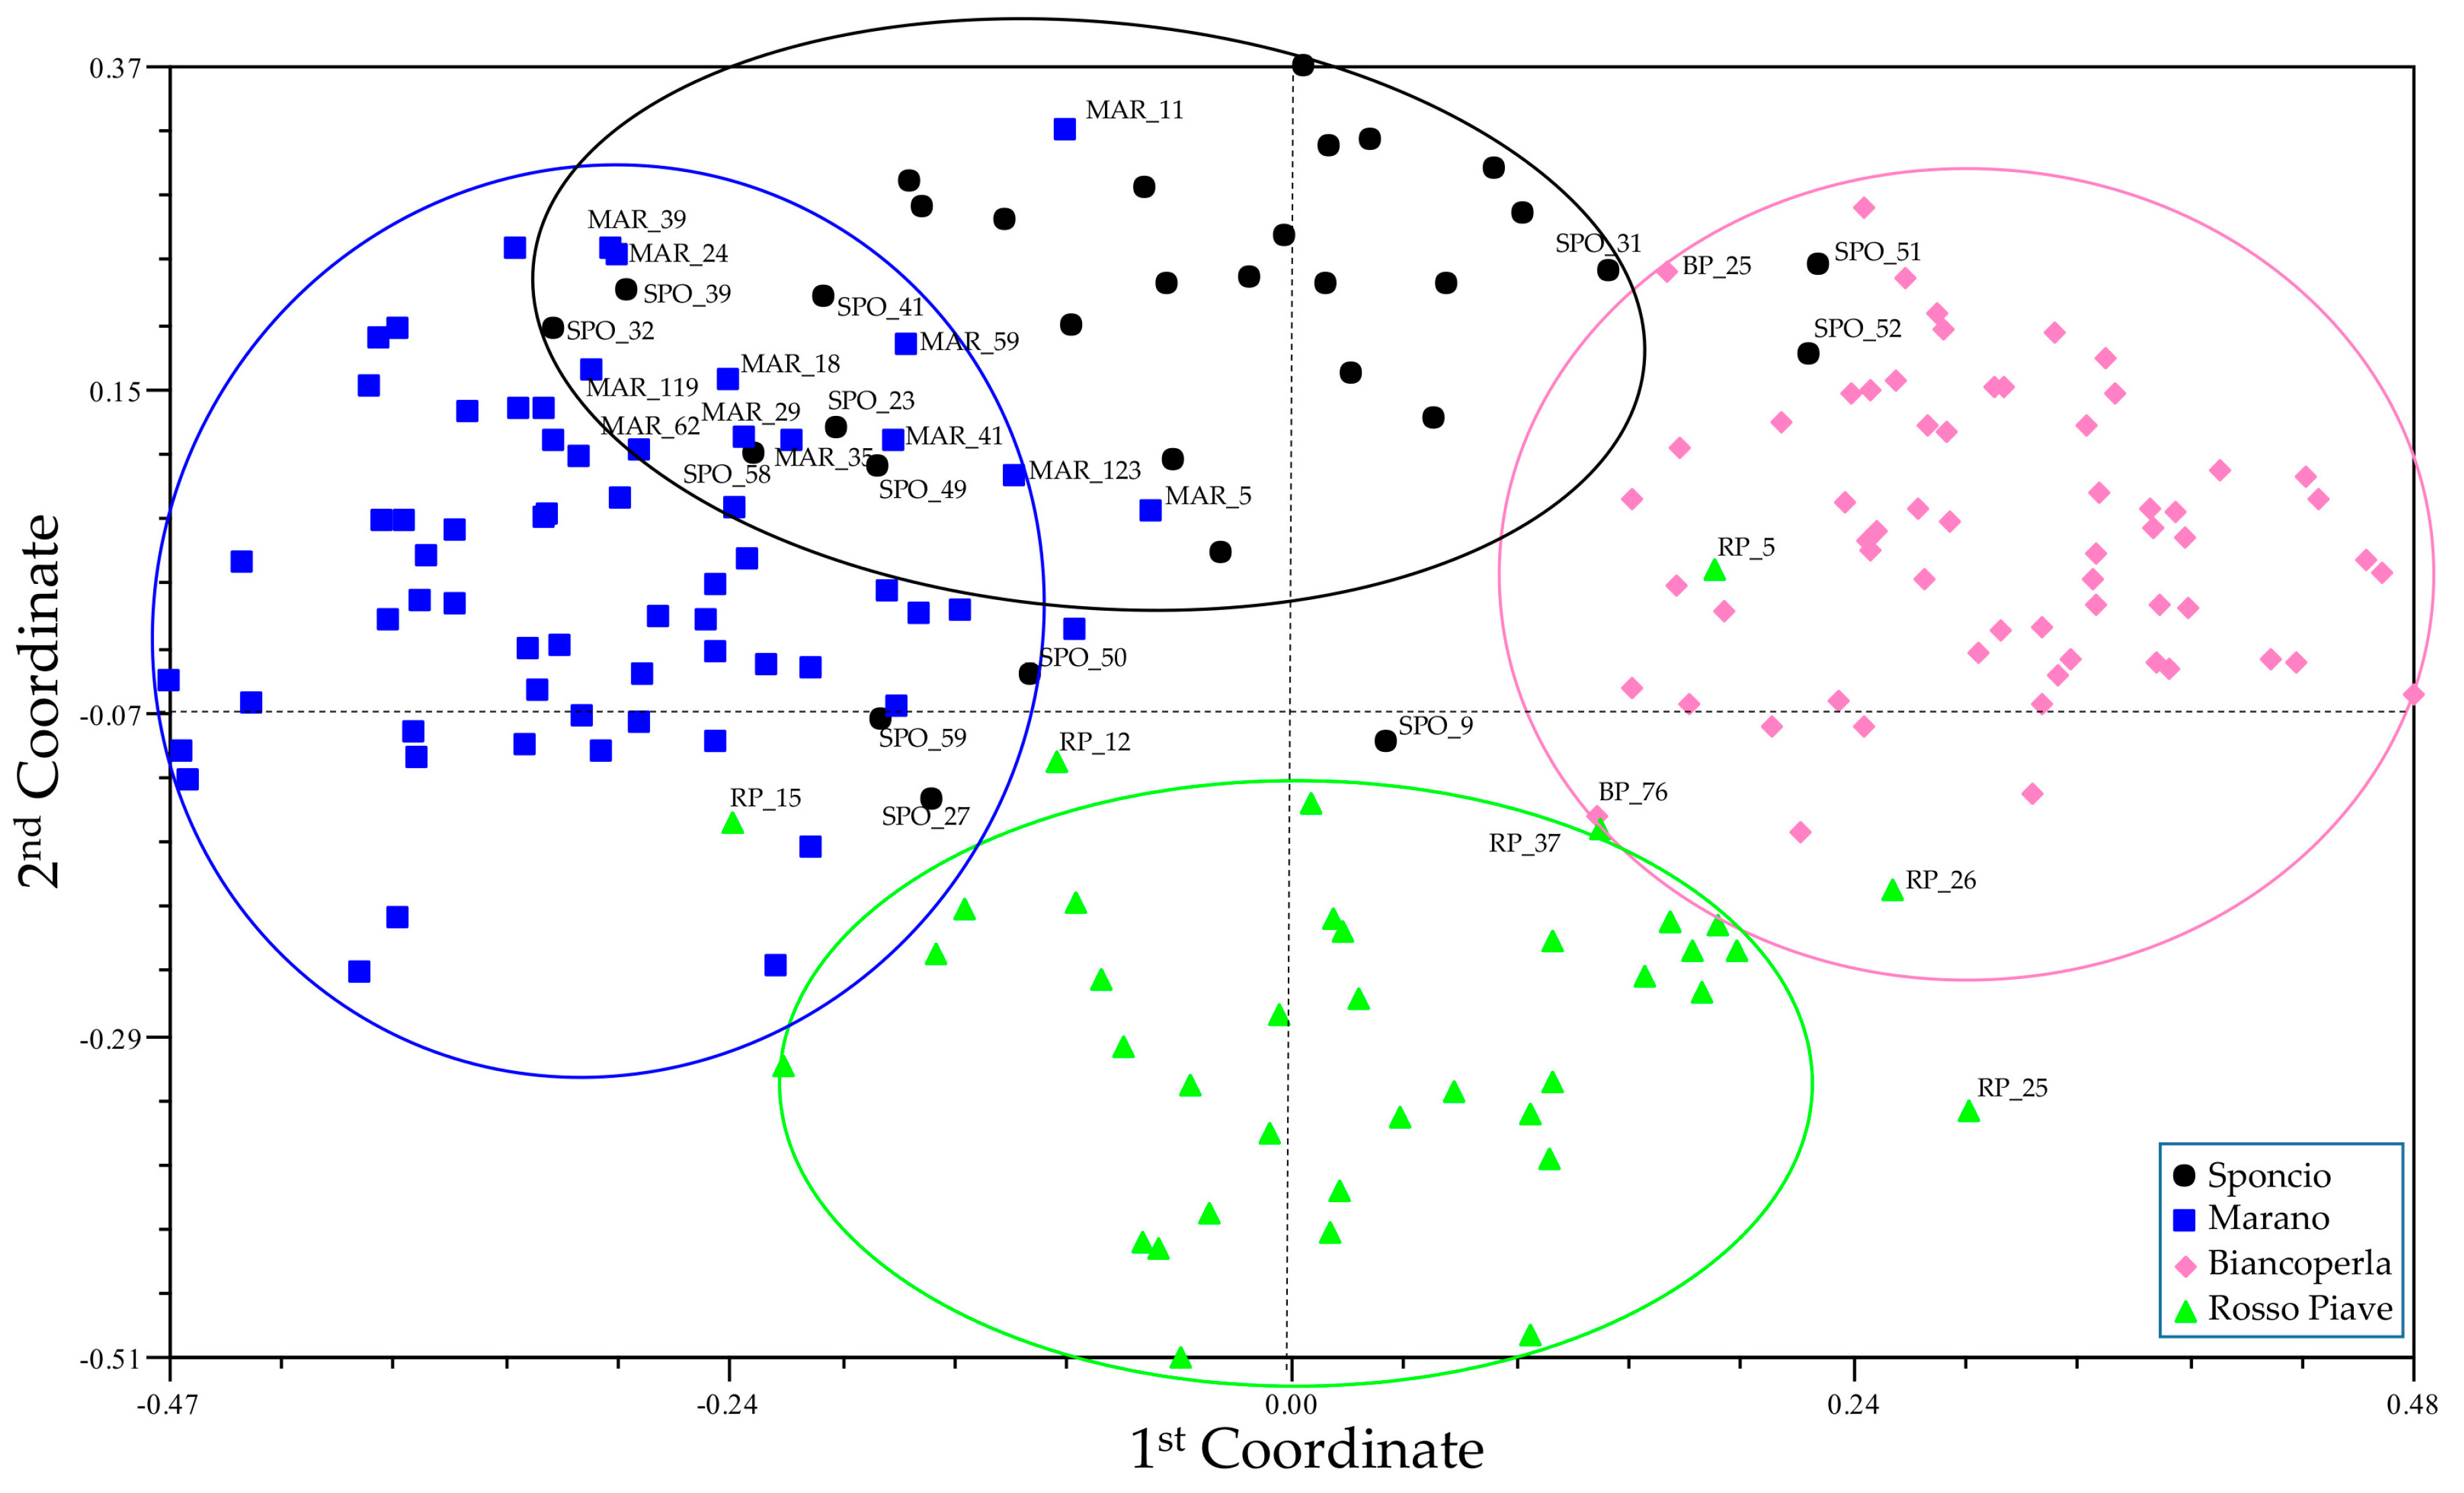
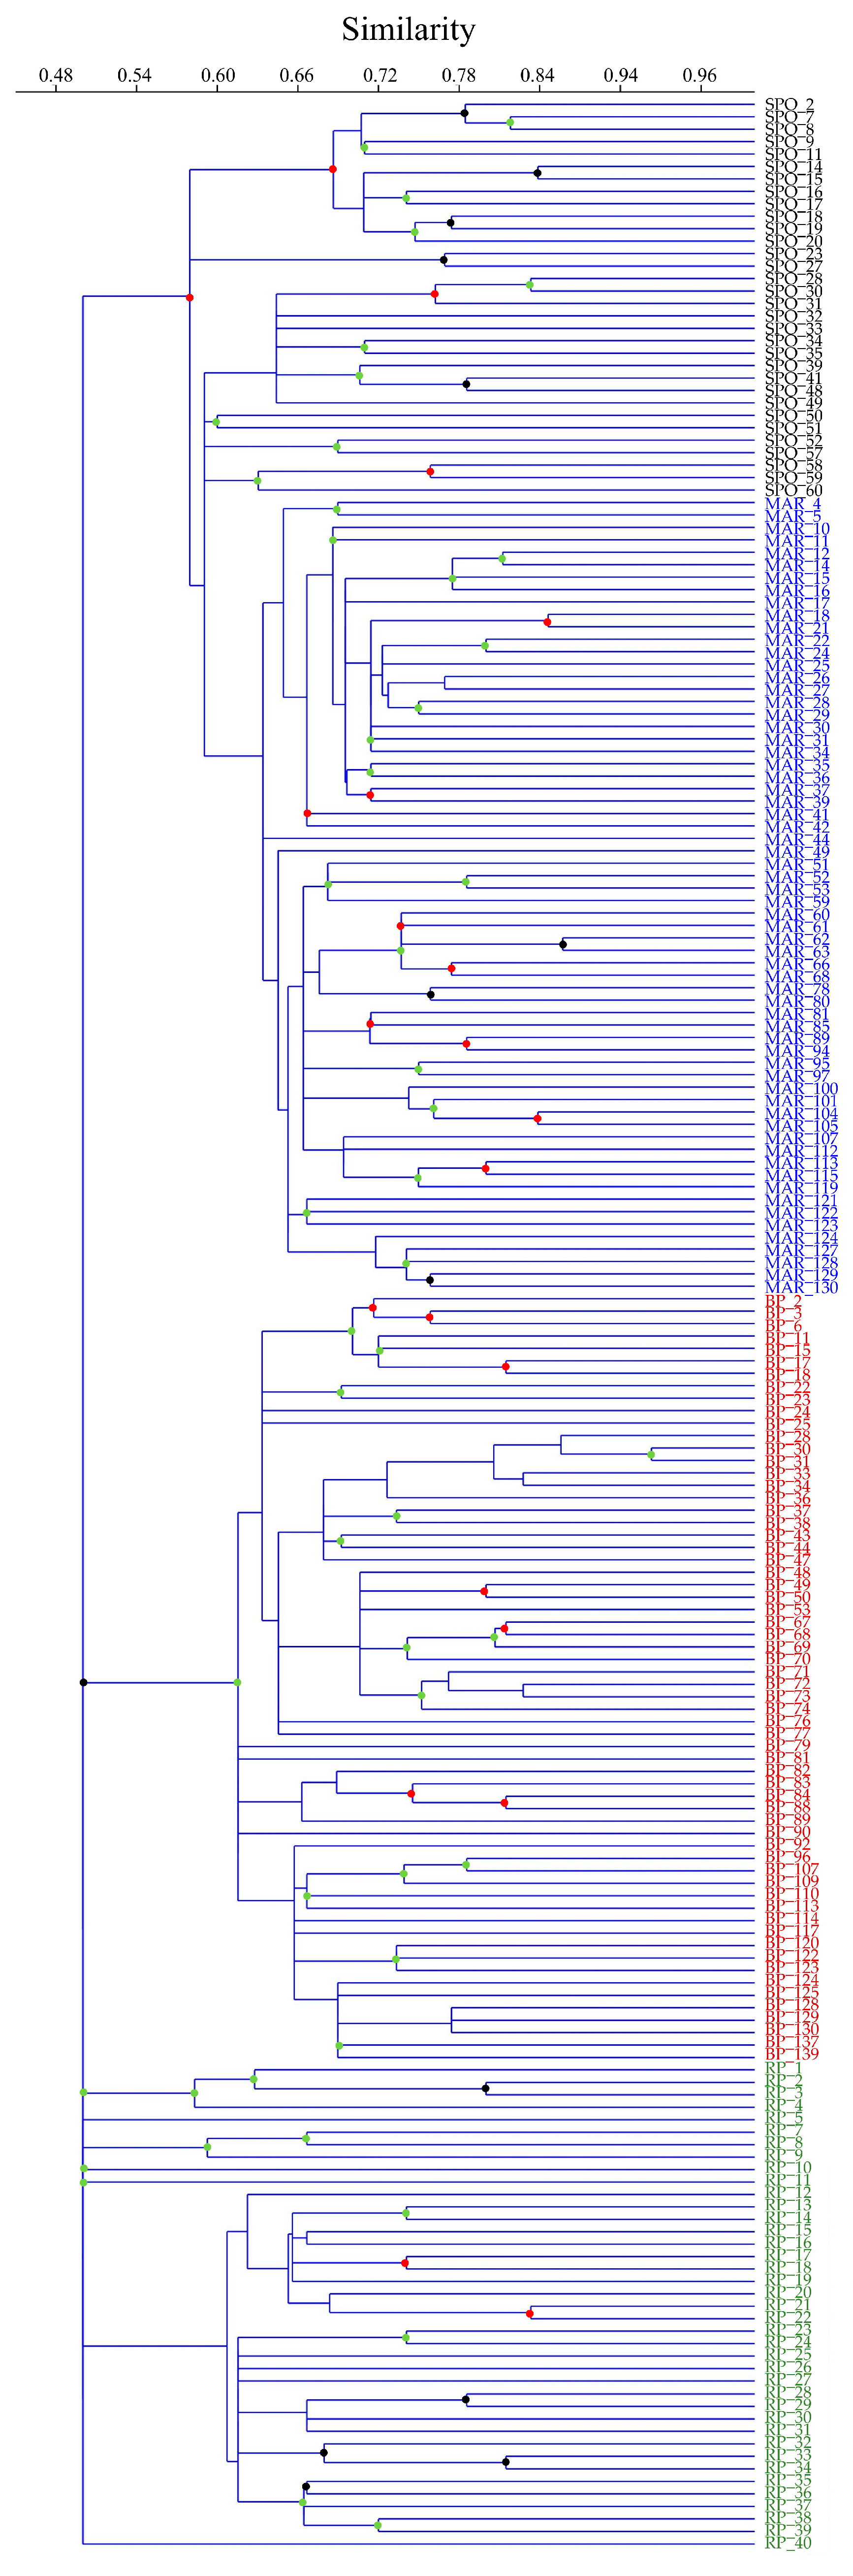
3.2. Genetic Diversity and Cluster Analysis

Within the genetic similarity (GS) matrix calculated for all possible pairwise comparisons among the 197 individuals’ DNA genotypes, Rohlf’s index ranged from 0.29 (between MAR_128 and RSM_25) to 0.97 (between MAR_129 and SPO_32). When calculated within each landrace, this index varied, on average, from 0.70 (±0.11) within the Rosso Piave population to 0.78 (±0.08) within the Biancoperla population. In pairwise comparisons between landraces, Marano and Biancoperla populations showed the lowest average value (0.59 ± 0.07), while Marano and Sponcio populations exhibited the highest one (0.67 ± 0.08, Supplementary Data S1).
Principal coordinate analysis (PCoA) showed that most of the individual DNA samples were clustered into four major subgroups (Figure 1).
The first principal coordinate accounted for 14.7% of the total variation and clearly separated Marano from Biancoperla, whereas the second principal coordinate accounted for 7.4% of the total variation and separated Sponcio from Rosso Piave. Biancoperla and Rosso Piave were firmly grouped in two distinct clusters and only few individuals, namely, RSM_5, RSM_12, RSM_15, RSM_25 and RSM_26, were partially separated from the rest of their landrace. This finding is also supported by low mean genetic similarity values (always lower than 69.0%) calculated through pairwise comparisons between these five samples and the Rosso Piave collection as a whole. The PCoA analysis further underlines the existence of some overlaps between the Marano and Sponcio clusters, a scenario that is mirrored by the high mean similarity value (67.2%) calculated at all loci between these two populations.
The UPGMA tree revealed a marked genetic differentiation of the four local varieties. Using this analysis, it was possible to distinguish three main clusters of individuals that were firmly supported by a bootstrap value of 100% (Figure 2). The inbred line B73 was grouped separately from all individuals representing the four Venetian landraces (data not shown). In particular, genetic similarity estimates of the inbred line B73 with respect to all individual genotypes, measured in all possible pairwise combinations, were much lower than the average values computed among individuals either within landraces (ranging from 0.70 to 0.78) or between landraces (varying from 0.59 to 0.67). As a matter of fact, the mean genetic similarity of this inbred line used as tester with each of the four landraces was equal to 0.43 ± 0.04 (with Marano), 0.44 ± 0.05 (with Rosso Piave) and 0.45 ± 0.06 (with both Sponcio and Biancoperla).
The largest group consisted of two subgroups with bootstrap support of 76%, one including approximately 50% of the Sponcio population and the other one including the Marano population and the remaining Sponcio individuals. The second cluster included the entire Biancoperla population, which further split into two subgroups (bootstrap support of 52%). Finally, the third group represented most of the Rosso Piave individuals.

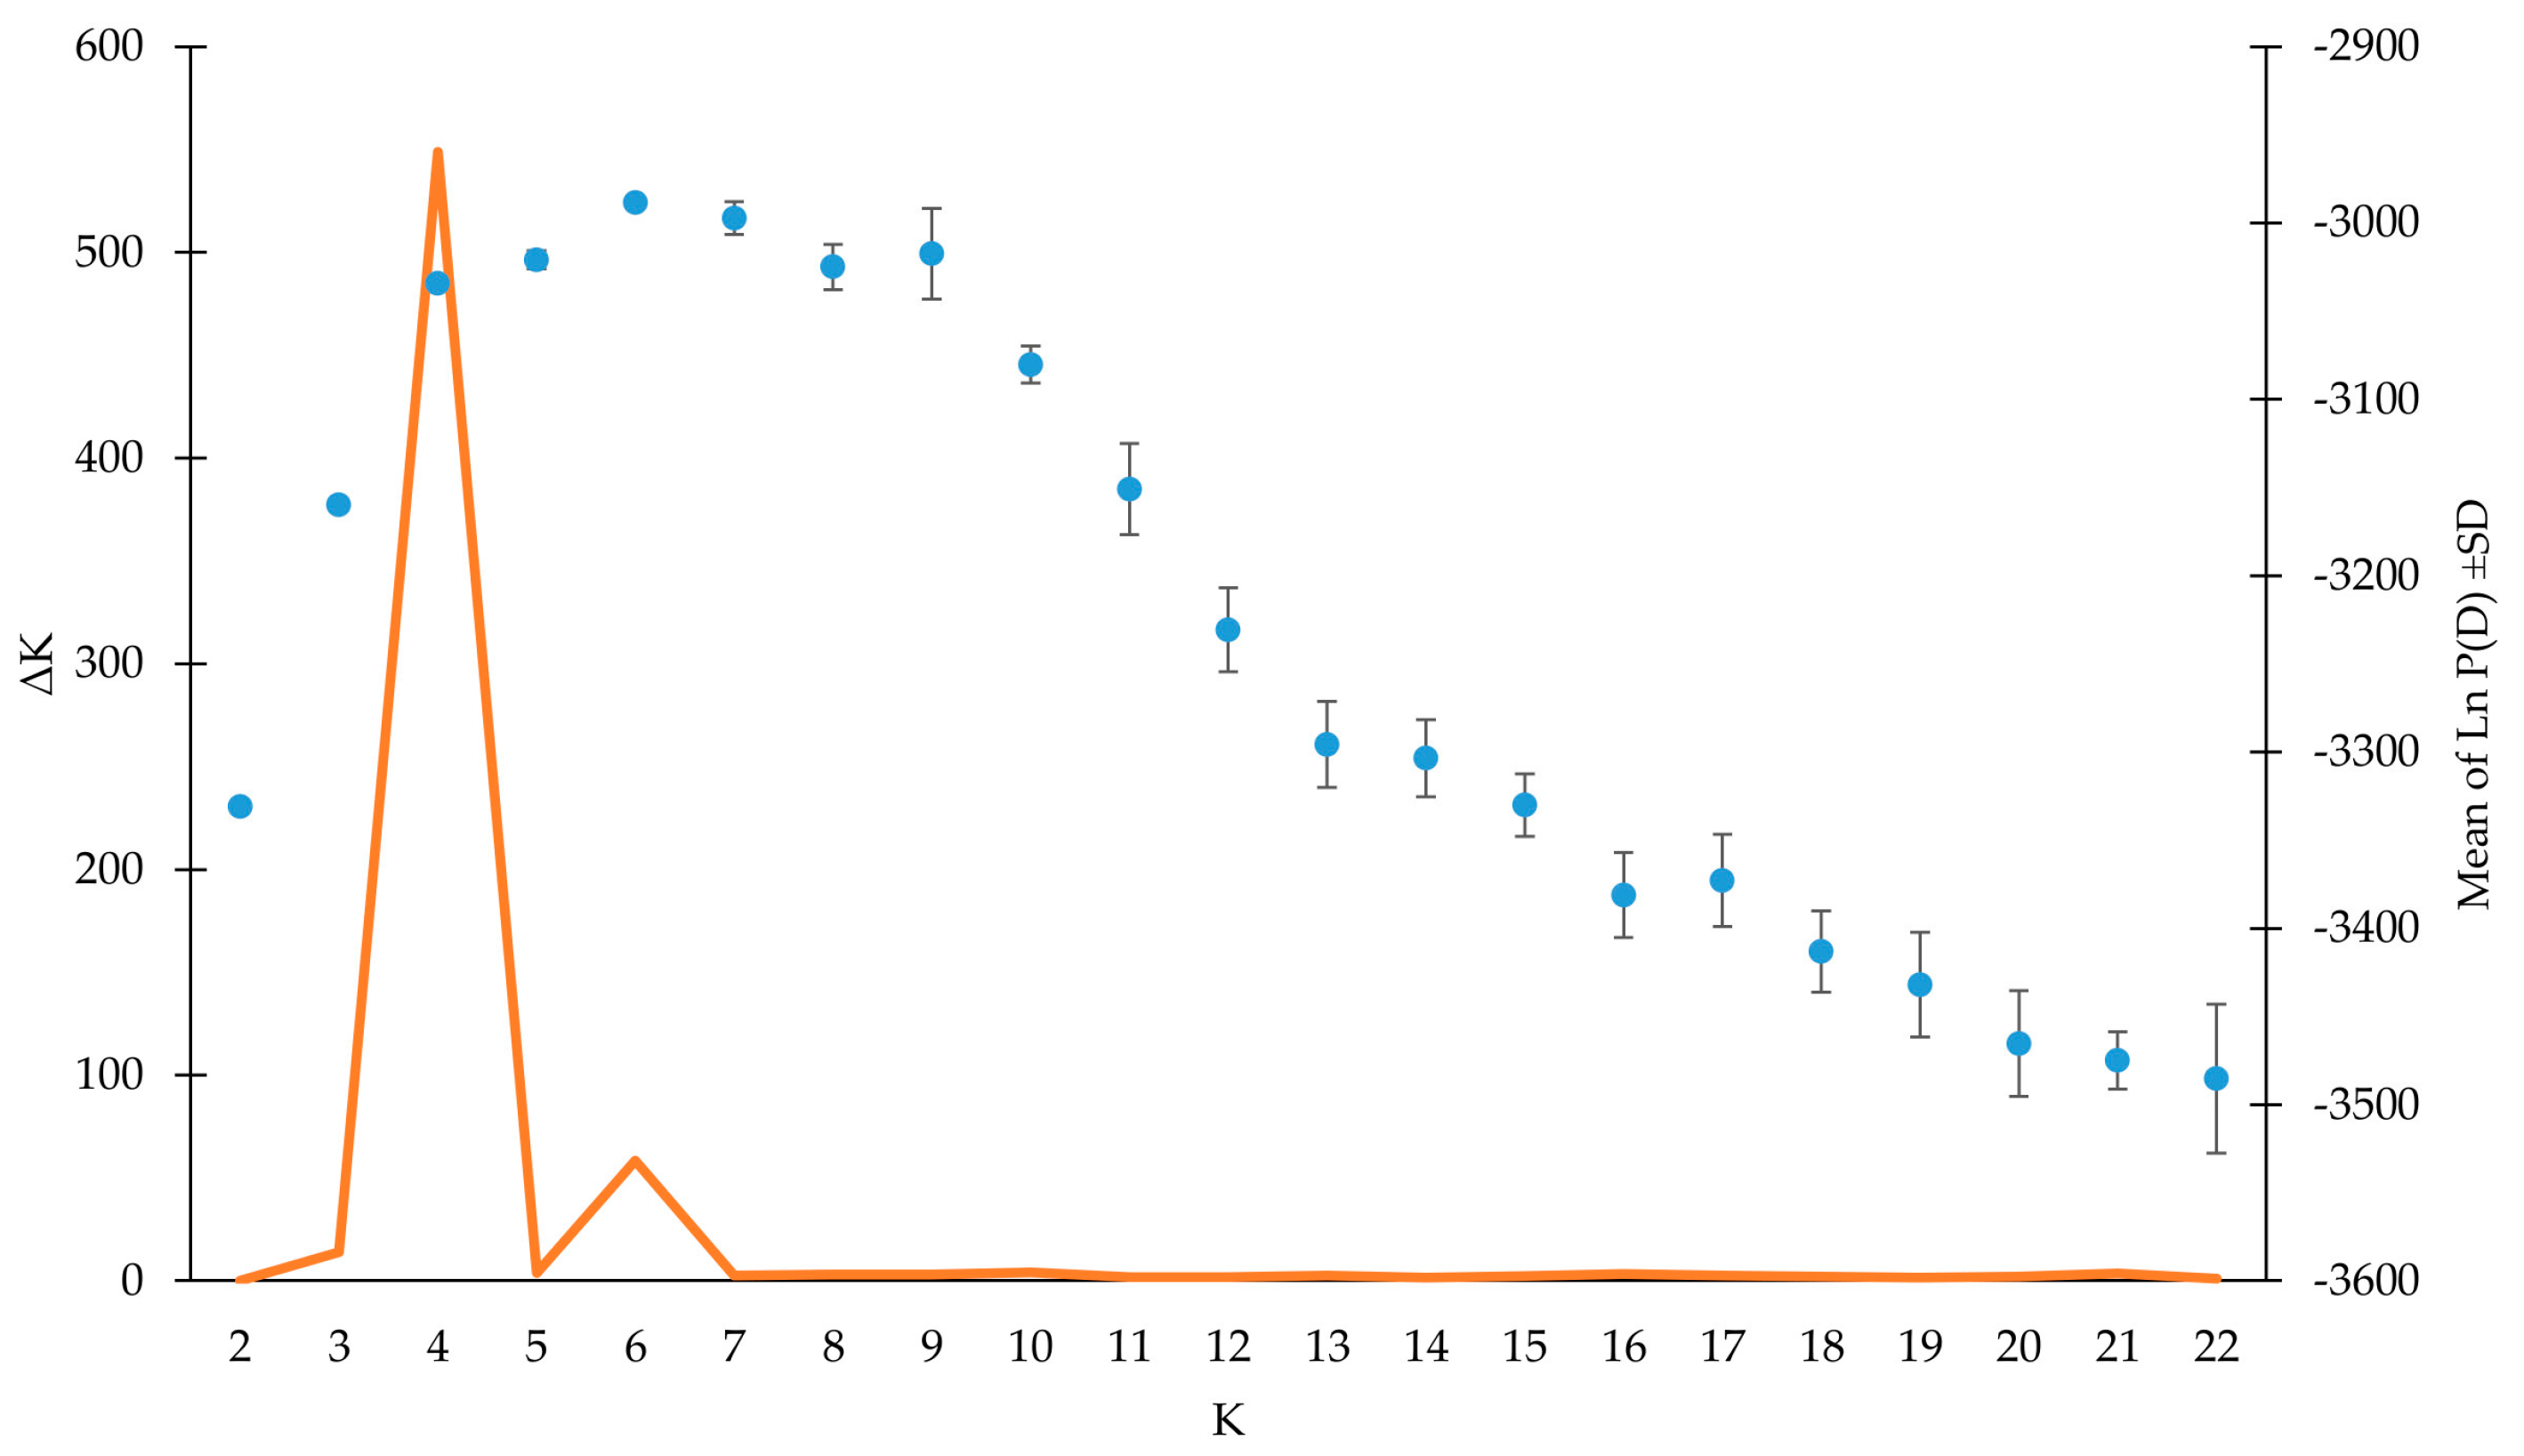
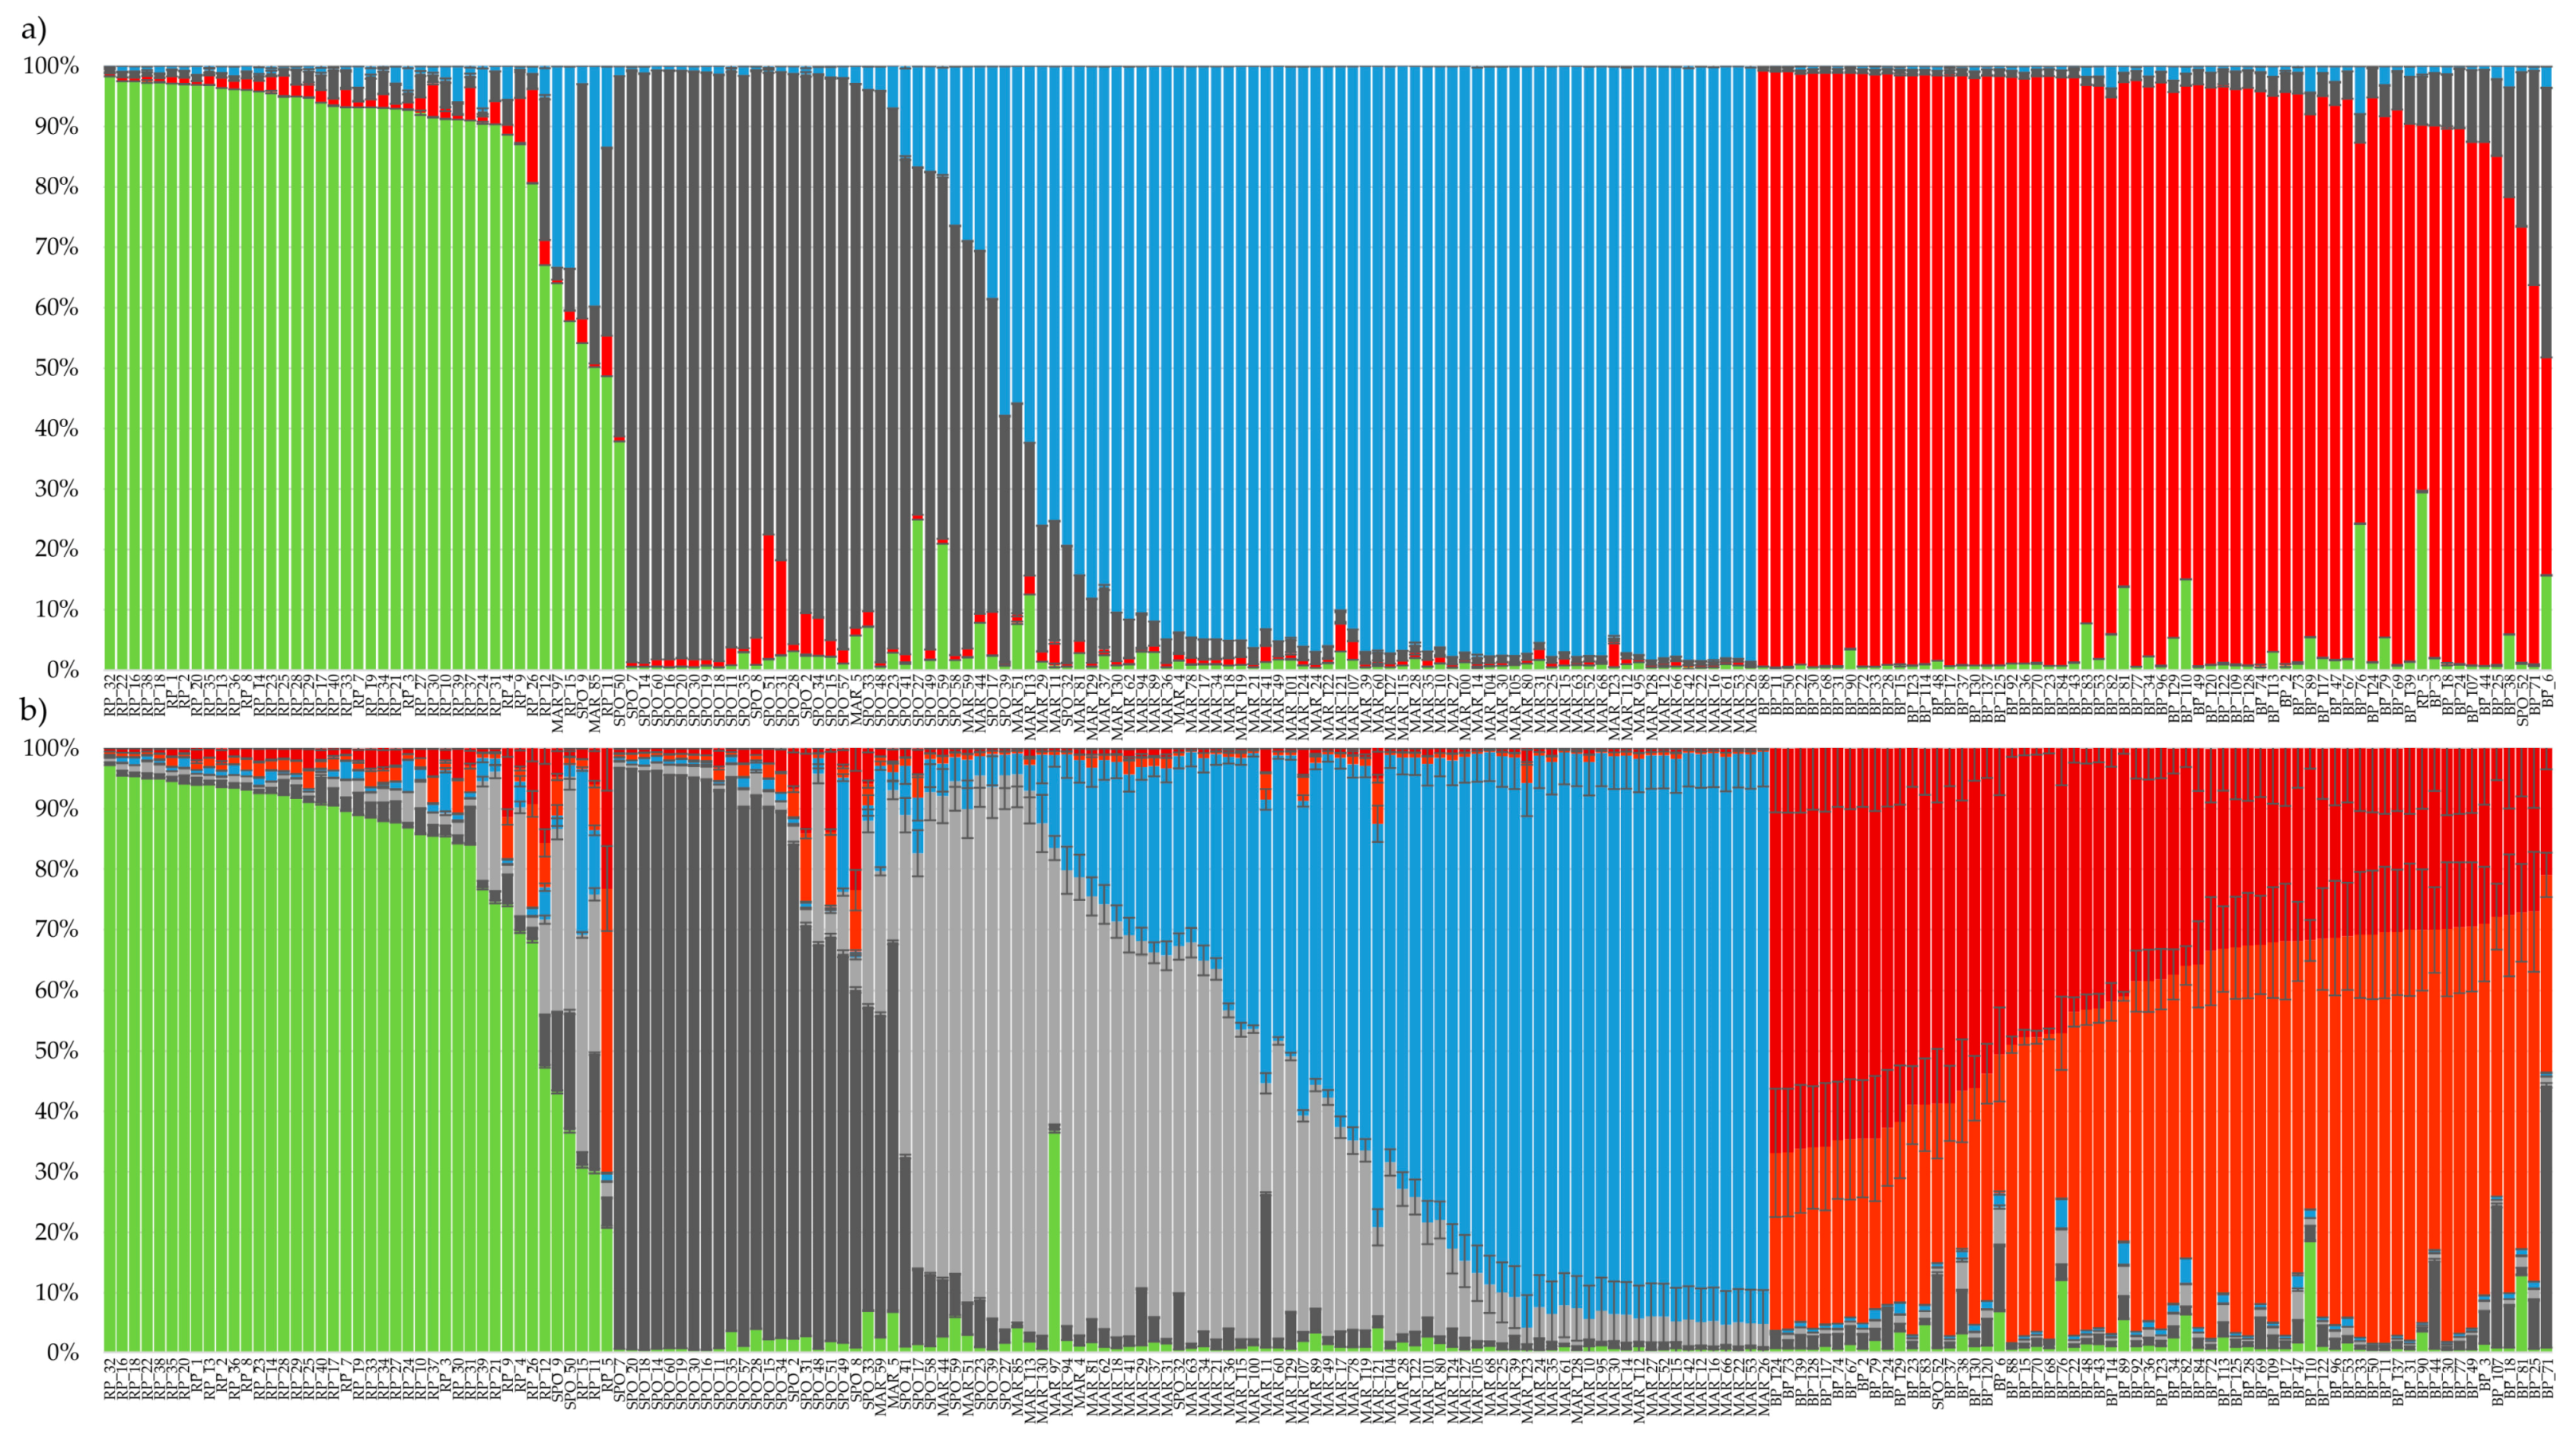
3.3. Genetic Structure Analysis

STRUCTURE v2.2 [33] was used to investigate the genetic structure of the corn core collection. Following the procedure of Evanno et al. [35], a clear maximum for ΔK value at K = 4 was found (ΔK = 548.79, Figure 3).
Since the ancestral population size K = 4 also corresponds to the number of local varieties used in this study, it was considered the best estimate of the current population structure (Figure 4, panel a). The 197 corn samples were grouped into four genetically distinct clusters. In this graphical representation, each genotype is plotted as a vertical histogram divided into K = 4 colored segments representing the estimated membership in each hypothesized ancestral genotype. The clustering of genotypes revealed that 144 of 197 samples showed strong ancestry association (>90%). Almost all individuals from Biancoperla (94%) and Rosso Piave (90%) showed an individual membership to their respective founding groups higher than 80% while most of the admixed genotypes (<80% membership to a single ancestral genotype) were from Sponcio and Marano. Specifically, these two landraces included a substantial number of genotypes with admixed ancestry, namely, 11 genotypes for the variety from Val Belluna (32%) and 9 for the one from Marano Vicentino (15%). Most of the admixed genotypes (Figure 4, panel a) originated in the overlapping region between these two clusters in the PCoA analysis (Figure 1, MAR_5, MAR_11, MAR_29, MAR_59, SPO_27, SPO_32, SPO_39, SPO_49 and SPO_58, SPO_59).
The second largest ΔK, at K = 6 (ΔK = 58.58, Figure 3), revealed an additional level of population structure and allowed the clustering of all investigated genotypes into six additional subgroups. In this interpretative framework, all the Marano samples and most of the Sponcio population (91%) were organized into three main clusters. The first one included 21 individuals from Sponcio (membership > 50%), a second one grouped 39 Marano genotypes (membership > 50%) and a third cluster comprised most of the Sponcio and Marano samples that showed admixed ancestry at K = 4 (Figure 4, panel b). As already found for K = 4, Rosso Piave continued to cluster apart, but all the individuals belonging to the Biancoperla landrace showed admixed ancestry from two different clusters (Figure 4, panel b).

4. Discussion

The Sponcio, Marano, Biancoperla and, to a lesser extent, Rosso Piave landraces of corn were abundantly grown in the past and characterized the Veneto region (Italy) for centuries, as reported by several documents [15,16,19]. Nevertheless, since the twentieth century, they have been progressively abandoned and replaced by more productive lines. Currently, they survive only in a few hectares, and extinction is becoming a real threat. To the best of our knowledge, this work represents the first attempt to describe the genetic diversity and structure of these four varieties.
For the purposes of this analysis, 10 microsatellite markers equally distributed into 10 linkage groups (see Table 1) were chosen from Register et al. [23] on the basis of their high PIC. The PIC values calculated for this SSR marker dataset (see Table 2) were slightly lower than those reported by Register et al. [23], probably because in the original work PIC values were obtained from an analysis of over 500 genotypes largely representative of the whole North American germplasm. Moreover, we cannot exclude that the different methods adopted to run and screen PCR products could have influenced the detection of allelic variants. According to Botstein et al. [36], five of the selected SSR markers (phi024, phi076, phi057, phi073 and umc1075) would be considered highly informative (PIC > 0.5), while the other loci would be considered informative (0.25 < PIC < 0.5, see Table 2). Interestingly, there was no direct correlation between population size and number of observed alleles (Na) or number of effective alleles (Ne). In fact, the two populations numerically less represented, Sponcio (N = 32) and Rosso Piave (N = 39), showed the highest Na (Na = 3.00 and Na = 3.30, respectively) and Ne values (Ne = 2.09 and Ne = 2.30, respectively). The number of effective alleles in a population is estimated from the gene diversity (i.e., Ne = 1/(1 − He)), and denotes the number of equally frequent alleles necessary to achieve a given level of gene diversity. The finding that the number of effective alleles indirectly correlates with the size of the assessed populations is consistent with a reduction of gene diversity within these populations (see Figure 1). Furthermore, the observation that the difference between the number of observed alleles (Na) and number of effective alleles (Ne) is higher in Sponcio and Rosso Piave could indicate the presence of several low-frequency alleles in these landraces. Roughly speaking, without considering allele frequencies at this level of interpretation, a high number of observed alleles theoretically produces many genetically possible genotypes and, thus, high genetic diversity within the population. Accordingly, we observed that mean percentages of genetic similarity scored within Rosso Piave (69.98%) and Sponcio (74.71%) were lower than those calculated within Marano and Biancoperla (75.40% and 78.12%, respectively). Of the 36 alleles, six appeared to be private to specific populations (Sponcio and Rosso Piave). SSR private alleles are recognized as an efficient food traceability tool since they can be assigned unambiguously to a specific variety. Recently, a molecular system entirely based on private alleles was developed by Palumbo et al. [37] in order to verify the genetic authenticity of food products deriving from an Italian barley landrace. Unfortunately, all six private alleles observed in this study were present at very low frequencies (<0.05%), so they could not be used, even in combination, for the same purpose. The large number of polymorphisms and the presence of both rare allele and alleles unshared with the inbred B73, potentially confirm that these four landraces could represent a valuable source of genetic variants and unique germplasm traits [13].
The fact that the overall mean observed heterozygosity (Ho = 0.43 ± 0.12) for all loci was lower than expected (He = 0.58 ± 0.12) suggests an excess of homozygosity in the core collection. This is further supported by the positive values of the individual inbreeding coefficients (Fis = 0.08 ± 0.04 and Fit = 0.25 ± 0.03, Table 2). The observed heterozygosity calculated within the four landraces was, on average, equal to 0.43 (±0.04), consistent with the allogamous reproductive system of corn and with that reported in other works focused on corn landraces [11,12]. As found in the only other Italian work available on corn landraces [13], a deficiency of heterozygotes was observed for each local variety.
We are confident that the deficiency of heterozygosity is not correlated with the size of the assessed populations: the lowest value (Ho = 0.37 ± 0.20) was recorded for Biancoperla, one of the two most numerically represented landraces (N = 62) and vice versa the smallest group (Sponcio, N = 32) showed the highest value (Ho = 0.47 ± 0.15). Moreover, we rule out the possibility that the cause of low levels of heterozygosis is ascribable to the limited number of plants from which the seeds sampled and analyzed in this study were originally selected by the institutes. In fact, germplasm collections were constituted combining hundreds of kernel corns from as many ears, carefully avoiding seeds from the same plant and ear. More likely, the repeated crosses of genetically similar individuals played a crucial role in the homozygosity excess showed by the loci investigated [38]. This could be the case when farmers select, every year, very small seed stocks based on an “ear ideotype”, applying a strong selective pressure [13]. More in details, the traditional selection carried out annually by farmers is oriented to maintain (i) the distinctive morphological traits of the landrace, (ii) the peculiar qualitative characteristics of kernels used for “polenta”, and (iii) the level of distinctiveness even when the pollen source is not controlled [6]. Biancoperla also scored the highest mean value of similarity (78.12%), providing a reasonable connection between the low level of heterozygosity and high genetic similarity calculated within each local variety.
Overall, Wright’s inbreeding coefficients FIS and FIT scored positive values, confirming a general deficiency of heterozygotes across individual accessions and landraces. Based on our marker set, the reduction of heterozygosity was higher for the two landraces Rosso Piave and Biancoperla, while it was relatively low for the two landraces Sponcio and Marano. Interestingly, FIT estimates did not mirror the variation observed for FIS, as the four cultivars displayed very similar values for this parameter. Estimates of FST varied considerably among the four landraces, indicating unbalanced contributions of the investigated populations to the total assayed genetic variation. Accordingly, our estimates of inbreeding coefficients suggest that these landraces are characterized by a relatively low degree of genetic differentiation, with approximately 17% of the genetic variation found among landraces (average FST = 0.17) and approximately 83% of the total genetic variation expressed within landraces.
Based on a pairwise comparison among varieties, Sponcio and Marano landraces exhibited the highest mean genetic similarity estimates (on average, 67.23%), as graphically confirmed through ordination analyses based on the definition of PCoA centroids (see Figure 1) and construction of the UPGMA tree (see Figure 2). Our findings support the hypothesis of marked gene flow between these two landraces, which could have been promoted by their geographical proximity and recently overlapping cultivation areas as a clear-cut distribution in the Veneto region has been progressively lost. To further corroborate this hypothesis, Marano and Sponcio revealed genetically differentiated populations for K = 4 (see Figure 4, panel a) and subpopulations grouping individuals with admixed ancestry for K = 6 (see Figure 4, panel b). Further analysis will be needed, and combining genetic data with phenotypic observations will help determine whether genotypes with admixed ancestry (K = 4) also share the morphological characteristics of both landraces. As already reported in [10], the inbred line B73 showed very low average estimates of genetic similarity (<45%) with all the landrace populations.
Rosso Piave, whose production is mainly confined to the extreme east of the Veneto region, was the landrace showing the lowest mean genetic similarity values in pairwise comparisons with the other three landraces. Consistent with these results, this landrace grouped in a cluster apart from the other landraces for both K = 4 and K = 6 (see Figure 4).
Although for K = 4 Biancoperla was represented by a unique group with individual memberships almost always (57 of 62 samples) higher than 80% (see Figure 4, panel a), the clustering of individuals for K = 6 revealed that this variety was totally (100%) constituted by admixed individuals and each individual showed a variable percentage of membership to both clusters (see Figure 4, panel b). Since two main accessions of Biancoperla are currently bred in Veneto (ITA0340323 and ITA0340324), which differ in plant size, spike length and kernel color [39], based on STRUCTURE results, we speculate that the current Biancoperla population could be the result of repeated events of hybridization and/or introgression between these two accessions.
Conservation of the genetic resources in the agro-ecosystem in which they have evolved (in situ conservation) is now being more widely considered as complementary to strategies based on gene banks (ex situ conservation, [6]). By taking advantage of the molecular markers and population genetics data here presented, an attempt to increase the genetic purity and to improve the genetic stability of these very old landraces could be made. For each population, only individuals characterized by the highest within-population genetic similarity and ancestry estimates could be maintained and multiplied by open pollination in isolated fields in order to yield farmer’s seed stocks.

Supplementary Materials

The following are available online at www.mdpi.com/1424-2818/9/3/32/s1, Data S1: Statistics related to the frequency of all marker alleles, including private alleles, sorted by populations and samples, and genetic similarity matrix of all possible pair-wise comparisons among individuals and mean genetic similarity estimates among populations.

Acknowledgments

This work was supported by the project ‘PROGRAMMA BIO.NET, rete regionale per la conservazione e caratterizzazione della biodiversità di interesse agrario-Gruppo di lavoro cerealicolo’ funded by Programma di Sviluppo Rurale per il Veneto 2007–2013. The authors wish to thank Flavio Da Ronch for technical assistance with DNA extraction and PCR amplification experiments.

Author Contributions

G.B. and G.G. conceived and designed the experiments; F.P. and G.G performed the experiments; F.P. and L.M.-B analyzed the data; G.B. contributed reagents, materials and analysis tools; all authors contributed to data interpretation and manuscript preparation.

Conflicts of Interest

The authors declare no conflict of interest.

References

  1. Baur, E. Die Bedeutung der primitiven Kulturrassen und der wilden Verwandten unserer Kulturpflanzen fur die Pflanzenzuchtung. Jahrb. DLG 1914, 21, 104–110. [Google Scholar]
  2. Frankel, O.; Bennett, E. Genetic Resources in Plants—Their Exploration and Conservation (IBP Handbook No. 11); Blackwell Science Ltd.: London, UK, 1970. [Google Scholar]
  3. Harlan, J. Our vanishing genetic resources. Science 1975, 188, 618–621. [Google Scholar] [CrossRef] [PubMed]
  4. Brush, S. In situ conservation of landraces in centers of crop diversity. Crop Sci. 1995, 35, 346–354. [Google Scholar] [CrossRef]
  5. Bellon, M.R. Conceptualizing interventions to support on-farm genetic resource conservation. World Dev. 2004, 32, 159–172. [Google Scholar] [CrossRef]
  6. Lucchin, M.; Barcaccia, G.; Parrini, P. Characterization of a flint maize (Zea mays L. convar. mays) Italian landrace: I. Morpho-phenological and agronomic traits. Genet. Resour. Crop Evol. 2003, 50, 315–327. [Google Scholar] [CrossRef]
  7. Eurostat: Crop Statistics. Available online: http://ec.europa.eu/eurostat/web/agriculture/data/database?p_p_id=NavTreeportletprod_WAR_NavTreeportletprod_INSTANCE_ff6jlD0oti4U&p_p_lifecycle=0&p_p_state=normal&p_p_mode=view&p_p_col_id=column-2&p_p_col_pos=1&p_p_col_count=2 (accessed on 31 July 2017).
  8. Shanbao, Q.; Yuhua, W.; Tingzhao, R.; Kecheng, Y.; Shibin, G.; Guangtang, P. Effective improvement of genetic variation in maize lines derived from R08xDonor backrosses by SSRs. Biotechnology 2009, 8, 358–364. [Google Scholar] [CrossRef]
  9. Cömertpay, G.; Baloch, F.S.; Kilian, B.; Ülger, A.C.; Özkan, H. Diversity assessment of Turkish maize landraces based on fluorescent labelled SSR markers. Plant Mol. Biol. Report. 2012, 30, 261–274. [Google Scholar] [CrossRef]
  10. Pineda-Hidalgo, K.V.; Méndez-Marroquín, K.P.; Alvarez, E.V.; Chávez-Ontiveros, J.; Sánchez-Peña, P.; Garzón-Tiznado, J.A.; Vega-García, M.O.; López-Valenzuela, J.A. Microsatellite-based genetic diversity among accessions of maize landraces from sinaloa in México. Hereditas 2013, 150, 53–59. [Google Scholar] [CrossRef] [PubMed]
  11. Qi-Lun, Y.; Ping, F.; Ke-Cheng, K.; Guang-Tang, P. Genetic diversity based on SSR markers in maize (Zea mays L.) landraces from Wuling mountain region in China. J. Genet. 2008, 87, 287–291. [Google Scholar] [CrossRef] [PubMed]
  12. Oppong, A.; Bedoya, C.A.; Ewool, M.B.; Asante, M.D.; Thomson, R.N.; Adu-Dapaah, H.; Lamptey, J.N.; Ofori, K.; Offei, S.K.; Warburton, M.L. Bulk genetic characterization of Ghanaian maize landraces using microsatellite markers. Maydica 2014, 59, 1–8. [Google Scholar]
  13. Barcaccia, G.; Lucchin, M.; Parrini, P. Characterization of a flint maize (Zea mays var. indurata) Italian landrace, II. Genetic diversity and relatedness assessed by SSR and Inter-SSR molecular markers. Genet. Resour. Crop Evol. 2003, 50, 253–271. [Google Scholar] [CrossRef]
  14. Mais Sponcio—Cooperativa Agricola La Fiorita. Available online: http://www.cooperativalafiorita.it/?scheda_prodotto+prodotti=mais_sponcio (accessed on 30 June 2017).
  15. Perco, D. Antonio Maresio Bazolle/Il Possidente Bellunes; Tip. B. Bernardino: Feltre, Italy, 1986. [Google Scholar]
  16. Zapparoli, T.V. Il Granoturco Marano. L’Italia Agric. 1939, 76, 155–159. [Google Scholar]
  17. Zaccaria, L. Valutazione delle Variazioni dei Caratteri Morfo-Fisiologici Intervenute nel Corso Degli Anni Nella Varietà di Mais Marano Vicentino. Bachelor’s Thesis, University of Padua, Padua, Italy, 31 Octorber 2012. [Google Scholar]
  18. Bernardi, U.; Demattè, E. Giacomo Agostinetti/Cento e Dieci ricordi che Formano il Buon Fattor di Villa; Neri Pozza: Pordenone, Italy, 1998. [Google Scholar]
  19. Miniscalco, V. Il Granoturco; Arti grafiche F.lli Cosarini: Pordenone, Italy, 1946. [Google Scholar]
  20. Clemens, R.L.B. Keeping Farmers on the Land: Adding Value in Agriculture in the Veneto Region of Italy. MATRIC Briefing Papers 6. 2004. Available online: http://lib.dr.iastate.edu/matric_briefingpapers/6 (accessed on 13 August 2017).
  21. Cassidy, A.; Mukamal, K.J.; Liu, L.; Franz, M.; Eliassen, A.H.; Rimm, E.B. High anthocyanin intake is associated with a reduced risk of myocardial infarction in young and middle-aged women. Circulation 2013, 127, 188–196. [Google Scholar] [CrossRef] [PubMed]
  22. Schuelke, M. An economic method for the fluorescent labeling of PCR fragments A poor man’s approach to genotyping for research and high-throughput diagnostics. Nat. Biotechnol. 2000, 18, 233–234. [Google Scholar] [CrossRef] [PubMed]
  23. Register, J.I.; Sullivan, H.; Yun, Y.; Cook, D.; Vaske, D. A set of microsatellite markers of general utility in maize. Maize Genet. Coop. News Lett. 2001, 75, 31–34. [Google Scholar]
  24. Nagy, S.; Poczai, P.; Cernák, I.; Gorji, A.M.; Hegedus, G.; Taller, J. PICcalc: An online program to calculate polymorphic information content for molecular genetic studies. Biochem. Genet. 2012, 50, 670–672. [Google Scholar] [CrossRef] [PubMed]
  25. Peakall, R.; Smouse, P.E. GenALEx 6.5: Genetic analysis in Excel. Population genetic software for teaching and research-an update. Bioinformatics 2012, 28, 2537–2539. [Google Scholar] [CrossRef] [PubMed]
  26. Yeh, F.C.; Yang, R.C.; Boyle, T.B.J.; Ye, Z.H.; Mao, J.X. POPGENE, the User Friendly Shareware for Population Genetic Analysis; Molecular Biology and Biotechnology Centre, University of Alberta: Edmonton, AB, Canada, 1997. [Google Scholar]
  27. Nei, M. Analysis of gene diversity in subdivided populations. Proc. Natl. Acad. Sci. USA 1973, 70, 3321–3323. [Google Scholar] [CrossRef] [PubMed]
  28. Van Zonneveld, M.; Scheldeman, X.; Escribano, P.; Viruel, M.A.; van Damme, P.; Garcia, W.; Tapia, C.; Romero, J.; Sigueñas, M.; Hormaza, J.I. Mapping genetic diversity of cherimoya (Annona cherimola Mill.): Application of spatial analysis for conservation and use of plant genetic resources. PLoS ONE 2012, 7, e29845. [Google Scholar] [CrossRef] [PubMed] [Green Version]
  29. Wright, S. The interpretation of population structure by F-statistics with special regard to systems of mating. Evolution 1965, 19, 395–420. [Google Scholar] [CrossRef]
  30. Barcaccia, G.; Felicetti, M.; Galla, G.; Capomaccio, S.; Cappelli, K.; Albertini, E.; Buttazzoni, L.; Pieramati, C.; Silvestrelli, M.; Verini Supplizi, A. Molecular analysis of genetic diversity, population structure and inbreeding level of the Italian Lipizzan horse. Livest. Sci. 2013, 151, 124–133. [Google Scholar] [CrossRef]
  31. Rohlf, F.J. NTSYS-pc: Numerical Taxonomy and Multivariate Analysis System, Version 2.1; Applied Biostatistics Inc.: Port Jefferson, NY, USA, 2004. [Google Scholar]
  32. Hammer, Ø.; Harper, D.A.T.; Ryan, P.D. PAST: PAleontological STatistics software package for education and data Analysis. Palaeontol. Electron. 2001, 4, 1–9. [Google Scholar]
  33. Falush, D.; Stephens, M.; Pritchard, J.K. Inference of population structure using multilocus genotype data: Linked loci and correlated allele frequencies. Genetics 2003, 164, 1567–1587. [Google Scholar] [PubMed]
  34. Porras-Hurtado, L.; Ruiz, Y.; Santos, C.; Phillips, C.; Carracedo, A.; Lareu, M.V. An overview of STRUCTURE: Applications, parameter settings, and supporting software. Front. Genet. 2013, 4, 98. [Google Scholar] [CrossRef] [PubMed]
  35. Evanno, G.; Regnaut, S.; Goudet, J. Detecting the number of clusters of individuals using the software STRUCTURE: A simulation study. Mol. Ecol. 2005, 14, 2611–2620. [Google Scholar] [CrossRef] [PubMed]
  36. Botstein, D.; White, R.L.; Skolnick, M.; Davis, R.W. Construction of a genetic linkage map in man using restriction fragment length polymorphisms. Am. J. Hum. Genet. 1980, 32, 314–331. [Google Scholar] [PubMed]
  37. Palumbo, F.; Galla, G.; Barcaccia, G. Developing a molecular identification assay of old landraces for the genetic authentication of typical agro-food products: The case study of the barley ‘Agordino’. Food Technol. Biotechnol. 2017, 55, 29–39. [Google Scholar] [CrossRef]
  38. Russell, W.A. Genetic improvement of maize yields. Adv. Agron. 1991, 46, 245–298. [Google Scholar] [CrossRef]
  39. Mais Biancoperla. Available online: http://www.legambientepadova.it/files/Scheda%20mais.pdf (accessed on 30 June 2017).
Figure 1. Two-dimensional centroids derived from genetic similarity estimates computed among the 197 accessions in all possible pairwise comparisons using the SSR marker data set. Only the names of those genotypes with unclear membership to one of the four subgroups are reported.
Diversity 09 00032 g001
Figure 2. Constrained UPGMA tree of genetic similarity estimates computed among pairwise comparisons of corn accessions using the SSR marker data set, with nodes supported by bootstrap values. Black circle: bootstrap values ≥ 90%; red circle: 70% ≤ bootstrap values < 90%; green circle: 50% ≤ bootstrap values < 70%. The color scheme for the text is the same as for the symbols described in Figure 1 (black = Sponcio, blue = Marano, magenta = Biancoperla and green = Rosso Piave).
Diversity 09 00032 g002
Figure 3. Definition of the number of ancestral corn populations based on the SSR marker dataset. Mean LnP(D) ± SD over 10 runs is a function of K, as L′(K) = ΔLnP(D). Mean ΔK is calculated as ∣L′′(K)∣/(SD(L(K)) following Evanno et al. [35]. ΔK values are represented by the orange line, while the blue points indicate the mean LnP(D) ± SD values.
Diversity 09 00032 g003
Figure 4. Population genetic structure of the four main corn landraces in Veneto (N = 197) as estimated by STRUCTURE using the SSR marker data set. Each sample is represented by a vertical histogram partitioned into K = 4 (panel a) or K = 6 (panel b) colored segments that represent the estimated membership. The proportion of ancestry (%) is reported on the ordinate axis and the identification number of each accession is reported below each histogram. The color scheme for the figure is the same as for the symbols and the text described in Figure 1 and Figure 2, respectively. Green = Rosso Piave, black = Sponcio, blue = Marano and magenta = Biancoperla. For K = 6 two shades of red are used for the two clusters of Biancoperla and the third new cluster between Sponcio and Marano is marked in grey.
Diversity 09 00032 g004
Table 1. List of SSR loci selected from Register et al. [23] for use in this study. For each microsatellite locus, linkage group, locus ID, motif, amplicon size in bp, forward and reverse primer sequences used to amplify the microsatellite region, melting temperature and polymorphism information content (PIC) coefficient related to the previously mentioned study are shown.
Linkage GroupLocus IDMotifSize (bp)PrimerTm (°C)PIC
1phi056GCC103–112M13-ACGCCCAGATCTGTTCCTTCTC630.67
ATGGCGGCAGGCCGATTGTT
2phi127AGAC129–145M13-ATATGCATTGCCTGGAACTGGAAGGA620.70
AATTCAAACACGCCTCCCGAGTGT
3phi073CAG107–116M13-TTACTCCTATCCACTGCGGCCTGGAC690.65
GCGGCATCCCGTACAGCTTCAGA
4phi076GAGCGG182–192M13-TTCTTCCGCGGCTTCAATTTGACC610.65
GCATCAGGACCCGCAGAGTC
5phi024CCT183–195ACTGTTCCACCAAACCAAGCCGAGA690.69
M13-AGTAGGGGTTGGGGATCTCCTCC
6phi031GTAC174–177M13-GCAACAGGTTACATGAGCTGACGA660.57
CCAGCGTGCTGTTCCAGTAGTT
7phi057GCC211–215M13-CTCATCAGTGCCGTCGTCCAT660.61
CAGTCGCAAGAAACCGTTGCC
8umc1075ATTGC156–166M13-GAGAGATGACAGACACATCCTTGG570.69
ACATTTATGATACCGGGAGTTGGA
9phi016GGT173–176M13-TTCCATCATTGATCCGGGTGTCG600.52
AAGGAGCAACATCCCATCCAGGAA
10phi084GAA174–178M13-AGAAGGAATCCGATCCATCCAAGC590.49
CACCCGTACTTGAGGAAAACCC
Table 2. Genetic parameters with respect to the SSR markers and to the four landraces object of this study. Average number of observed alleles (Na), effective number of alleles (Ne) per locus, polymorphism information content (PIC), estimates of Shannon’s information index of genetic diversity (I), observed heterozygosity (Ho) and unbiased Nei’s genetic diversity equivalent to the expected heterozygosity (He) are shown. Wright’s inbreeding coefficients FIS, FIT and FST and gene flow (Nm) estimates are also indicated.
LocusNaNePICIHoHeFISFITFSTNm
phi0245.003.540.661.320.590.720.070.190.131.69
phi1276.002.240.470.950.430.550.120.220.111.97
phi0842.001.680.320.600.290.41−0.030.260.280.65
phi0763.002.950.591.090.480.660.140.240.121.84
phi0312.001.750.340.620.390.430.040.090.054.87
phi0574.002.720.551.070.480.630.010.270.260.70
phi0564.001.860.380.770.290.46−0.080.370.420.34
phi0733.002.940.591.090.550.660.010.170.171.24
phi0162.001.000.370.690.2500.500.340.470.191.04
umc10755.004.020.711.470.530.750.160.260.121.84
All loci3.602.570.500.970.430.580.080.250.181.62
St. dev.1.430.800.140.300.120.120.040.030.030.40
Sponcio3.002.09na0.800.460.490.060.210.161.34
Marano2.502.08na0.740.460.470.020.210.191.04
Biancoperla2.501.90na0.690.370.440.150.350.240.78
Rosso Piave3.302.30na0.890.450.530.160.230.083.01
All landraces2.822.09na0.800.430.480.100.250.171.54
St. dev.0.390.16na0.090.040.040.070.070.071.00

