Evidence of Recent Fine-Scale Population Structuring in South American Puma concolor


Departamento de Genética e Evolução, Universidade Federal de São Carlos, São Carlos 13565-905, Brazil
*
Author to whom correspondence should be addressed.
Diversity 2017, 9(4), 44; https://doi.org/10.3390/d9040044
Submission received: 11 August 2017
/
Revised: 4 October 2017
/
Accepted: 7 October 2017
/
Published: 12 October 2017
Abstract
:Habitat loss and fragmentation are considered the major treats to worldwide biodiversity. Carnivores in particular can be more sensitive to landscape modification due to their low occurrence density and large home ranges. Population structuring of Puma concolor has been already reported as a consequence of extensive human activities in the North American continent. Here, we investigated the occurrence of fine-scale population structuring in the South American cougar population, contrasting two conservation areas immersed in a highly human-fragmented landscape dominated by the presence of sugar cane monoculture, roads, and urbanization, including a series of dams in the Tietê River which enlarges its water body. Seven microsatellites were amplified using non-invasive DNA obtained from fecal samples. We conducted genetic clustering analyses using Bayesian and factorial components. We also performed genetic differentiation analyses by fixation indices (Fst and Dest). Two genetic clusters represented by individuals from each area were found, indicating the occurrence of gene flow reduction between the areas. The intense human-induced landscape modification—which includes the Tietê River water body enlargement, imposing physical barriers to the movement of the individuals—could explain the gene flow reduction. Increasing connectivity among the preserved areas can mitigate such effects, and the creation of corridors or further management actions such as individual translocation to ensure gene flow in the highly-modified landscape may be essential for maintaining the genetic and demographic health of the species and its long-term persistence.
1. Introduction
Habitat loss and fragmentation caused by human activities are considered the main factors driving species populations to isolation and decline worldwide [1]. The process of landscape modification may impose barriers to gene flow [2,3,4], which in turn reduces the genetic diversity and decreases population viability in long term [2,5]. Several species are already in a process of genetic diversity and presenting certain level of isolation of their populations [3,4,6,7,8]. Even those species with generalist habits or high dispersal behavior have already experienced negative genetic consequences (e.g., gene flow reduction and population structuring) in human-modified landscapes [2,3,4,9].
Large carnivores in particular may be more sensitive to landscape modification because of their large home range requirements, low population density, and the negative impact caused by conflicts and retaliation due to increased human presence [10]. Additionally, human activities may impose barriers—such as roads, monocultures, and urban areas—negatively affecting individual dispersal and thus gene flow and demographic aspects, even for those species with high dispersal capacity and greater tolerance to the effects of anthropic activities [2,4,9,11]. As a consequence, carnivores have been increasingly restricted to small areas, have been reduced to few individuals [10], and may show genetic population structuring due to fragmentation [2,4,10,11].
Carnivores have an essential role in ecosystems through a top-down population control of other species, affecting demographic aspects [10] which in turn can result in genetic consequences (genetic drift and loss of genetic variation) due to population size reduction for some species [5]. Conservation efforts have been demanded to prioritize these animals, since their absence influences the presence of other species from different trophic levels [10]. Among the large carnivores, the cougar (Puma concolor) is increasingly being affected by habitat loss and fragmentation [3,11]. The species has a widespread distribution throughout the American continent, showing generalist habits as well as high locomotion capacity and dispersal behavior [12,13,14]. Historical population structuring has been reported within the entire distribution area of cougars, characterizing differentiated genetic lineages corresponding to subspecies [15,16]. However, fine-scale population strutucturing within the subspecies level is still little known.
Within the North American P. concolor, human-induced landscape changes have been claimed to explain fine-scale genetic differentiation between populations [3,11]. Thus far, no population structuring was reported between local populations with respect to the South American cougar [17,18]. Nonetheless, human activities have intensively modified the landscape, particularly in the highly populated São Paulo state (Brazil), which has reduced the vegetation to about 12% to 16% of its original cover, now distributed in small fragments (80% < 50 ha, [15]). Within the study area, the predominant landscape is characterized by sugar cane monoculture, roads, urbanization, and the presence of dams in the Tietê River. Over the last 120 years, several hydropower dams have been built, and currently there is a series dams along the Tietê extension which has enlarged its water body in that region. This intense human modification in São Paulo state may be imposing barriers and reducing landscape permeability for individual dispersion, limiting gene flow [2,3,4,6,9].
In this scenario of intense human intervention, we aimed to investigate the occurrence of fine scale population structuring between two conservation areas in a highly human-modified regional landscape. We predict that the habitat modification promoted by the human activities may be already interfering in individual dispersion, affecting the gene flow even between near fragments [2,3,6,7]. For this reason, we applied non-invasive sampling methodology (fecal sample collection), which avoids the use of animal capture and provides data for genetic analysis. This study affords results about the consequences of the human landscape modification on the genetic variation of the species, supporting and alerting the need for mitigation acts to ensure the movement of individuals and potential gene flow.
2. Materials and Methods
2.1. Study Area
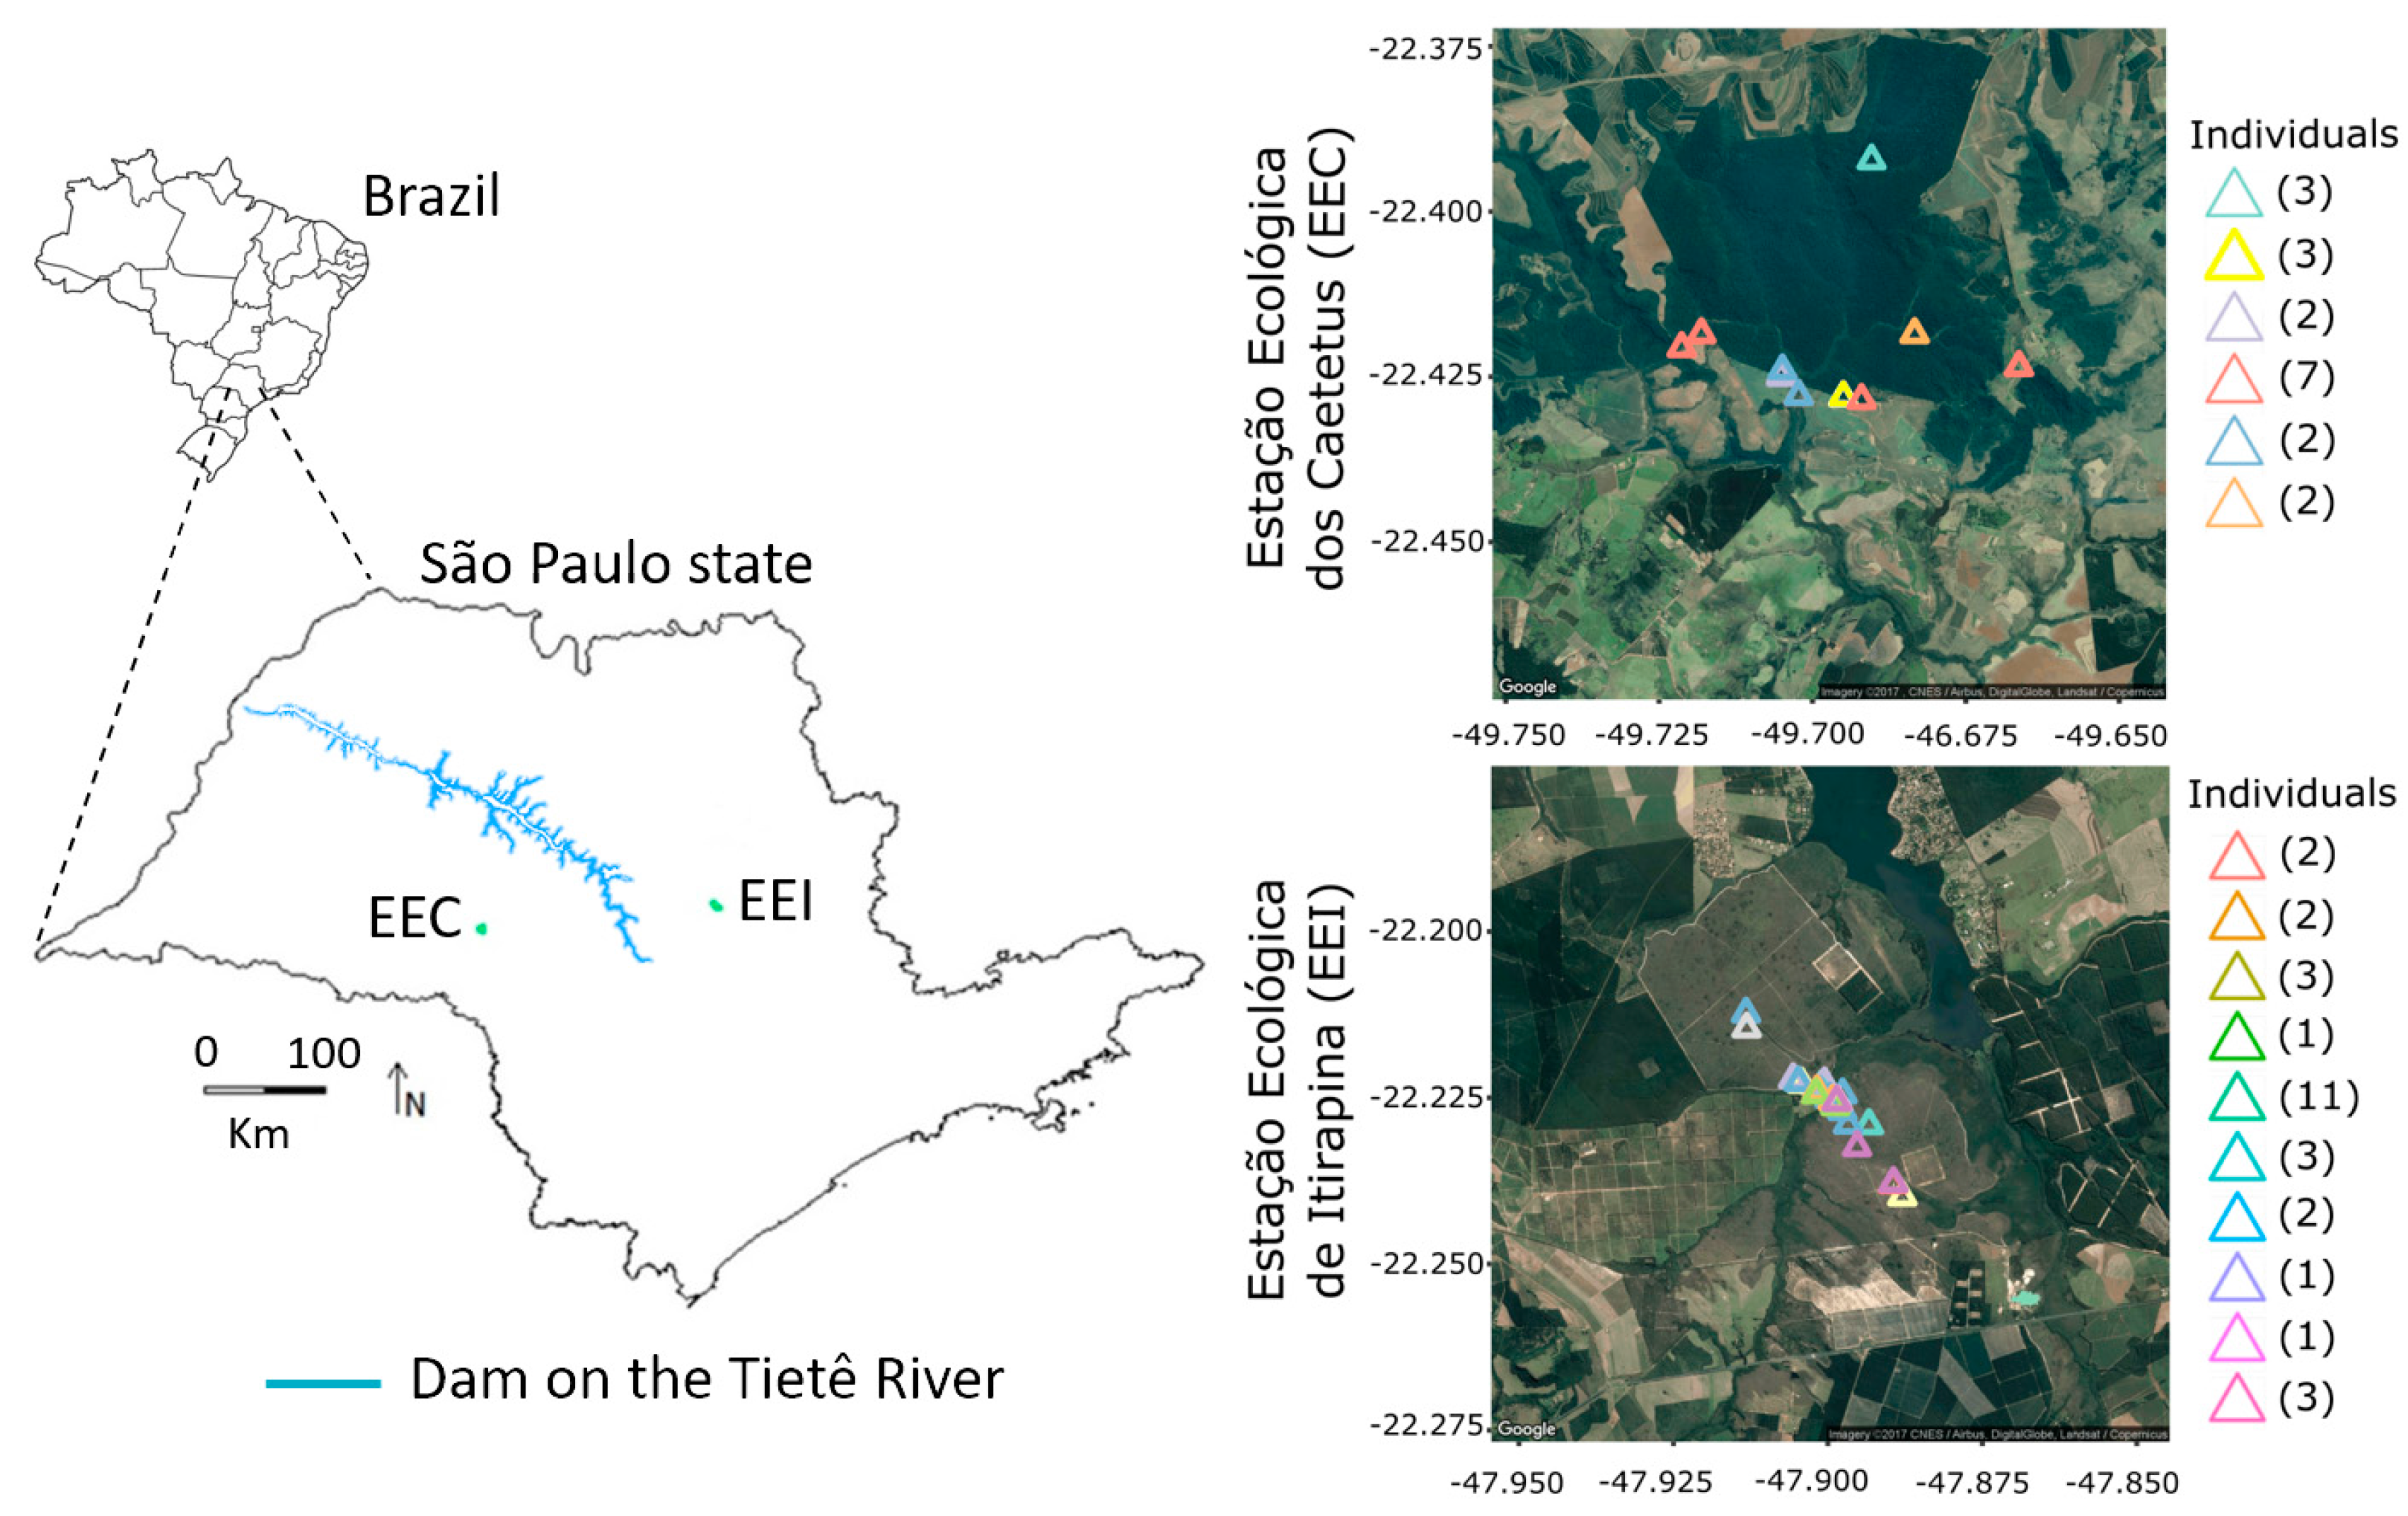
The study was carried out in two conservation areas of São Paulo state, Brazil: Estação Ecológica dos Caetetus (EEC) and Estação Ecológica de Itirapina (EEI) (Figure 1). The EEC represents one of the few conserved inland remnants in this highly populated state, with a total area of 2176 ha covered by stational semidecidual forest (a typical type of vegetation of the inland Atlantic Forest biome). The EEI is in the northeast region, encompassing 3213 ha of heterogeneous vegetation composed of the Cerrado and exotic plantations of Pinus spp. and Eucalyptus spp.
Both study areas are within an intense human-modified landscape, which presents low vegetation cover distributed in small fragments [19]. In the last 100 years, urban expansion and agricultural activities have modified the region and promoted the habitat loss and fragmentation [20]. Nowadays, the region is mainly dominated by sugarcane monoculture [21]. Moreover, the studied areas are separated by several hydropower dams located along the Tietê River. The first dam was built in 1899 [22] and since 1958 other dams have been more intensively built [23], some of them measuring more than 5 km in width. These dams reshaped about 400 km of the Tietê’s bank [23].
2.2. Sample Collection and DNA Extraction
We collected 70 fecal samples in the EEC and another 42 in the EEI that were considered from Puma concolor based on size and morphology of the feces. The sample collections were conducted every month during two-day field expeditions from July 2011 to August 2012. The samples were conditioned in sterilized plastic tubes containing ethanol 96% and kept in freezer at −20 °C until DNA extraction. We extracted DNA using the QIAamp DNA Stool Mini Kit (Qiagen, Hielden, Germany), according to the manufacturer’s recommendations. The sample collection license was provided by the Secretaria do Meio Ambiente/Instituto Florestal (License number 260108-010.667/2010).
2.3. Molecular Species Confirmation
In order to confirm if the samples belonged to Puma concolor, we amplified a fragment of 146 bp from cytochrome b of mitochondrial DNA using the primers described by Farrel et al. [24], as previously used by Miotto et al. [17,25,26] for cougar identification. We adopted the PCR protocol described by Miotto et al. [25] using a Veriti 96-Well Thermal Cycler (Applied Biosystems, Foster City, CA, USA). DNA from tissue samples of known cougars were used as positive control for PCRs.
The PCR products were sequenced in an ABI3730XL sequencer (Applied Biosystems). The obtained sequences were analyzed and aligned with reference sequences (tissue samples and sequences from GenBank) using the Geneious v.7.1.7 software [27]. Genetic distances among the sequences were obtained by MEGA v.6 [28], using Kimura two-parameter model [29] and a neighbor-joining tree [30] was constructed using 1000 bootstrap replicates.
2.4. Microsatellite Genotyping, Fecal Samples Individualization, and Relatdeness
To individualize each fecal sample, we amplified seven microsatellites loci (PcoA208, PcoC108, PcoB003, PcoB010, PcoB210, PcoA339 and PcoA216) described by Kurushima et al. [31], following the PCR protocol described in Miotto et al. [17]. The PCR products were genotyped in MegaBACE ET-550R Size Standard sequencer (Amersham Biosciences, Little Chalfont, UK). In order to avoid genotyping errors associated to the DNA quality from fecal samples, we genotyped each sample in a maximum of five independent PCR, and only those with three confirmed genotypes were considered. The samples that did not have the genotype confirmed three times were discarded from the analyses. Only loci genotyped for at least 70% of the samples were considered. The genotyping analyses were conducted in the Geneious v.7.1.7 software [27].
The individual identification was conducted by the determination of the probability of identity (P(ID)) and the probability of identity assuming the possibility of siblings (P(IDSIBS)) [32], calculated in the GenAlEx v.6.5 software [33]. In the ML-Relate software [34], we calculated the maximum likelihood estimation of relatedness (r) [35] between pairs of individuals within and between the areas to obtain their genetic relatedness.
2.5. Demographic Analysis
We conducted a demographic estimate analysis by capture–recapture history, applying a closed-population model (e.g., no births, deaths, permanent immigration, or emigration). The analysis was conducted in the Capwire software [36] that was developed specifically for non-invasive sampling because in contrast to the traditional capture–recapture methodologies, in non-invasive sampling collection the individual can be sampled more than once on the same occasion. To ensure a closed-population model, we used the capture–recapture history from only the first three months of sampling. As model parameters, we adopted the two innate rates model (TIRM), as the individuals have heterogeneity capture probability.
2.6. Genetic Cluster Analyses
Considering that the studied sites are about 200 km apart from each other, which could not represent a substantial distance for Puma concolor locomotion, we used four different approaches to test for population structuring. We chose to use these multiple tests because population clustering methods may have different resolution power when the differentiation is still incipient. First, we carried out a Bayesian analysis implemented in the Structure v.2.2 software [37], assuming the admixture model and correlated allelic frequencies. The analysis was conducted without prior information of individual locality and we evaluated the possibility of the individuals fit to one-to-four populations (1 < K < 4) using the following parameters: 100 independent runs, “burn-in” of 100,000 steps and 200,000 Markov chain Monte Carlo (MCMC) iterations. The most likely number of K was calculated based on Delta K as described in Evanno et al. [38]. After checking the most likely number of K, we conducted the analysis again with the same parameters but adopting locate information to check our hypotheses of a separation between the areas. A Bayesian approach was also conducted considering the spatial distribution of individuals implemented in the Geneland package [39]. We conducted the analyses using spatial model with uncorrelated allele frequency. Even though the correlated frequency model is more efficient detecting subtle differentiations, it is more sensitive to violation of model assumptions, like isolation by distance, and is prone to algorithm instabilities [39], which can generate unrealistic groups. Preliminarily, we ran 20 spatial models with K values ranging from 1 to the number of individuals (16), using 1,000,000 MCMC iterations and 100 thinning iterations. The final spatial model was run, setting K between 1 and the maximum number of clusters obtained of the initial runs (8), using 10,000,000 MCMC iterations and 200 thinning iterations. We also inferred population structuring by factorial component analysis (FCA) using Genetix v.4.05 software [40]. Finally, the fixation indices FST [41] and Dest [42] were evaluated in the FSTAT v.2.9.3.2 software [43] and in the R statistical environment [44] with the DEMEtics package [45], respectively.
2.7. Gene Flow
Because our analyses indicated population structuring between the studied areas, we tested the gene flow occurrence and its direction using the Migrate-N v.3.6.11 software [46]. Four migration models were evaluated: (1) panmixia; (2) migration from EEI to EEC; (3) migration from EEC to EEI; and (4) migration between the two populations. For each model, we ran the Brownian motion model with one long chain with 20,000 recorded steps and a 500-step increment with a burn-in for chain of 4000. The prior distributions for theta and migration were uniform. The static heating, random genealogy, and parameter settings inferred by an FST-based method were used in the analysis. We also calculated the mean number of private alleles in the GenAlEx v.6.5 software [33], which can show a limitation of gene flow between the areas.
2.8. Genetic Diversity Analysis
Considering the clustering analyses indicated both studied local populations as genetically differentiated, we conducted a genetic diversity analysis within each population. First, we verified the presence of null alleles, false alleles, and allelic dropout using the Micro-Checker v.2.2.3 software [47]. Hardy–Weinberg (HWE) deviation and linkage disequilibrium (LD) were evaluated in Genepop v.4.0.10 [48] using MCMC parameters as 10,000 dememorizations, 1000 batches, and 10,000 iterations per batch. The p-values were adjusted by Bonferroni correction [49]. We calculated expected (He) and observed heterozygosity (Ho) and heterozygote excess in the Genepop v.4.0.10 software [8]. The number of alleles (A) were obtained using GenAlEx v.6.5 [33]. The heterozygosity deficit and excess were evaluated to check inbreeding in the population by calculating the Fis coefficient in the FSTAT v.2.9.3.2 software [43].
We also performed a rarefaction analysis for testing the effect of sample size on the obtained results. For that, we calculated allelic richness (AR) in the Hp-Rare software by the rarefaction method [50] to compensate the unequal sample size. Further, we simulated the population size up to 100 individuals, using the Hybridlab software [51], in order to verify if our allelic richness values would be representative. The values were plotted using R statistical environment [44].
3. Results and Discussion
3.1. Non-Invasive Samples, Discrimination of Individuals, and Demographic Estimatives
From the total of 112 fecal samples collected as belonging to the cougar by morphological aspects in both sites, a total of 48 were molecularly identified as P. concolor (EEC = 19; EEI = 29). We successfully genotyped the 48 samples and all loci were genotyped for at least 70% of the samples: one loci (PcoA339) presented 87.5% of amplification successes, three loci (PcoB003, PcoA216, and PcoB210) presented 93.5%, and the others presented 100% of successes amplification. From the 48 samples, we identified a total of 16 individuals (EEC = six individuals; EEI = 10 individuals). The P(ID) and P(IDSIBS) values (P(ID) = 6.8 × 10⁻¹¹ and P(IDSIBS) = 5.0 × 10⁻⁴) were highly satisfactory for individual identification in both studied areas [32]. No individual was detected in either of the areas. Relatedness analyses found r values ranging from zero to 0.50 to the pairs of individuals (Table S1). Different genetic relatedness levels were detected from individuals within both areas, showing minor levels of relatedness (r = 0) up to more related individuals (r = 0.50). However, the r values ranged from 0 to 0.17 between the areas, indicating lower levels of relatedness between the individuals from each area. It is expected that relatedness is inversely proportional with distance, even in animals with higher dispersion capability [52].
Previous studies conducted in other conservation areas of similar sizes detected similar number of individuals [25], suggesting that the minimum population size we found in both areas is representative. Even areas six and eight times larger than these studied here showed approximately only twice more individuals that we found [26,53]. Favoring our argument, the demographic abundance estimate based in the capture–recapture history indicated 6 (95% CI, 5–8) and 11 (95% CI, 10–14) individuals for the EEC and EEI populations, respectively. Thus, it is strongly suggested that we have sampled most of the existing individuals in both conservation areas.
3.2. Population Genetic Structuring
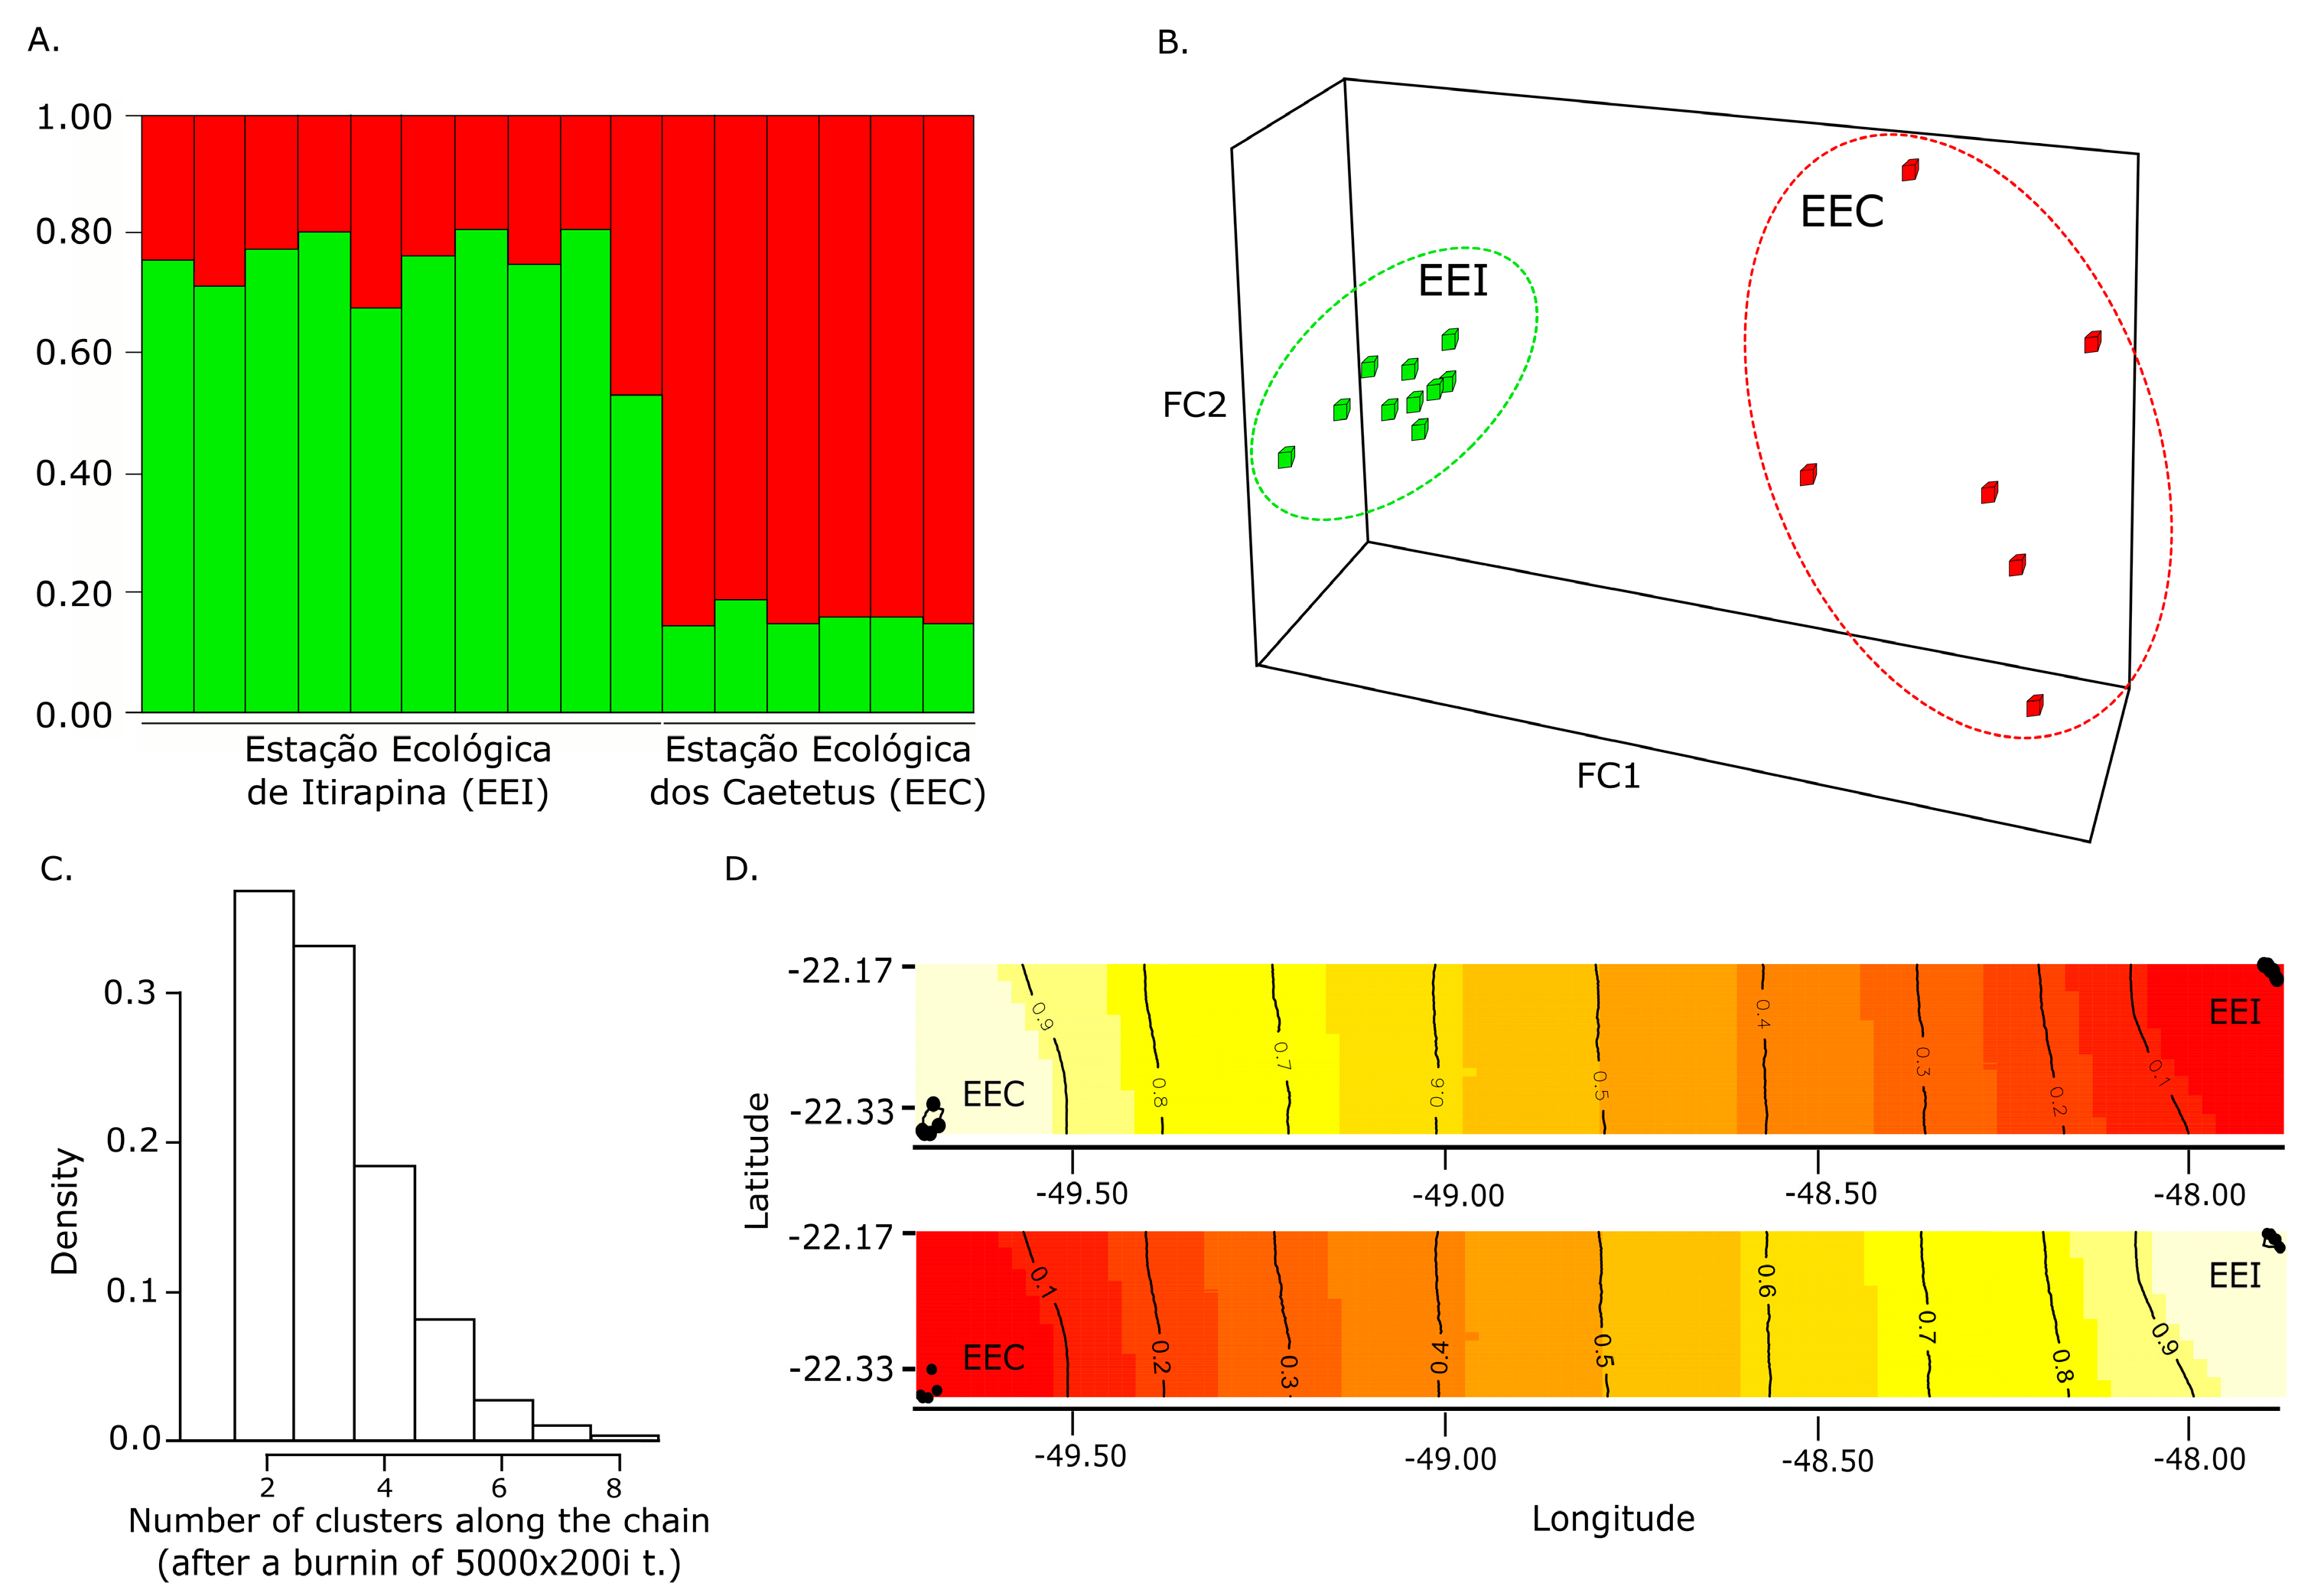
Despite the relatively small area studied here compared with the whole distribution area of South American cougar, fine-scale population genetic structuring was indicated by all used metrics. The Bayesian analysis conducted in the Structure software indicated the presence of two clusters (K = 2, with and without prior located information) (Figure 2A), separately grouping individuals from EEI and EEC. The presence of two clusters represented by individuals from each sampling area was also evidenced by the FCA (Figure 2B) and Geneland analyses (Figure 2C,D). Concordantly, the Fst (Fst = 0.082; p < 0.01) and Dest values (Dest = 0.388; p < 0.05) reinforced the occurrence of gene flow reduction between both sites. Fine-scale population structuring was previously reported in Puma concolor couguar, the North American subspecies, in which the Fst value between the studied populations was slightly lower ([3]; Fst = 0.07) than the one obtained here. We also detected area-private alleles (mean number of private alleles: EEC = 3.87; EEI = 5.14), which could be attributed to a potential restriction to the gene flow between both areas. Concordantly, our Migrate-N gene flow analysis indicated a limited and preferential gene flow from EEC to EEI, which may reflect a past or remnant gene flow (model probability > 0.99). The last individual assigned as from the EEI clusters in the Structure results with membership coefficient close to 50% also indicates the presence of recent fine-scale population structuring.
Our findings on fine-scale population structuring in the South American cougar are novel, showing the first evidence of population structuring within the Puma concolor capricornensis subspecies [15]. This evidence in turn reinforces the need for more studies to understand the biology and population structure of cougars and how land-use changes area leading to the structure observed here. Lack of population structuring was observed for cougars inhabiting the South region in the Brazilian territory, with a permeable regional matrix being described for the species [18]. Studies in the northeast region of the São Paulo state (above the Tietê River), using the same set of microsatellites used here, found no population structuring [17]. As the predominant matrix of this latter area is very similar to the present study area, we believe the main cause for the gene flow limitation observed here is the presence of the hydropower dams in the Tietê River, which did not exist in the area studied by Miotto et al. [17]. Thus, although the linear distance between the areas studied here is relatively short for animals with high dispersal behavior such as the cougar, several recent and intense land-use changes have restricted individual dispersal by imposing barriers to movement, which in turn, reduces the functional connectivity among the remaining fragments [54,55]. Besides plantations, roads, and urbanization, the Tietê River is an important element in the regional landscape. It could be suggested that the presence of the human-made cascade of dams, extensively enlarging the body water in the region, could be contributing to gene flow reduction between the two studied sites. Although cougars have a plastic behavior, other rivers have been reported as gene flow barriers for this species [11,56], since the species avoids crossing natural or human-modified large water bodies [57,58]. Thus, considering the landscape heterogeneity increasingly typical in this part of our country, recent fine scale population structuring could represent an ongoing process among cougar populations. Recent human actions have already been reported as promoting barriers for gene flow among local populations of North American cougar [3,59]. Of note, our findings indicate that the methodology used here was able to detect a fine-scale genetic structuring. If so, this genetic structuring could be accounted for by the recent human-promoted landscape modification, acting upon no more than 20 generations of cougars (estimated generation size = 4–5 years, [10]), considering only the past 100 years of more intense and diverse land use. Alternatively, this genetic clustering in the sampled populations would be a doubtful historical population attribute, since mitochondrial DNA study revealed no population structuring within the studied subspecies [15]. An artifact due to a small sample size was not corroborated by the rarefaction analysis (Figure S1), which also can be reinforced by comparing the genetic diversity parameters obtained in previous studies (see next topic).
3.3. Genetic Diversity
Our analyses did not detect null alleles, but detected false alleles and allelic dropout (Table S2), which are common problems for non-invasive sampling [60]. We addressed this by assuming the genotype only after the confirmation in the replicates. We did not detect linkage disequilibrium for any of the loci used, as well as no deviation from the Hardy–Weinberg equilibrium, confirming that all microsatellites were useful and informative enough for the genetic population analysis.
The EEI individuals presented lower observed heterozygosity compared to ECC, probably due to the presence of more individuals with more homozygotic loci. However, the genetic diversity parameters (A, AR, He, Ho) evaluated within both populations (Table 1) showed similar values to those found in other studies in populations of South American cougar [17,18]. The relatively high values of AR and He, suggesting a certain level of good genetic health of these local populations, need to be seen with caution, since the potential gene flow limitation observed here can in the long term impact the local genetic variation. Subtle loss of heterozygotes may be already occurring as indicated by the differences of observed and expected heterozygosity and by the Fis analysis. For both genetic clusters, Fis were only not significant when the p-value was adjusted (p-value = 0.004) for heterozygosity deficit (EEI: Fis = 0.166, p = 0.007; EEC: Fis = 0.416, p = 0.036) (Table 1). However, a smaller Fis value was previously used to report in-progress genetic variation loss in South American cougar (Fis = 0.108, p ≤ 0.05) [18]. In this sense, a similar conclusion could be reached for the populations studied here, and the gene flow reduction observed could accelerate this process of putative genetic variation loss. The continuity of these analyses within these populations as well as in other adjacent populations is encouraged.
4. Conclusions
Considering a very small parcel of the distribution area of South American cougar represented by the areas occupied by both sampled populations, a fine-scale population structuring was observed. This is likely due to recent human-promoted landscape modifications, and can be alarming, demonstrating that even populations of an adaptable species can become genetically structured within a fragmented habitat immersed in an increasingly human-modified landscape. Identifying the potential barriers for the cougar’s movement, such as hydropower dams, will enable to guide mitigation acts to ensure the maintenance of gene flow, which in turn will avoid the negative consequences related to small and isolated populations (e.g., endogamy and genetic diversity loss). Further studies sampling along the both areas and other localities are still necessary to better understand the consequences of the human-altered landscape with respect to local and regional gene flow reduction in the South American Puma concolor. However, our results already suggest a reduction of gene flow and a potential genetic variation loss, which could be mitigated by increasing connectivity among the preserved areas. Thus, the creation of corridors to connect the remnant fragments in a highly modified landscape could be essential to maintaining the genetic and demographic health of the species and its long-term persistence, since migrant individuals can make a positive and significative contribution to the genetics of a small and isolated population [61]. However, the presence of large water body (5 km width in some parts) impairs the creation of corridors linking both sides of the river, and in this sense, management actions can consider the translocation of individuals to ensure the gene flow between areas. Our results highlight the need for gene flow conservation in this region for P. concolor, and potentially other species which could be affected similarly.
Supplementary Materials
The following are available online at www.mdpi.com/1424-2818/9/4/44/s1, Figure S1: Rarefaction analysis of Allelic richness values for a simulated population up to 100 individuals, Table S1: Relatedness values (r) for pairs of individuals in both areas, Table S2: False Allele and Allelic Dropout rates.
Acknowledgments
This work is due to the Top Predator network (SISBIOTA – CNPq, 563299/2010-0; FAPESP, 2010/52315-7). BHS thanks Fundação de Amparo à Pesquisa do Estado de São Paulo (FAPESP, 2013/24453-4). PMGJ thanks Conselho Nacional de Desenvolvimento Científico e Tecnológico (CNPq, 308385/2014-4). KCC thanks Coordenação de Aperfeiçoamento de Pessoal de Nível Superior (CAPES). We also thank CENAP (Centro Nacional de Pesquisa e Conservação de Mamíferos Carnívoros) for providing tissue samples used as control samples, and Idea Wild for granting the Geneious software license. The authors are also thankful for the constructive comments of three anonymous reviewers which improved the manuscript.
Author Contributions
Bruno H. Saranholi, Karla Chávez-Congrains, and Pedro M. Galetti Jr conceived and designed the study; Bruno H. Saranholi and Karla Chávez-Congrains collected the samples and conducted the data analyses; and all the authors discussed the results and wrote the paper.
Conflicts of Interest
The authors declare no conflict of interest.
References
- Haddad, N.M.; Brudvig, L.A.; Clobert, J.; Davies, K.F.; Gonzalez, A.; Holt, R.D.; Lovejoy, T.E.; Sexton, J.O.; Austin, M.P.; Collins, C.D.; et al. Habitat fragmentation and its lasting impact on Earth’s ecosystems. Sci. Adv. 2015, 1. [Google Scholar] [CrossRef] [PubMed]
- Dutta, T.; Sharma, S.; Maldonado, J.E.; Wood, T.C.; Panwar, H.S.; Seidensticker, J. Fine-scale population genetic structure in a wide-ranging carnivore, the leopard (Panthera pardus fusca) in central India. Divers. Distrib. 2013, 19, 760–771. [Google Scholar] [CrossRef]
- Ernest, H.B.; Vickers, T.W.; Morrison, S.A.; Buchalski, M.R.; Boyce, W.M. Fractured genetic connectivity threatens a southern California puma (Puma concolor) population. PLoS ONE 2014, 9, e107985. [Google Scholar] [CrossRef] [PubMed]
- Singh, S.K.; Aspi, J.; Kvist, L.; Sharma, R.; Pandey, P.; Mishra, S.; Singh, R.; Agrawal, M.; Goyal, S.P. Fine-scale population genetic structure of the Bengal tiger (Panthera tigris tigris) in a human-dominated western Terai Arc Landscape, India. PLoS ONE 2017, 12, e0174371. [Google Scholar] [CrossRef] [PubMed]
- Frankham, R.; Ballou, J.D.; Briscoe, D.A. Introduction to Conservation Genetics; Cambridge University Press: Cambridge, UK, 2010; ISBN 0521878470. [Google Scholar]
- Haag, T.; Santos, A.S.; Sana, D.A.; Morato, R.G.; Cullen, L.; Crawshaw, P.G.; De Angelo, C.; Di Bitetti, M.S.; Salzano, F.M.; Eizirik, E. The effect of habitat fragmentation on the genetic structure of a top predator: Loss of diversity and high differentiation among remnant populations of Atlantic Forest jaguars (Panthera onca). Mol. Ecol. 2010, 19, 4906–4921. [Google Scholar] [CrossRef] [PubMed]
- Wultsch, C.; Waits, L.P.; Kelly, M.J. A comparative analysis of genetic diversity and structure in jaguars (Panthera onca), pumas (Puma concolor), and ocelots (Leopardus pardalis) in fragmented landscapes of a critical Mesoamerican linkage zone. PLoS ONE 2016, 11, e0151043. [Google Scholar] [CrossRef] [PubMed]
- Proctor, M.F.; McLellan, B.N.; Strobeck, C.; Barclay, R.M.R. Genetic analysis reveals demographic fragmentation of grizzly bears yielding vulnerably small populations. Proc. R. Soc. Lond. B Biol. Sci. 2005, 272, 2409–2416. [Google Scholar] [CrossRef] [PubMed]
- McManus, J.S.; Dalton, D.L.; Kotzé, A.; Smuts, B.; Dickman, A.; Marshal, J.P.; Keith, M. Gene flow and population structure of a solitary top carnivore in a human-dominated landscape. Ecol. Evol. 2015, 5, 335–344. [Google Scholar] [CrossRef] [PubMed]
- Ripple, W.J.; Estes, J.A.; Beschta, R.L.; Wilmers, C.C.; Ritchie, E.G.; Hebblewhite, M.; Berger, J.; Elmhagen, B.; Letnic, M.; Nelson, M.P. Status and ecological effects of the world’s largest carnivores. Science 2014, 343, 1241484. [Google Scholar] [CrossRef] [PubMed]
- Loxterman, J.L. Fine scale population genetic structure of pumas in the Intermountain West. Conserv. Genet. 2011, 12, 1049–1059. [Google Scholar] [CrossRef]
- Logan, K.A.; Sweanor, L.L. Desert Puma: Evolutionary Ecology and Conservation of an Enduring Carnivore; Island Press: Washington, DC, USA, 2001; ISBN 1559638672. [Google Scholar]
- Hawley, J.E.; Rego, P.W.; Wydeven, A.P.; Schwartz, M.K.; Viner, T.C.; Kays, R.; Pilgrim, K.L.; Jenks, J.A. Long-distance dispersal of a subadult male cougar from South Dakota to Connecticut documented with DNA evidence. J. Mammal. 2016, 97, 1435–1440. [Google Scholar] [CrossRef]
- Morrison, C.D.; Boyce, M.S.; Nielsen, S.E. Space-use, movement and dispersal of sub-adult cougars in a geographically isolated population. PeerJ 2015, 3, e1118. [Google Scholar] [CrossRef] [PubMed]
- Culver, M.; Johnson, W.E.; Pecon-Slattery, J.; O’Brien, S.J. Genomic ancestry of the American puma (Puma concolor). J. Hered. 2000, 91, 186–197. [Google Scholar] [CrossRef] [PubMed]
- Caragiulo, A.; Dias-freedman, I.; Clark, J.A.; Rabinowitz, S.; Amato, G. Neotropic pumas (Puma concolor). 2013, 1736, 1–9. [Google Scholar] [CrossRef]
- Miotto, R.A.; Cervini, M.; Figueiredo, M.G.; Begotti, R.A.; Galetti, P.M. Genetic diversity and population structure of pumas (Puma concolor) in southeastern Brazil: Implications for conservation in a human-dominated landscape. Conserv. Genet. 2011, 12, 1447–1455. [Google Scholar] [CrossRef]
- Castilho, C.S.; Marins-Sá, L.G.; Benedet, R.C.; Freitas, T.R.O. Genetic structure and conservation of Mountain Lions in the South-Brazilian Atlantic Rain Forest. Genet. Mol. Biol. 2012, 35, 65–73. [Google Scholar] [CrossRef]
- Ribeiro, M.C.; Metzger, J.P.; Martensen, A.C.; Ponzoni, F.J.; Hirota, M.M. The Brazilian Atlantic Forest: How much is left, and how is the remaining forest distributed? Implications for conservation. Biol. Conserv. 2009, 142, 1141–1153. [Google Scholar] [CrossRef]
- Dean, W. A Ferro e Fogo: A História e a Devastação da Mata Atlântica Brasileira; Companhia das Letras: São Paulo, Brazil, 1996; ISBN 8571645906. [Google Scholar]
- Martinelli, L.A.; Filoso, S. Expansion of sugarcane ethanol production in Brazil: Environmental and social challenges. Ecol. Appl. 2008, 18, 885–898. [Google Scholar] [CrossRef] [PubMed]
- Victorino, V.I.P. O Acaso Das Águas na Privatização Dos Rios. Estamos Todos a Juzante; Novos Estudos; Cebrap: São Paulo, Brazil, 1999; pp. 176–194. [Google Scholar]
- Massei, R. A Construção da Usina Hidrelétrica Barra Bonita e a Relação Homem-Natureza: Vozes Dissonantes, Interesses Contraditórios (1940–1970). In Proceedings of the XXIV Simpósio Nacional de História, São Leopoldo, Brazil, 15–20 July 2007. [Google Scholar]
- Farrell, L.E.; Roman, J.; Sunquist, M.E. Dietary separation of sympatric carnivores identified by molecular analysis of scats. Mol. Ecol. 2001, 9, 1583–1590. [Google Scholar] [CrossRef]
- Miotto, R.A.; Rodrigues, F.P.; Ciocheti, G.; Manoel, P.G., Jr.; Lu, W. Determination of the Minimum Population Size of Pumas (Puma concolor) Through Fecal DNA Analysis in Two Protected Cerrado Areas in the Brazilian Southeast. Biotropica 2007, 39, 647–654. [Google Scholar] [CrossRef]
- Miotto, R.A.; Cervini, M.; Kajin, M.; Begotti, R.A.; Galetti, P.M. Estimating puma Puma concolor population size in a human-disturbed landscape in Brazil, using DNA mark–recapture data. Oryx 2014, 48, 250–257. [Google Scholar] [CrossRef]
- Kearse, M.; Moir, R.; Wilson, A.; Stones-Havas, S.; Cheung, M.; Sturrock, S.; Buxton, S.; Cooper, A.; Markowitz, S.; Duran, C. Geneious Basic: An integrated and extendable desktop software platform for the organization and analysis of sequence data. Bioinformatics 2012, 28, 1647–1649. [Google Scholar] [CrossRef] [PubMed]
- Tamura, K.; Stecher, G.; Peterson, D.; Filipski, A.; Kumar, S. MEGA6: Molecular evolutionary genetics analysis version 6.0. Mol. Biol. Evol. 2013, 30, 2725–2729. [Google Scholar] [CrossRef] [PubMed]
- Kimura, M. A simple method for estimating evolutionary rates of base substitutions through comparative studies of nucleotide sequences. J. Mol. Evol. 1980, 16, 111–120. [Google Scholar] [CrossRef] [PubMed]
- Saitou, N.; Nei, M. The neighbor-joining method: A new method for reconstructing phylogenetic trees. Mol. Biol. Evol. 1987, 4, 406–425. [Google Scholar] [PubMed]
- Kurushima, J.D.; Collins, J.A.; Well, J.A.; Ernest, H.B. Development of 21 microsatellite loci for puma (Puma concolor) ecology and forensics. Mol. Ecol. Notes 2006, 6, 1260–1262. [Google Scholar] [CrossRef]
- Waits, L.P.; Luikart, G.; Taberlet, P. Estimating the probability of identity among genotypes in natural populations: Cautions and guidelines. Mol. Ecol. 2001, 10, 249–256. [Google Scholar] [CrossRef] [PubMed]
- PE, P.R.S. GenAlEx 6.5: Genetic analysis in Excel. Population genetic software for teaching and research—An update. Bioinformatics 2012, 28, 2537–2539. [Google Scholar]
- Kalinowski, S.T.; Wagner, A.P.; Taper, M.L. ML-Relate: A computer program for maximum likelihood estimation of relatedness and relationship. Mol. Ecol. Res. 2006, 6, 576–579. [Google Scholar] [CrossRef]
- Blouin, M. DNA-based methods for pedigree reconstruction and kinship analysis in natural populations. TREE 2003, 18, 503–511. [Google Scholar] [CrossRef]
- Miller, C.R.; Joyce, P.; Waits, L.P. A new method for estimating the size of small populations from genetic mark–recapture data. Mol. Ecol. 2005, 14, 1991–2005. [Google Scholar] [CrossRef] [PubMed]
- Pritchard, J.K.; Stephens, M.; Donnelly, P. Inference of population structure using multilocus genotype data. Genetics 2000, 155, 945–959. [Google Scholar] [PubMed]
- Evanno, G.; Regnaut, S.; Goudet, J. Detecting the number of clusters of individuals using the software STRUCTURE: A simulation study. Mol. Ecol. 2005, 14, 2611–2620. [Google Scholar] [CrossRef] [PubMed]
- Guillot, G.; Mortier, F.; Estoup, A. GENELAND: A computer package for landscape genetics. Mol. Ecol. Resour. 2005, 5, 712–715. [Google Scholar] [CrossRef]
- Belkhir, K.; Borsa, P.; Chikhi, L.; Raufaste, N.; Bonhomme, F. GENETIX, Version 4.05; Windows TM software for population genetics; Lab. Génome, Popul. Interact. CNRS UMR 5000; 2004.
- Wright, S. The genetical structure of populations. Ann. Hum. Genet. 1949, 15, 323–354. [Google Scholar] [CrossRef]
- Jost, L.O.U. GST and its relatives do not measure differentiation. Mol. Ecol. 2008, 17, 4015–4026. [Google Scholar] [CrossRef] [PubMed]
- Goudet, J. FSTAT, a Program to Estimate and Test Gene Diversities and Fixation Indices (Version 2.9.3). Available online: https://www2.unil.ch/popgen/softwares/fstat.htm (accessed on 30 May 2017).
- Team, R.C. R: A Language and Environment for Statistical Computing; R Foundation for Statistical Computing: Vienna, Austria, 2017. [Google Scholar]
- Jueterbock, A.; Kraemer, P.; Gerlach, G.; Deppermann, J.; Jueterbock, M.A. Package “DEMEtics”. Mol. Ecol. 2012, 19, 3845–3852. [Google Scholar]
- Beerli, P.; Palczewski, M. Unified framework to evaluate panmixia and migration direction among multiple sampling locations. Genetics 2010, 185, 313–326. [Google Scholar] [CrossRef] [PubMed]
- Oosterhout, C.V.; Hutchinson, W.F.; Wills, D.P.M.; Shipley, P. Micro-checker: Software for identifying and correcting genotyping errors in microsatellite data. Mol. Ecol. Notes 2004, 4, 535–538. [Google Scholar] [CrossRef]
- Rousset, F. Genepop’007: A complete re-implementation of the genepop software for Windows and Linux. Mol. Ecol. Resour. 2008, 8, 103–106. [Google Scholar] [CrossRef] [PubMed]
- Rice, W.R. Analyzing tables of statistical tests. Evolution 1989, 43, 223–225. [Google Scholar] [CrossRef] [PubMed]
- Kalinowski, S.T. Hp-Rare 1.0: A Computer Program for Performing Rarefaction on Measures of Allelic Richness. Mol. Ecol. Notes 2005, 5, 187–189. [Google Scholar] [CrossRef]
- Nielsen, E.E.; Bach, L.A.; Kotlicki, P. HYBRIDLAB (version 1.0): A program for generating simulated hybrids from population samples. Mol. Ecol. Resour. 2006, 6, 971–973. [Google Scholar] [CrossRef]
- Anderson, C.R., Jr.; Lindzey, F.G.; McDonald, D.B. Genetic structure of cougar populations across the Wyoming Basin: Metapopulation or megapopulation. J. Mammal. 2004, 85, 1207–1214. [Google Scholar] [CrossRef]
- Miotto, R.A.; Cervini, M.; Begotti, R.A.; Galetti, P.M., Jr. Monitoring a Puma (Puma concolor) Population in a Fragmented Landscape in Southeast Brazil. Biotropica 2012, 44, 98–104. [Google Scholar] [CrossRef]
- McRae, B.H.; Beier, P.; Dewald, L.E.; Huynh, L.Y.; Keim, P. Habitat barriers limit gene flow and illuminate historical events in a wide-ranging carnivore, the American puma. Mol. Ecol. 2005, 14, 1965–1977. [Google Scholar] [CrossRef] [PubMed]
- Fattebert, J.; Robinson, H.S.; Balme, G.; Slotow, R.; Hunter, L. Structural habitat predicts functional dispersal habitat of a large carnivore: How leopards change spots. Ecol. Appl. 2015, 25, 1911–1921. [Google Scholar] [CrossRef] [PubMed]
- Wheeler, D.C.; Waller, L.A. Spatial analysis linking landscape features and genetic population structure in cougars (Puma concolor) in the northern Rocky Mountains. Stat. Interface 2012, 5, 183–193. [Google Scholar]
- Dickson, B.G.; Roemer, G.W.; McRae, B.H.; Rundall, J.M. Models of regional habitat quality and connectivity for pumas (Puma concolor) in the southwestern United States. PLoS ONE 2013, 8, e81898. [Google Scholar] [CrossRef] [PubMed]
- Rabinowitz, A. Cougar: Ecology and Conservation; University of Chicago Press: Chicago, IL, USA, 2009; ISBN 0226353478. [Google Scholar]
- Ernest, H.B.; Boyce, W.M.; Bleich, V.C.; May, B.; Stiver, S.J.; Torres, S.G. Genetic structure of mountain lion (Puma concolor) populations in California. Conserv. Genet. 2003, 4, 353–366. [Google Scholar] [CrossRef]
- Taberlet, P.; Griffin, S.; Goossens, B.; Questiau, S.; Manceau, V.; Escaravage, N.; Waits, L.P.; Bouvet, J. Reliable genotyping of samples with very low DNA quantities using PCR. Nucleic Acids Res. 1996, 24, 3189–3194. [Google Scholar] [CrossRef] [PubMed]
- Gustafson, K.D.; Vickers, T.W.; Boyce, W.M.; Ernest, H.B. A single migrant enhances the genetic diversity of an inbred puma population. R. Soc. Open Sci. 2017, 4, 170115. [Google Scholar] [CrossRef] [PubMed]
Figure 1.
Map of the study area with a representation of the hydropower’s dams along the Tietê River and the distribution of the individual scat samples. The numbers in parentheses indicate the number of times that the same individual was sampled. EEC: Estação Ecológica dos Caetetus; EEI: Estação Ecológica de Itirapina.

Figure 2.
Genetic clustering analyses: (A) Membership coefficient (Q) of each individual in the genetic clusters determined by Structure with K = 2; (B) Factorial component analysis graph from Genetix; (C) Posterior distribution of the number of clusters estimated in Geneland; (D) Maps of the membership posterior probability to the two genetic clusters based on the Geneland analyses. Black dots represent individual samples, contour lines indicate the spatial change in the assignment probability, and lighter colors indicate higher probabilities of membership to a cluster. EEC: Estação Ecológica dos Caetetus; EEI: Estação Ecológica de Itirapina.


Table 1.
Genetic variability at seven microsatellite loci for Puma concolor in the two conservation areas.
Table 1.
Genetic variability at seven microsatellite loci for Puma concolor in the two conservation areas.
| Locus | A | AR | Ho | He | Hexcess | Fis | |
|---|---|---|---|---|---|---|---|
| Estação Ecológica dos Caetetus (EEC) N = 6 | PcoA208 | 7.00 | 4.521 | 0.60 | 0.82 | 0.98 | 0.434 |
| PcoC108 | 5.00 | 5.059 | 0.70 | 0.64 | 0.67 | 0.444 | |
| PcoB003 | 6.00 | 6.133 | 0.50 | 0.65 | 0.99 | 0.158 | |
| PcoB010 | 9.00 | 3.871 | 0.80 | 0.87 | 0.91 | 0.184 | |
| PcoA216 | 9.00 | 6.133 | 0.90 | 0.88 | 0.71 | 0.600 | |
| PcoB210 | 7.00 | 6.303 | 0.67 | 0.77 | 0.92 | 0.123 | |
| PcoA339 | 6.00 | 3.000 | 0.60 | 0.76 | 0.94 | 1.000 | |
| Mean | 7.00 | 5.003 | 0.68 | 0.77 | - | 0.416 | |
| Estação Ecológica de Itirapina (EEI) N = 10 | PcoA208 | 5.00 | 6.795 | 0.50 | 0.78 | 0.98 | 0.316 |
| PcoC108 | 6.00 | 4.889 | 0.50 | 0.79 | 0.98 | −0.050 | |
| PcoB003 | 7.00 | 5.789 | 0.80 | 0.84 | 0.96 | 0.280 | |
| PcoB010 | 4.00 | 8.689 | 0.67 | 0.74 | 0.91 | 0.127 | |
| PcoA216 | 7.00 | 8.784 | 0.40 | 0.84 | 1.00 | 0.024 | |
| PcoB210 | 8.00 | 7.000 | 0.83 | 0.86 | 0.96 | 0.193 | |
| PcoA339 | 3.00 | 5.795 | 0.20 | 0.63 | 1.00 | 0.260 | |
| Mean | 5.71 | 6.820 | 0.56 | 0.78 | - | 0.166 |
N: sample size; A: number of alleles; AR: allelic richness; Ho: observed heterozygosity; He: expected heterozygosity; Hexcess: p-values for heterozygosity excess; Fis: inbreeding coefficient.
© 2017 by the authors. Licensee MDPI, Basel, Switzerland. This article is an open access article distributed under the terms and conditions of the Creative Commons Attribution (CC BY) license (http://creativecommons.org/licenses/by/4.0/).
Share and Cite
MDPI and ACS Style
Saranholi, B.H.; Chávez-Congrains, K.; Galetti, P.M. Evidence of Recent Fine-Scale Population Structuring in South American Puma concolor. Diversity 2017, 9, 44. https://doi.org/10.3390/d9040044
AMA Style
Saranholi BH, Chávez-Congrains K, Galetti PM. Evidence of Recent Fine-Scale Population Structuring in South American Puma concolor. Diversity. 2017; 9(4):44. https://doi.org/10.3390/d9040044
Chicago/Turabian StyleSaranholi, Bruno H., Karla Chávez-Congrains, and Pedro M. Galetti. 2017. "Evidence of Recent Fine-Scale Population Structuring in South American Puma concolor" Diversity 9, no. 4: 44. https://doi.org/10.3390/d9040044
Note that from the first issue of 2016, this journal uses article numbers instead of page numbers. See further details here.