Experimental
Disodium hydrogen orthophosphate, sodium dihydrogen orthophosphate, dipotassium hydrogen orthophosphate trihydrate, potassium dihydrogen orthophosphate, sodium chloride, sodium hydroxide, methanol, acetone, isopropyl alcohol, hydrochloric acid and nitric acid were all at least AnalaR quality and were supplied by BDH Laboratory Supplies. Ferrocenecarboxylic acid, 4,4'-bipyridyl disulphide, L-cysteine and L-cystine dimethyl ester dihydrochloride were received from Sigma Chemical Company Ltd. Hunts BPRS 150 Resist and Hunts 504 Resist were obtained from Shipley Chemicals Ltd. Their PLSI developer (positive resist developer) was supplied by OCG Microelectronic Materials N.V., Belgium. Titanium was purchased from Testbourne Ltd. and was in 99.6% purity. Gold was obtained from Advent Research Materials Ltd. and was in 99.999% purity. Oxygen, oxygen-free nitrogen, pureshield argon and tetrafluoromethane gases were supplied by BOC Ltd. Deionised water was obtained from a Millipore Milli-Q purification system; its resistivity was > 18MΩcm.
Horse heart cytochrome
c was received from Sigma Chemical Company Ltd. as the crystalline solid and was purified by size exclusion chromatography utilising a PD-10 column (obtained from Pharmacia Biotech AB). Amicyanin from
Thiobacillus versutus (320μM, 3.75mg/ml) in 20mM Tris- HCl (pH 7.0) and 4μM CuSO
4 was used without further purification. The concentrations of the protein solutions were determined spectroscopically using a Hewlett Packard 8451A Diode Array Spectrophotometer. The absorbance was measured at 409.5nm for cytochrome
c and at 595nm for amicyanin. The following extinction coefficients were used: 106.1mM
-1cm
-1 for cytochrome
c [
14] and 3.90mM
-1cm
-1 for amicyanin [
11].
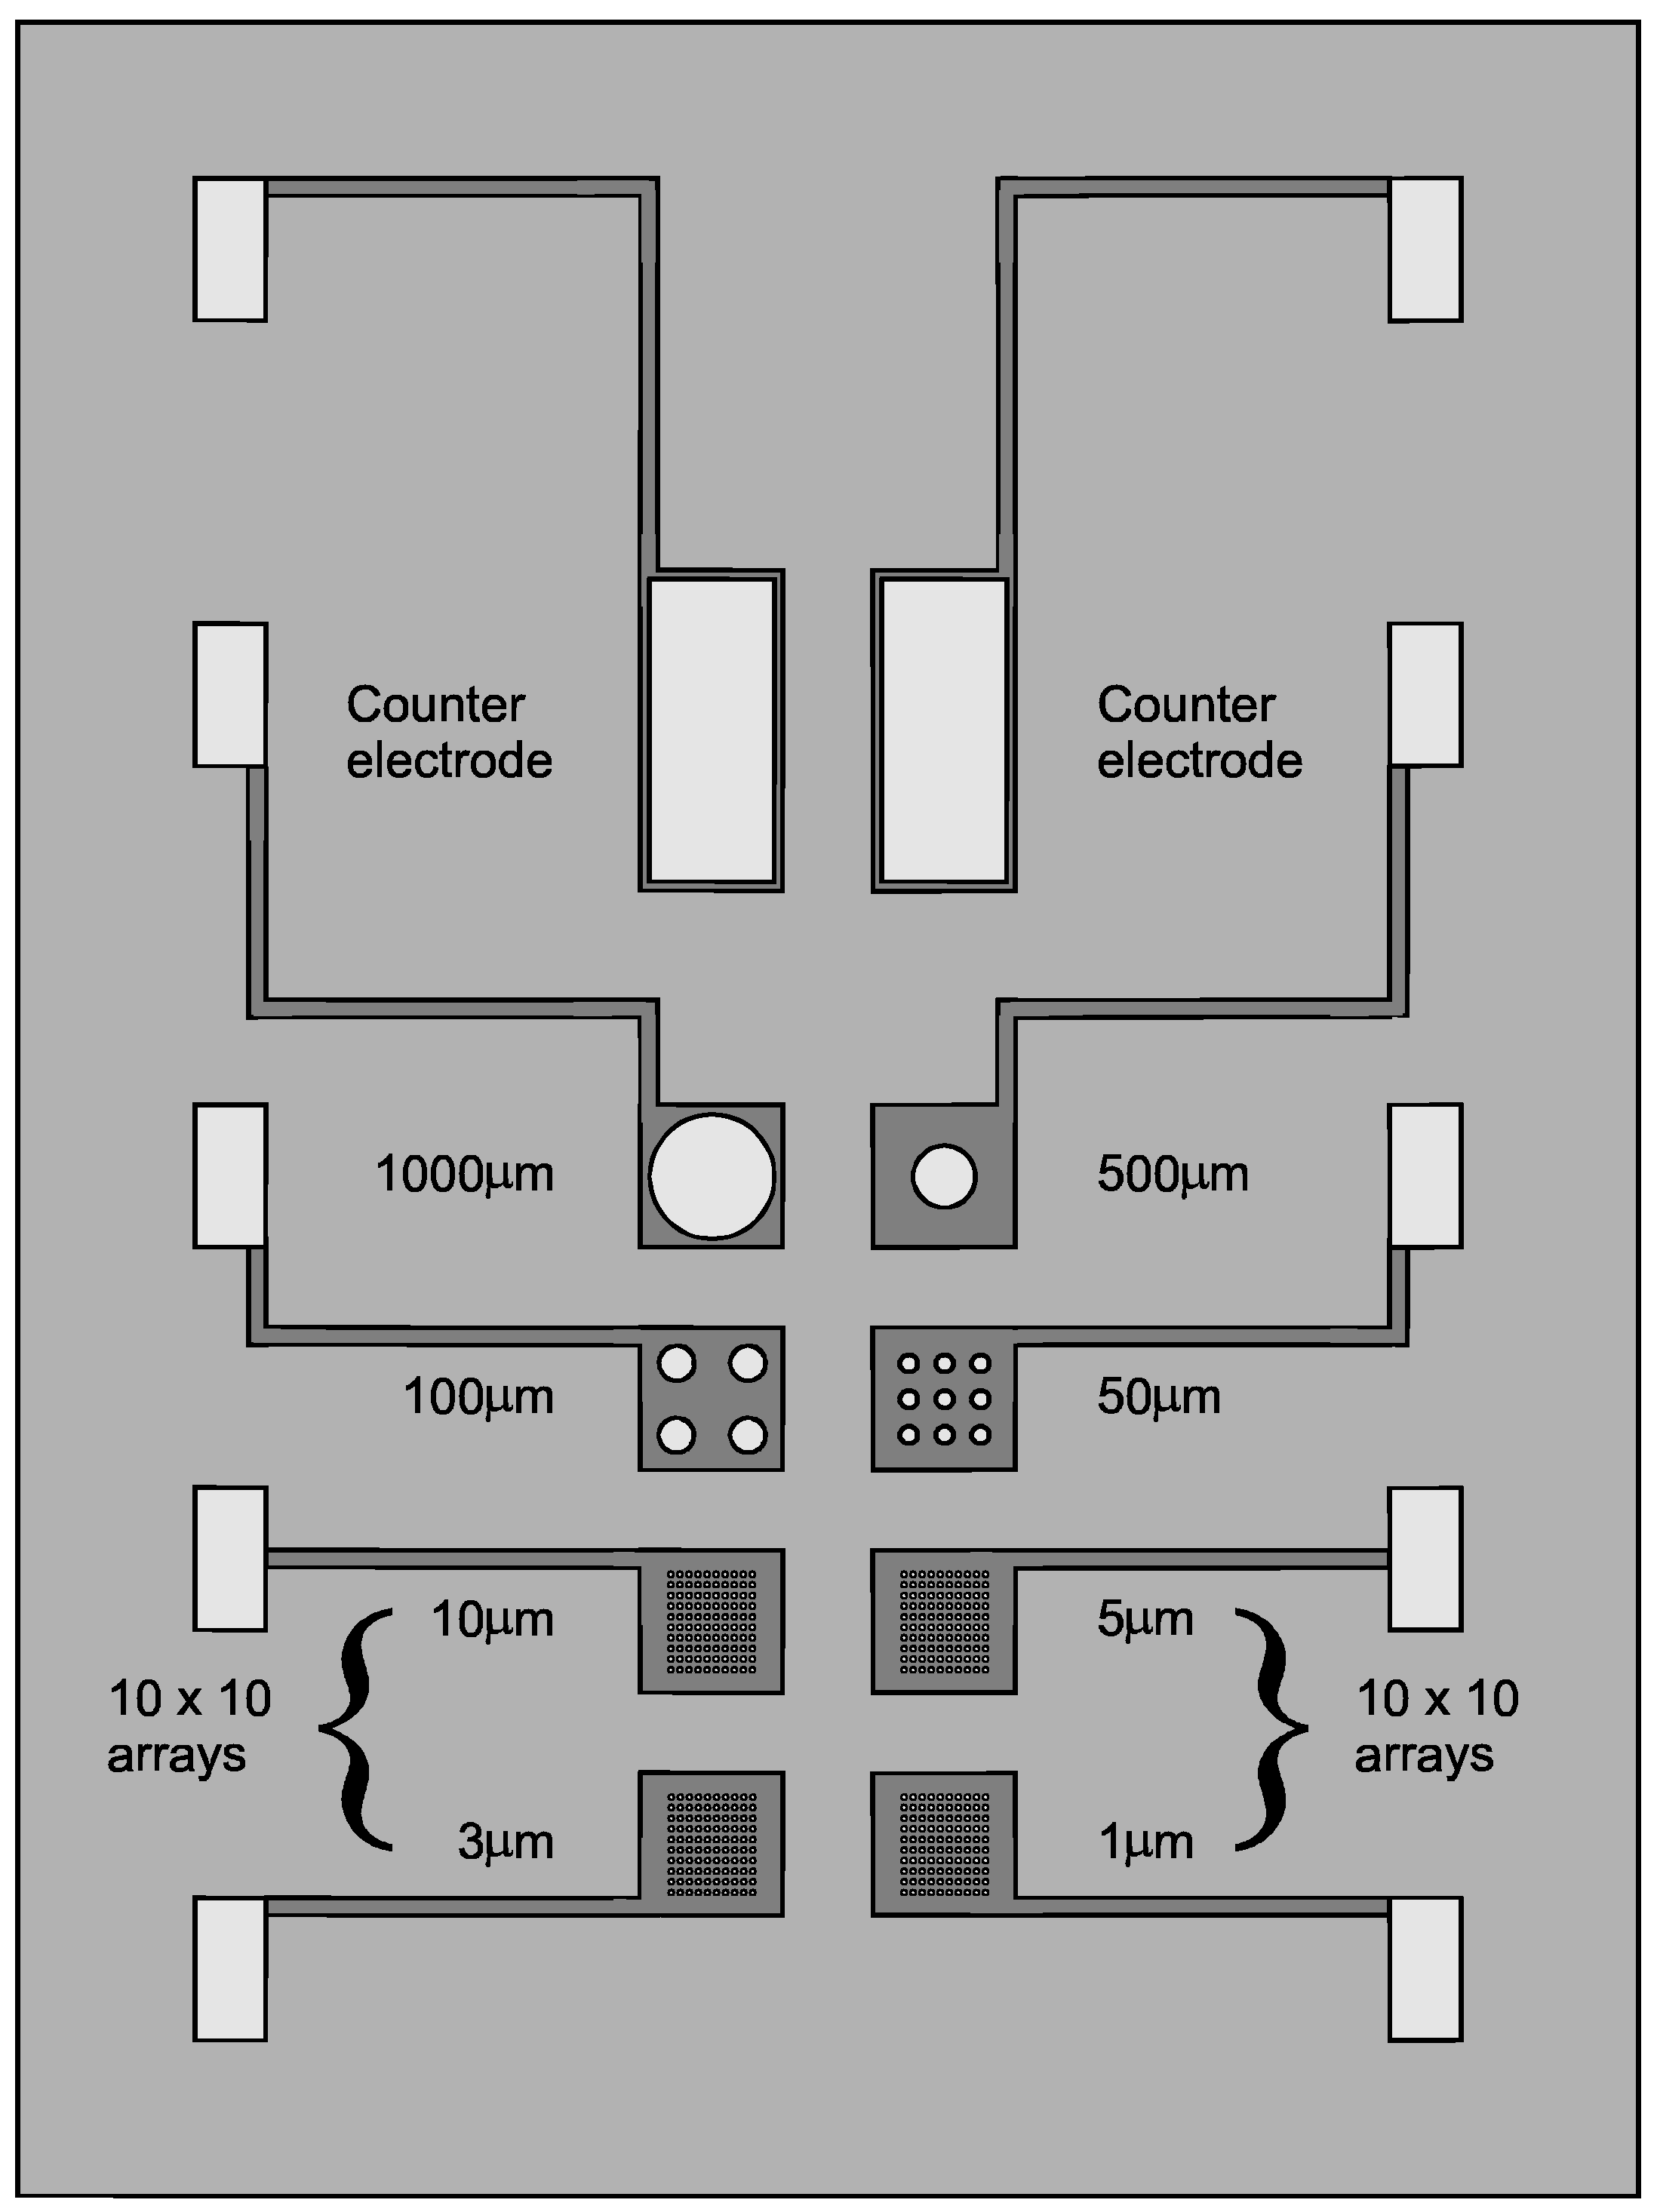
Each individual Multi MEA chip contained regular microelectrode arrays of eight different sizes: 1, 3, 5, 10, 50, 100, 500 and 1000μm (see
Figure 1). The circular-shaped gold microelectrodes were defined by a silicon nitride coating as the insulating layer. Each array was separately connected to a larger piece of gold (1.0mm × 0.5mm) to facilitate the connection to the external conductor. Two gold pads (1.0mm × 2.5mm) served as counter electrodes.
Figure 1.
Schematic representation of the design of a Multi MEA chip coated with Si3N4.
Figure 1.
Schematic representation of the design of a Multi MEA chip coated with Si3N4.
Wafers of Multi MEA devices on silicon substrates were manufactured by metallization, photolithography and Si
3N
4 sputtering. The fabrication steps are summarised as follows.
- (1)
A silicon wafer of 3 inch diameter in the (100) orientation and 330 - 432μm in thickness was used as the substrate. The substrate was coated with a 500nm thick layer of thermally grown silicon oxide. The silicon wafer, which had previously been polished on one side, was first cleaned with propanol and dried with a low pressure, filtered nitrogen gun.
- (2)
After pre-baking the wafer at 120°C for 30 minutes, a layer of photoresist (Hunts BPRS 150 Resist diluted 4:1 with RER solvent) of 1.0μm thickness was generated by spinning the wafer at 4000rpm for 30 seconds. Following this the wafer was soft baked at 90°C for 30 minutes.
- (3)
The wafer was exposed on a mask aligner to light from a mercury lamp at 365nm wavelength. The exposed part of the photoresist was removed in a developing bath consisting of a 4:1 mixture of PLSI developer to deionised water for 60 seconds. The wafer was then thoroughly rinsed with deionised water and dried under nitrogen.
- (4)
Using an Edwards 306A vacuum deposition system, 50nm thick titanium and 100nm thick gold layers were deposited sequentially on the photoresist covered surface of the silicon wafer by vapour deposition. The function of the titanium layer was to improve the adhesion between silicon and gold. The parts of the metal deposited on top of the photoresist were lifted off by soaking the wafer into hot acetone and propanol (80°C maximum). Afterwards the wafer was blown dry with the nitrogen gun.
- (5)
The wafer was then coated by sputtering with a 100nm thick Si3N4 dielectric layer, using a Nordiko NM 2000 RF sputtering machine (sputtering parameters: RF power, 300W; DC bias, 1kV; substrate temperature, 125°C; argon flow rate, 20.8sccm; nitrogen flow rate, 22.6sccm; duration, 12 minutes).
- (6)
The deposition of the Si3N4 layer was followed by the deposition of a 1.0μm thick photoresist layer as described in fabrication steps (2) and (3). Only the parameters varied slightly. The pre-baking of the wafer was carried out at 110°C for 15 minutes. A Hunts 504 Resist was spinned at 5000rpm for 30 seconds and the wafer was soft-baked at 82°C for 20 minutes. The exposed wafer was developed in a 1:1 mixture of PLSI developer to deionised water for 60 seconds.
- (7)
After exposure and development of the photoresist layer, the Si3N4 layer was etched by Reactive Ion Etching (RIE) technique using a CF4 plasma at a Plasma Technology RIE 80 (RIE parameters: RF power, 100W; DC bias, 400V; CF4 flow rate, 20sccm; duration, 4 minutes). The photoresist layer was removed by an oxygen plasma (RIE parameters: RF power, 100W; DC bias, 400V; oxygen flow rate, 20sccm; duration, 5 minutes).
- (8)
In order to create working electrodes, the wafer was then divided into individual Multi MEA chips using a diamond cutter. After mounting the Multi MEA chip on a small piece of glass using araldite, the bonding pads were jointed to pieces of copper wires as external connectors of the microelectrode arrays. For this electroconductive, quick drying silver paint (received from Agar Scientific Ltd.) was used and the copper wire was held in place by fixing it to the glass with araldite. Following this, all edges of the chip, the bonding pads, the copper wires and any exposed silver paint were sealed with araldite. This ensured that only the microelectrodes were open to solution.
Before a Multi MEA was applied to the protein solution for the first time, the Multi MEA was cleaned by an oxygen plasma (RIE parameters: RF power, 100W; DC bias, 400V; oxygen flow rate, 20sccm; duration, 3 minutes). This ensured that any particles introduced to the electrode surfaces in the course of device fabrication and packaging were removed. Between each experiment, the adsorbed proteins were removed from the Multi MEA by repeated exposure to the oxygen plasma.
Multi MEAs with carbon as electrode surface were manufactured by screen printing a 15μm thick layer of a carbon based ink (Electrodag 992 SS received from Acheson Colloids Company) through a stencil on top of the gold layer. Afterwards the wafer was dried in an oven at 100°C for 30 minutes. The Si3N4 layer was deposited as described earlier. Carbon Multi MEAs were not cleaned by an oxygen plasma.
All cyclic voltammetric experiments were carried out in a three-electrode, two-compartment glass cell. The working arm of the cell accommodated the Multi MEA chip. The saturated calomel reference electrode (Radiometer K401) was housed in the other arm of the cell, which was connected to the working arm by a Luggin capillary of 0.1mm diameter. Prior to each experiment, oxygen was removed from the working buffer solution by continuous flushing with oxygen-free nitrogen or pureshield argon for at least 20 minutes. Following this, nitrogen or argon was allowed to flow over the solution to prevent oxygen from re-entering the cell during the experiment. Also, prior to each experiment, the electrochemical cell was cleaned by sonication using a Kerry KS 200 sonicator and was thoroughly rinsed with deionised water. Between the experiments the electrochemical cell was stored in 68% nitric acid.
The cyclic voltammograms were digitally recorded using the General Purpose Electrochemical System for Windows (version 4.3) on a Pentium computer coupled to an Autolab PGSTAT10 (purchased from Eco Chemie B.V., The Netherlands).
Results and Discussion
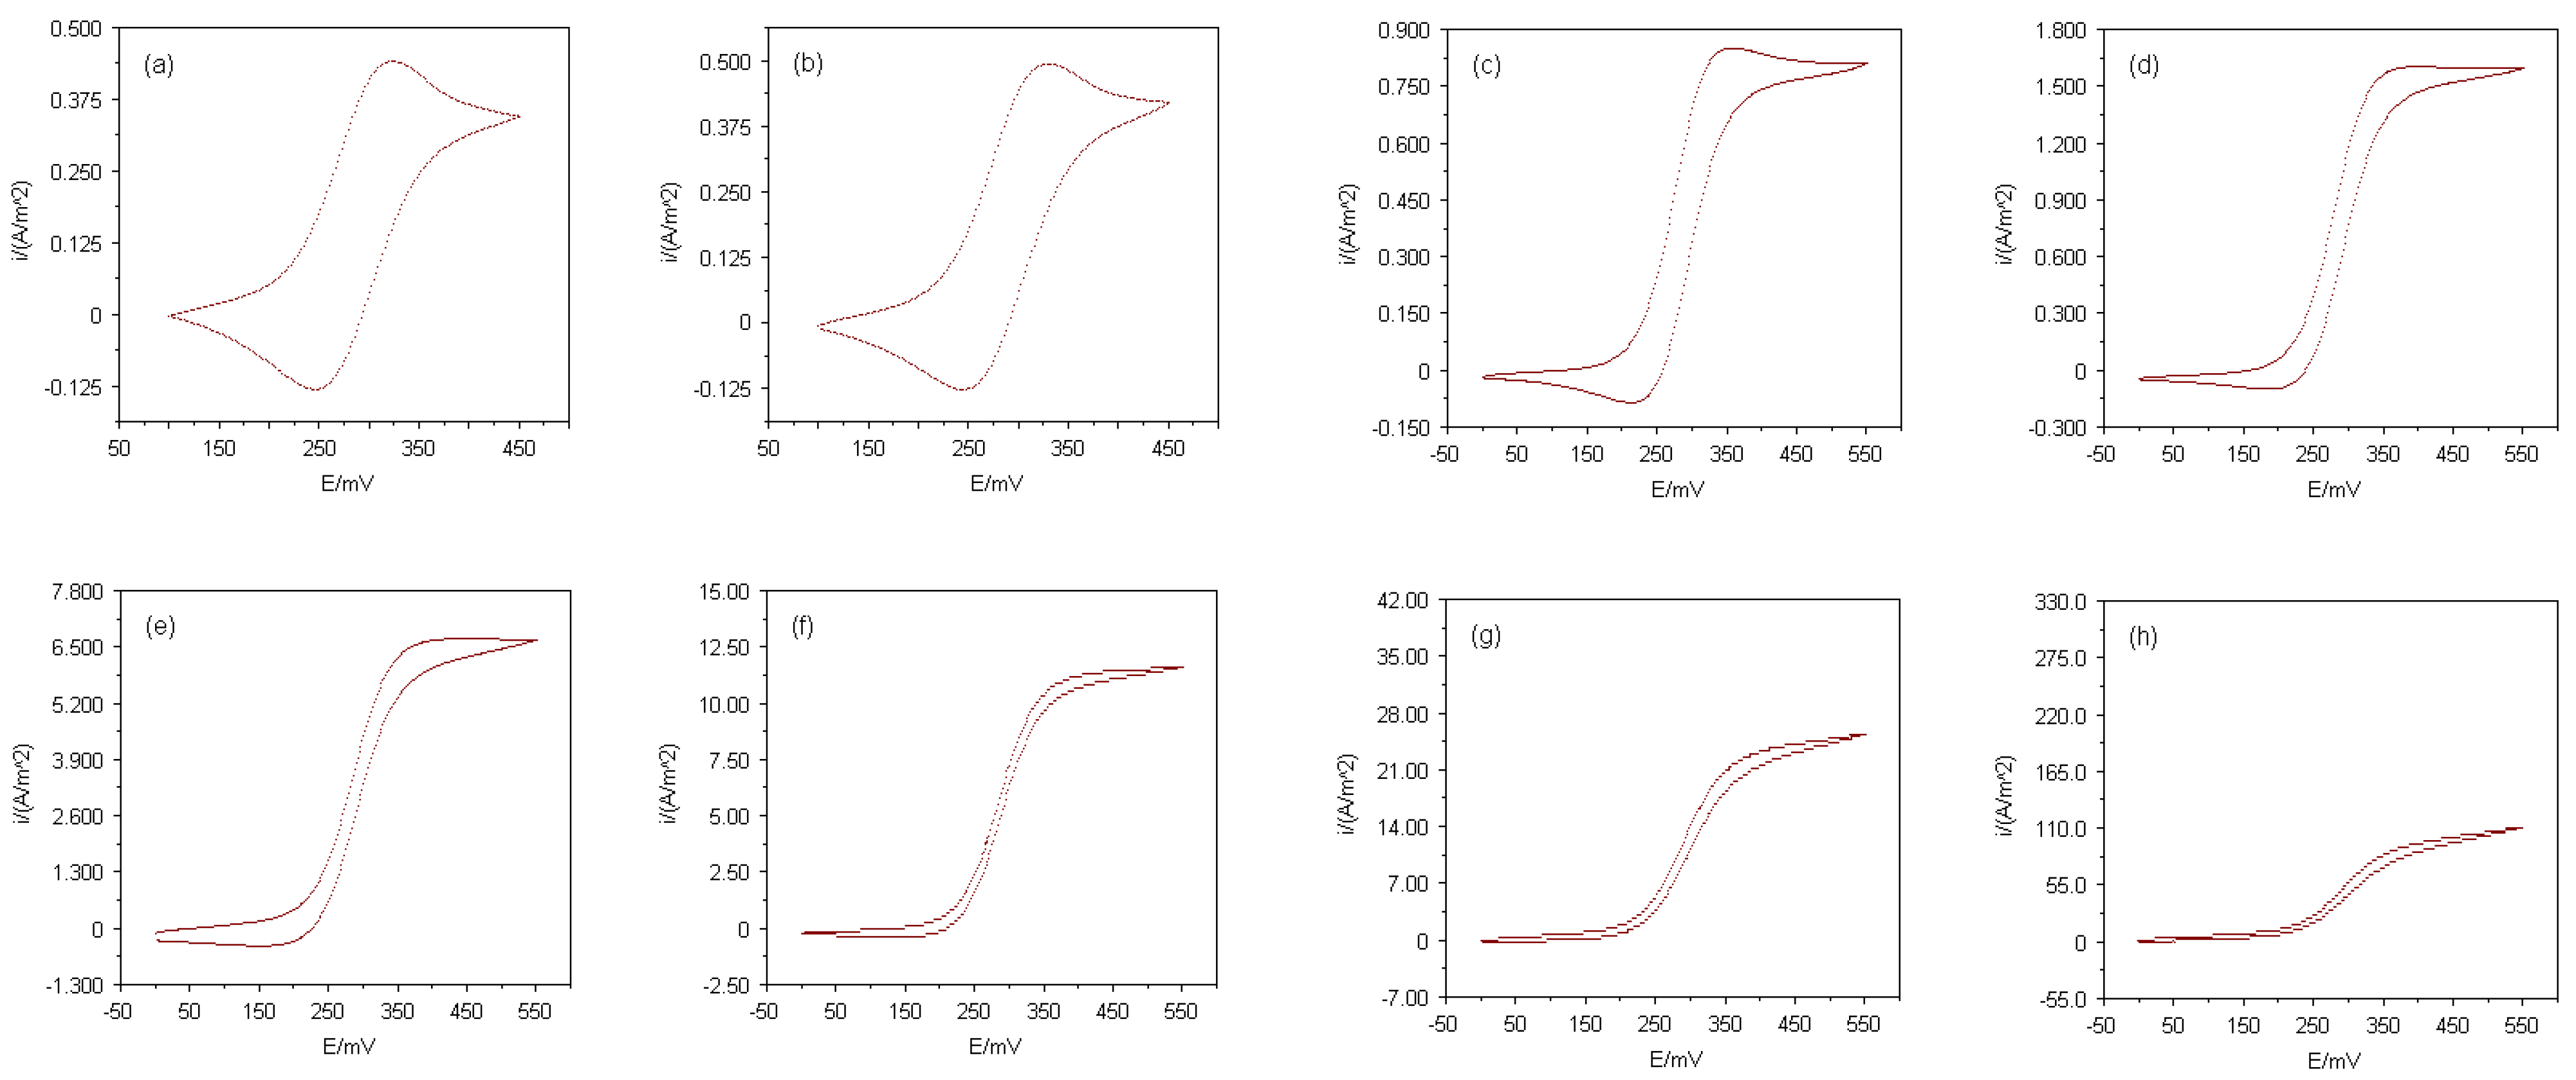
The electrode responses of the Multi MEAs presented here were firstly tested with a simple, well-known electroactive species, before redox reactions of electron transfer proteins were investigated at those devices. Cyclic voltammograms employing ferrocenecarboxylic acid (FMCA) as analyte were recorded at each array consisting of equally sized electrodes. The currents of the cyclic voltammograms normalised as current densities, i, to the total electrode areas are shown in
Figure 2. The cyclic voltammetric experiments were conducted in a 400μM FMCA solution with 50mM phosphate buffer (pH 7.0) as supporting electrolyte and a potential scan rate of 20mVs
-1 was used. When the diameter of an electrode is decreased from the millimetre scale down to micron scale, radial diffusion of the electroactive species towards the electrode surface becomes more dominant rather than linear diffusion. This behaviour is indicated in
Figure 2 by the change from peak-shaped voltammograms at macroelectrodes with diameters larger than 500μm to sigmoidal voltammograms at microelectrodes with diameters smaller than 10μm. In essence, each Multi MEA chip contained electrodes from the macro- to the microelectrode range. Nevertheless, the ‘nature’ of an electrode also depends on the time scale of the experiment. Increasing the potential scan rate sufficiently would have caused the recorded current of every electrode to peak instead of showing a sigmoidal shape. This is due to the relative thicknesses of nonlinear and linear diffusion zones. Initially, after applying the potential, the diffusion layer is always linear, however if the potential is kept constant or the potential scan rate is slow enough, radial diffusion dominates and steady-state conditions are achieved. On the time scale of the experiments conducted in this study, the well-defined steady-state responses of the arrays with microelectrodes smaller than 10μm in diameter demonstrated that these arrays fulfil the prerequisites for microelectrode arrays.
Figure 2.
Cyclic voltammograms for oxidation of 400μM FMCA in 50mM phosphate buffer (pH 7.0) at Multi MEAs and microdisks with diameters of (a) 1000μm, (b) 500μm, (c) 100μm, (d) 50μm, (e) 10μm, (f) 5μm, (g) 3μm and (h) 1μm; potential scan rate, 20mVs-1.
Figure 2.
Cyclic voltammograms for oxidation of 400μM FMCA in 50mM phosphate buffer (pH 7.0) at Multi MEAs and microdisks with diameters of (a) 1000μm, (b) 500μm, (c) 100μm, (d) 50μm, (e) 10μm, (f) 5μm, (g) 3μm and (h) 1μm; potential scan rate, 20mVs-1.
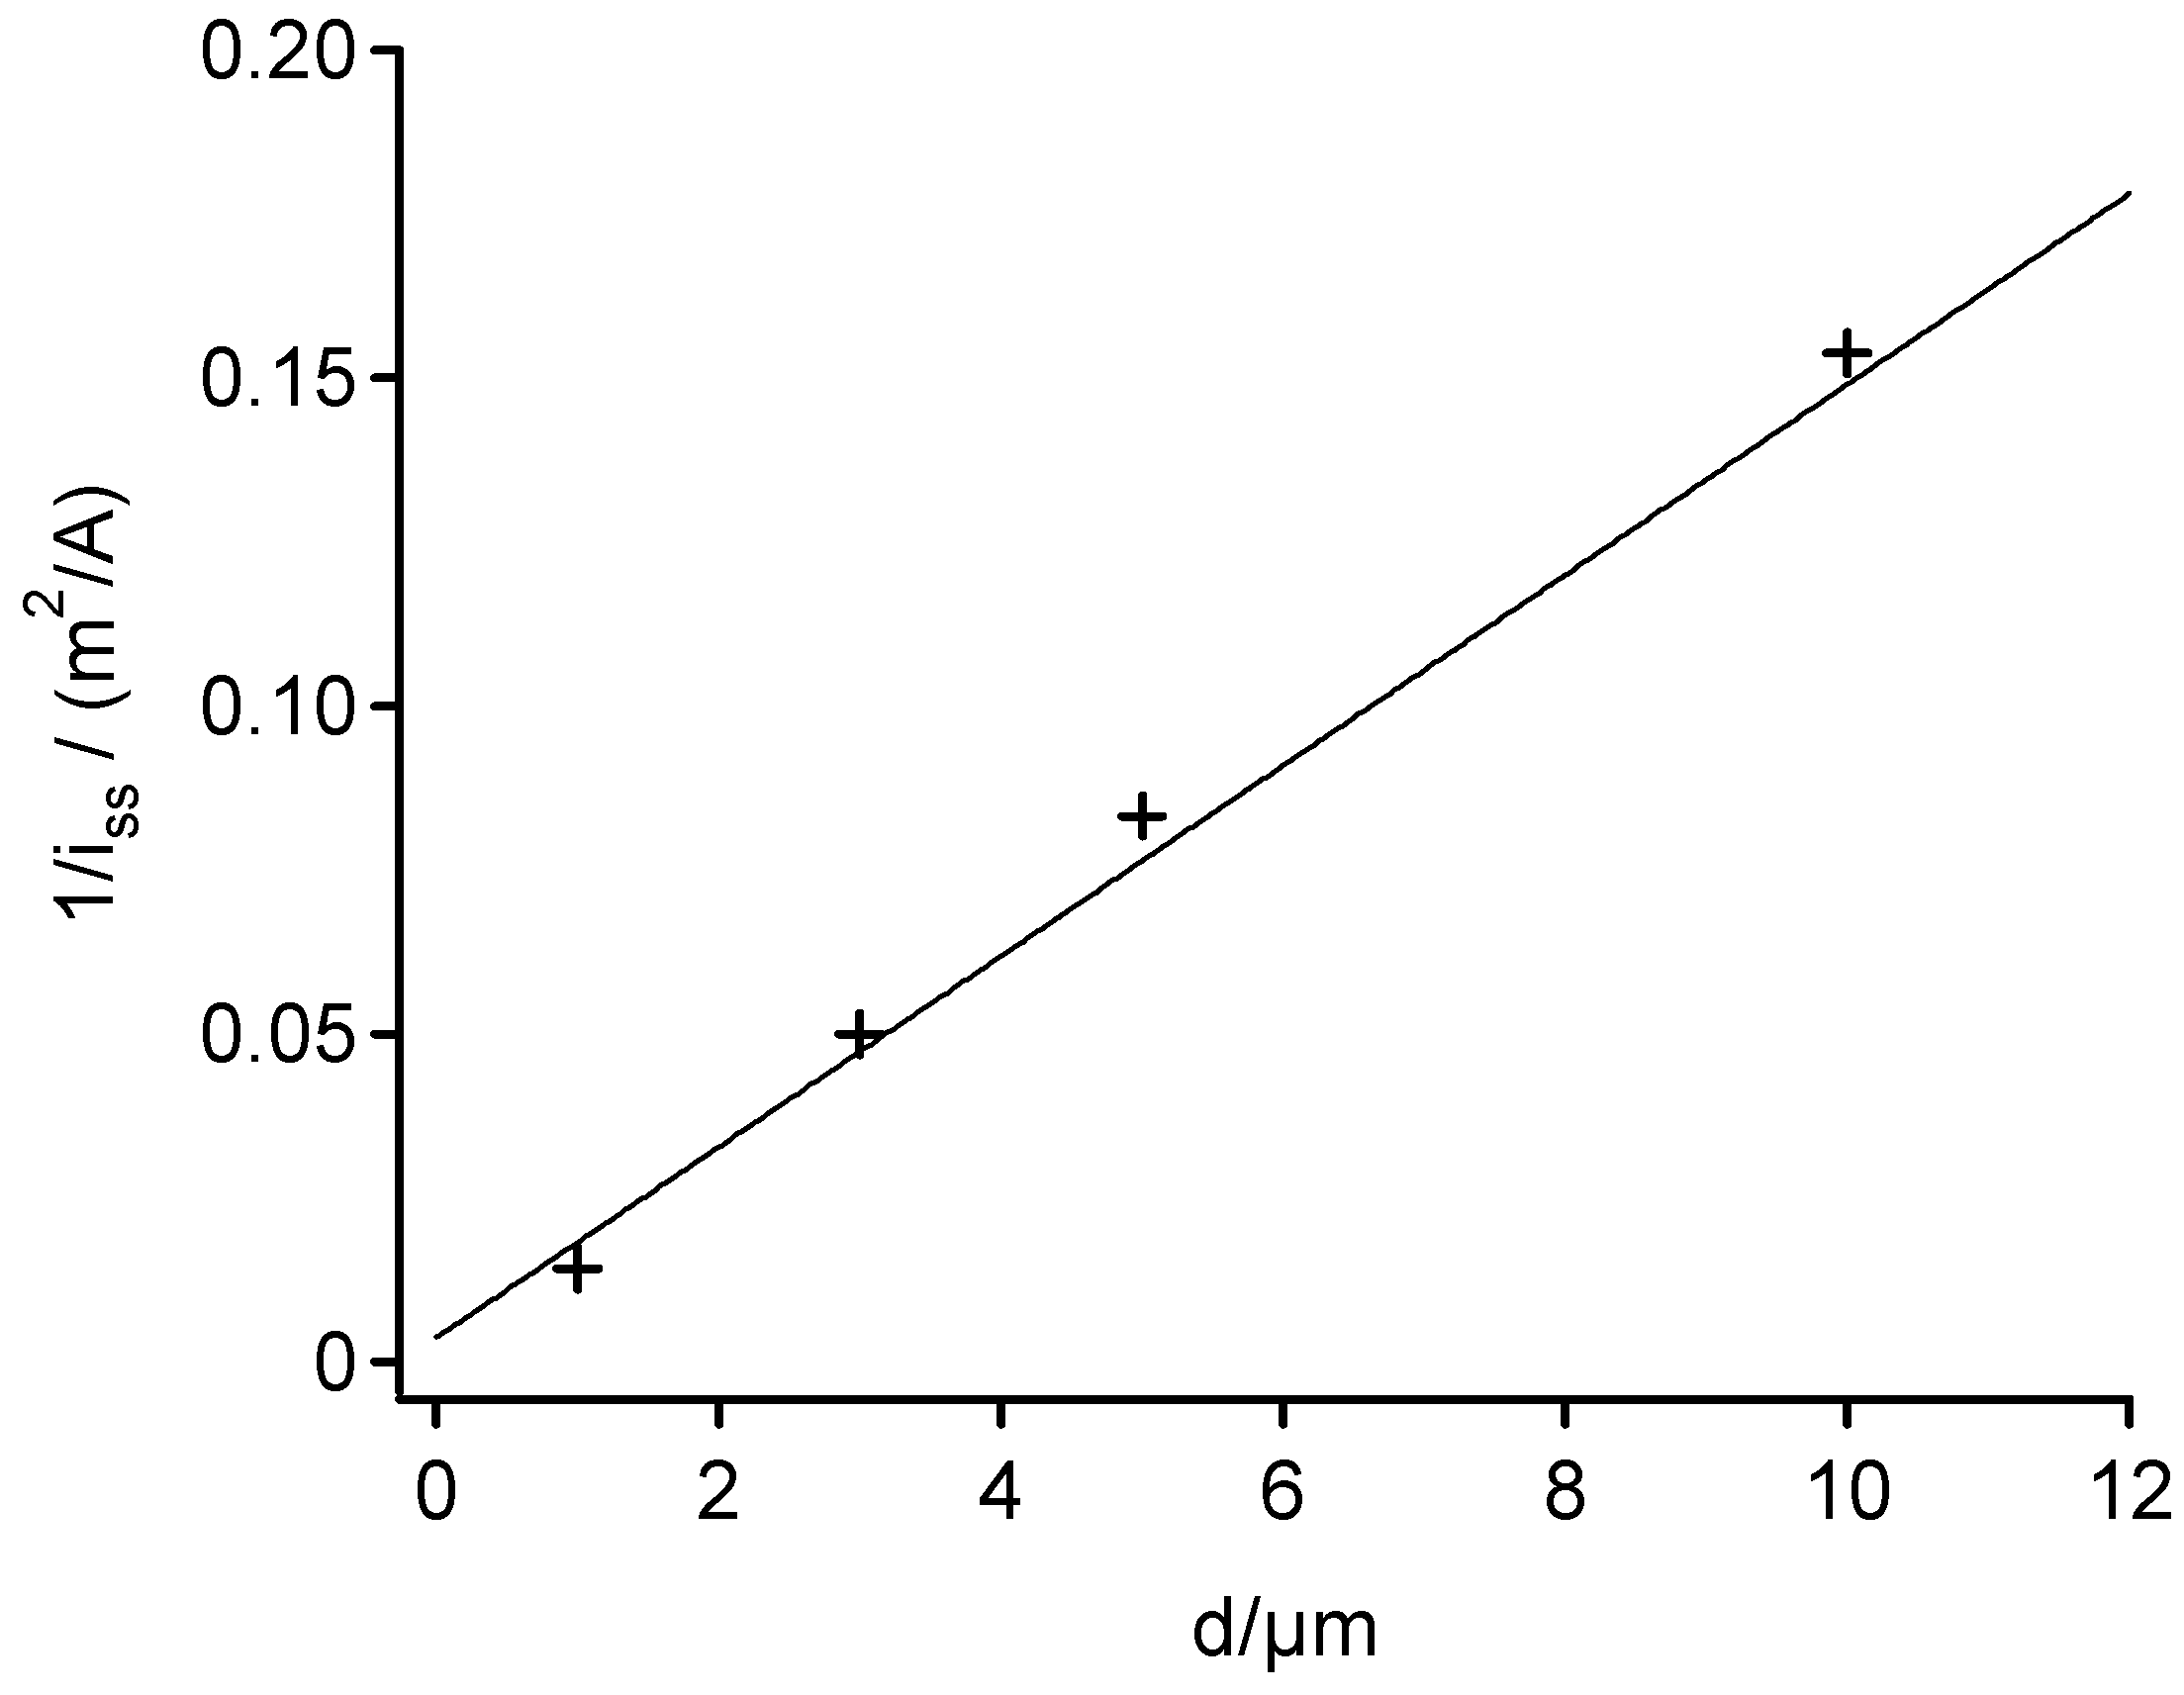
Figure 3.
A plot of the inverse steady-state current density, 1/i
ss,
versus the microdisk diameter, d. Data used to construct the plot were from
Figure 2. The straight line was calculated by using equation (1) and the experimental parameters of the cyclic voltammograms of
Figure 2 (D = 7.2*10
-6cm
2s
-1).
The steady-state current density, i
ss, of a recessed microdisk electrode is a function of the bulk concentration, C*, of the electroactive species, the diameter, d, of the microdisk and the thickness, L, of the insulating coating [
15]:
where n is the number of electrons involved in the electrode reaction, F is the Faraday and D stands for the diffusion coefficient of the electroactive species.
Figure 3 shows a plot of the inverse steady-state current density, 1/i
ss,
versus the microdisk diameter, d, for the arrays with microelectrodes smaller than 10μm in diameter. The plot exhibits that the electrochemical responses of these arrays were consistent with equation (1).
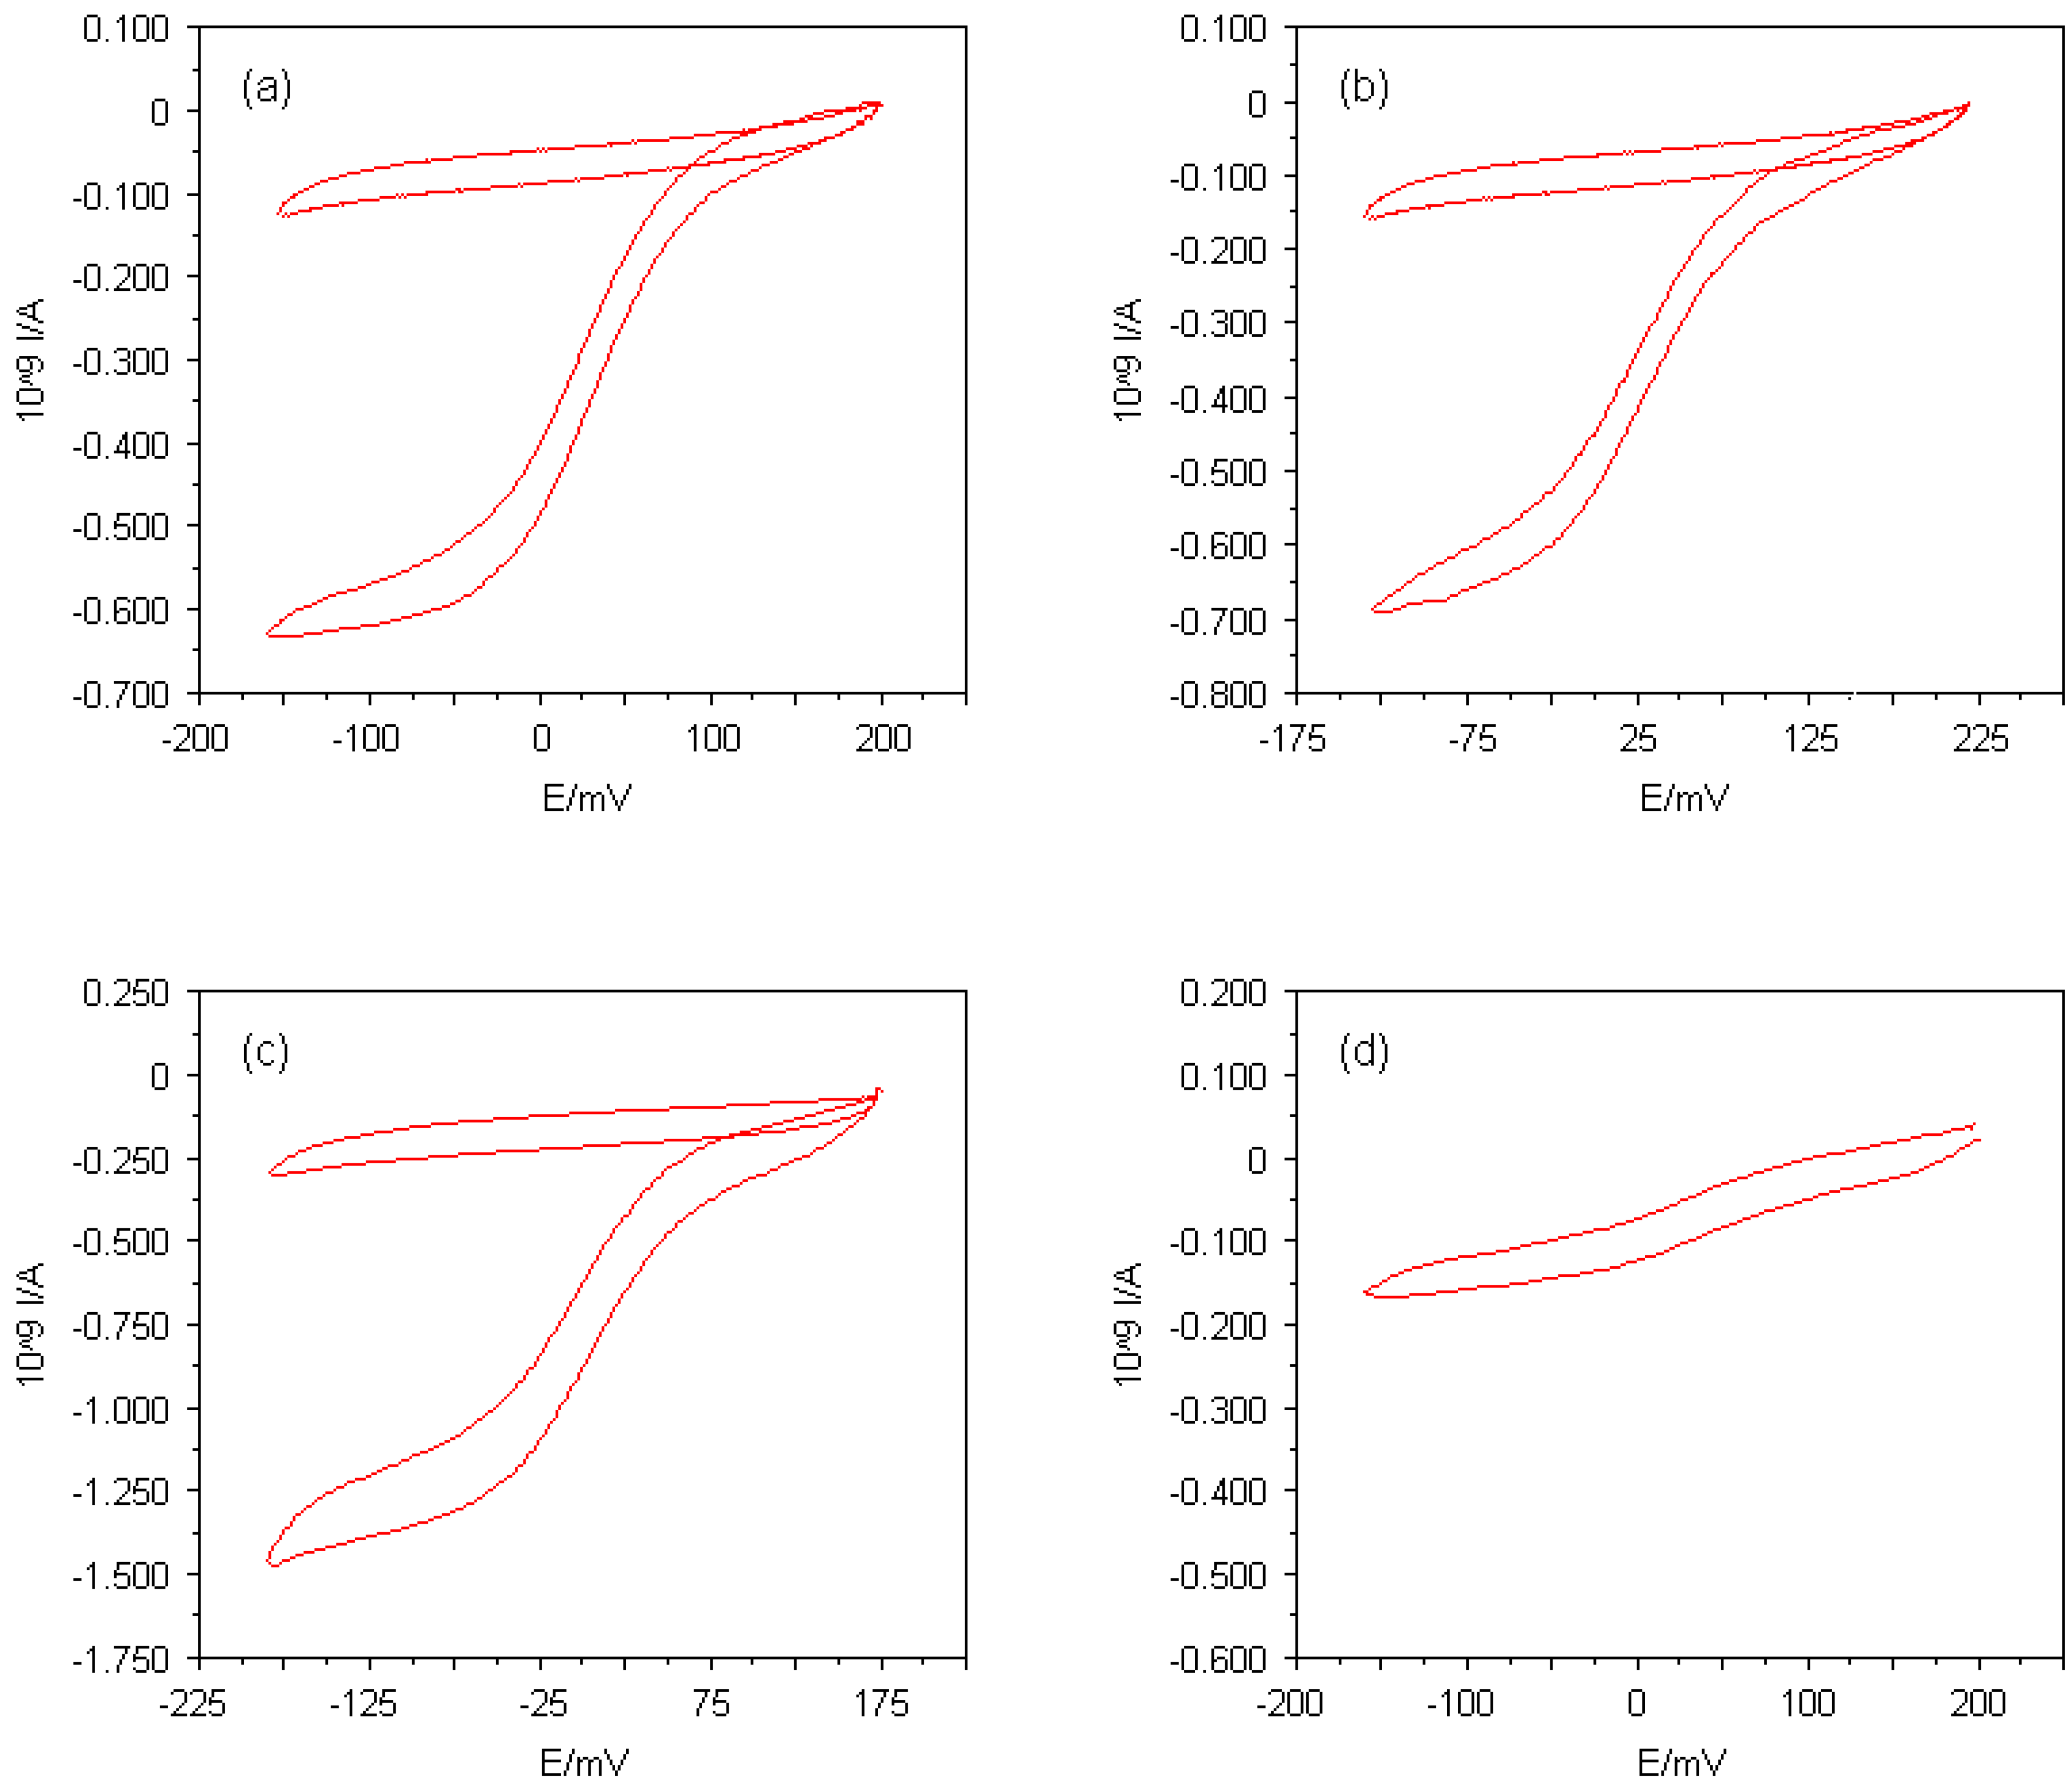
Figure 4.
Cyclic voltammograms for reduction of (a) 50μM horse heart cytochrome c in the presence of 16μM 4,4'-bipyridyl disulphide, (b) 50μM horse heart cytochrome c in the presence of 16μM L-cysteine, (c) 55μM amicyanin from Thiobacillus versutus in the presence of 10μM L-cystine dimethyl ester dihydrochloride and (d) 4.8μM horse heart cytochrome c in the presence of 20μM 4,4'-bipyridyl disulphide at Multi MEAs with 5μm in diameter. The supporting electrolyte consisted of 5mM sodium phosphate buffer (pH 7.0) and 100mM NaCl, the potential scan rate used was 20mVs-1. The cyclic voltammograms recorded in the buffer solutions alone are also shown.
In the early investigations of direct protein electrochemistry, the metalloprotein cytochrome
c played a major role [
12]. Hence, cytochrome
c is probably one of the most intensively studied of all metalloproteins regarding its electrochemical properties. These well established characteristics of cytochrome
c were used here in order to verify the applicability of Multi MEAs as practically useful tools for the electrochemical investigation of redox proteins. Additionally, the electrochemistry of the protein amicyanin from
Thiobacillus versutus was studied at Multi MEAs. The responses obtained at Multi MEAs in the protein solutions and in the absence of any facilitator molecules were essentially indistinguishable from those obtained with the electrolyte solutions alone. These results led to the conclusion that electron transfer did not take place between the protein molecules and bare Multi MEA surfaces. Modifying the electrode surfaces with facilitators seemed to be an appropriate method to improve the interfacial contact between the protein molecules and the gold electrodes. In the case of cytochrome
c, two different facilitators were employed: 4,4'-bipyridyl disulphide and L-cysteine. L-cystine dimethyl ester dihydrochloride was found to facilitate the direct electrochemistry of amicyanin. For modifying the electrodes, the
in situ modification method proved to be most successful. The facilitators were simply added to the protein solutions at appropriate concentrations. The adsorption of all three types of facilitators onto the gold surfaces was achieved by the formation of gold-sulphur bonds. Cyclic voltammograms of cytochrome
c and amicyanin at such modified Multi MEAs with microelectrode diameters of 5μm are shown in
Figures 4(a) - (c). The supporting electrolyte solutions utilised throughout this study consisted of 5mM sodium phosphate buffer (pH 7.0) and 100mM NaCl. The potential scan rate used was 20mVs
-1. The steady-state responses of both proteins suggested electron transfer processes taking place at the microelectrode/solution interfaces. In both cases this was caused by a reduction of the redox centres.
The facilitators for cytochrome
c electrochemistry, 4,4'-bipyridyl disulphide and L-cysteine, provided functionalities which attracted the protonated lysine residues at the cytochrome
c molecules. It has been shown that a number of the uncompensated lysines of cytochrome
c are situated in the interaction domain [
16]. Lys
13, Lys
27, Lys
72, Lys
86 and Lys
87, which surround the surface-exposed edge of the haem prosthetic group, define the domain. These lysine residues allow hydrogen bonds to be formed between the facilitator molecules and the cytochrome
c molecules [
17]. This also brings the exposed edges of the haem prosthetic groups into the correct orientation for direct electron transfer with the gold microelectrodes.
Careful examination of the obtained cyclic voltammograms revealed that the steady-state current at L-cysteine-modified Multi MEAs was slightly lower than the steady-state current observed at 4,4'-bipyridyl-disulphide-modified Multi MEAs on the same experimental conditions. An electrostatic effect presumably had a major influence on the lower electron transfer observed with L-cysteine. Since L-cysteine-modified electrodes contained positively and negatively charged groups pointing into the bulk solution, this led to a slight repulsion of the positively charged cytochrome c molecules away from the electrode surface and could prevent interaction of the facilitator molecules with the lysines of cytochrome c. Formation of a complex suitable for electron transfer was thus inhibited for some cytochrome c molecules. In conclusion, the interaction of cytochrome c at an L-cysteine-modified interface was less favourable for electron transfer than at a 4,4'-bipyridyl-disulphide-modified interface.
The electrochemistry attributable to amicyanin observed at L-cystine dimethyl ester dihydrochloride-modified Multi MEAs can be explained by an electrostatic effect. Since this facilitator is protonated at the given pH, it provided a positively charged surface, which led to an electrostatic binding with the negatively charged binding domains on the amicyanin molecules.
The formal redox potentials, E°', were calculated to be (28 ± 5)mV and (0 ± 5)mV (
versus SCE) for horse heart cytochrome
c and amicyanin from
Thiobacillus versutus, respectively. These data are in good agreement with previously published E°'-values of these proteins measured at micro- and macroelectrodes [
5,
7,
13].
With respect to the development of electrochemical sensors, a significant criterion for the quality of the Multi MEAs is the lowest protein bulk concentration still detectable with those devices. It was found that the lowest concentration that could be measured for cytochrome
c was less than 5μM (see
Figure 4(d)). Since the electroactivity of the Multi MEA devices varies with different types of proteins, the lowest detectable protein concentration can vary for other proteins.
Another criterion for the quality of the Multi MEAs is their lifetime,
i.e. their stability. Multi MEAs could be used for more than 30 experiments before the array structure of the microelectrodes was affected by the RIE cleaning. In contrast to the silicon nitride coated Multi MEAs, similarly fabricated microelectrode array devices, whose insulating layer consisted of soft photoresist, could be only used for about five times when the photoresist coated microelectrodes were cleaned with an oxygen plasma between the experiments [
7]. This verifies the high quality of the Multi MEAs.
The experiments outlined so far were all conducted at Multi MEAs with gold as electrode surface. Some experiments were also carried out with Multi MEAs whose electrode surfaces consisted of carbon instead of gold. The manufacturing procedure used to fabricate this kind of Multi MEAs was quite unsophisticated. The carbon surfaces were manufactured by screen printing a layer of carbon based ink through a stencil on top of the gold layer.
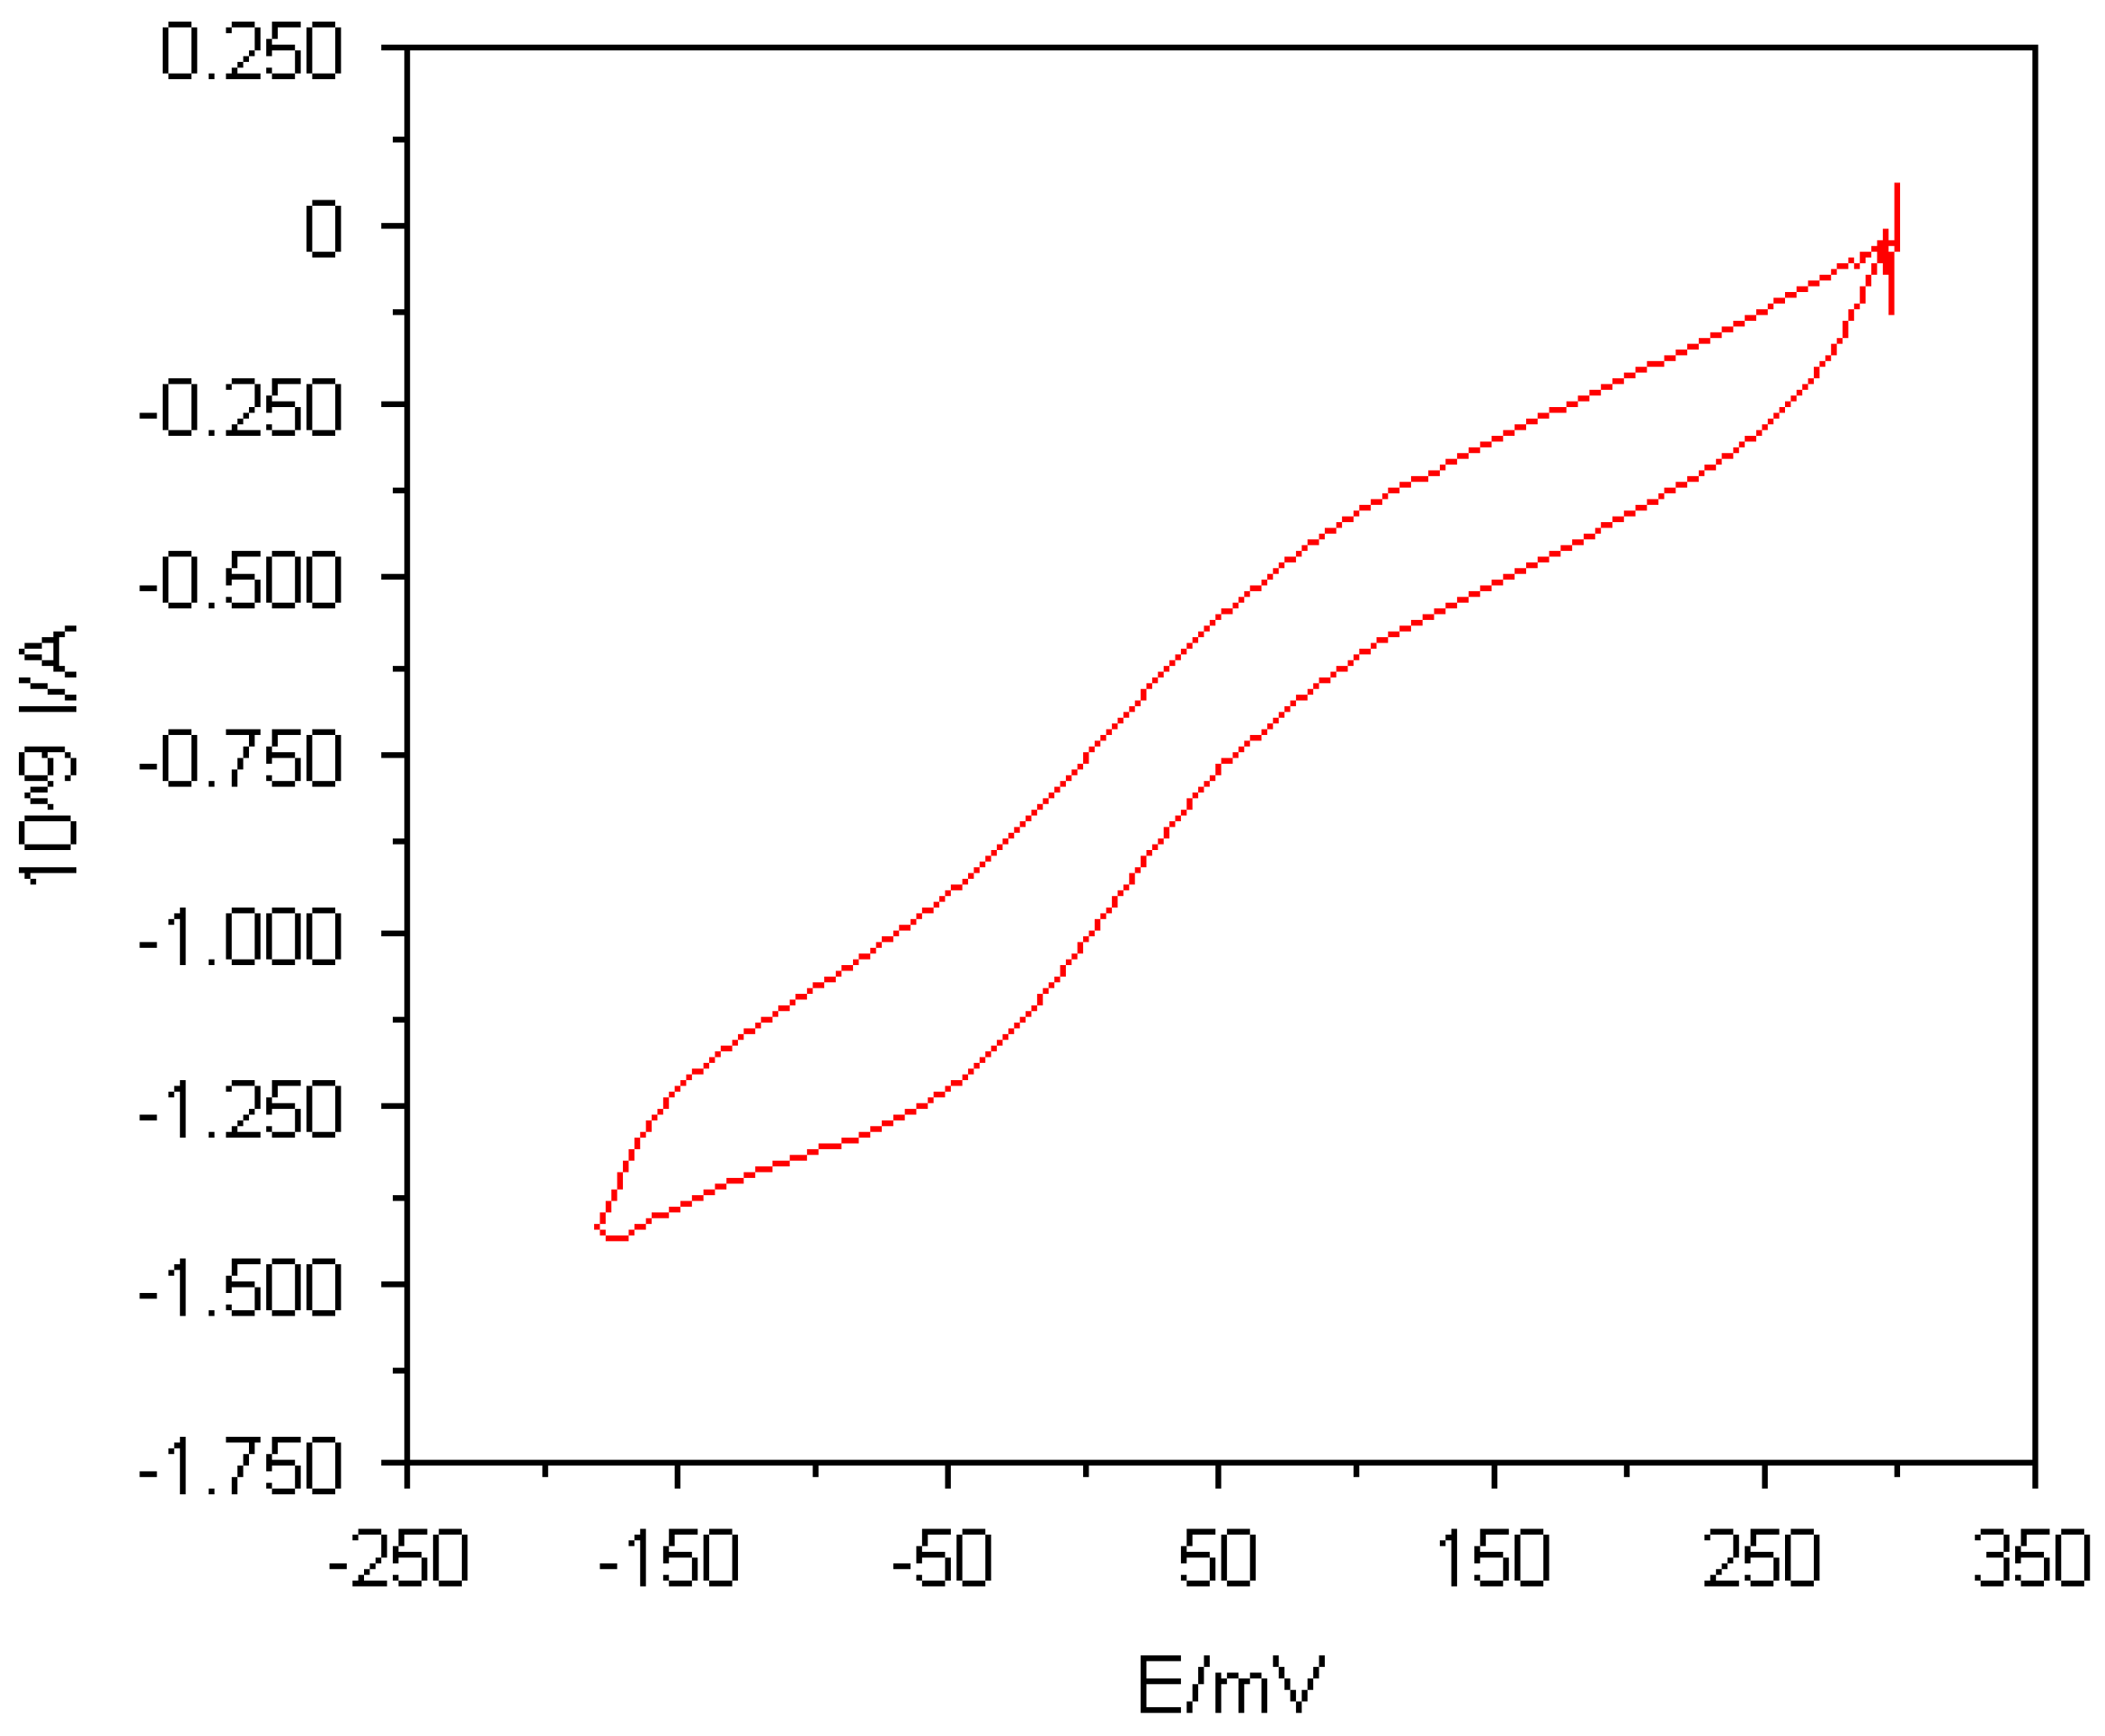
Figure 5.
A cyclic voltammogram of 45μM horse heart cytochrome c in 5mM sodium phosphate buffer (pH 7.0) and 100mM NaCl at a 5μm carbon Multi MEA; potential scan rate, 20mVs-1.
Figure 5.
A cyclic voltammogram of 45μM horse heart cytochrome c in 5mM sodium phosphate buffer (pH 7.0) and 100mM NaCl at a 5μm carbon Multi MEA; potential scan rate, 20mVs-1.
It is known that carbon-oxygen functional groups are present on carbon surfaces which provide negatively charged sites suitable for binding to proteins. For cytochrome
c, it has been proposed that positively charged groups around the haem active edge site interact with this deprotonated carbon-oxygen functional groups at the electrode surface [
18]. Consequently, no additional facilitator has to be employed for the observation of cytochrome
c electrochemistry at carbon electrodes.
Figure 5 shows a cyclic voltammogram of 45μM horse heart cytochrome
c in 5mM sodium phosphate buffer (pH 7.0) and 100mM NaCl at a 5μm carbon Multi MEA. The voltammogram was recorded at a potential scan rate of 20mVs
-1. Although the carbon surfaces were not cleaned before use, the cyclic voltammogram exhibits a faradaic process taking place at the carbon surface. However, the responses of cytochrome
c at carbon Multi MEAs were very transient so that after some cycles the responses faded away. This was due to the gradual loss of active sites because many sites became occupied by adsorbed and denatured cytochrome
c molecules.
It can be concluded from these experiments that the electrochemistry of cytochrome c could be successfully observed at straightforwardly manufactured carbon Multi MEAs. However, the responses obtained were rather poor compared to those obtained at gold Multi MEAs with the aid of facilitators. An improved procedure to manufacture carbon Multi MEAs in order to achieve smooth surfaces, such as sputtering the carbon layer, seems to be required for the observation of well-defined voltammograms of cytochrome c. Furthermore, an appropriate pretreatment of the carbon Multi MEAs might be also necessary to generate more carbon-oxygen functionalities on the carbon microelectrodes.
