The Non-linear Relationship between Muscle Voluntary Activation Level and Voluntary Force Measured by the Interpolated Twitch Technique

Abstract
:
1. Introduction
2. Methods
2.1. Participant
2.2. Experimental Procedure
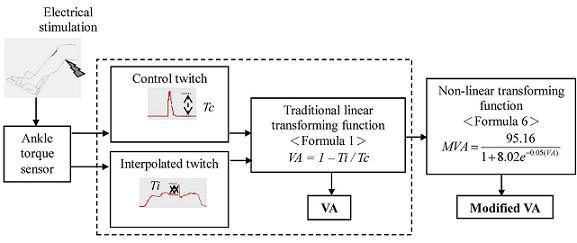
2.3. Data Analysis
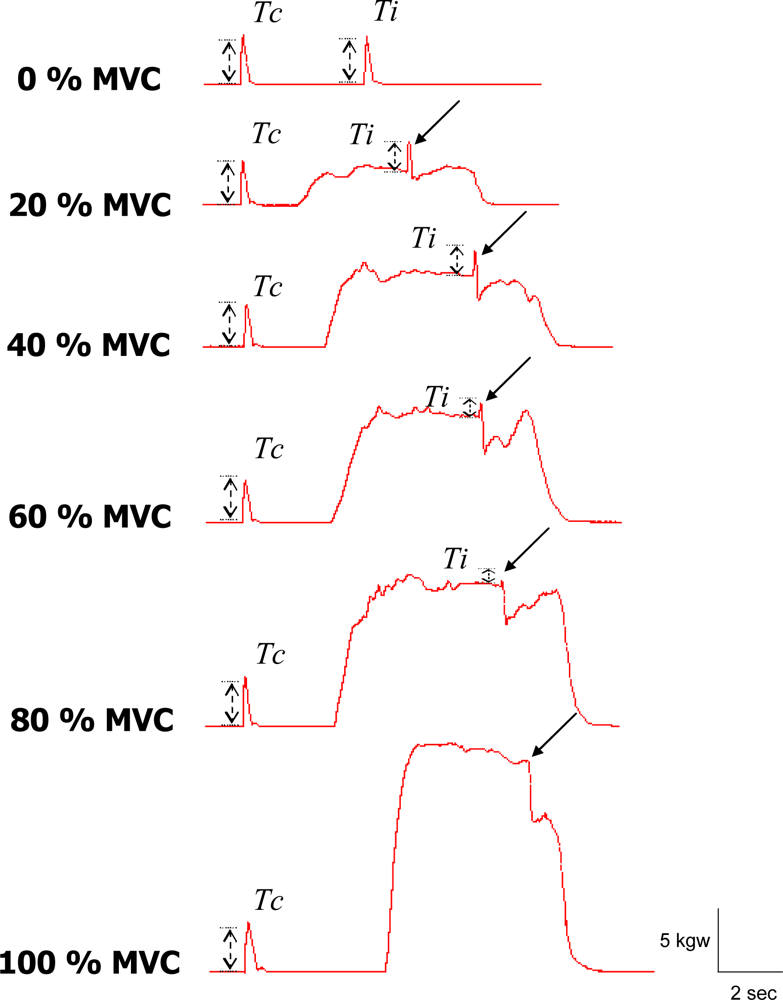
3. Results
4. Discussion
5. Conclusions and Clinical Applications
Acknowledgments
References
- Yue, G.H.; Ranganathan, V.K.; Siemionow, V.; Liu, J.Z.; Sahgal, V. Evidence of inability to fully activate human limb muscle. Muscle Nerv 2000, 23, 376–384. [Google Scholar]
- Urbach, D.; Awiszus, F. Impaired ability of voluntary quadriceps activation bilaterally interferes with function testing after knee injuries. A twitch interpolation study. Int. J. Sports Med 2002, 23, 231–236. [Google Scholar]
- Urbach, D.; Nebelung, W.; Weiler, H.T.; Awiszus, F. Bilateral deficit of voluntary quadriceps muscle activation after unilateral ACL tear. Med. Sci. Sports Exerc 1999, 31, 1691–1696. [Google Scholar]
- Hurley, M.V.; Scott, D.L.; Rees, J.; Newham, D.J. Sensorimotor changes and functional performance in patients with knee osteoarthritis. Ann. Rheum. Dis 1997, 56, 641–648. [Google Scholar]
- Hurley, M.V.; Newham, D.J. The influence of arthrogenous muscle inhibition on quadriceps rehabilitation of patients with early, unilateral osteoarthritic knees. British J. Rheumatol 1993, 32, 127–131. [Google Scholar]
- Norregaard, J.; Bulow, P.M.; Vestergaard-Poulsen, P.; Thomsen, C.; Danneskiold-Samoe, B. Muscle strength, voluntary activation and cross-sectional muscle area in patients with fibromyalgia. British J. Rheumatol 1995, 34, 925–931. [Google Scholar]
- Norregaard, J.; Bulow, P.M.; Danneskiold-Samsoe, B. Muscle strength, voluntary activation, twitch properties, and endurance in patients with fibromyalgia. J. Neurol. Neurosur. Psychiatry 1994, 57, 1106–1111. [Google Scholar]
- Lloyd, A.R.; Gandevia, S.C.; Hales, J.P. Muscle performance, voluntary activation, twitch properties and perceived effort in normal subjects and patients with the chronic fatigue syndrome. Brain 1991, 114, 85–98. [Google Scholar]
- Mademli, L.; Arampatzis, A. Effect of voluntary activation on age-related muscle fatigue resistance. J. Biomech 2008, 41, 1229–1235. [Google Scholar]
- Herbert, R.D.; Dean, C.; Gandevia, S.C. Effects of real and imagined training on voluntary muscle activation during maximal isometric contractions. Acta Physiol. Scand 1998, 163, 361–368. [Google Scholar]
- Jubeau, M.; Zory, R.; Gondin, J.; Martin, A.; Maffiuletti, N.A. Effect of electrostimulation training-detraining on neuromuscular fatigue mechanisms. Neurosci. Lett 2007, 424, 41–46. [Google Scholar]
- Belanger, A.Y.; McComas, A.J. Extent of motor unit activation during effort. J. Appl. Physiol 1981, 51, 1131–1135. [Google Scholar]
- Folland, J.P.; Williams, A.G. Methodological issues with the interpolated twitch technique. J. Electromyogr. Kinesiol 2007, 17, 317–327. [Google Scholar]
- Merton, P.A. Voluntary strength and fatigue. J. Physiol 1954, 123, 553–564. [Google Scholar]
- Rutherford, O.M.; Jones, D.A.; Newham, D.J. Clinical and experimental application of the percutaneous twitch superimposition technique for the study of human muscle activation. J. Neurol. Neurosur. Psychiatry 1986, 49, 1288–1291. [Google Scholar]
- Allen, G.M.; Gandevia, S.C.; McKenzie, D.K. Reliability of measurements of muscle strength and voluntary activation using twitch interpolation. Muscle Nerv 1995, 18, 593–600. [Google Scholar]
- Behm, D.G.; St-Pierre, D.M.; Perez, D. Muscle inactivation: assessment of interpolated twitch technique. J. Appl. Physiol 1996, 81, 2267–2273. [Google Scholar]
- Norregaard, J.; Lykkegaard, J.J.; Bulow, P.M.; Danneskiold-Samsoe, B. The twitch interpolation technique for the estimation of true quadriceps muscle strength. Clin. Physiol. (Oxford, England) 1997, 17, 523–532. [Google Scholar]
- Bülow, P.M.; Nørregaard, J.; Danneskiold-Samsøel, B.; Mehlsen, J. Twitch interpolation technique in testing of maximal muscle strength: influence of potentiation, force level, stimulus intensity and preload. Eur. J. Appl. Physiol. Occup. Physiol 1993, 67, 462–466. [Google Scholar]
- Babault, N.; Pousson, M.; Michaut, A.; Ballay, Y.; Hoecke, J.V. EMG activity and voluntary activation during knee-extensor concentric torque generation. Eur. J. Appl. Physiol 2002, 86, 541–547. [Google Scholar]
- Herbert, R.D.; Gandevia, S.C. Twitch interpolation in human muscles: mechanisms and implications for measurement of voluntary activation. J. Neurophysiol 1999, 82, 2271–2283. [Google Scholar]
- Stackhouse, S.K.; Dean, J.C.; Lee, S.C.; Binder-MacLeod, S.A. Measurement of central activation failure of the quadriceps femoris in healthy adults. Muscle Nerv 2000, 23, 1706–1712. [Google Scholar]
- Dowling, J.J.; Konert, E.; Ljucovic, P.; Andrews, D.M. Are humans able to voluntarily elicit maximum muscle force? Neurosci. Lett 1994, 179, 25–28. [Google Scholar]
- Kent-Braun, J.A.; Le Blanc, R. Quantitation of central activation failure during maximal voluntary contractions in humans. Muscle Nerv 1996, 19, 861–869. [Google Scholar]
- Yue, G.H.; Ranganathan, V.K.; Siemionow, V.; Liu, J.Z.; Sahgal, V. Older adults exhibit a reduced ability to fully activate their biceps brachii muscle. J. Gerontol 1999, 54, M249–M253. [Google Scholar]
- Chang, Y.J.; Fang, C.Y.; Hsu, M.J.; Lien, H.Y.; Wong, M.K. Decrease of hypertonia after continuous passive motion treatment in individuals with spinal cord injury. Clin. Rehab 2007, 21, 712–718. [Google Scholar]
- Castro, M.J.; Apple, D.F., Jr.; Rogers, S.; Dudley, G.A. Influence of complete spinal cord injury on skeletal muscle mechanics within the first 6 months of injury. Eur. J. Appl. Physiol 2000, 81, 128–131. [Google Scholar]
- Shields, R.K. Fatigability, relaxation properties, and electromyographic responses of the human paralyzed soleus muscle. J. Neurophysiol 1995, 73, 2195–2206. [Google Scholar]
- Odum, E.P.; Barrett, G.W. Fundamentals of Ecology, 5th ed; Thomson Brooks/Cole: Belmont, CA, UAS, 2005. [Google Scholar]
- Pearl, R.; Reed, L.J. On the rate of growth of the population of the United States since 1790 and its mathematical representation. Proc. Natl. Acad. Sci. USA 1920, 6, 275–288. [Google Scholar]
- Pearl, R. The Biology of Population Growth; Alfred A. Knopf: New York, NY, USA, 1925. [Google Scholar]
- Orishimo, K.F.; Burstein, G.; Mullaney, M.J.; Kremenic, I.J.; Nesse, M.; McHugh, M.P.; Lee, S.J. Effect of knee flexion angle on Achilles tendon force and ankle joint plantarflexion moment during passive dorsiflexion. J. Foot Ankle Surg 2008, 47, 34–39. [Google Scholar]
- Sale, D.; Quinlan, J.; Marsh, E.; McComas, A.J.; Belanger, A.Y. Influence of joint position on ankle plantarflexion in humans. J. Appl. Physiol.: Respirat. Environ. Exerc. Physiol 1982, 52, 1636–1642. [Google Scholar]
- Knight, C.A.; Kamen, G. Relationships between voluntary activation and motor unit firing rate during maximal voluntary contractions in young and older adults. Eur. J. Appl. Physiol 2008, 103, 625–630. [Google Scholar]
- Phillips, S.K.; Bruce, S.A.; Newton, D.; Woledge, R.C. The weakness of old age is not due to failure of muscle activation. J. Gerontol 1992, 47, M45–M49. [Google Scholar]
- Kendall, T.L.; Black, C.D.; Elder, C.P.; Gorgey, A.; Dudley, G.A. Determining the extent of neural activation during maximal effort. Med. Sci. Sports Exerc 2006, 38, 1470–1475. [Google Scholar]
- De Luca, C.J.; LeFever, R.S.; McCue, M.P.; Xenakis, A.P. Control scheme governing concurrently active human motor units during voluntary contractions. J. Physiol 1982, 329, 129–142. [Google Scholar]
- Kukulka, C.G.; Clamann, H.P. Comparison of the recruitment and discharge properties of motor units in human brachial biceps and adductor pollicis during isometric contractions. Brain Res 1981, 219, 45–55. [Google Scholar]
- De Luca, C.J.; LeFever, R.S.; McCue, M.P.; Xenakis, A.P. Behaviour of human motor units in different muscles during linearly varying contractions. J. Physiol 1982, 329, 113–128. [Google Scholar]
- Erim, Z.; De Luca, C.J.; Mineo, K.; Aoki, T. Rank-ordered regulation of motor units. Muscle Nerv 1996, 19, 563–573. [Google Scholar]


| Force levels (% of MVC) | 20 | 40 | 60 | 80 | 100 |
|---|---|---|---|---|---|
| Voluntary activation (%) | 14.23 ± 7.91 | 32.05 ± 10.85 | 54.81 ± 16.04 | 80.44 ± 11.23 | 86.71 ± 12.76 |
©2010 by the authors; licensee Molecular Diversity Preservation International, Basel, Switzerland. This article is an open access article distributed under the terms and conditions of the Creative Commons Attribution license (http://creativecommons.org/licenses/by/3.0/)
Share and Cite
Huang, Y.-M.; Hsu, M.-J.; Lin, C.-H.; Wei, S.-H.; Chang, Y.-J. The Non-linear Relationship between Muscle Voluntary Activation Level and Voluntary Force Measured by the Interpolated Twitch Technique. Sensors 2010, 10, 796-807. https://doi.org/10.3390/s100100796
Huang Y-M, Hsu M-J, Lin C-H, Wei S-H, Chang Y-J. The Non-linear Relationship between Muscle Voluntary Activation Level and Voluntary Force Measured by the Interpolated Twitch Technique. Sensors. 2010; 10(1):796-807. https://doi.org/10.3390/s100100796
Chicago/Turabian StyleHuang, Yi-Ming, Miao-Ju Hsu, Cheng-Hsiang Lin, Shun-Hwa Wei, and Ya-Ju Chang. 2010. "The Non-linear Relationship between Muscle Voluntary Activation Level and Voluntary Force Measured by the Interpolated Twitch Technique" Sensors 10, no. 1: 796-807. https://doi.org/10.3390/s100100796