Design of a Pressure Sensor Based on Optical Fiber Bragg Grating Lateral Deformation

Abstract
: This paper describes steps involved in the design and realization of a new type of pressure sensor based on the optical fiber Bragg grating. A traditional pressure sensor has very limited usage in heavy industrial environments, particularly in explosive or electromagnetically noisy environments. Utilization of optics in these environments eliminates all surrounding influences. An initial motivation for our development was the research, experimental validation, and realization of a complex smart pressure sensor based on the optical principle. The main benefit of this solution consists of increasing sensitivity, resistance to electromagnetic interference, dimensions, and potential increased accuracy.1. Introduction
A pressure sensor presents key technology for the safe operation of different technical products, systems, and technologies. These sensors can be widely found in medicine as well as in different experimental, developmental, and diagnostic processes. Designing of a so-called intelligent pressure sensor has been a burgeoning trend. Intelligent pressure sensors comprise electronic circuits and passive parts, which are required, e.g., for linearization of a sensor’s characteristics and decreasing its dependence on temperature and setting of measuring range, zero point, etc. The most powerful microelectronic circuits enable installation of a digital pressure gauge inside a sensor and also software-control starting of different electronic responses (warning signals, etc.) in accordance with the measured value. Special pressure sensors exist for explosive environments. Such environments present very strict requirements for pressure sensor capsules, electronic systems (especially safety of power buses and securing these signals against unwanted failure sparkling), communication interfaces and buses to prevent possible hazard states in these extreme operating conditions.
Pressure is measured in a very wide range from 10−12 Pa for an extreme vacuum up to 1012 Pa at the research pressure of an explosion. In the widest class of pressure sensors an exactly defined deformation member is used. Its characteristic deviation, or literally deformation, is linearly related to applied pressure. This mechanical value is converted into an electrical digital signal. The method of electric conversion determines the metrological and technical characteristics of the pressure sensor.
Contemporary principles for a transmission of mechanical changes to the deformation member of electric signal are based on the piezoresistive principle [1], inductive principle [2], capacitive principle [3], piezoelectric principle [4,5], thermo-electrical principle [6], and acoustic principle [7,8].
All of these principles have a large number of technological limitations, which restrict their full utilization for pressure sensors in environments with intensive electromagnetic interference and explosion sensitivity.
2. Motivation
The main goal of this project was the development and practical application of a new unique method for scanning deflection of a deformation membrane. This new method is based on an optical measuring system using optical fibers. Generally, the main advantages of optically sensing principles consist of excellent pressure sensitivity, galvanic isolation of the whole sensor via optical fiber, very good accuracy of static and dynamic measuring, maximum immunity against electrical and magnetic interference, and the miniature size of the resulting pressure sensor. The attributes of pressure sensors based on the optically sensing principle also demonstrate optimal characteristics for use in explosive gas environments and in environments with high electromagnetic interference.
This new pressure sensor unfolds new possibilities for application in very special cases, e.g., military or security applications without a threat of electromagnetic tapping. Pressure sensors, in most cases, use displacement sensing of the deformation membrane, where the level of deformation depends on the applied pressure. Generally, two basic optical principles are used for displacement sensing [9]. The first is the sensing principle based on the Fabry-Perot resonator [10–14], which uses the interference effect. The second principle is based on sensing of a light reflection using the fiber Bragg grating (FBG) [15–18]. Both types of measurement principles are very sensitive and accurate for displacement measurements, what makes them ideal for pressure sensors. On the other hand, both principles require highly sophisticated construction of pressure sensing capsules and powerful measuring electronics or software algorithms. Sensors with optical principles are used for many other applications with simpler implementation. A good example of the optical sensing principle with FBG in use is temperature measurement as elaborated in [19,20]. Close to pressure sensors are optical acoustic sensors [21,22] stress [23,24] or strain [25,26] sensors.
Sensing of these physical values by optical principles is simpler than sensing pressure in industrial environments because they not necessarily fulfill all requirements for high resolution of sensing value and construction parameters, which are required for automation application. The optical principles are generally very sensitive and require the stable mechanical construction of sensing unit with parasitic effect compensation.
3. Sensor Design
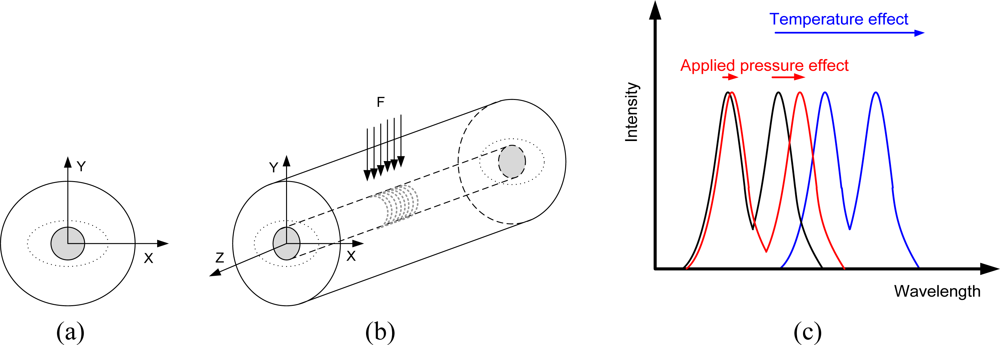
The fiber Bragg grating is a device commonly used in telecommunications and sensor technology. Fiber gratings are formed by a periodic change of the fiber cored refractive index in direction of propagation of optical radiation. In principle, the fiber Bragg grating acts as a spectral filter that reflects particular wavelengths of light near Bragg resonance wavelength and the rest of the optical signal spectrum is being released. The Bragg resonant wavelength is given by:
FBGs used in sensors mostly rely on the spectral analysis of reflected light wavelengths. The Bragg resonant wavelength is determined by various factors applied on the FBG, which affect effectively refractive index or grating periodic variation; therefore, it is an indirect measurement resulting from modifying physical or geometrical properties of the FBG. Among the affected factors we have temperature, mechanical deformation (e.g., stretching, pushing, bending, and applying shear stress) to the fiber Bragg grating. In real applications, it is difficult to separate the effects of measured and parasitic variables that affect the same parameter (e.g., when the fiber Bragg grating deformation is measured, temperature also affects reflected light wavelengths). Pressure measurement is always based on the deformation of some sensing part (typically the membrane), which is afterwards measured by principles described in the first section.
Applied stress on the fiber Bragg grating in the direction of the fiber axis results in the extension of its physical dimensions and in the change of the periodic variation; however, the influence of temperature also affects physical dimensions due to thermal expansion. Mathematically, the shift in the Bragg wavelength λBragg due to an applied strain and temperature change is given by [27]:
Various types of FBG-based sensors have been developed, i.e., [25,26,32] however the majority of these tests or described pressure sensors use the longitudal FBG’s deformation principle, which results in bigger optical signal wavelength displacement (FBG central frequency moves from 10 to 30 nm) unlike our method of pressing the FBG laterally, to obtain an ellipsoidal fiber cross-section shape, which generates a maximum of 300 pm spectrum peak spread. On the other hand, measured peaks` distance is not influenced by temperature effects. Designing a pressure sensing capsule with longitudal FBG deformation and temperature compensation of all parasitic material temperature expansions including the parasitic temperature effects on the measured value is admittedly challenging, moreover for pressure sensing capsule targeted on the automation field. From this reason a lateral deformation of the FBG and more robust sensor capsule became an acceptable way for our sensor capsule design and the subsequent manufacture and assembly process. Lateral deformation of FBG by applied pressure is described in [33], but in fact lateral deformation of coating material around FBG is transformed into longitudal mechanical stretching of FBG along its axis. A crucial factor for applying pressure to FBG is uniform stress along the entire length. This was one of most important parameters during the process of designing our pressure sensing capsule.
In our newly developed sensor this parasitic temperature influence is eliminated by the proposed measurement principle and by the optional use of a second FBG as a reference. This reference FBG senses only temperature not applied stress from deformation membrane. Measured capsule temperature can be used to compensate for the thermal expansion of mechanical components in the sensing capsule and possibly to alarm users when the operating temperature exceeds allowed limits. However, this method brings additional financial costs due to necessity of a second FBG, and a more comprehensive sensor capsule mechanical solution. Temperature compensation of the FBG sensor can be solved by special thermo-package design, which is also described in [20], but in our sensing principle we have used this parasitic temperature influence to measure pressure capsule temperature. From this value we are able to compute the pressure sensing capsule’s thermal expansion and thus minimize this parasitic effect. Therefore there is no more need to solve temperature compensation of FBG sensor itself. According to theoretical expectations applied pressure and temperature indicate different effect on the output signal characteristic and do not interface each other.
For the purposes of our experiment, we have designed a pressure capsule with two sensing FBGs. The primary FBG, which senses pressure, was built inside sensing capsule together with the second FBG for parasitic temperature calibration. The second temperature measurement FBG is placed inside of our sensor as well to verify homogenous temperature distribution inner pressure sensing capsule, however is not necessary for the final application. In fact, the secondary FBG doubles the temperature measuring functionality of the primary pressure sensing FBG. A general pressure capsule designed with incorporated measuring FBGs can be seen in Figure 2.
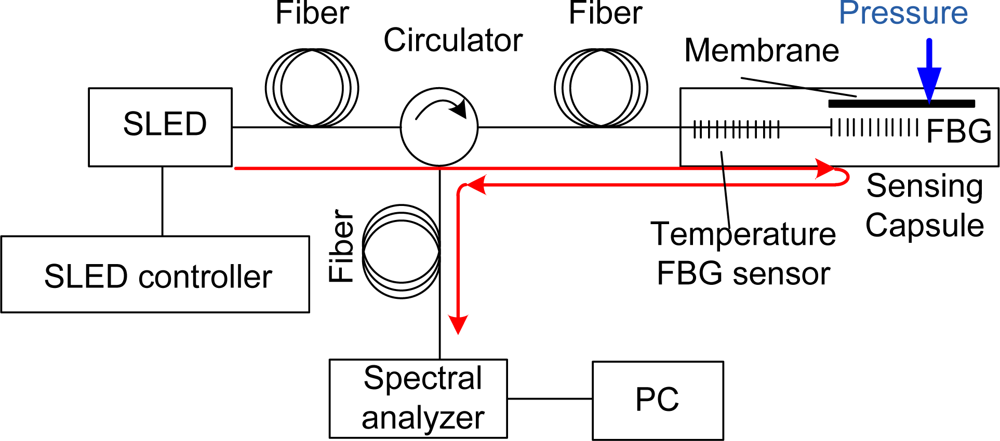
4. Measurement Test-Bed
The measurement setup consists of a optical signal source, in this case a 1 mW fiber coupled super luminescent diode Q Photonics QSDM-1550-2 with a central wavelength of 1,535 nm and spectral width (FWHM) of 35 nm, optical path with the single mode fiber and polarization insensitive mini fiber optic circulator NS-3-131-A9 from New Span Opto-Technology Inc., our developed pressure sensing capsule with incorporated 2 cm long FBG from O/E Land Inc. with central wavelength 1,534 nm and 0.1 nm bandwidth, high resolution (resolution bandwidth FWHM65 pm) spectral analyzer EXFO FTB-5240 with connected PC for data post-processing, and precise pressure controller/calibrator PPC3-DHI from Chell Instruments Ltd. A complete diagram of the used measurement setup is given in Figure 3.
5. Stress Analysis of Pressure Sensors
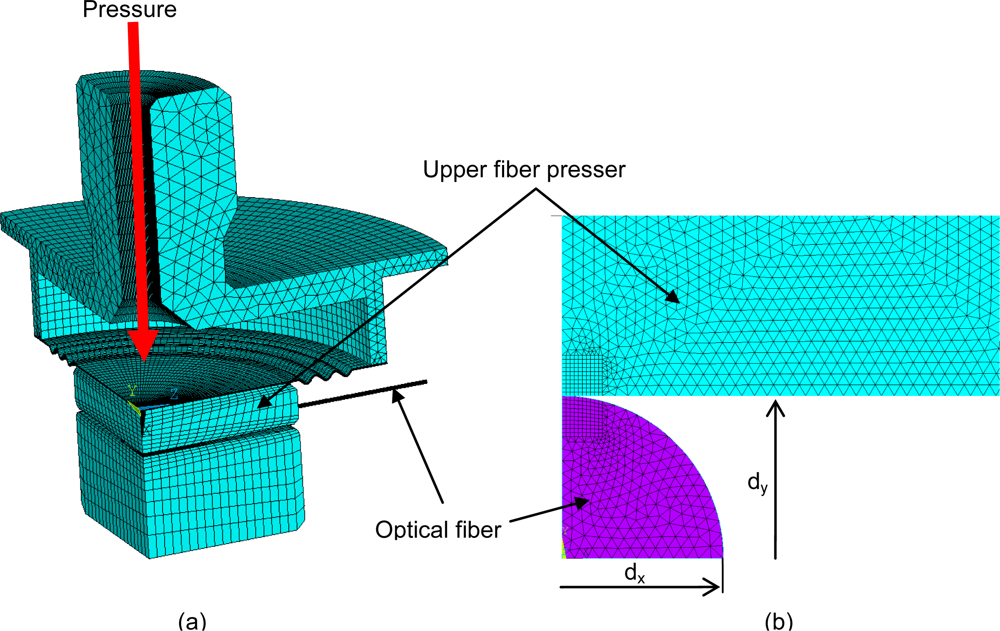
The aim of stress analysis was the verification of our pressure sensor design. The stress limit of the optical fiber is a crucial factor, which is a limitation of using this pressure sensing method, based on the fiber Bragg grating deformation, whereas lateral deformation of optical fibers is desired for exact operation of the pressure sensor. The mechanical design of the pressure sensor (Figure 3) was used for verification of the computational model’s (Figure 4) applicability to a pressure sensor.
The ANSYS software, which comes from the finite elements method (FEM), was used for computational modeling in [34–41]. The stress analysis was divided into two computational parts. The first part is targeted to global stress analysis. The result of the first analysis was used for the second computational simulation, which was targeted to the detailed analysis of optical fiber deformation. Properties of the used material are:
Steel—elastic modulus 210,000 MPa
- ○
Poisson’s ratio 0.3
Optical fiber—elastic modulus 73,000 MPa
- ○
Poisson’s ratio 0.17
- ○
Strength limit 1,100 MPa
The global stress analysis is aimed for the determination of stress and deformation of the membrane, as shown in Figure 5 and calculation of the force, respectively line load, by means of which the optical fiber is loaded. The membrane is loaded by pressure in the inner space of the sensors.
The detailed stress analysis of optical fiber deformation was made for the calculation of cross deformation, which is used for pressure evaluation using a sensing method based on the fiber Bragg grating deformation. The symmetry of geometry was also assumed, so only one quarter of the optical fiber was modeled [Figure 4(b)]. The effect of fiber-end loading was neglected, so 2D analysis was assumed.
The loading was applied to an upper fiber presser, where the value of force loading the optical fiber was determined from the previous global analysis. The simulation result is the distribution of stress and level of deformation. The cross displacement ratio of axes dx and dy is more important in terms of pressure evaluation possibilities using a sensing method based on the fiber Bragg grating deformation.
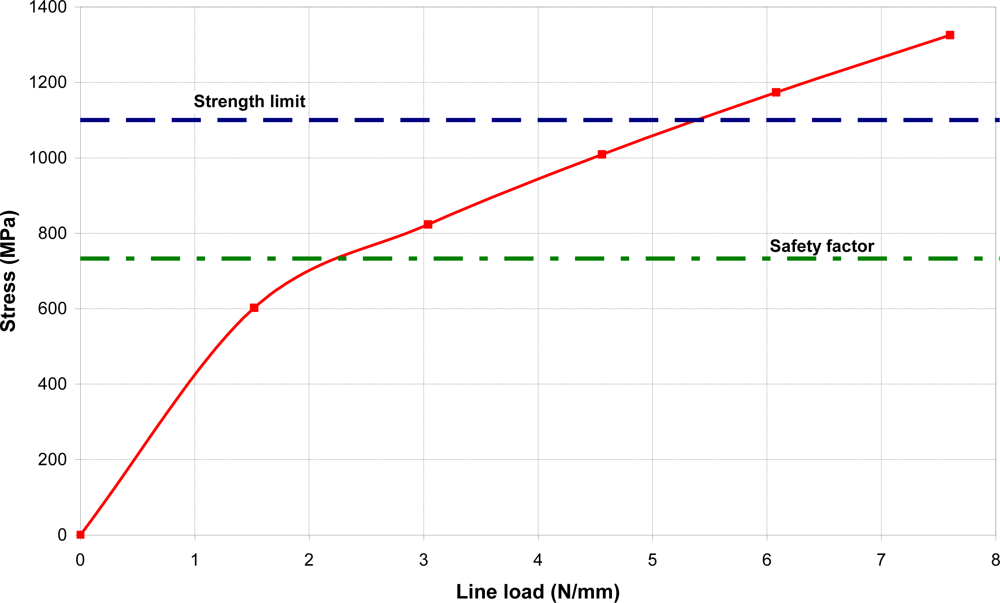
For an optical fiber safety factor of 1.5 a maximal stress level up to 733 MPa is permitted (Figure 6). This corresponds to a line load of 2.25 N/mm. A maximal pressure of 2 bars can be applied onto the sensor, when the length of the pressed fibers is approximately 19 mm. The maximal allowed pressure value was determined using the global analysis [Figure 4(a)]. The computational simulation was solved for determination of the pressure corresponding to a line load on optical fiber of 2.25 N/mm.
The relationship of the cross displacement ratio of axes dx and dy on the line load is nearly linear; therefore, it is possible to derive the following equation from the FEM simulation results:
The results of the FEM simulations can be used for pressure sensor design and mainly for algorithm design of sensing methods based on Bragg grating deformation. The pressure range of sensors can be extended using longer optical fibers, which is suppressed between pressers. However limiting line load is necessary to verify this.
6. Results
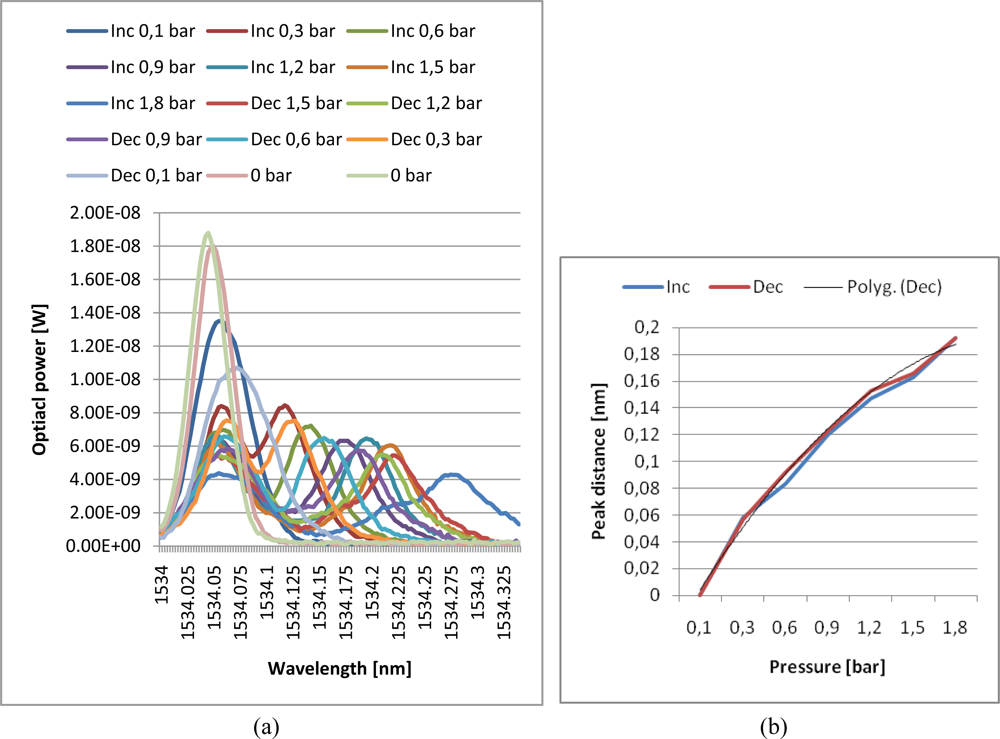
This optical measurement principle is based on an interaction between applied pressure and mechanical deformation of the used FBG, resulting in changes of the shape of reflected spectral characteristics. The reflected spectrum is spread into two peaks whose relative position determines the level of the FBG deformation. Relations between the FBG deformation and distance of two spectral peaks of reflected light is not linear but can be described by second order polynomial function:
Moreover, the distance of these peaks is temperature independent and carries only information of the degree of the FBG deformation. The measured characteristic matches the theoretical expectations exactly [see Figure 1(c)]. Spectral characteristics at different pressures are shown in Figure 7(a). The lowest course with the biggest distance between peaks corresponds to the maximum pressure and the course with only one and the biggest peak stands for zero pressure.
To get more precise results of the peak maximum position, measured characteristics have to be evaluated by regression analysis. Peak distance value provides information about applied pressure. Therefore a more accurate evaluation of peak position can significantly improve the precision of the whole pressure measurement process. From the physical spectrum measurement principle of the used spectral analyzer and the real measured characteristics we derived as the best course for regression analysis a Gaussian curve, which can be described by:
The disadvantage of this measurement is the requirement of a high resolution (∼10 pm) spectral analyzer for precise measurement and the need for post-processing of measured spectral characteristics by regression analysis, which is time consuming and computationally demanding. Interpolation of both measured peaks by regression analysis with Equation (7) significantly improves general pressure measurement precision but also increases the cost for final realization and the complexity of this newly developed pressure sensing system. On the other hand to get the same result without data post-processing and curve fitting it is necessary to have more precise spectral analyzer with higher resolution, below 1 pm. The used SW regression analysis can provide the same resolution with significantly lower cost.
Based on the designed and simulated pressure sensing capsule with lateral FBG deformation we made a prototype of this sensor [see Figure 8(a) drawing and Figure 8(b) final sensor prototype] to validate the correctness of our predictions and theoretical expectations.
The pressure measurement error was determined to be 3.13% by averaging all measurements (including increasing and decreasing pressure to also evaluate sensing membrane hysteresis). Final capsule design fulfills the main requirements for easy installation and fast calibration. Capsule and scanning principle also have excellent resistance to the parasitic effects of temperature when the measured temperature error of the sensing capsule is lower than the temperature error of the spectral analyzer used. The disadvantages of this measurement principle are high demand on the spectral analyzer resolution and strictly precise construction of the sensor capsule with a guaranteed uniform load from one direction to the Bragg grating along its whole length.
7. Conclusions
A new pressure sensor based on the optical principle was developed, realized, and tested. Final construction was designed with planned automation applications in mind. A basic drawing of the new pressure sensor is displayed in Figure 2. The sensing section achieves galvanic isolation of the optical fiber from the measuring unit and can be placed without risk in an explosive industrial environment. The length of the optical fiber can be up to 1 km. The parasitic influence of temperature, which causes the biggest measuring error, was eliminated by the thermo-compensation method used for the sensing capsule design and also by the software algorithm in the evaluation unit. Thermo-compensated design was first analyzed and simulated by the engineering design analysis software (Figure 4) and then tested on the prototype. Measured characteristics from Figure 7(a) are according to theoretical values from Figure 1(c) and allow simple software evaluation of measured pressure. Measured results from cyclic tests [see Figure 7(b)] show final pressure measuring precision under 3.13% over a pressure range (0–1.8 bar) in operation temperature range from −20 °C to +70 °C. Achieved parameters and the materials used make this optical pressure sensor ideal for use in industrial environments, explosive environments, and environments with high electrical and magnetic interference. The main known disadvantage in comparison to the contemporary pressure sensors is slightly worse precision and its higher price. Our future work will be focused mainly on research and development of a cheaper evaluation unit with better resolution for reaching even better measuring precision paired up with a lower error rate.
Acknowledgments
This research has been supported by the Czech Ministry of Education in the frame of the long-term Program Plan MSM 0021630503 MIKROSYN New Trends in Microelectronic Systems and Nanotechnology Systems, partly supported by the ARTEMIS JU in Project No. 100205 Process Oriented Electronic Control Units for Electric Vehicles Developed on a multi-system real-time embedded platform, by the ENIAC JU in Project No. 120001 Nanoelectronics for an Energy Efficient Electrical Car, partly by the Czech, and by the Ministry of Education, Youth and Sports of the Czech Republic in 2C08002 Project—KAAPS Research of Universal and Complex Authentication and Authorization for Permanent and Mobile Computer Networks, under the National Program of Research II.
References
- Tian, B; Zhao, Y; Jiang, Z; Zhang, L; Liao, N; Liu, Y; Meng, C. Fabrication and Structural Design of Micro Pressure Sensors for Tire Pressure Measurement Systems (TPMS). Sensors 2009, 9, 1382–1393. [Google Scholar]
- Baum, H; Pfizenmaier, H; Schmidt, E; Strauss, F. Inductive Pressure Sensor Using Two Oscillators Patent 4536719. 1985.
- Dai, CL; Lu, PW; Chang, C; Liu, CY. Capacitive Micro Pressure Sensor Integrated with a Ring Oscillator Circuit on Chip. Sensors 2009, 9, 10158–10170. [Google Scholar]
- Zhang, XW; Wang, FY; Li, L. Optimal Selection of Piezoelectric Substrates and Crystal Cuts for SAW-Based Pressure and Temperature Sensors. IEEE Trans. Ultrason. Ferroelectr. Freq. Contr 2007, 54, 1207–1216. [Google Scholar]
- Benes, E; Groschl, M; Burger, W; Schmid, M. Sensors Based on Piezoelectric Resonators. Sens Actuat A-Phys 1995, 48, 1–21. [Google Scholar]
- Giani, A; Bayaz, AA; Boulouz, A; Pascal-Delannoy, F; Foucaranm, A; Boyer, A. Thermoelectric Microsensor for Pressure and Gas Concentration Measurement. Mater Sci Eng B 2002, 95, 268–274. [Google Scholar]
- Buff, W; Klett, S; Rusko, M; Ehrenpfordt, J; Goroll, M. Passive Remote Sensing for Temperature and Pressure Using SAW Resonator Devices. IEEE Trans Ultrason Ferroelectr Freq Contr 1998, 45, 1388–1392. [Google Scholar]
- Hauptmann, P; Hoppe, N; Puttmer, A. Application of Ultrasonic Sensors in the Process Industry. Meas Sci Technol 2002, 13, R73–R83. [Google Scholar]
- Passaro, VM; Dell’Olio, F; Casamassima, B; De Leonardis, F. Guided-Wave Optical Biosensors. Sensors 2007, 7, 508–536. [Google Scholar]
- Wang, YC; Shyu, LH; Chang, CP. The Comparison of Environmental Effects on Michelson and Fabry-Perot Interferometers Utilized for the Displacement Measurement. Sensors 2010, 10, 2577–2586. [Google Scholar]
- Parashar, A; Shah, A; Packirisamy, M; Sivakumar, N. Three Cavity Tunable MEMS Fabry Perot Interferometer. Sensors 2007, 7, 3071–3083. [Google Scholar]
- Aref, SH; Latifi, H; Zibaii, MI; Afshari, M. Fiber Optic Fabry-Perot Pressure Sensor with Low Sensitivity to Temperature Changes for Downhole Application. Opt Commun 2007, 269, 322–330. [Google Scholar]
- Bremer, K; Lewis, E; Leen, G; Lochmann, S; Mueller, I. Conception and Preliminary Evaluation of an Optical Fibre Sensor for Simultaneous Measurement of Pressure and Temperature. J Phys Conf Ser 2009. doi: 10.1088/1742-6596/178/1/012016. [Google Scholar]
- Wlodarczyk, MT. Fiber-Optic Combustion Pressure Sensor for Automotive Engine Controls. Laser diode LED Appl 1997, 3000, 51–59. [Google Scholar]
- Ahmad, H; Wu, YC; Thambiratnam, K; Zulklifi, MZ; Prabakaran, MP; Thant, MM; Harun, SW. High Sensitivity Fiber Bragg Grating Pressure Sensor Using Thin Metal Diaphragm. IEEE Sens J 2009, 9, 1654–1659. [Google Scholar]
- Zhang, W; Fang, L; Yuliang, L. Fiber Bragg Grating Pressure Sensor with Ultrahigh Sensitivity and Reduced Temperature Sensitivity. Opt Eng 2009, 2, 024402–024406. [Google Scholar]
- Wei, Z; Song, D; Zhao, Q; Cui, HL. High Pressure Sensor Based on Fiber Bragg Grating and Carbon Fiber Laminated Composite. IEEE Sens J 2008, 9, 1615–1619. [Google Scholar]
- Huang, HS; Liang, TC. The Fabrication and Analysis of Lateral Pressure Fiber Sensor Based on Fiber Bragg Grating. Microwave Opt Technol Lett 2008, 50, 2535–2537. [Google Scholar]
- Park, HJ; Song, M. Linear FBG Temperature Sensor Interrogation with Fabry-Perot ITU Multi-wavelength Reference. Sensors 2008, 8, 6776–6769. [Google Scholar]
- Viegas, D; Abad, S; Santos, JL; Ferreira, LA; Araujo, FM. Miniature High-Temperature Fiber Bragg Grating Sensor Design Based on U-Shaped Lossless Taper for Thermal Mapping Applications. IEEE Photonic Technol Lett 2010, 11, 811–813. [Google Scholar]
- Campopiano, S; Cutolo, A; Cusano, A; Giordano, M; Giuseppe, P; Giuseppe, L; Laudati, M. Underwater Acoustic Sensors Based on Fiber Bragg Gratings. Sensors 2009, 9, 4446–4454. [Google Scholar]
- Takahashi, N; Hirose, A; Takahashi, S. Underwater Acoustic Sensor with Fiber Bragg Grating. Opt Rev 1997, 6, 691–694. [Google Scholar]
- Lourenço, IJ; Possetti, GRC; Muller, M; Fabris, JL. Fiber Bragg Grating Sensor to Monitor Stress Kinetics in Drying Process of Commercial Latex Paints. Sensors 2010, 10, 4761–4776. [Google Scholar]
- Malla, RB; Sen, A; Garrick, NW. A Special Fiber Optic Sensor for Measuring Wheel Loads of Vehicles on Highways. Sensors 2008, 8, 2551–2568. [Google Scholar]
- Yang, Y; Annamdas, VG; Wang, C; Zhou, Y. Application of Multiplexed FBG and PZT Impedance Sensors for Health Monitoring of Rocks. Sensors 2008, 8, 271–289. [Google Scholar]
- Wang, Y; Wang, M; Huang, X. High-Sensitivity Fiber Bragg Grating Transverse Force Sensor Based on Centroid Measurement of Polarization-Dependent Loss. Meas Sci Technol 2010, 21, 210046–210052. [Google Scholar]
- Zhang, X; Max, JJ; Jiang, X; Yu, L; Kassi, H. Experimental Investigation on Optical Spectral Deformation of Embedded FBG Sensors. Proc SPIE 2007. doi: 10.1117/12.700807.. [Google Scholar]
- Wang, Y; Yun, B; Chen, N; Cui, Y. Characterization of a High Birefringence Fibre Bragg Grating Sensor Subjected to non-Homogeneous Transverse Strain Fields. Meas Sci Technol 2006, 17, 939–942. [Google Scholar]
- Sirkis, JS. Unified Approach to Phase-Strain-Temperature Models for Smart Structure Interferometric Optical Fiber Sensors: Part 1, Development. Opt Eng 1993. doi: 10.1117/12.61199.. [Google Scholar]
- Martin, EA. Introduction to the Mechanics of Solids; Addison-Wesley: Upper Saddle River, NJ, USA, 1980. [Google Scholar]
- Gafsi, R; El-Sherif, MA. Analysis of Induced-Birefringence Effects on Fiber Bragg Gratings. Opt Fiber Technol 2000. doi: 10.1006/ofte.2000.0333. [Google Scholar]
- Liu, L; Zhang, H; Zhao, Q; Liu, Y; Li, F. Temperature-Independent FBG Pressure Sensor with High Sensitivity. Opt Fiber Technol 2007, 13, 78–80. [Google Scholar]
- Sheng, HJ; Fu, MY; Chen, TC; Liu, WF; Bor, SS. A Lateral Pressure Sensor Using a Fiber Bragg Grating. IEEE Photonic Technol Lett 2004. doi: 10.1109/LPT.2004.824998. [Google Scholar]
- Xu, J; Li, H; Yin, W; Mao, J; Li, L. Capacitance Extraction of Three-Dimension Interconnects Using Element-by-Eelement Finite Elements Method (EBE-FEM) and Preconditioned Conjugate Gradient (PCG) Technique. Proc IEICE Trans Electron 2007, E90-C, 179–188. [Google Scholar]
- Shimizu, K; Shimada, S; Sawada, S; Hattori, Y. Contact Area Analysis by FEM with Planing Layer for Electric Contact. Proc IEICE Trans Electron 2009, E92-C, 1013–1019. [Google Scholar]
- Ansari, ZM; Cho, C. A Study on Increasing Sensitivity of Rectangular Microcantilevers Used in Biosensors. Sensors 2008, 8, 7530–7544. [Google Scholar]
- Ansari, ZM; Cho, C. Deflection, Frequency, and Stress Characteristics of Rectangular, Triangular, and Step Profile Microcantilevers for Biosensors. Sensors 2009, 9, 6046–6057. [Google Scholar]
- Ansari, ZM; Cho, C; Kim, J; Bang, B. Comparison between Deflection and Vibration Characteristics of Rectangular and Trapezoidal profile Microcantilevers. Sensors 2009, 9, 2706–2718. [Google Scholar]
- Mohammed, AA; Mousa, WA; Lou, E. High Sensitivity MEMS Strain Sensor: Design and Simulation. Sensors 2008, 8, 2642–2661. [Google Scholar]
- Mariani, S; Ghisi, A; Corigliano, A; Zerbini, S. Multi-Scale Analysis of MEMS Sensors Subject to Drop Impacts. Sensors 2007, 7, 1817–1833. [Google Scholar]
- Tsai, HH; Wu, DH; Chiang, XD; Li, Q; Xu, C. Design of a Smart Ultrasonic Transducer for Interconnecting Machine Applications. Sensors 2009, 9, 1394–1408. [Google Scholar]
- Marquardt, D. An Algorithm for Least-Squares Estimation of Nonlinear Parameters. SIAM J Appl Math 1963, 11, 431–441. [Google Scholar]


© 2010 by the authors; licensee MDPI, Basel, Switzerland. This article is an open access article distributed under the terms and conditions of the Creative Commons Attribution license ( http://creativecommons.org/licenses/by/3.0/).
Share and Cite
Urban, F.; Kadlec, J.; Vlach, R.; Kuchta, R. Design of a Pressure Sensor Based on Optical Fiber Bragg Grating Lateral Deformation. Sensors 2010, 10, 11212-11225. https://doi.org/10.3390/s101211212
Urban F, Kadlec J, Vlach R, Kuchta R. Design of a Pressure Sensor Based on Optical Fiber Bragg Grating Lateral Deformation. Sensors. 2010; 10(12):11212-11225. https://doi.org/10.3390/s101211212
Chicago/Turabian StyleUrban, Frantisek, Jaroslav Kadlec, Radek Vlach, and Radek Kuchta. 2010. "Design of a Pressure Sensor Based on Optical Fiber Bragg Grating Lateral Deformation" Sensors 10, no. 12: 11212-11225. https://doi.org/10.3390/s101211212