Conductometric Soot Sensor for Automotive Exhausts: Initial Studies


Abstract
:1. Introduction
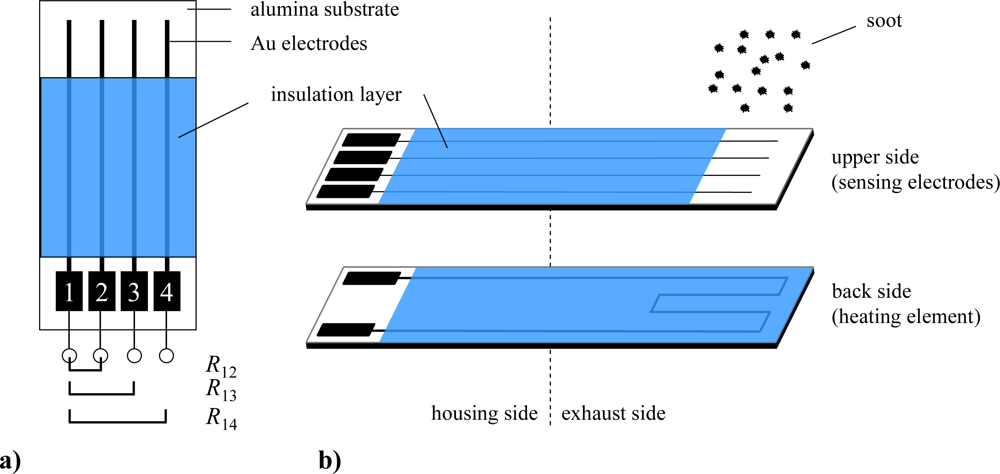
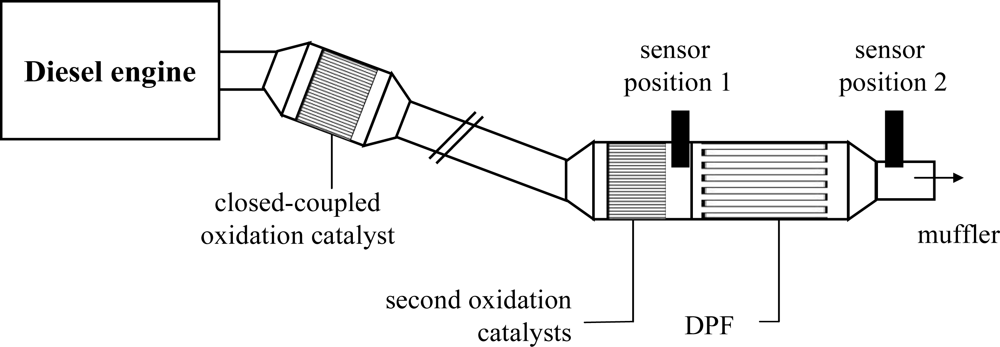
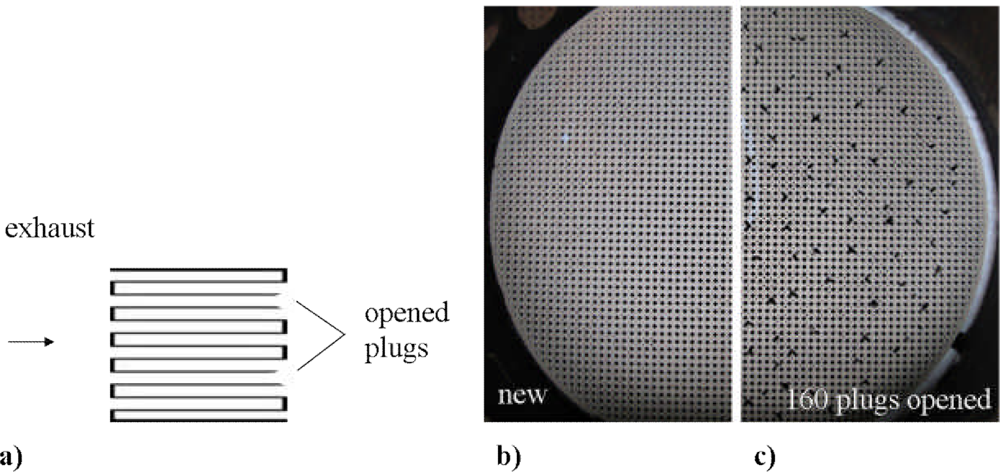
2. Experimental
3. Results and Discussion
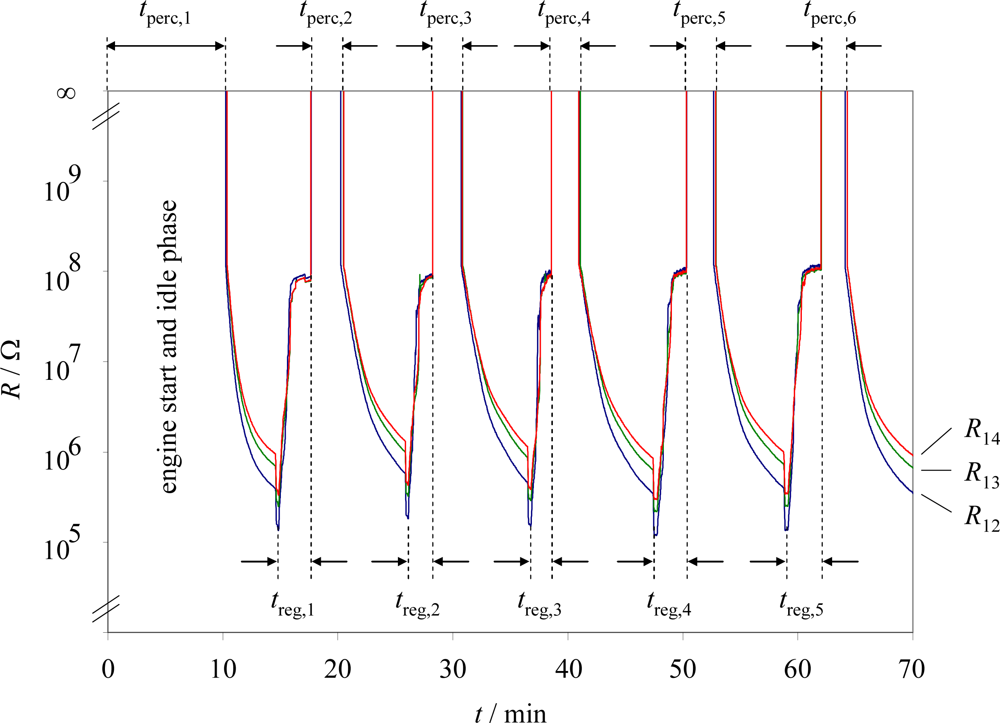
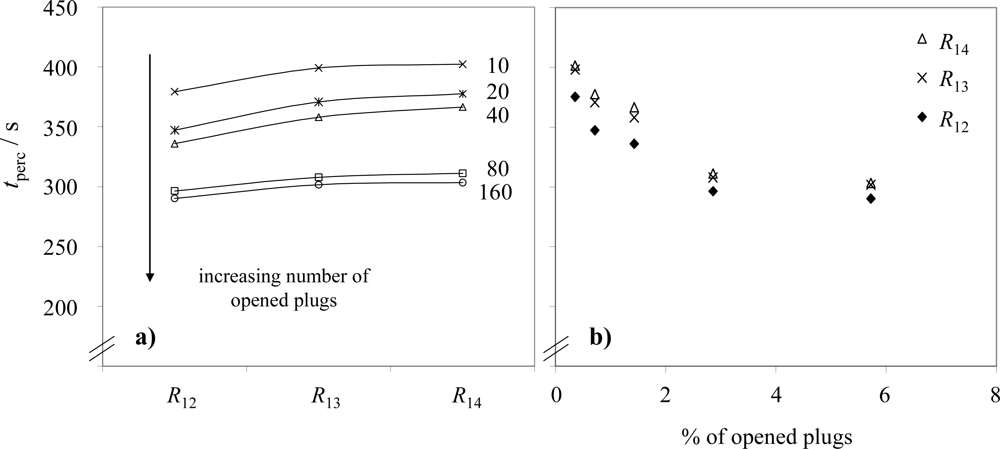
3.1. Sensor at position 1 (results)
3.2. Sensor at position 1 (discussion)
3.3. Sensor at position 2 (results and discussion)
4. Conclusions and Outlook
References and Notes
- Twigg, M.V.; Phillips, P.R. Cleaning the air we breathe—Controlling diesel particulate emissions from passenger cars. Platin. Metals Rev 2009, 53, 27–34. [Google Scholar]
- Johnson, T.V. Diesel emission control in review. SAE Tech. Paper 2007. No. 2007-01-0233. [Google Scholar]
- Adler, J. Ceramic Diesel particulate filters. Int. J. Appl. Ceram. Technol 2005, 2, 429–439. [Google Scholar]
- Twigg, M.V. Progress and future challenges in controlling automotive exhaust gas emissions. Appl. Catal. B: Environ 2007, 70, 2–15. [Google Scholar]
- Fino, D.; Specchia, V. Open issues in oxidative catalysis for diesel particulate abatement. Powder Technol 2008, 180, 64–73. [Google Scholar]
- Alkemade, U.G.; Schumann, B. Engines and exhaust after treatment systems for future automotive applications. Solid State Ionics 2006, 177, 2291–2296. [Google Scholar]
- Birkhofer, T.; Knezevic, A.; Müller, R.; Plog, C. Device for determining the state of a soot particle filter. US Patent, US20080,048,681, 2008.
- Moos, R.; Wedemann, M.; Spörl, M.; Reiß, S.; Fischerauer, G. Direct catalyst monitoring by electrical means: An overview on promising novel principles. Topic. Catalysis 2009, 52, 2035–2040. [Google Scholar]
- Reiß, S.; Wedemann, M.; Moos, R.; Rösch, M. Electrical in situ characterization of three-way catalyst coatings. Topic. Catalysis 2009, 52, 1898–1902. [Google Scholar]
- Kubinski, D.J.; Visser, J. Sensor and method for determining the ammonia loading of a zeolite SCR catalyst. Sensor. Actuat. B: Chem 2008, 130, 425–429. [Google Scholar]
- Müller, N.; Jess, A.; Moos, R. Direct detection of coke deposits on fixed bed catalysts by electrical sensors. Sensor. Actuat. B: Chem 2010, 144, 437–442. [Google Scholar]
- Fischerauer, G.; Förster, M.; Moos, R. Sensing the soot load in automotive diesel particulate filters by microwave methods. Meas. Sci. Technol 2010, 21, 035108. [Google Scholar]
- Riegel, J.; Neumann, H.; Wiedenmann, H.M. Exhaust gas sensors for automotive emission control. Solid State Ionics 2002, 152–153, 783–800. [Google Scholar]
- Moos, R. A brief overview on automotive exhaust gas sensors based on electroceramics. Int. J. Appl. Ceram. Technol 2005, 2, 401–413. [Google Scholar]
- Miura, N.; Nakatou, M.; Zhuiykov, S. Development of NOx sensing devices based on YSZ and oxide electrode aiming for monitoring car exhausts. Ceram. Int 2004, 30, 1135–1139. [Google Scholar]
- Moos, R.; Schönauer, D. Review: Recent developments in the field of automotive exhaust gas ammonia sensing. Sensor Lett 2008, 6, 821–825. [Google Scholar]
- Riegel, J.; Klett, S. Sensors for modern exhaust gas after-treatment systems. Proceedings of the 5th International Exhaust Gas and Particulate Emissions Forum, Ludwigsburg, Germany, February 2008; pp. 84–97.
- Rubalit 708S Data sheet. CeramTec: Lauf, Germany. Available online: http://materials.globalspec.com/datasheets/3727/CeramTecNorthAmerica/47CC2CBB-3F3F-DB6-912E-935F921CF9FC (accessed on 9 February 2010).
- McLachlan, D.S. An equation for the conductivity of binary mixtures with anisotropic grain structures. J. Phys. C: Solid State Phys 1987, 20, 865–877. [Google Scholar]
- McLachlan, D.S.; Blaszkiewicz, M.; Newnham, R.E. Electrical resistivity of composites. J. Amer. Ceram. Soc 1990, 73, 2187–2203. [Google Scholar]
- Müller, N.; Moos, R.; Jess, A. In situ monitoring of coke deposits during coking and regeneration of solid catalysts by electrical impedance-based sensors. Chem. Eng. Technol 2010, 33, 103–112. [Google Scholar]
- Dunne, L.; Sarkar, A.; Kroto, H.; Munn, J.; Kathirgamanathan, P.; Heinen, U.; Fernandez, J.; Hare, J.; Reid, D.; Clark, A. Electrical, magnetic and structural characterization of fullerene soots. J. Phys.: Condens. Matter 1996, 8, 2127–2141. [Google Scholar]


© 2010 by the authors; licensee Molecular Diversity Preservation International, Basel, Switzerland. This article is an open access article distributed under the terms and conditions of the Creative Commons Attribution license (http://creativecommons.org/licenses/by/3.0/).
Share and Cite
Hagen, G.; Feistkorn, C.; Wiegärtner, S.; Heinrich, A.; Brüggemann, D.; Moos, R. Conductometric Soot Sensor for Automotive Exhausts: Initial Studies. Sensors 2010, 10, 1589-1598. https://doi.org/10.3390/s100301589
Hagen G, Feistkorn C, Wiegärtner S, Heinrich A, Brüggemann D, Moos R. Conductometric Soot Sensor for Automotive Exhausts: Initial Studies. Sensors. 2010; 10(3):1589-1598. https://doi.org/10.3390/s100301589
Chicago/Turabian StyleHagen, Gunter, Constanze Feistkorn, Sven Wiegärtner, Andreas Heinrich, Dieter Brüggemann, and Ralf Moos. 2010. "Conductometric Soot Sensor for Automotive Exhausts: Initial Studies" Sensors 10, no. 3: 1589-1598. https://doi.org/10.3390/s100301589