Advanced Taste Sensors Based on Artificial Lipids with Global Selectivity to Basic Taste Qualities and High Correlation to Sensory Scores


Abstract
:
1. Introduction
2. Taste Sensors
2.1. Using artificial lipid-based membrane
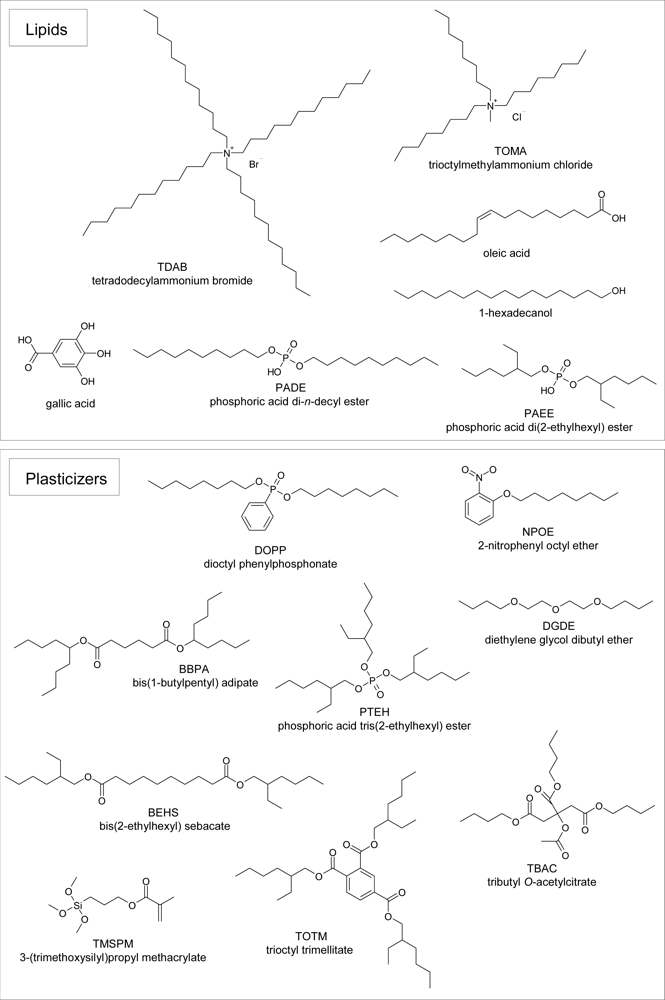
2.2. Reagents
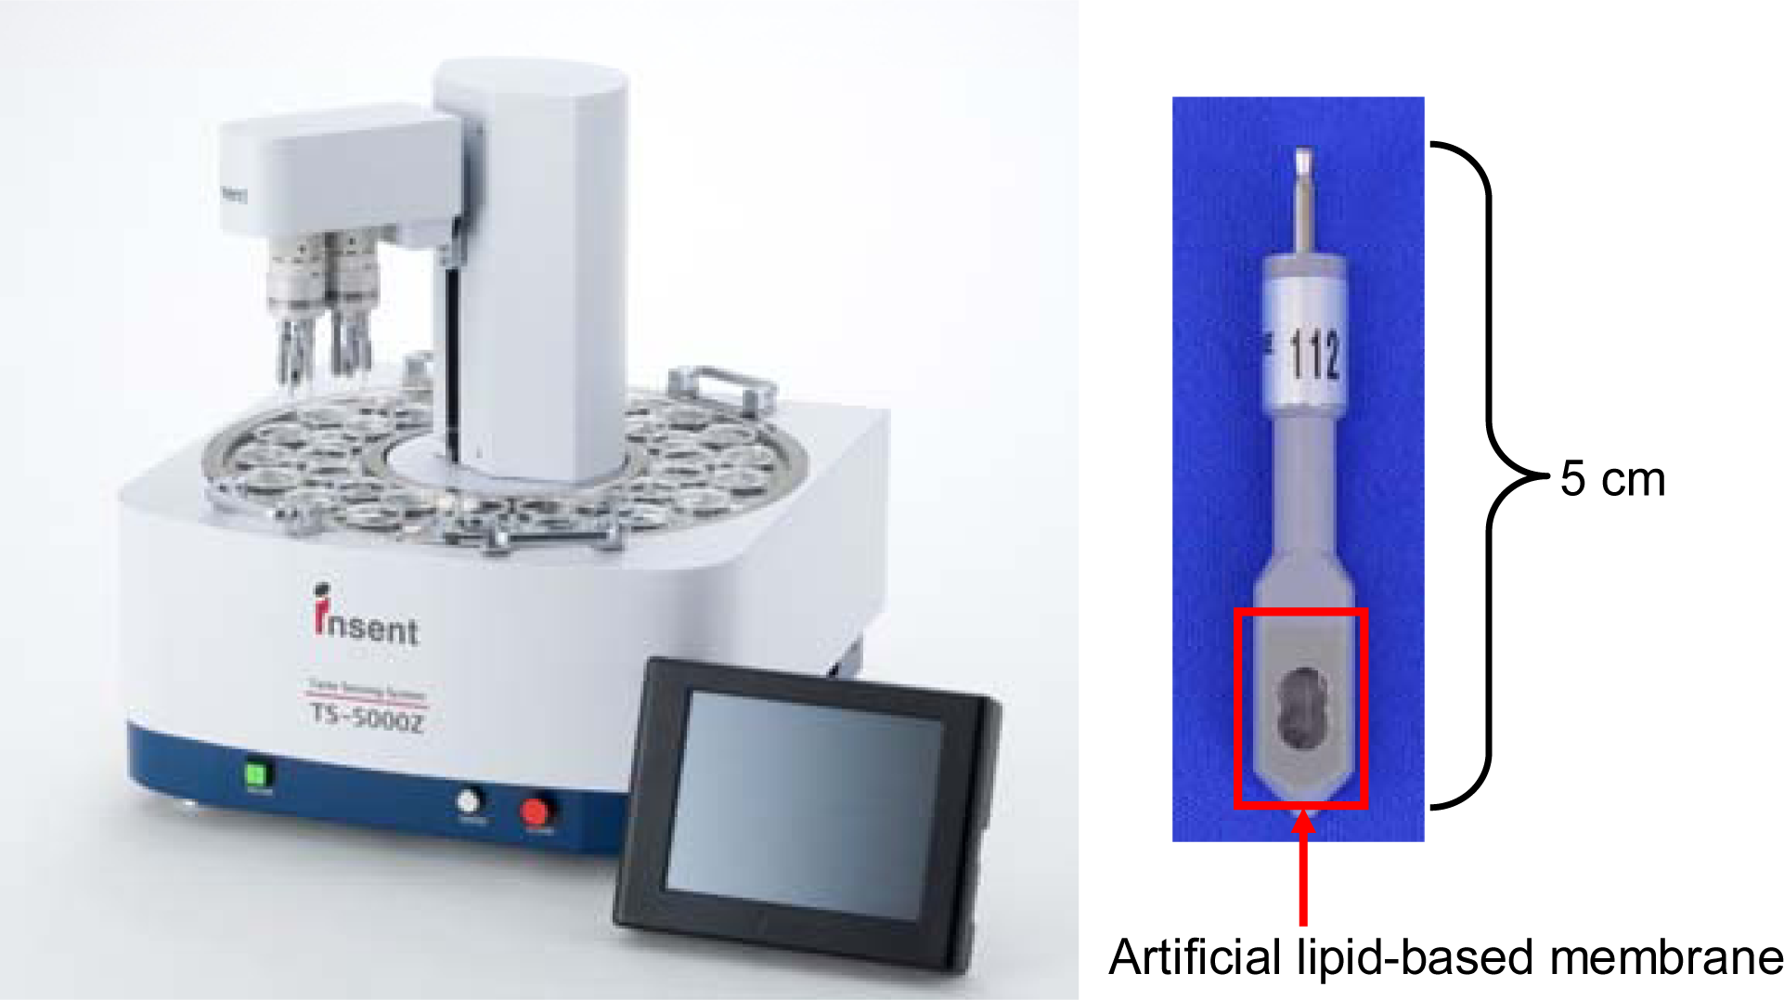
2.3. Fabrication
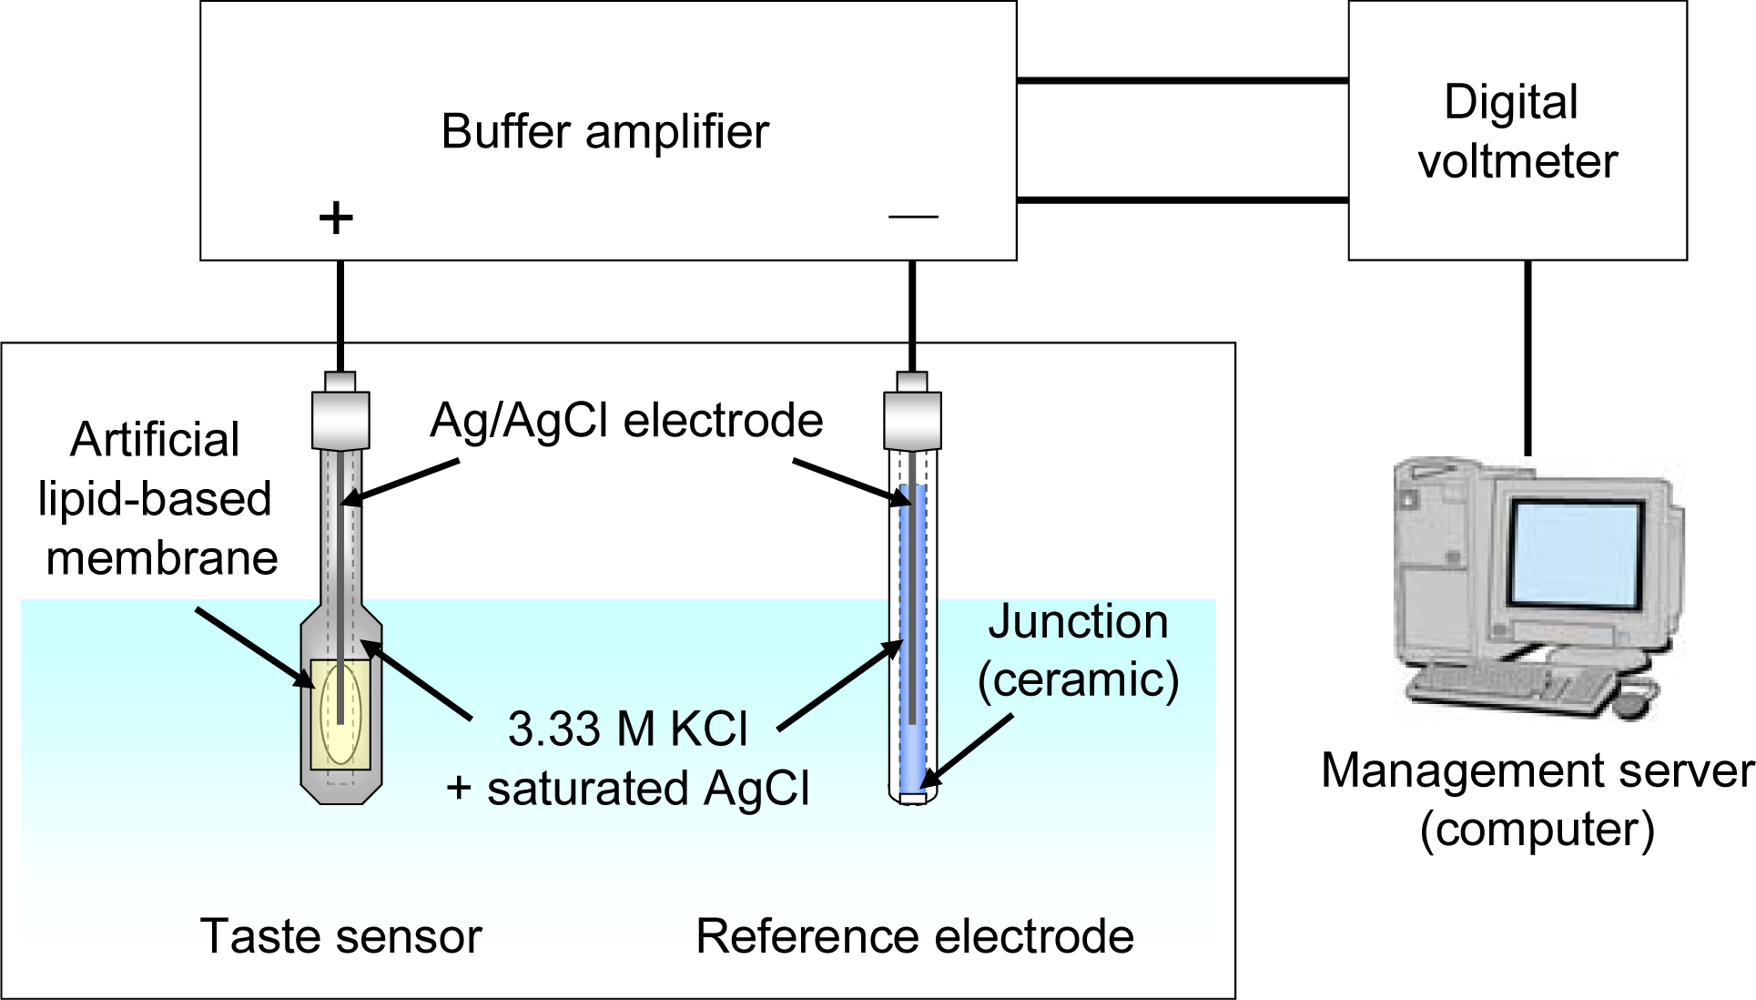
2.4. Measurement system
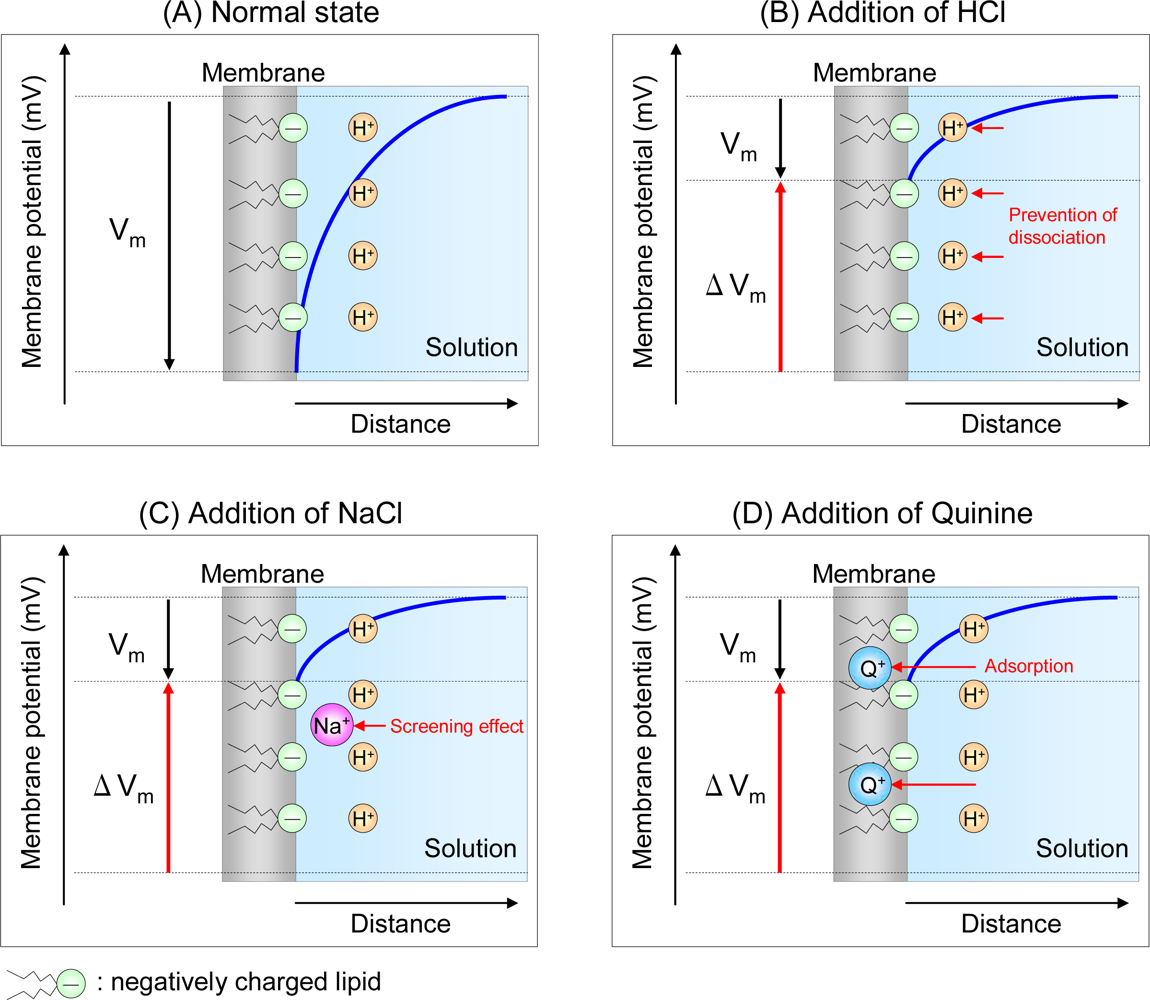
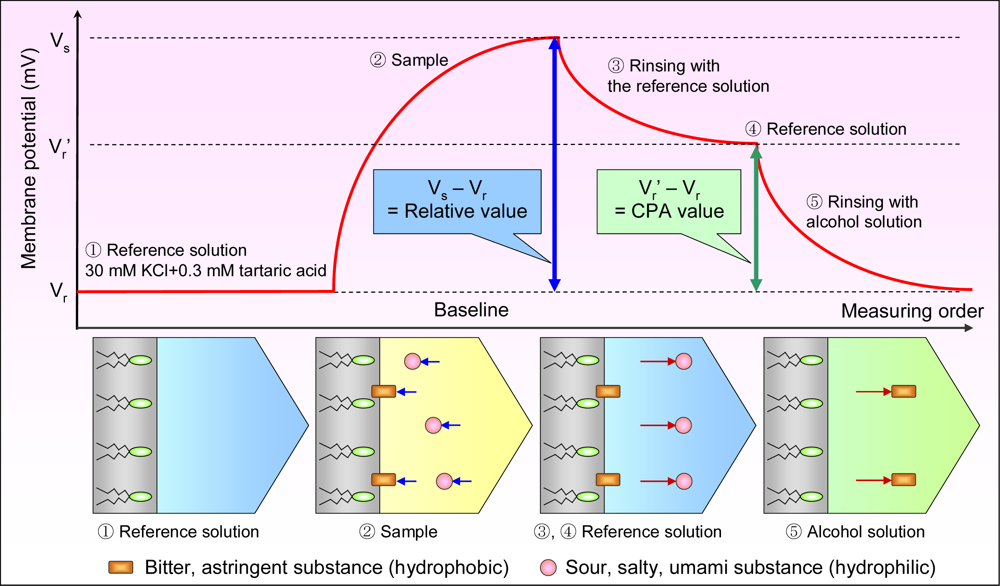
2.5. Mechanism of taste sensor response
2.6. Measurement procedure
3. Taste Sensor Design
3.1. Optimizing electric charge density of membrane
3.2. Optimizing hydrophobicity of membrane
4. Sensor Characteristics
4.1. Threshold of taste for basic tastes
4.2. Global selectivity
4.3. High correlation with human sensory score
4.4. Conversion to taste information
5. Applications
5.1. Taste evaluations for foods and beverages
5.2. Quality control
5.3. Suppression effect
6. Conclusions
References and Notes
- Legin, A.; Rudnitskaya, A.; Vlasov, Y.; Di Natale, C.; Davide, F.; D’Amico, A. Tasting of beverages using an electronic tongue. Sens. Actuat. B 1997, 44, 291–296. [Google Scholar]
- Vlasov, Y.; Legin, A. Non-selective chemical sensors in analytical chemistry: from “electronic nose” to “electronic tongue”. Fresenius J. Anal. Chem 1998, 361, 255–260. [Google Scholar]
- Legin, A.; Rudnitskaya, A.; Vlasov, Y.; Di Natale, C.; Mazzone, E.; D'Amico, A. Application of electronic tongue for qualitative and quantitative analysis of mineral water and wine. Electroanal 1999, 11, 814–820. [Google Scholar]
- Di Natale, C.; Paolesse, R.; Macagnano, A.; Mantini, A.; D'Amico, A.; Ubigli, M.; Legin, A.; Lvova, L.; Rudnitskaya, A.; Vlasov, Y. Application of a combined artificial olfaction and taste system to the quantification of relevant compounds in red wine. Sens. Actuat. B 2000, 69, 342–347. [Google Scholar]
- Vlasov, Y.; Legin, A.; Rudnitskaya, A.; Di Natale, C.; D’Amico, A. Nonspecific sensor arrays (“electronic tongue”) for chemical analysis of liquids (IUPAC Technical Report). Pure Appl. Chem 2005, 77, 1965–1983. [Google Scholar]
- Winquist, F.; Wide, P.; Lundström, I. An electronic tongue based on voltammetry. Anal. Chim. Acta 1997, 357, 21–31. [Google Scholar]
- Winquist, F.; Holmin, S.; Krantz-Rülcker, C.; Wide, P.; Lundström, I. A hybrid electronic tongue. Anal. Chim. Acta 2000, 406, 147–157. [Google Scholar]
- Toko, K.; Yamafuji, K. Influence of monovalent and divalent cations on the surface area of phosphatidylglycerol monolayers. Chem. Phys. Lipids 1980, 26, 79–99. [Google Scholar]
- Toko, K.; Nitta, J.; Yamafuji, K. Dynamic aspect of a phase transition in DOPH-millipore membranes. J. Phys. Soc. Jpn 1981, 50, 1343–1350. [Google Scholar]
- Toko, K.; Yamafuji, K. Stabilization effect of protons and divalent cations on membrane structures of lipids. Biophys. Chem 1981, 14, 11–23. [Google Scholar]
- Toko, K.; Ryu, K.; Ezaki, S.; Yamafuji, K. Self-sustained oscillations of membrane potential in DOPH-millipore membranes. J. Phys. Soc. Jpn 1982, 51, 3398–3405. [Google Scholar]
- Toko, K.; Tsukiji, M.; Ezaki, S.; Yamafuji, K. Current-voltage characteristics and self-sustained oscillations in dioleyl phosphate-millipore membranes. Biophys. Chem 1984, 20, 39–59. [Google Scholar]
- Toko, K.; Nosaka, M.; Tsukiji, M.; Yamafuji, K. Dynamic property of membrane formation in a protoplasmic droplet of nitella. Biophys. Chem 1985, 21, 295–313. [Google Scholar]
- Toko, K.; Yoshikawa, K.; Tsukiji, M.; Nosaka, M.; Yamafuji, K. On the oscillatory phenomenon in an oil/water interface. Biophys. Chem 1985, 22, 151–158. [Google Scholar]
- Toko, K.; Tsukiji, M.; Iiyama, S.; Yamafuji, K. Self-sustained oscillations of electric potential in a model membrane. Biophys. Chem 1986, 23, 201–210. [Google Scholar]
- Toko, K.; Nakashima, N.; Iiyama, S.; Yamafuji, K. Self-oscillation of electric potential of a porous membrane impregnated with polymer multi-bilayer complexes. Chem. Lett 1986, 15, 1375–1378. [Google Scholar]
- Iiyama, S.; Toko, K.; Yamafuji, K. Effect of bitter substances on a model membrane system of taste reception. Agric. Biol. Chem 1986, 50, 2709–2714. [Google Scholar]
- Iiyama, S.; Toko, K.; Yamafuji, K. Electric oscillation in an excitable model membrane impregnated with lipid analogues. Biophys. Chem 1987, 28, 129–135. [Google Scholar]
- Hayashi, K.; Yamafuji, K.; Toko, K.; Ozaki, N.; Yoshida, T. Effect of taste substances on electric characteristics of a lipid cast membrane with a single pore. Sens. Actuat 1989, 16, 25–42. [Google Scholar]
- Toko, K.; Hayashi, K.; Fujiyoshi, T.; Yamafuji, K. Self-organized electric structure in uni- and multicellular biological systems. Synergetics 1989, 43, 326–327. [Google Scholar]
- Iiyama, S.; Toko, K.; Hayashi, K.; Yamafuji, K. Effect of several sweet substances on the electric characteristics of a dioleyl phosphate-millipore membrane. Agric. Biol. Chem 1989, 53, 675–681. [Google Scholar]
- Hayashi, K.; Toko, K.; Yamafuji, K. Effect of taste substances on aperiodic oscillation of an electric potential in a synthetic lipid membrane. Jpn. J. Appl. Phys 1989, 28, 1507–1512. [Google Scholar]
- Hayashi, K.; Yamanaka, T.; Toko, K.; Yamafuji, K. Multichannel taste sensor using lipid membranes. Sens. Actuat. B 1990, 2, 205–213. [Google Scholar]
- Toko, K.; Yamanaka, T.; Hayashi, K.; Yamafuji, K. Multi-channel taste sensor with lipid membranes. Technical Digest of the 9th Sensor Symposium, Tokyo, Japan; 1990; pp. 193–196. [Google Scholar]
- Ikezaki, H.; Hayashi, K.; Yamanaka, M.; Tatsukawa, R.; Toko, K.; Yamafuji, K. Multichannel taste sensor with artificial lipid membrane. Trans. JEICE Jpn 1991, J74-C-II, 434–442. (in Japanese).. [Google Scholar]
- Ikezaki, H.; Toko, K.; Hayashi, K.; Toukubo, R.; Yamanaka, T.; Sato, K.; Yamafuji, K. Intelligent multi-channel taste sensor with lipid membranes. Proceedings of Technical Digest of the 10th Sensor Symposium, Tokyo, Japan, May 1991; pp. 173–176.
- Ikezaki, H.; Toko, K.; Hayashi, K.; Toukubo, R.; Sato, K.; Yamafuji, K. Taste sensing system with lipid membranes. Proceedings of Technical Digest of the 11th Sensor Symposium, Tokyo, Japan, June 4–5, 1992; pp. 221–224.
- Murata, T.; Hayashi, K.; Toko, K.; Ikezaki, H.; Sato, K.; Toukubo, R.; Yamafuji, K. Quantification of sourness and saltiness using a multichannel sensor with lipid membranes. Sens. Mater 1992, 4, 81–88. [Google Scholar]
- Toko, K.; Matsuno, T.; Yamafuji, K.; Hayashi, K.; Ikezaki, H.; Sato, K.; Toukubo, R.; Kawarai, S. Multichannel taste sensor using electrical potential changes in lipid membranes. Biosens. Bioelectron 1994, 9, 359–364. [Google Scholar]
- Hayashi, K.; Toko, K.; Yamanaka, M.; Yoshihara, H.; Yamafuji, K.; Ikezaki, H.; Toukubo, R.; Sato, K. Electric characteristics of lipid-modified monolayer membranes for taste sensor. Sens. Actuat. B 1995, 23, 55–61. [Google Scholar]
- Toko, K. Biomimetic Sensor Technology; Cambridge University Press: Cambridge, UK, 2000; pp. 113–180. [Google Scholar]
- Bartoshuk, L.M. Taste mixtures: is mixture suppression related to compression? Physiol. Behav 1975, 14, 643–649. [Google Scholar]
- Ninomiya, Y.; Funakoshi, M. Qualitative discrimination among umami and the four basic taste substances in mice. In Umami: A Basic Taste; Kawamura, Y., Kare, M.R., Eds.; Marcel Dekker: New York, NY, USA, 1987; pp. 365–385. [Google Scholar]
- Kawamura, Y.; Funakoshi, M.; Kasahara, Y.; Yamamoto, T. A neurophysiological study on astringent taste. Jpn. J. Physiol 1969, 19, 851–865. [Google Scholar]
- Schiffman, S.S.; Suggs, M.S.; Sostman, A.L.; Simon, S.A. Chorda tympani and lingual nerve responses to astringent compounds in rodents. Physiol. Behav 1992, 51, 55–63. [Google Scholar]
- Bajec, M.R.; Pickering, G.J. Astringency: mechanisms and perception. Crit. Rev. Food Sci. Nutr 2008, 48, 858–875. [Google Scholar]
- Singer, S.J.; Nicolson, G.L. The fluid mosaic model of the structure of cell membranes. Science 1972, 175, 720–731. [Google Scholar]
- Chandrashekar, J.; Hoon, M.A.; Ryba, N.J.; Zuker, C.S. The receptors and cells for mammalian taste. Nature 2006, 444, 288–294. [Google Scholar]
- Reed, D.; Nanthakumar, E.; North, M.; Bell, C.; Bartoshuk, L.; Price, R. Localization of a gene for bitter-taste perception to human chromosome 5p15. Am. J. Hum.Genet 1999, 64, 1478–1480. [Google Scholar]
- Chandrashekar, J.; Mueller, K.L.; Hoon, M.A.; Adler, E.; Feng, L.; Guo, W.; Zuker, C.S.; Ryba, N.J. T2Rs function as bitter taste receptors. Cell 2000, 100, 703–711. [Google Scholar]
- Ishimaru, Y.; Inada, H.; Kubota, M.; Zhuang, H.; Tominaga, M.; Matsunami, H. Transient receptor potential family members PKD1L3 and PKD2L1 form a candidate sour taste receptor. Proc. Natl. Acad. Sci. USA 2006, 103, 12569–12574. [Google Scholar]
- Ishii, S.; Misaka, T.; Kishi, M.; Kaga, T.; Ishimaru, Y.; Abe, K. Acetic acid activates PKD1L3–PKD2L1 channel—A candidate sour taste receptor. Biochem. Biophys. Res. Commun 2009, 385, 346–350. [Google Scholar]
- Kellenberger, S.; Schild, L. Epithelial sodium channel/degenerin family of ion channels: a variety of functions for a shared structure. Physiol. Rev 2002, 82, 735–767. [Google Scholar]
- Lyall, V.; Heck, G.L.; Vinnikova, A.K.; Ghosh, S.; Phan, T.H.; Alam, R.I.; Russell, O.F.; Malik, S.A.; Bigbee, J.W.; DeSimone, J.A. The mammalian amiloride-insensitive non-specific salt taste receptor is a vanilloid receptor-1 variant. J. Physiol 2004, 558, 147–159. [Google Scholar]
- Nakashima, K.; Ninomiya, Y. Increase in inositol 1,4,5-trisphosphate levels of the fungiform papilla in response to saccharin and bitter substances in mice. Cell Physiol. Biochem 1998, 8, 224–230. [Google Scholar]
- Nakashima, K.; Ninomiya, Y. Transduction for sweet taste of saccharin may involve both inositol 1,4,5-trisphosphate and cAMP pathways in the fungiform taste buds in C57BL mice. Cell Physiol. Biochem 1999, 9, 90–98. [Google Scholar]
- DeSimone, J.A.; Lyalla, V.; Hecka, G.L.; Feldman, G.M. Acid detection by taste receptor cells. Resp. Physiol 2001, 129, 231–245. [Google Scholar]
- Yan, W.; Sunavala, G.; Rosenzweig, S.; Dasso, M.; Brand, J.G.; Spielman, A.I. Bitter taste transduced by PLC-β2-dependent rise in IP3 and α-gustducin-dependent fall in cyclic nucleotides. Am. J. Physiol. Cell Physiol 2001, 280, C742–C751. [Google Scholar]
- Zhang, Y.; Hoon, M.A.; Chandrashekar, J.; Mueller, K.L.; Cook, B.; Wu, D.; Zuker, C.S.; Ryba, N.J. Coding of sweet, bitter, and umami tastes: different receptor cells sharing similar signaling pathways. Cell 2003, 112, 293–301. [Google Scholar]
- Kamo, N.; Miyake, M.; Kurihara, K.; Kobatake, Y. Physicochemical studies of taste reception. I. Model membrane simulating taste receptor potential in response to stimuli of salts, acids and distilled water. Biochim. Biophys. Acta 1974, 367, 1–10. [Google Scholar]
- Kamo, N.; Miyake, M.; Kurihara, K.; Kobatake, Y. Physicochemical studies of taste reception. II. Possible mechanism of generation of taste receptor potential induced by salt stimuli. Biochim. Biophys. Acta 1974, 367, 11–23. [Google Scholar]
- Ikezaki, H.; Taniguchi, A.; Toko, K. Quantification of taste of green tea with taste sensor. Trans. IEE of Japan 1997, 117-E, 465–470. (in Japanese).. [Google Scholar]
- Ikezaki, H.; Kobayashi, Y.; Toukubo, R.; Naito, Y.; Taniguchi, A.; Toko, K. Techniques to control sensitivity and selectivity of multichannel taste sensor using lipid membranes. Proceedings of the 10th International Conference on Solid-State Sensors and Actuators, Sendai, Japan, June 7–10, 1999; pp. 1634–1637.
- Ikezaki, H.; Naito, Y.; Kobayashi, Y.; Toukubo, R.; Taniguchi, A.; Toko, K. Improvement of selectivity of taste sensor by control of charge density and hydrophobicity of lipid membrane. Technical Report of IEICE. OME 2000, 100, 19–24. (in Japanese).. [Google Scholar]
- Kobayashi, Y.; Hamada, H.; Yamaguchi, Y.; Ikezaki, H.; Toko, K. Development of an artificial lipid-based membrane sensor with high selectivity and sensitivity to the bitterness of drugs and with high correlation with sensory score. IEEJ Trans 2009, 4, 710–719. [Google Scholar]
- Gouy, M. Sur la constitution de la charge électrique à la surface d'un électrolyte. J. Phys. Theor. Appl 1910, 9, 457–468. (in French).. [Google Scholar]
- Chapman, D.L. A contribution to the theory of electrocapillarity. Phil. Mag 1913, 25, 475–481. [Google Scholar]
- Payens, T.A.J. Ionized monolayers. Philips Res. Rep 1955, 10, 425–481. [Google Scholar]
- Tyäuble, H.; Teubner, M.; Woolley, P.; Eibl, H. Electrostatic interactions at charged lipid membranes. I. Effects of pH and univalent cations on membrane structure. Biophys. Chem 1976, 4, 319–342. [Google Scholar]
- Oohira, K.; Toko, K.; Akiyama, H.; Yoshihara, H.; Yamafuji, K. Electric characteristics of hybrid polymer membranes composed of two lipid species. J. Phys. Soc. Jpn 1995, 64, 3554–3561. [Google Scholar]
- Oohira, K.; Toko, K. Theory of electric characteristics of the lipid/PVC/DOPP membrane and PVC/DOPP membrane in response to taste stimuli. Biophys. Chem 1996, 61, 29–35. [Google Scholar]
- Hayashi, K.; Shimoda, H.; Matsufuji, S.; Toko, K. Adsorption of taste substances on lipid membranes of taste sensor. Trans. IEE of Japan 1999, 119, 374–382. (in Japanese).. [Google Scholar]
- Iiyama, S.; Kuga, H.; Ezaki, S.; Hayashi, K.; Toko, K. Peculiar change in membrane potential of taste sensor caused by umami substances. Sens. Actuat. B 2003, 91, 191–194. [Google Scholar]
- Kumazawa, T.; Kashiwayanagi, M.; Kurihara, K. Neuroblastoma cell as a model for a taste cell: mechanism of depolarization in response to various bitter substances. Brain Res 1985, 333, 27–33. [Google Scholar]
- Danielsson, L.G.; Zhang, Y.H. Methods for determining n-octanol-water partition constants. Trends Anal. Chem 1996, 15, 188–196. [Google Scholar]
- Donovan, S.F.; Pescatore, M.C. Method for measuring the logarithm of the octanol-water partition coefficient by using short octadecyl-poly (vinyl alcohol) high-performance liquid chromatography columns. J. Chromatogr. A 2002, 952, 47–61. [Google Scholar]
- Gulyaeva, N.; Zaslavsky, A.; Lechner, P.; Chait., A.; Zaslavsky, B. pH dependence of the relative hydrophobicity and lipophilicity of amino acids and peptides measured by aqueous two-phase and octanol-buffer partitioning. J. Pept. Res 2003, 61, 71–79. [Google Scholar]
- Gastl, M.; Hanke, S.; Back, W. Analytical investigations to evaluate bitter sensation using a taste sensing system. Brew. Sci 2007, 60, 48–54. [Google Scholar]
- Gastl, M.; Hanke, S.; Back, W. “Drinkability”—balance and harmony of components as well as an incentive for continuing to drink. In Brauwelt International; Fachverlag Hans Carl: Nürnberg, Germany, 2008; Volume 26, pp. 148–153. [Google Scholar]
- Okamoto, M.; Sunada, H.; Nakano, M.; Nishiyama, R. Bitterness evaluation of orally disintegrating famotidine tablets using a taste sensor. Asian J. Pharm. Sci 2009, 4, 1–7. [Google Scholar]
- Habara, M.; Chui, H.; Ikezaki, H.; Toko, K. Detecting sweetness with lipid/polymer membranes. Proceedings of International Symposium on Olfaction and Electronic Noses (ISOEN 2007), St. Petersburg, Russia, May 2007; pp. 101–102.
- Habara, M.; Beppu, D.; Cui, H.; Ikezaki, H.; Toko, K. Detecting of sugars using lipid/polymer membranes. Sens. Mater 2007, 19, 325–331. [Google Scholar]
- Cui, H.; Habara, M.; Ikezaki, H.; Toko, K. Study of surface-modified lipid/polymer membranes for detecting sweet taste substances. Proceedings of the 3rd International Conference on Sensing Technology, Tainan, Taiwan, November 30–December 3, 2008; pp. 610–614.
- Stone, H. Gustatory responses to the L-amino acids in man. In Olfaction and Taste II; Hayashi, T., Ed.; Pergamon Press: London, UK, 1967; pp. 289–306. [Google Scholar]
- Miura, S.; Sato, S.; Yoshida, M.; Kaneko, T.; Namba, S.; Kainosho, M. Taste and other sensations in mouth. In Sensory Evaluation Handbook; Ichikawa, K., Indow, T., Sato, S., Nonaka, T., Noro, K., Haga, T., Yoshikawa, S., Yoshida, M., Eds.; JUSE Press: Tokyo, Japan, 1973; pp. 156–175. (in Japanese). [Google Scholar]
- Pfaffmann, C. The sense of taste. In Handbook of Physiology, Neurophysiology; Field, J., Ed.; Williams & Wilkins: Baltimore, MD, USA, 1959; Volume 1, pp. 507–533. [Google Scholar]
- Beider, L.M. Part 2; Taste. In Handbook of Sensory Physiology IV: Chemical Senses; Beilder, L.M., Ed.; Springer-Verlag: Berlin, Germany, 1971; Volume 4, pp. 200–220. [Google Scholar]
- Schutz, H.G.; Pilgrim, F.J. Differential sensitivity in gustation. J. exp. Psychol 1957, 54, 41–48. [Google Scholar]
- Baldacci, S.; Matsuno, T.; Toko, K.; Stella, R.; Rossi, D.D. Discrimination of wine using taste and smell sensors. Sens. Mater 1998, 10, 185–200. [Google Scholar]
- Chen, R.; Ikezaki, H.; Hayashi, N.; Kohata, K.; Kugimiya, Y.; Kobayashi, K.; Taniguchi, A.; Toko, K. Study on evaluating jimi-taste of green tea using multichannel taste sensor. Proceedings of the International Conference O-CHA(tea) Culture and Science, Shizuoka, Japan, November 4–6, 2004; pp. 736–740.
- Hayashi, N.; Chen, R.; Ikezaki, H.; Yamaguchi, S.; Maruyama, D.; Yamaguchi, Y.; Ujihara, T.; Kohata, K. Techniques for universal evaluation of astringency of green tea infusion by the use of a taste sensor system. Biosci. Biotechnol. Biochem 2006, 70, 626–631. [Google Scholar]
- Hayashi, N.; Chen, R.; Ikezaki, H.; Ujihara, T. Evaluation of the umami taste intensity of green tea by a taste sensor. J. Agric. Food Chem 2008, 56, 7384–7387. [Google Scholar]
- Arikawa, Y.; Toko, K.; Ikezaki, H.; Shinha, Y.; Ito, T.; Oguri, I.; Baba, S. Analysis of sake taste using multielectrode taste sensor. Sens. Mater 1995, 7, 261–270. [Google Scholar]
- Arikawa, Y.; Toko, K.; Ikezaki, H.; Shinha, Y.; Ito, T.; Oguri, I.; Baba, S. Analysis of sake mash using multichannel taste sensor. J. Ferment. Bioeng 1996, 82, 371–376. [Google Scholar]
- Komai, H.; Naito, Y.; Sato, K.; Ikezaki, H.; Taniguchi, A.; Toko, K. Measurement of coffee taste using lipid membrane taste sensors. Proceedings of the ASIC 16th International Scientific Colloquium on Coffee, Kyoto, Japan, April 9–14, 1995; pp. 300–308.
- Fukunaga, T.; Toko, K.; Mori, S.; Nakabayashi, Y.; Kanda, M. Quantification of taste of coffee using sensor with global selectivity. Sens. Mater 1996, 8, 47–56. [Google Scholar]
- Imamura, T.; Toko, K.; Yanagisawa, S.; Kume, T. Monitoring of fermentation process of miso (soybean paste) using multichannel taste sensor. Sens. Actuat. B 1996, 37, 179–185. [Google Scholar]
- Yamada, H.; Mizota, Y.; Toko, K.; Doi, T. Highly sensitive discrimination of taste of milk with homogenization treatment using taste sensor. Mater. Sci. Eng 1997, C5, 41–45. [Google Scholar]
- Mizota, Y.; Matsui, H.; Ikeda, M.; Ichihashi, N.; Iwatsuki, K.; Toko, K. Flavor evaluation using taste sensor for UHT processed milk stored in cartons having different light permeabilities. Milchwissenschaft 2009, 64, 143–146. [Google Scholar]
- Iiyama, S.; Yahiro, M.; Toko, K. Measurements of soy sauce using taste sensor. Sens. Actuat. B 2000, 66, 205–206. [Google Scholar]
- Thi, U.T.; Suzuki, K.; Okadome, H.; Homma, S.; Ohtsubo, K. Analysis of the tastes of brown rice and milled rice with different milling yields using a taste sensing system. Food Chem 2004, 88, 557–566. [Google Scholar]
- Sasaki, K.; Tani, F.; Sato, K.; Ikezaki, H.; Taniguchi, A.; Emori, T.; Iwaki, F.; Chikuni, K.; Mitsumoto, M. Analysis of pork extracts by taste sensing system and the relationship between umami substances and sensor output. Sens. Mater 2005, 17, 349–356. [Google Scholar]
- Chen, R.; Kobayashi, Y.; Ikezaki, H.; Taniguchi, A.; Toko, K. Study of agricultural products using multichannel taste sensor with lipid/polymer membranes. Proceedings of the International Conference on Electrical Engineering, Sapporo, Japan, July 2004; pp. 1262–1265.
- Ueda, Y.; Yonemitsu, M.; Tsubuku, T.; Sakaguchi, M.; Miyajima, R. Flavor characteristics of glutathione in raw and cooked foodstuffs. Biosci. Biotech. Biochem 1997, 61, 1977–1980. [Google Scholar]
- Ikezaki, H. Taste Modification Technology of Food and Medicine; Toko, K., Uchida, T., Eds.; CMC publishing: Tokyo, Japan, 2007; pp. 131–141. (in Japanese). [Google Scholar]
- Ikezaki, H. Monthly Food Plant Manager; Japan Food Journal: Tokyo, Japan, 2009; pp. 78–81. (in Japanese). [Google Scholar]
- Japan Oil Chemist’s Society. The Handbook of Oil Chemistry-Lipids and Surfactants, 4th ed; Maruzen, Tokyo, Japan, 2001; pp. 602–626. (in Japanese). [Google Scholar]
- Uchida, T.; Miyanaga, Y.; Tanaka, H.; Wada, K.; Kurosaki, S.; Ohki, T.; Yoshida, M.; Matsuyama, K. Quantitative evaluation of the bitterness of commercial medicines using a taste sensor. Chem. Pharm. Bull 2000, 48, 1843–1845. [Google Scholar]
- Uchida, T.; Kobayashi, Y.; Miyanaga, Y.; Toukubo, R.; Ikezaki, H.; Taniguchi, A.; Matsuyama, K. A new method for evaluating the bitterness of medicines by semi-continuous measurement of adsorption using a taste sensor. Chem. Pharm. Bull 2001, 49, 1336–1339. [Google Scholar]
- Miyanaga, Y.; Tanigake, A.; Nakamura, T.; Kobayashi, Y.; Ikezaki, H.; Taniguchi, A.; Matsuyama, K.; Uchida, T. Prediction of the bitterness of single, binary- and multiple-component amino acid solutions using a taste sensor. Int. J. Pharm 2002, 248, 207–218. [Google Scholar]
- Tanigake, A.; Miyanaga, Y.; Nakamura, T.; Tsuji, E.; Matsuyama, K.; Kunitomo, M.; Uchida, T. The bitterness intensity of clarithromycin evaluated by a taste sensor. Chem. Pharm. Bull 2003, 51, 1241–1245. [Google Scholar]
- Uchida, T.; Tanigake, A.; Miyanaga, Y.; Matsuyama, K.; Kunitomo, M.; Kobayashi, Y.; Ikezaki, H.; Taniguchi, A. Evaluation of the bitterness of antibiotics using a taste sensor. J. Pharm. Pharmacol 2003, 55, 1479–1485. [Google Scholar]
- Mukai, J.; Miyanaga, Y.; Ishizaka, T.; Asaka, K.; Nakai, Y.; Tsuji, E.; Uchida, T. Quantitative taste evaluation of total enteral nutrients. Chem. Pharm. Bull 2004, 52, 1416–1421. [Google Scholar]
- Ishizaka, T.; Miyanaga, Y.; Mukai, J.; Asaka, K.; Nakai, Y.; Tsuji, E.; Uchida, T. Bitterness evaluation of medicines for pediatric use by a taste sensor. Chem. Pharm. Bull 2004, 52, 943–948. [Google Scholar]
- Kataoka, M.; Miyanaga, Y.; Tsuji, E.; Uchida, T. Evaluation of bottled nutritive drinks using a taste sensor. Int. J. Pharm 2004, 279, 107–114. [Google Scholar]
- Tachiki, H.; Uchiyama, H.; Okuda, Y.; Uchida, R.; Kobayashi, Y.; Uchida, T. Bitterness evaluation of famotidine orally disintegrating tablets using a taste sensor. Jpn. J. Med. Pharm. Sci 2005, 54, 321–327. (in Japanese).. [Google Scholar]
- Kataoka, M.; Tokuyama, E.; Miyanaga, Y.; Uchida, T. The taste sensory evaluation of medicinal plants and Chinese medicines. Int. J. Pharm 2008, 351, 36–44. [Google Scholar]
- Takagi, S.; Toko, K.; Wada, K.; Yamada, H.; Toyoshima, K. Detection of suppression of bitterness by sweet substance using a multichannel taste sensor. J. Pharma. Sci 2000, 87, 552–555. [Google Scholar]
- Takagi, S.; Toko, K.; Wada, K.; Ohki, T. Quantification of suppression of bitterness by phospholipids using taste sensor. J. Pharm. Sci 2001, 90, 2042–2048. [Google Scholar]
- Nakamura, T.; Tanigake, A.; Miyanaga, Y.; Ogawa, T.; Akiyoshi, T.; Matsuyama, K.; Uchida, T. The effect of various substances on the suppression of the bitterness of quinine–human gustatory sensation, binding, and taste sensor studies. Chem. Pharm. Bull 2002, 50, 1589–1593. [Google Scholar]
- Miyanaga, Y.; Kobayashi, Y.; Ikezaki, H.; Taniguchi, A.; Uchida, T. Bitterness prediction or bitterness suppression in human medicines using a taste sensor. Sens. Mater 2002, 14, 455–465. [Google Scholar]
- Miyanaga, Y.; Inoue, N.; Ohnishi, A.; Fujisawa, E.; Yamaguchi, M.; Uchida, T. Quantitative prediction of the bitterness suppression of elemental diets by various flavors using a taste sensor. Pharm. Res 2003, 20, 1932–1938. [Google Scholar]
- Ogawa, T.; Nakamura, T.; Tsuji, E.; Miyanaga, Y.; Nakagawa, H.; Hirabayashi, H.; Uchida, T. The combination effect of L-arginine and NaCl on bitterness suppression of amino acid solutions. Chem. Pharm. Bull 2004, 52, 172–177. [Google Scholar]
- Miyanaga, Y.; Mukai, J.; Mukai, T.; Odomi, M.; Uchida, T. Suppression of the bitterness of enteral nutrients using increased particle sizes of branched-chain amino acids (BCAAs) and various flavours: a taste sensor study. Chem. Pharm. Bull 2004, 52, 490–493. [Google Scholar]
- Tsuji, E.; Uchida, T.; Fukui, A.; Fujii, R.; Sunada, H. Evaluation of bitterness suppression of macrolide dry syrups by jellies. Chem. Pharm. Bull 2006, 54, 310–314. [Google Scholar]
- Tokuyama, E.; Shibasaki, T.; Kawabe, H.; Mukai, J.; Okada, S.; Uchida, T. Bitterness suppression of BCAA solutions by L-ornithine. Chem. Pharm. Bull 2006, 54, 1288–1292. [Google Scholar]
- Hashimoto, Y.; Matsunaga, C.; Tokuyama, E.; Tsuji, E.; Uchida, T.; Okada, H. The quantitative prediction of bitterness-suppressing effect of sweeteners on the bitterness of famotidine by sweetness-responsive sensor. Chem. Pharm. Bull 2007, 55, 739–746. [Google Scholar]
- Ishizaka, T.; Okada, S.; Takemoto, E.; Tokuyama, E.; Tsuji, E.; Mukai, J.; Uchida, T. The suppression of enhanced bitterness intensity of macrolide dry syrup mixed with an acidic powder. Chem. Pharm. Bull 2007, 55, 1452–1457. [Google Scholar]
- Woertz, K.; Tissen, C.; Kleinebudde, P.; Breitkreutz, J. Performance qualification of an electronic tongue based on ICH guideline Q2. J. Pharm. Biomat. Anal. 2010, 51, 497–506. [Google Scholar]
- ICH Expert Working Group. Validation of analytical procedures: text and methodology Q2(R1). Proceedings of the International Conference on Harmonisation of Technical Requirements for Registration of Pharmaceuticals for Human Use, Geneva, Switzerland, April 25–27, 2005; Available online: http://www.ich.org/LOB/media/MEDIA417.pdf (accessed on 15 January 2010).
- Uekama, K. Design and evaluation of cyclodextrin-based drug formulation. Chem. Pharm. Bull 2004, 52, 900–915. [Google Scholar]
- Katsuragi, Y.; Sugiura, Y.; Cao, L.; Otsuji, K.; Kurihara, K. Selective inhibition of bitter taste of various drugs by lipoprotein. Pharmaceut. Res 1995, 12, 658–662. [Google Scholar]
- Etoh, S.; Iwakura, M.; Nakashi, K.; Hattori, R.; Hayashi, R.; Toko, K. Fabrication of taste sensor chip and portable taste sensor system. Proceedings of the International Conference on Microtechnologies in Medicine and Biology, Okinawa, Japan, May 9–12, 2006; pp. 180–183.
- Etoh, S.; Feng, L.; Nakashi, K.; Hayashi, K.; Ishii, A.; Toko, K. Taste sensor chip for portable taste sensor system. Sens. Mater 2008, 20, 151–160. [Google Scholar]


| Taste quality | Adsorption ability | Taste threshold |
|---|---|---|
| Saltiness | None | High |
| Sourness | None | Low |
| Umami | Low | Medium |
| Bitterness | High | Low |
| Taste sensor | Artificial lipid | Plasticizer |
|---|---|---|
| Umami sensor AAE | Phosphoric acid di(2-ethylhexyl) ester Trioctylmetylammonium chloride | Dioctyl phenylphosphonate |
| Saltiness sensor CT0 | Tetradodecylammonium bromide 1-Hexadecanol | Dioctyl phenylphosphonate |
| Sourness sensor CA0 | Phosphoric acid di(2-ethylhexyl) ester Oleic acid Trioctylmetylammomium chloride | Dioctyl phenylphosphonate |
| Bitterness sensor C00 (for acidic bitter materials) | Tetradodecylammonium bromide | 2-Nitrophenyl octyl ether |
| Astringency sensor AE1 | Tetradodecylammonium bromide | Dioctyl phenylphosphonate |
| Bitterness sensor BT0 (for bitter hydrochloride salts) | Phosphoric acid di-n-decyl ester | Bis(1-butylpentyl) adipate Tributyl O-acetylcitrate |
| Bitterness sensor AN0 (for basic bitter materials) | Phosphoric acid di-n-decyl ester | Dioctyl phenylphosphonate |
| Sweetness sensor GL0 (prototype) | Tetradodecylammonium bromide Gallic acid | Dioctyl phenylphosphonate |
| Taste sensor | Taste information from relative value | Taste information from CPA value | Standard sample for calculating conversion factor |
|---|---|---|---|
| Umami sensor AAE | Umami | Richness | 10 mM monosodium glutamate |
| Saltiness sensor CT0 | Saltiness | (none) | 270 mM potassium chloride |
| Sourness sensor CA0 | Sourness | (none) | 2.7 mM tartaric acid |
| Bitterness sensor C00 | Acidic bitterness | Aftertaste from acidic bitterness | 0. 01 vol% iso-alpha acid |
| Astringency sensor AE1 | Astringency | Aftertaste from astringency | 0.05% tannic acid |
| Bitterness sensor BT0 | (none) | Aftertaste from hydrochloride salts | 0.1 mM quinine hydrochloride |
| Bitterness sensor AN0 | (none) | Aftertaste from basic bitterness | 0.1 mM quinine hydrochloride |
| Sweetness sensor GL0 | Sweetness | (none) | 1 M sucrose |
© 2010 by the authors; licensee Molecular Diversity Preservation International, Basel, Switzerland. This article is an open-access article distributed under the terms and conditions of the Creative Commons Attribution license ( http://creativecommons.org/licenses/by/3.0/).
Share and Cite
Kobayashi, Y.; Habara, M.; Ikezazki, H.; Chen, R.; Naito, Y.; Toko, K. Advanced Taste Sensors Based on Artificial Lipids with Global Selectivity to Basic Taste Qualities and High Correlation to Sensory Scores. Sensors 2010, 10, 3411-3443. https://doi.org/10.3390/s100403411
Kobayashi Y, Habara M, Ikezazki H, Chen R, Naito Y, Toko K. Advanced Taste Sensors Based on Artificial Lipids with Global Selectivity to Basic Taste Qualities and High Correlation to Sensory Scores. Sensors. 2010; 10(4):3411-3443. https://doi.org/10.3390/s100403411
Chicago/Turabian StyleKobayashi, Yoshikazu, Masaaki Habara, Hidekazu Ikezazki, Ronggang Chen, Yoshinobu Naito, and Kiyoshi Toko. 2010. "Advanced Taste Sensors Based on Artificial Lipids with Global Selectivity to Basic Taste Qualities and High Correlation to Sensory Scores" Sensors 10, no. 4: 3411-3443. https://doi.org/10.3390/s100403411