Structures and Encapsulation Motifs of Functional Molecules Probed by Laser Spectroscopic and Theoretical Methods

Abstract
:
1. Introduction
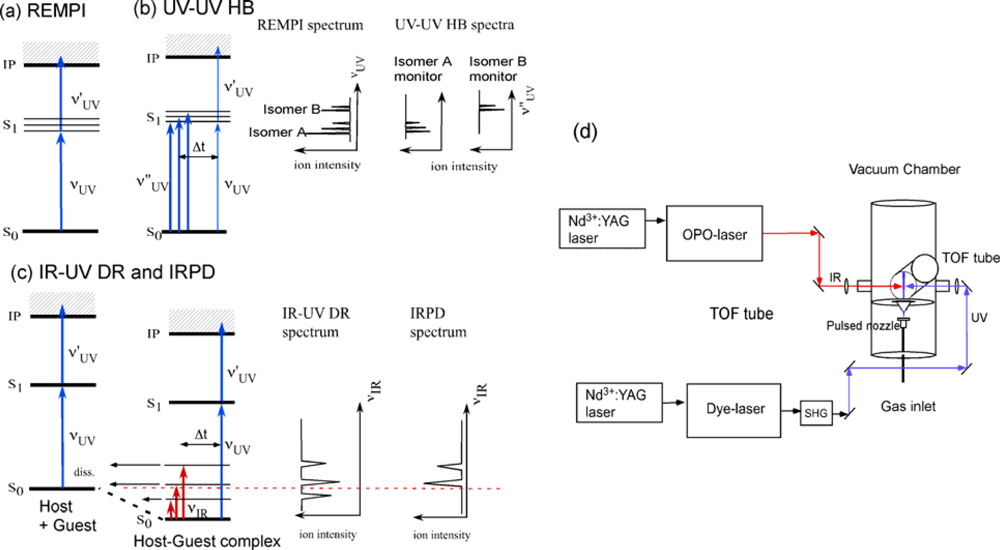
2. Approach
3. Results and Discussion
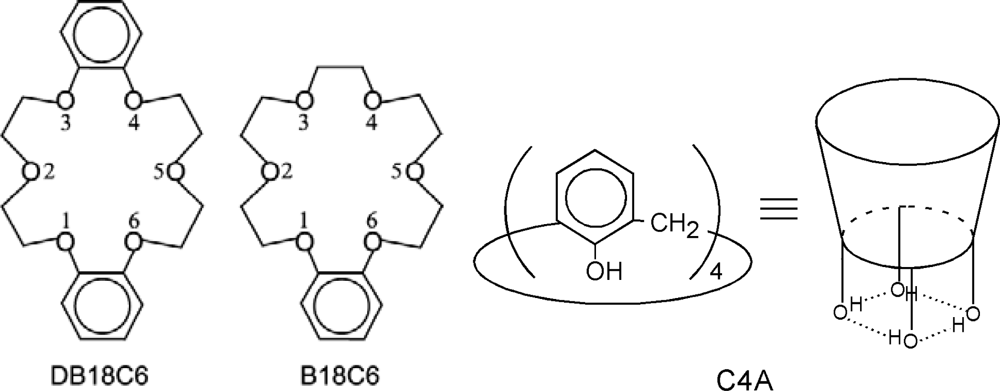
3.1. Dibenzo-18-Crown-6-Ether (DB18C6)
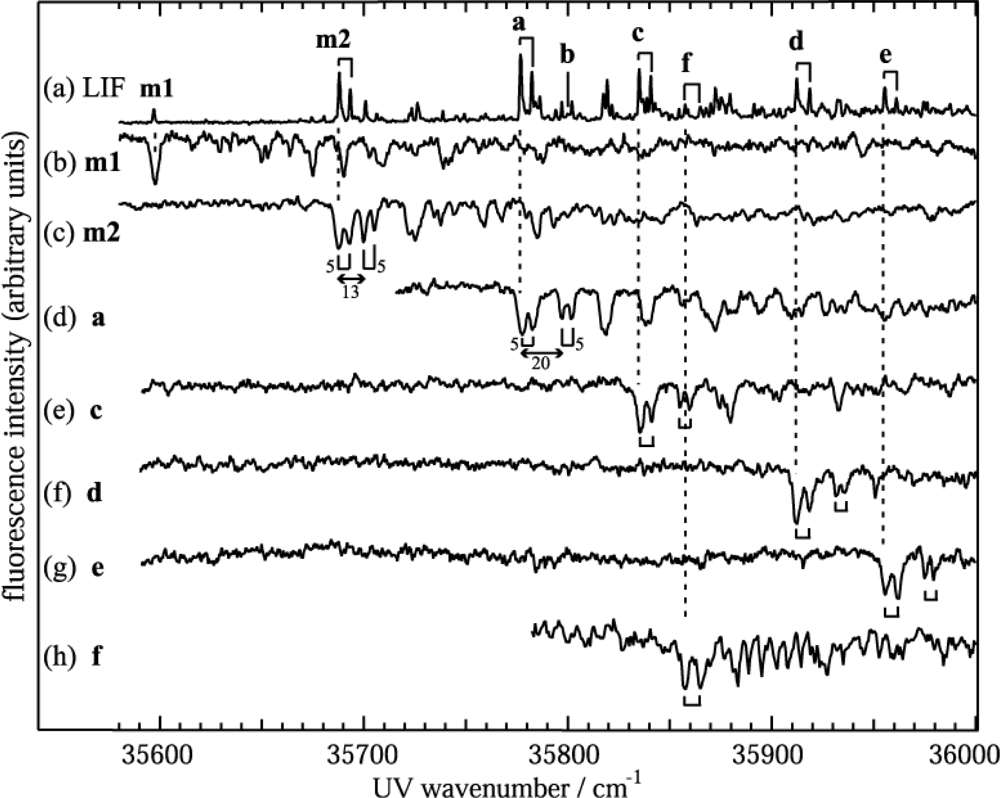
3.1.1. Electronic Spectra of Jet Cooled DB18C6 and DB18C6-(H2O)n
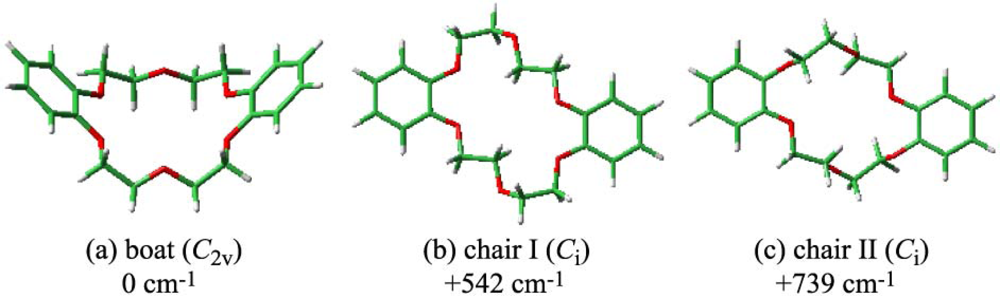
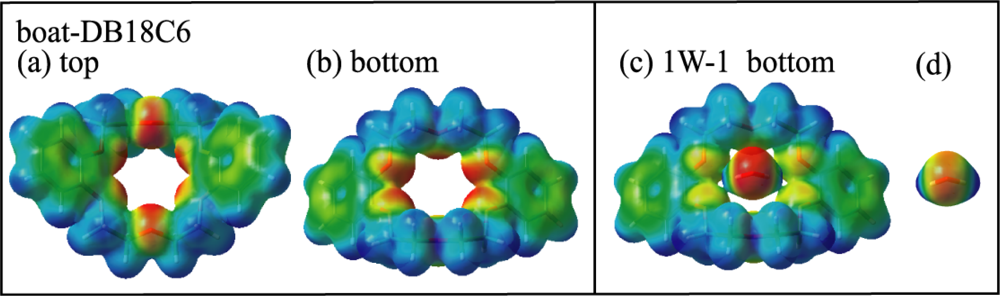
3.1.2. Conformation of DB18C6
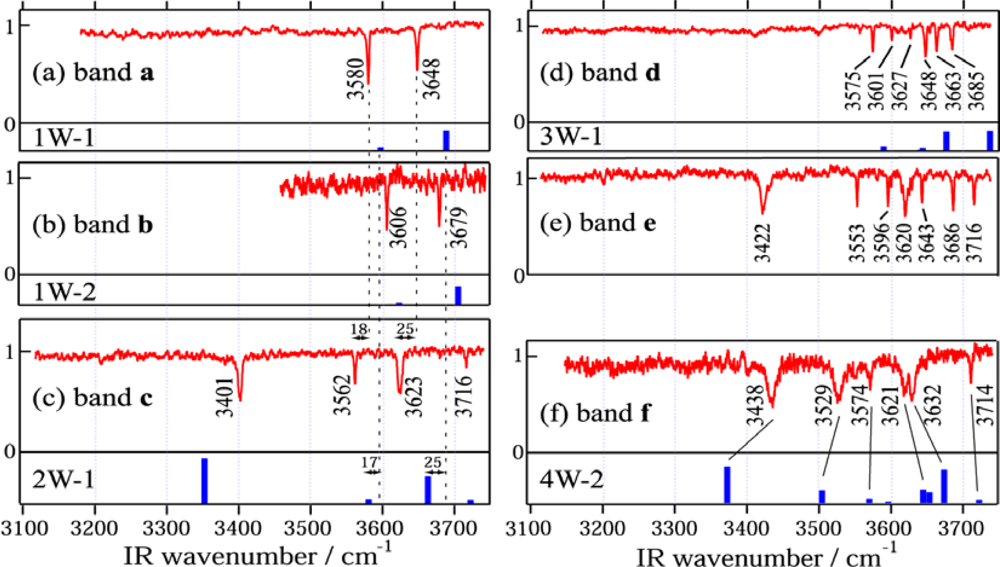
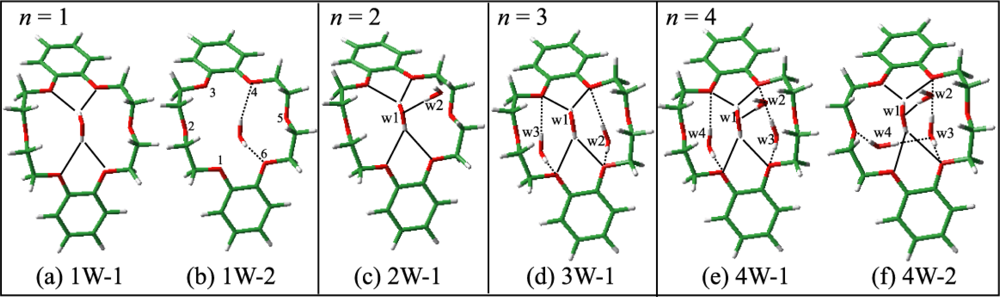
3.1.3. Hydrated Complexes of DB18C6
3.1.3.1. DB18C6-(H2O)1
3.1.3.2. DB18C6-(H2O)2
3.1.3.3. DB18C6-(H2O)3
3.1.3.4. DB18C6-(H2O)4
3.2. Benzo-18-Crown-6-Ether (B18C6)
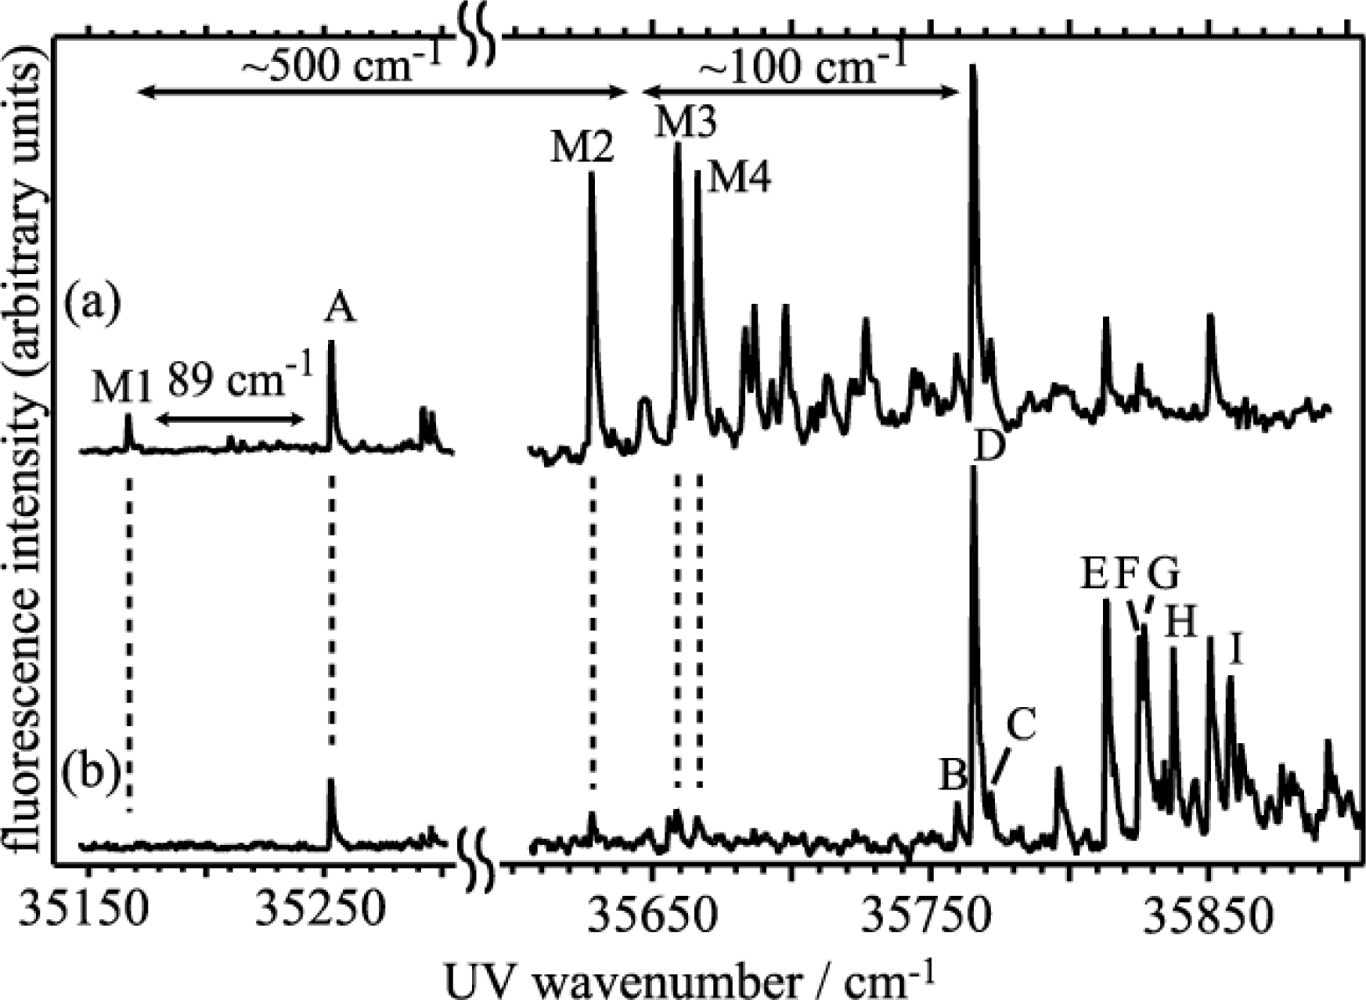
3.2.1. Electronic Spectra of B18C6 and B18C6-(H2O)n
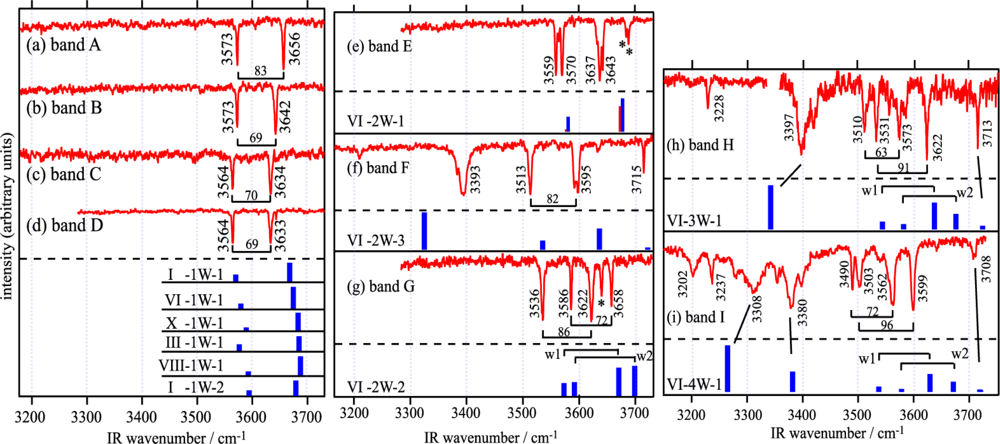
3.2.2. IR Spectra in the OH Stretching Region and the H-Bonded Network
3.2.3. Conformation of B18C6
3.2.4. Structure of B18C6-(H2O)1
3.2.5. Structures of B18C6-(H2O)2–4
3.3. Calix[4]arene (C4A)
3.3.1. Electronic Spectra of C4A and C4A 6-(H2O)1
3.3.2. IR-UV DR and IRPD Spectra
3.3.3. Structure of C4A-(H2O)1
4. Conclusions
Acknowledgments
References and Notes
- Gokel, G.W. Crown Ethers and Cryptands; Royal Society of Chemistry: Cambridge, UK, 1991. [Google Scholar]
- Dobler, M. Ionophores and their Structures; Wiley-Interscience: New York, NY, USA, 1981. [Google Scholar]
- Gutsche, C.D. “Calixarenes”. In Monographs in Supramolecular Chemistry; Stoddart, J.F., Ed.; Royal Society of Chemistry: Cambridge, UK, 1989. [Google Scholar]
- Cram, D.J.; Cram, J.M. “Container molecules and their guests”. In Monographss in Supramolecular Chemistry; Stoddart, J.F., Ed.; Royal Society of Chemistry: Cambridge, UK, 1994. [Google Scholar]
- Gutsche, C.D. “Calixarenes revisited”. In Monographs in Supramolecular Chemistry; Stoddart, J.F., Ed.; Royal Society of Chemistry: Cambridge, UK, 1998. [Google Scholar]
- Stuart, A.M.; Vidal, J.A. Perfluoroalkylated 4,13-diaza-18-crown-6 ethers: synthesis, phase-transfer catalysis, and recycling studies. J. Org. Chem 2007, 72, 3735–3740. [Google Scholar]
- Chekholov, A.N. (18-crown-6)potassium tris(thiocyanato)nickelate(II): Synthesis and crystal structure. Russ. J. Coord. Chem 2008, 34, 434–437. [Google Scholar]
- Atwood, J.L.; Koutsoantonis, G.A.; Raston, C.L. Purification of C60 and C70 by selective complexation with calixarenes. Nature 1994, 368, 229. [Google Scholar]
- Suzuki, T.; Nakashima, K.; Shinkai, S. Very Convenient and efficient purification method for fullerene (C60) with 5,11,17,23,29,35,41,47-Octa-tert-butylcalix[8]arene-49,50,51,52,53,54,55,56-octol. Chem. Lett 1994, 23, 699. [Google Scholar]
- Izatt, R.M.; Rytting, J.H.; Nelson, D.P.; Haymore, B.L.; Christensen, J.J. Binding of alkali metal ions by cyclic polyethers: significance in ion transport processes. Science 1969, 164, 443. [Google Scholar]
- Izatt, R.M.; Nelson, D.P.; Rytting, J.H.; Haymore, B.L.; Christensen, J.J. Calorimetric study of the interaction in aqueous solution of several uni- and bivalent metal ions with the cyclic polyether dicyclohexyl-18-crown-6 at 10,25, and 40.deg. J. Am. Chem. Soc 1971, 93, 1619. [Google Scholar]
- Izatt, R.M.; Terry, R.E.; Haymore, B.L.; Hansen, L.D.; Dalley, N.K.; Avondet, A.G.; Christensen, J.J. Calorimetric titration study of the interaction of several uni- and bivalent cations with 15-crown-5, 18-crown-6, and two isomers of dicyclohexo-18-crown-6 in aqueous solution at 25.degree.C and .mu. = 0.1. J. Am. Chem. Soc 1976, 98, 7620. [Google Scholar]
- Izatt, R.M.; Terry, R.E.; Nelson, D.P.; Chan, Y.; Eatough, D.J.; Bradshaw, J.S.; Hansen, L.D.; Christensen, J.J. Calorimetric titration study of the interaction of some uni- and bivalent cations with benzo-15-crown-5, 18-crown-6, dibenzo-24-crown-8, and dibenzo-27-crown-9 in methanol-water solvents, at 25.degree.C and .mu. = 0.1. J. Am. Chem. Soc 1976, 98, 7626. [Google Scholar]
- Lamb, J.D.; Izatt, R.M.; Swain, C.S.; Christensen, J.J. A systematic study of the effect of macrocycle ring size and donor atom type on the log K, .DELTA.H, and T.DELTA.S of reactions at 25.degree.C in methanol of mono- and divalent cations with crown ethers. J. Am. Chem. Soc. 1980, 102, 475. [Google Scholar]
- Pedersen, C.J.; Frensdorff, H.K. Macrocyclic polyethers and their complexes. Angew. Chem. Int. Ed 1972, 11, 16. [Google Scholar]
- Glendening, E.D.; Feller, D.; Thompson, M.A. An Ab Initio Investigation of the Structure and Alkali Metal Cation Selectivity of 18-Crown-6. J. Am. Chem. Soc 1994, 116, 10657. [Google Scholar]
- More, M.B.; Ray, D.; Armentrout, P.D. Intrinsic affinities of alkali cations for 15-crown-5 and 18-crown-6: bond dissociation energies of gas-phase M+−crown ether complexes. J. Am. Chem. Soc 1999, 121, 417–423. [Google Scholar]
- Hill, S.E.; Feller, D. Theoretical study of cation/ether complexes: 15-crown-5 and its alkali metal complexes. Int. J. Mass Spectrom 2000, 201, 41. [Google Scholar]
- Peiris, D.M.; Yang, Y.; Ramanathan, R.; Williams, K.R.; Watson, C.; Eyler, J.R. Infrared multiphoton dissociation of electrosprayed crown ether complexes. Int. J. Mass Spectrom. Ion Process 1996, 157/158, 365. [Google Scholar]
- Anderson, J.D.; Paulsen, E.S.; Dearden, D. Alkali metal binding energies of dibenzo-18-crown-6: experimental and computational results. Int. J. Mass Spectrom 2003, 227, 63. [Google Scholar]
- Armentrout, P.B. Cation–ether complexes in the gas phase: thermodynamic insight into molecular recognition. Int. J. Mass Spectrom 1999, 193, 227. [Google Scholar]
- Feller, D. Ab Initio Study of M+:18-Crown-6 Microsolvation. J. Phys. Chem. A 1997, 101, 2723–2731. [Google Scholar]
- Rodriguez, J.D.; Lisy, J.M. Infrared spectroscopy of gas-phase hydrated K+:18-crown-6 complexes: Evidence for high energy conformer trapping using the argon tagging method. Int. J. Mass. spectrom 2009, 283, 135–139. [Google Scholar]
- Rodriguez, J.D.; Lisy, J.M. Infrared spectroscopy of multiply charged metal ions: methanol-solvated divalent manganese 18-crown-6 ether systems. J. Phys. Chem. A 2009, 113, 6462–6467. [Google Scholar]
- Rodriguez, J.D.; Vaden, T.D.; Lisy, J.M. Infrared spectroscopy of ionophore-model systems: hydrated alkali metal ion 18-crown-6 ether complexes. J. Am. Chem. Soc 2009, 131, 17277–17285. [Google Scholar]
- Shubert, V.A.; Zwier, T.S. IR-IR-UV Hole-burning: conformation specific IR spectra in the face of UV spectral overlap. J. Phys. Chem. A 2007, 111, 13283–13286. [Google Scholar]
- Shubert, V.A.; James, W.H., III; Zwier, T.S. jet-cooled electronic and vibrational spectroscopy of crown ethers: benzo-15-crown-5 ether and 4′ -amino-benzo-15-crown-5 ether. J. Phys. Chem. A 2009, 113, 8055–8066. [Google Scholar]
- Shubert, V.A.; Müller, C.W.; Zwier, T.S. Water’s role in reshaping a macrocycle’s binding pocket: infrared and ultraviolet spectroscopy of Benzo-15-crown-5-(H2O)n and 4′-aminobenzo-15-crown-5-(H2O)n, n = 1, 2. J. Phys. Chem. A 2009, 113, 8067–8079. [Google Scholar]
- Kusaka, R.; Inokuchi, Y.; Ebata, T. Laser spectroscopic study on the conformations and the hydrated structures of benzo-18-crown-6-ether and dibenzo-18-crown-6-ether in supersonic jets. Phys. Chem. Chem. Phys 2007, 9, 4452–4459. [Google Scholar]
- Kusaka, R.; Inokuchi, Y.; Ebata, T. Structure of hydrated clusters of dibenzo-18-crown-6-ether in a supersonic jet—encapsulation of water molecules in the crown cavity. Phys. Chem. Chem. Phys 2008, 10, 6238–6244. [Google Scholar]
- Kusaka, R.; Inokuchi, Y.; Ebata, T. Water-mediated conformer optimization in benzo-18-crown-6-ether/water system. Phys. Chem. Chem. Phys 2009, 11, 9132–9140. [Google Scholar]
- Ebata, T.; Hodono, Y.; Ito, T.; Inokuchi, Y. Electronic spectra of jet-cooled calix[4]arene and its van der Waals clusters: Encapsulation of a neutral atom in a molecular bowl. J. Chem. Phys 2007, 126, 141101. [Google Scholar]
- Hontama, N.; Inokuchi, Y.; Ebata, T.; Dedonder-Lardeux, C.; Jouvet, C.; Xantheas, S.S. Structure of the Calix[4]arene-(H2O) cluster: The world’s smallest cup of water. J. Phys. Chem. A 2010, 114, 2967. [Google Scholar]
- Ebata, T. Study on the structure and vibrational dynamics of functional molecules and molecular clusters by double resonance vibrational spectroscopy. Bull. Chem. Soc. Jpn 2009, 82, 127. [Google Scholar]
- Frisch, M.J.; Trucks, G.W.; Schlegel, H.B.; Scuseria, G.E.; Robb, M.A.; Cheesman, J.R.; Montgomery, J.A., Jr.; Vreven, T.; Kudin, K.N.; Burant, J.C.; Millam, J.M.; Iyengar, S.S.; Tomasi, J.; Barone, V.; Munnucci, B.; Cossi, M.; Scalmani, G.; Rega, N.; Petersson, G.A.; Nakatsuji, H.; Hada, M.; Ehara, M.; Toyota, K.; Fukuda, R.; Hasegawa, J.; Ishida, M.; Nakajima, T.; Honda, Y.; Kitao, O.; Nakai, H.; Klene, M.; Li, X.; Knox, J.E.; Hratchian, H.P.; Cross, J.B.; Bakken, V.; Asamo, C.; Jaramillo, J.; Gomperts, R.; Stratmann, R.E.; Yazyev, O.; Ausitin, A.J.; Cammi, R.; Pomelli, C.; Ochterski, J.W.; Ayala, P.Y.; Morokuma, K.; Voth, G.A.; Salvador, P.; Dannenberg, J.J.; Zakrzewski, V.G.; Dapprich, S.; Daniels, A.D.; Strain, M.C.; Farkas, O.; Malick, D.K.; Rabuck, A.D.; Raghavachari, K.; Foresman, J.B.; Ortiz, J.V.; Cui, Q.; Baboul, A.G.; Clifford, S.; Cioslowski, J.; Stefanov, B.B.; Liu, G.; Liashenko, A.; Piskorz, P.; Komaromi, I.; Martin, R.L.; Fox, D.J.; Keith, T.; Al-Laham, M.A.; Peng, C.Y.; Nanayakkara, A.; Challacombe, M.; Gill, P.M. W.; Johnson, B.; Chen, W.; Wong, M.W.; Conzalez, C.; Pople, J.A. Gaussian 03; Revision D.02,; Gaussian, Inc: Wallingford, CT, USA, 2004. [Google Scholar]
- Møller, C.; Plesset, M.S. Note on an approximation treatment for many-electron systems. Phys. Rev 1934, 46, 618. [Google Scholar]
- Dunning, T.H., Jr. Gaussian basis sets for use in correlated molecular calculations. I. The atoms boron through neon and hydrogen. J. Chem. Phys 1989, 90, 1007. [Google Scholar]
- Kendall, R.A.; Dunning, T.H., Jr.; Harrison, R.J. Electron affinities of the first-row atoms revisited. Systematic basis sets and wave functions. J. Chem. Phys 1992, 96, 6796. [Google Scholar]
- Kendall, R.A.; Aprà, E.; Bernholdt, D.E.; Bylaska, E.J.; Dupuis, M.; Fann, G.I.; Harrison, R.J.; Ju, J.; Nichols, J.A.; Nieplocha, J.; Straatsma, T.P.; Windus, T.L.; Wong, A.T. High performance computational chemistry: An overview of NWChem a distributed parallel application. Comp. Phys. Comm 2000, 128, 260–283, High Performance Computational Chemistry Group (2003) NWChem, A Computational Chemistry Package for Parallel Computers, Version 4.6. Pacific Northwest National Laboratory: Richland, WA, 99352, USA.. [Google Scholar]
- Hehre, W.J.; Ditchfield, R.; Pople, J.A. Self—consistent molecular orbital methods. XII. further extensions of gaussian—type basis sets for use in molecular orbital studies of organic molecules. J. Chem. Phys 1972, 56, 2257. [Google Scholar]
- Boys, S.F.; Bernardi, F. The calculation of small molecular interactions by the differences of separate total energies. Some procedures with reduced errors. Mol. Phys 1970, 19, 553. [Google Scholar]
- Xantheas, S.S. On the importance of the fragment relaxation energy terms in the estimation of the basis set superposition error correction to the intermolecular interaction energy. J. Chem. Phys 1996, 104, 8821. [Google Scholar]
- Bright, D.; Truter, M.R. Crystal structures of complexes between alkali-metal salts and cyclic polyethers. Part I. Complex formed between rubidium sodium isothiocyanate and 2,3,11,12-dibenzo-1,4,7,10,13,16-hexaoxocyclo-octadeca-2,11-diene (‘dibenzo-18-crown-6’). J. Chem. Soc. B 1970, 8, 1544. [Google Scholar]
- Müller, A.; Talbot, F.; Leutwyler, S. S1/S2 exciton splitting in the (2-pyridone)2 dimer. J. Chem. Phys 2002, 116, 2836. [Google Scholar]
- Wessel, J.E.; Syage, J.A. Excitonic interactions in naphthalene clusters. J. Phys. Chem 1990, 94, 737. [Google Scholar]
- Herzberg, G. Molecular Spectra And Molecular Structure Volume II. Infrared and Raman Spectra of Polyatomic Molecules; Van Nostrand Reinhold Company: New York, NY, USA, 1945. [Google Scholar]
- Yi, J.Y.; Ribblett, J.W.; Pratt, D.W. Rotationally resolved electronic spectra of 1,2-dimethoxybenzene and the 1,2-dimethoxybenzene−water complex. J. Phys. Chem. A 2005, 109, 9456–9464. [Google Scholar]
- Bühl, M.; Wipff, G. Hydronium Ion complex of 18-crown-6: where are the protons? a density functional study of static and dynamic properties. J. Am. Chem. Soc 2002, 124, 4473–4480. [Google Scholar]
- Goutev, N.; Matsuura, H. Hydrogen Bonding in Chloroform Solutions of Ethylenedioxy Ethers. Spectroscopic Evidence of Bifurcated Hydrogen Bonds. J. Phys. Chem. A 2001, 105, 4741–4748. [Google Scholar]
- Hang, Z.S.; Miller, R.E. High-resolution near-infrared spectroscopy of water dimer. J. Chem. Phys 1989, 91, 6613. [Google Scholar]
- Fukuhara, K.; Tachikake, M.; Matsumoto, S.; Matsuura, H. Raman spectroscopic study of the hydrates of 18-crown-6. J. Phys. Chem 1995, 99, 8617–8623. [Google Scholar]
- Ebata, T.; Nagao, K.; Mikami, N. Mode-dependent anharmonic coupling between OH stretching and intermolecular vibrations of the hydrogen-bonded clusters of phenol. Chem. Phys 1998, 231, 199–204. [Google Scholar]
- Nibu, Y.; Marui, R.; Shimada, H. Infrared spectroscopy of hydrogen-bonded 2-fluoropyridine−water clusters in supersonic jets. J. Phys. Chem. A 2006, 110, 9627–9632. [Google Scholar]
- Ebata, T.; Hontama, N.; Inokuchi, Y.; Haino, T.; Xantheas, S.S. Encapsulation of Arn complexes by calix[4]arene: endo- vs. exo-complexes. Phys. Chem. Chem. Phys. in press..
- Xantheas, S.S. Cooperativity and hydrogen bonding network in water clusters. Chem. Phys 2000, 258, 225. [Google Scholar]
- Pribble, R.N.; Zwier, T.S. Size-specific infrared spectra of benzene-(H2O)n clusters (n = 1 through 7): evidence for noncyclic (H2O)n Structures. Science 1994, 265, 75–79. [Google Scholar]


| Position / cm−1 | Label | Size | Assignment |
|---|---|---|---|
| 35,597 | m1 | DB18C6 | Chair-I |
| 35,688 | m2 | Boat | |
| 35,777 | a | DB18C6-(H2O)1 | 1W-1 |
| 35,800 | b | 1W-2 | |
| 35,835 | c | DB18C6-(H2O)2 | 2W-1 |
| 35,858 | f | DB18C6-(H2O)4 | 4W-2 |
| 35,912 | d | DB18C6-(H2O)3 | 3W-1 |
| 35,955 | e | DB18C6-(H2O)4 | 4W-1 |
| Transition energy / cm−1 | Oscillator strength
| |||||
|---|---|---|---|---|---|---|
| Obs.
| Calc.
| Calc.
| ||||
| S1-S0 | S2-S0 | S1-S0 | S2-S0 | S1-S0 | S2-S0 | |
| Boat (C2v) | 35,688 | 35,693 | 39,640 | 39,722 | 0.0928 | 0.0347 |
| Chair I (Ci) | 35,597 | 39,608 | 39,688 | 0.1382 | 0 | |
| Chair II (Ci) | 40,133 | 40,145 | 0.0963 | 0 | ||
| Position / cm−1 | Label | Size | Assignment |
|---|---|---|---|
| 35,167 | M1 | B18C6 | VIII |
| 35,628 | M2 | III | |
| 35,659 | M3 | I or VI | |
| 35,666 | M4 | I or VI | |
| 35,253 | A | DB18C6-(H2O)1 | VIII-1W-1 |
| 35,758 | B | III-1W-1 | |
| 35,771 | C | VI-1W-1 or X-1W-1 | |
| 35,766 | D | VI-1W-1 or X-1W-1 | |
| 35,813 | E | DB18C6-(H2O)2 | VI-2W-1 |
| 35,825 | F | VI-2W-3 | |
| 35,827 | G | VI-2W-2 | |
| 35,837 | H | DB18C6-(H2O)3 | VI-3W-1 |
| 35,858 | I | DB18C6-(H2O)4 | VI-4W-1 |
| Level of theory | Endo-form ΔEendo / cm−1 | Erelax / cm−1 | Exo-form ΔEexo, cm−1 | Erelax / cm−1 | ΔΔE / cm−1 |
|---|---|---|---|---|---|
| MP2/aug-cc-pVDZ | 4,312 (2,455) | 121 / 11 | 2,561 (1,349) | 2,009 / 57 | 1,751 (1,106) |
| MP2/aug-cc-pVTZ | 3,602 (2,789) | 81 / 34 | 2,228 (1,687) | 2,004 / 86 | 1,374 (1,102) |
| MP2/aug-cc-pVQZ | 3,127 | 1,985 | 1,142 |
© 2010 by the authors; licensee Molecular Diversity Preservation International, Basel, Switzerland. This article is an open-access article distributed under the terms and conditions of the Creative Commons Attribution license ( http://creativecommons.org/licenses/by/3.0/).
Share and Cite
Kusaka, R.; Inokuchi, Y.; Xantheas, S.S.; Ebata, T. Structures and Encapsulation Motifs of Functional Molecules Probed by Laser Spectroscopic and Theoretical Methods. Sensors 2010, 10, 3519-3548. https://doi.org/10.3390/s100403519
Kusaka R, Inokuchi Y, Xantheas SS, Ebata T. Structures and Encapsulation Motifs of Functional Molecules Probed by Laser Spectroscopic and Theoretical Methods. Sensors. 2010; 10(4):3519-3548. https://doi.org/10.3390/s100403519
Chicago/Turabian StyleKusaka, Ryoji, Yoshiya Inokuchi, Sotiris S. Xantheas, and Takayuki Ebata. 2010. "Structures and Encapsulation Motifs of Functional Molecules Probed by Laser Spectroscopic and Theoretical Methods" Sensors 10, no. 4: 3519-3548. https://doi.org/10.3390/s100403519