A Miniature System for Separating Aerosol Particles and Measuring Mass Concentrations

Abstract
:1. Introduction
2. Design Principle
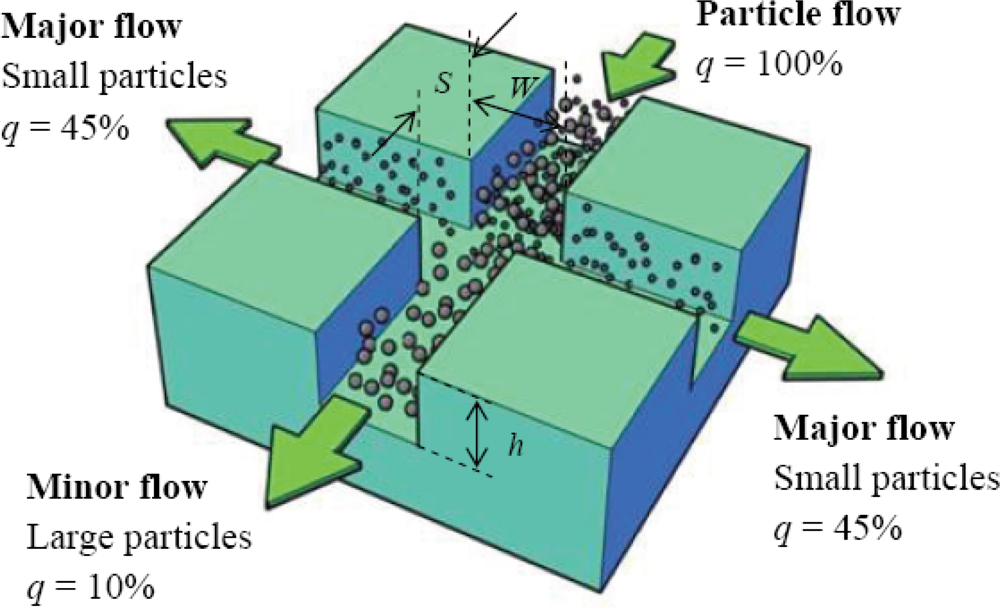
2.1. Virtual Impactor
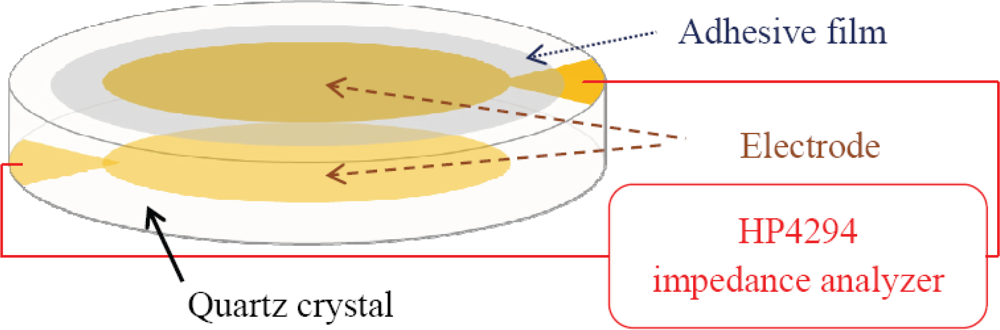
2.2. QCM Sensor
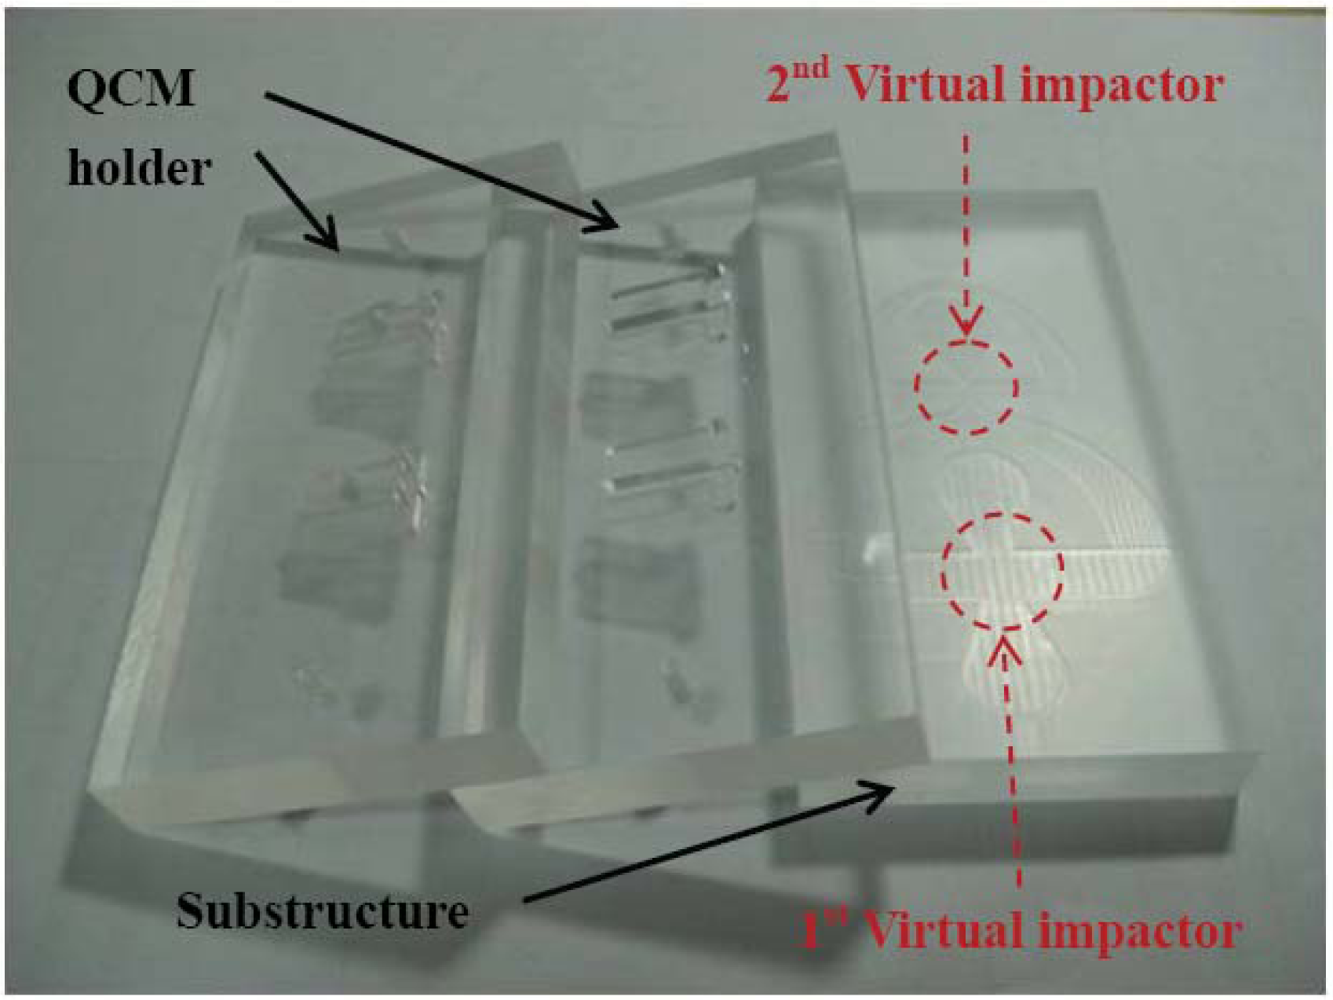
3. Fabrication
4. Experiment
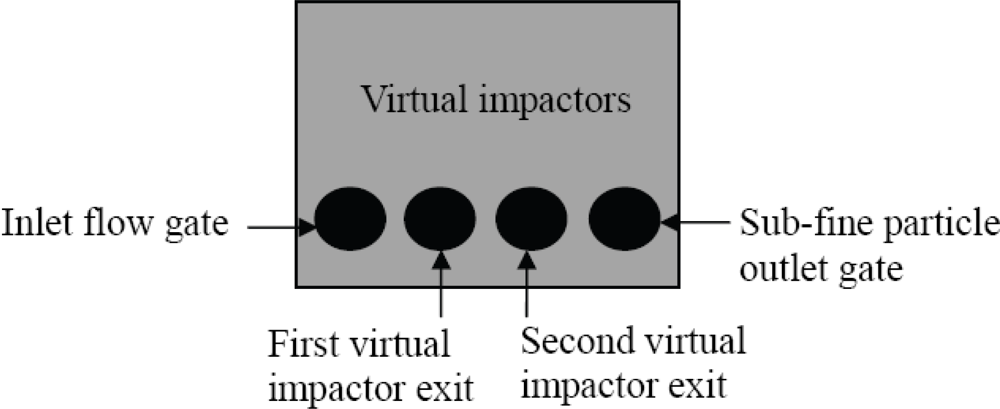
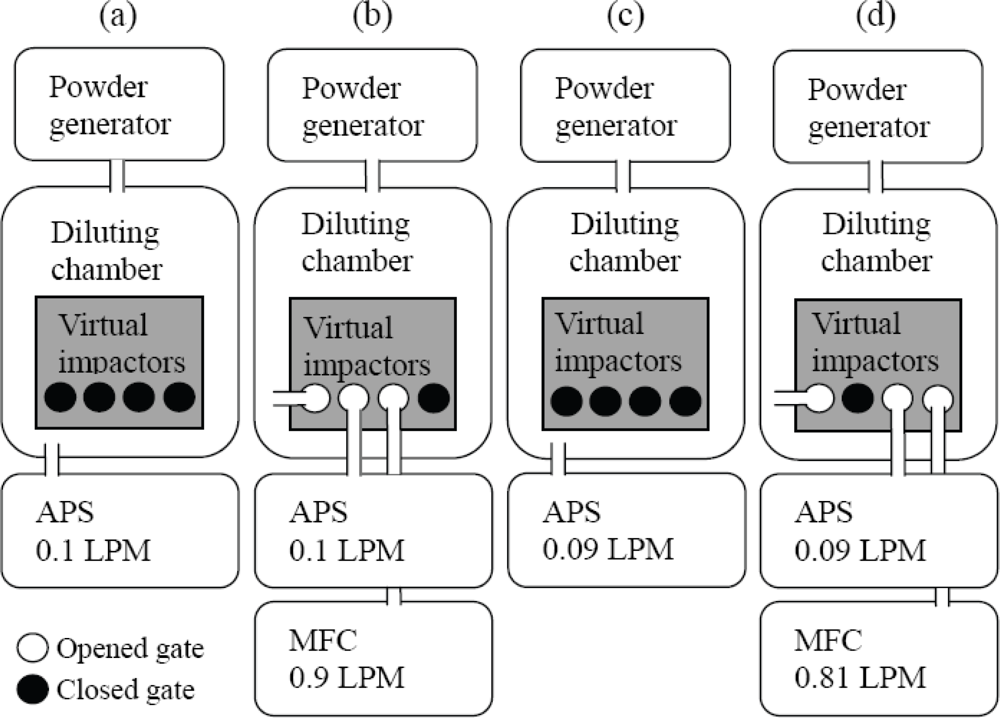
4.1. Virtual Impactor
4.2. QCM Sensor
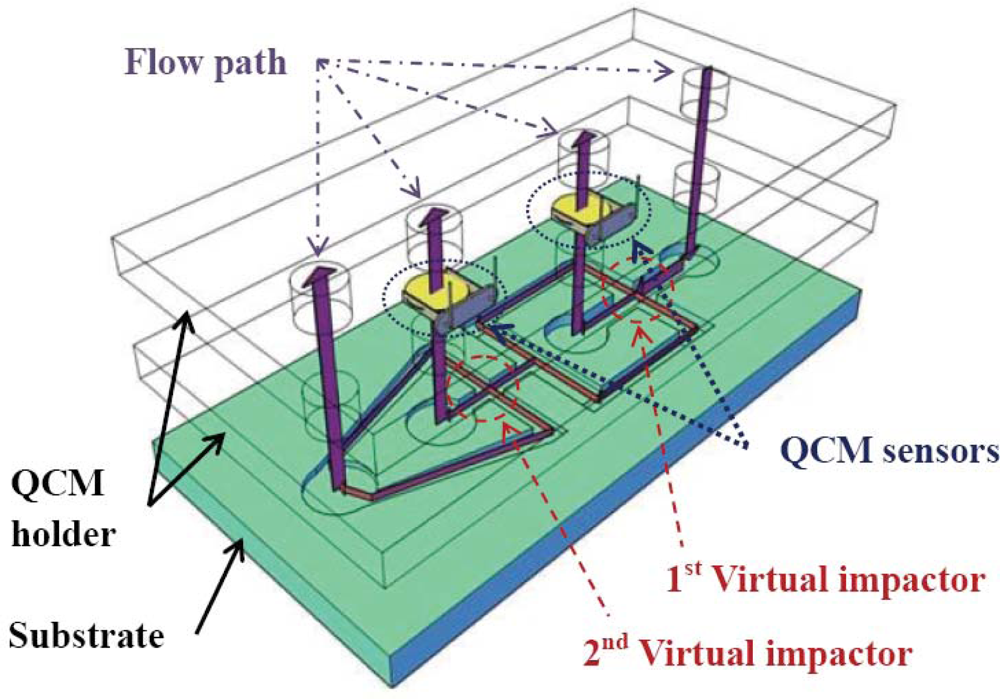
4.3. Integrated Virtual Impactors and QCM Sensors
5. Discussion and Conclusions
Acknowledgments
References
- Sun, Z.; Huang, Z.; Wang, J.S. Studies on the size distribution, number and mass emission factors of candle particles characterized by modes of burning. J. Aerosol Sci 2006, 37, 1484–1496. [Google Scholar]
- Reyes, F.L.; Jeys, T.H.; Newbury, N.R.; Primmerman, C.A.; Rowe, G.S.; Sanchez, A. Bio-aerosol fluorescence sensor. Field Ana. Che.Techn 1999, 3, 240–248. [Google Scholar]
- Davitt, K.M.; Song, Y.K.; Patterson, W.R., III; Nurmikko, A.V.; Pan, Y.L.; Chang, R.K.; Gherasimova, M.; Han, J.; Cobler, P.J.; Butler, P.D.; Palermo, V.; Gaska, R. A compact aerosol sensor and spectroscopic sorting with UV LEDs. Proceedings of the Optically Based Biological and Chemical Detection for Defense III, Stockholm, Sweden, September 11–13, 2006; pp. 63980B1–63980B9.
- Ouazzani, K.; Bentama, J. A promising optical technique to measure cake thickness of biological particles during a filtration process. Desalination 2007, 206, 36–41. [Google Scholar]
- Zemlyanov, A.A.; Geints, Y.E. Aerosol scattering of supercontinuum radiation formed upon femtosecond laser pulse filamentation in the atmosphere. Opt. Commun 2007, 270, 47–50. [Google Scholar]
- Satake, D.; Ebi, H.; Oku, N.; Matsuda, K.; Takao, H.; Ashiki, M.; Ishida, M. A sensor for blood cell counter using MEMS technology. Sens. Actuators B 2002, 83, 77–81. [Google Scholar]
- Tanabe, R.; Hata, S.; Shimokohbe, A. MEMS complete blood count sensors designed to reduce noise from electrolysis gas. Microelectron. Eng 2006, 83, 1646–1650. [Google Scholar]
- Haglund, J.S.; McFarland, A.R. A circumferential slot virtual impactor. Aerosol Sci. Techn 2004, 38, 664–674. [Google Scholar]
- Lim, H.H.; Park, D.; Maeng, J.Y.; Hwang, J.; Kim, Y.J. MEMS based integrated particle detection chip for real time environmental monitoring. Proceedings of the 18th IEEE International Conference on Micro Electro Mechanical Systems (MEMS), Istanbul, Turkey, January 22–26, 2006; pp. 62–65.
- Maeng, J.Y.; Park, D.; Kim, Y.H.; Hwang, J.; Kim, Y.J. Micromachined cascade virtual impactor for aerodynamic size classification of airborne particles. Proceedings of the 19th IEEE International Conference on Micro Electro Mechanical Systems (MEMS), Kobe, Japan, January 21–25, 2007; pp. 62–65.
- Tzou, T.Z. Aerodynamic particle size of metered-dose inhalers determined by the quartz crystal microbalance and the Andersen cascade impactor. Int. J. Pharm 1999, 186, 71–79. [Google Scholar]
- Nakamoto, T.; Suzuki, Y.; Moriizumi, T. Study of VHF-band QCM gas sensor. Sen. Actuators B 2002, 84, 98–105. [Google Scholar]
- Timbrell, S.T. Human exposure to asbestos: dust controls and standards. The inhalation of fibrous dusts. Ann. N. Y. Acad. Sci 1965, 132, 255–273. [Google Scholar]
- Hounam, R.F.; Sherwood, R.J. The cascade centripeter: a device for determining the concentration performance. Am. Ind. Hyg. Assoc. J 1965, 26, 122–131. [Google Scholar]
- Lim, K.S; Lee, K.W. Collection efficiency and particle loss of virtual impactors with different methods of increasing pressure drop. J. Aerosol Sci 2006, 37, 1188–1197. [Google Scholar]
- Dong, L.; Agarwal, A.K.; Beebe, D.J.; Jiang, H.R. Adaptive liquid microlenses activated by stimuli-responsive hydrogels. Nature 2006, 442, 551–554. [Google Scholar]
- Rodríguez-Pardo, L.; Rodríguez, J.F.; Gabrielli, C.; Perrot, H.; Brendel, R. Sensitivity, noise, and resolution in QCM sensors in liquid media. IEEE Sens. J 2005, 5, 1251–1257. [Google Scholar]


| Particle size | Mass concentration (mg/m3) |
|---|---|
| >3.20 | 42.095 |
| 3.20∼2.28 | 52.553 |
© 2010 by the authors; licensee Molecular Diversity Preservation International, Basel, Switzerland. This article is an open-access article distributed under the terms and conditions of the Creative Commons Attribution license ( http://creativecommons.org/licenses/by/3.0/).
Share and Cite
Liang, D.; Shih, W.-P.; Chen, C.-S.; Dai, C.-A. A Miniature System for Separating Aerosol Particles and Measuring Mass Concentrations. Sensors 2010, 10, 3641-3654. https://doi.org/10.3390/s100403641
Liang D, Shih W-P, Chen C-S, Dai C-A. A Miniature System for Separating Aerosol Particles and Measuring Mass Concentrations. Sensors. 2010; 10(4):3641-3654. https://doi.org/10.3390/s100403641
Chicago/Turabian StyleLiang, Dao, Wen-Pin Shih, Chuin-Shan Chen, and Chi-An Dai. 2010. "A Miniature System for Separating Aerosol Particles and Measuring Mass Concentrations" Sensors 10, no. 4: 3641-3654. https://doi.org/10.3390/s100403641