Article

Electrical Conductivity Response of Poly(Phenylene-vinylene)/ Zeolite Composites Exposed to Ammonium Nitrate

by
Jirarat Kamonsawas
1,
Anuvat Sirivat
1,*,
Sumonman Niamlang
2,
Pimpa Hormnirun
3 and
Walaiporn Prissanaroon-Ouajai
4
1
Center of Excellence in Petroleum Petrochemicals and Advanced Materials, The Petroleum and Petrochemical College, Chulalongkorn University, Soi Chula 12, Phayathai Road, Phatumwan, Bangkok, 10330, Thailand
2
Department of Materials and Metallurgical Engineering, Faculty of Engineering, Rajamangala University of Technology Thanyaburi, Rangsit-Nakhonnayok Road, Klong 6, Thanyaburi, Phatumthani, 12110, Thailand
3
Department of Chemistry, Faculty of Science, Kasetsart University, 50 Phahonyothin Road, Ladyao, Chatuchak, Bangkok, 10900, Thailand
4
Department of Industrial Chemistry, Faculty of Applied Science, KMIT-NB, 1518 Pibulsongkram Road, Bangsue, Bangkok, 10800, Thailand
*
Author to whom correspondence should be addressed.
Sensors 2010, 10(6), 5590-5603; https://doi.org/10.3390/s100605590
Submission received: 30 January 2010 / Revised: 27 March 2010 / Accepted: 22 April 2010 / Published: 3 June 2010
(This article belongs to the Section Chemical Sensors)

Abstract

:
Poly(p-phenylenevinylene) (PPV) was chemically synthesized via the polymerization of p-xylene-bis(tetrahydrothiophenium chloride) monomer and doped with H2SO4. To improve the electrical conductivity sensitivity of the conductive polymer, Zeolites Y (Si/Al = 5.1, 30, 60, 80) were added into the conductive polymer matrix. All composite samples show definite positive responses towards NH4NO3. The electrical conductivity sensitivities of the composite sensors increase linearly with increasing Si/Al ratio: with values of 0.201, 1.37, 2.80 and 3.18, respectively. The interactions between NH4NO3 molecules and the PPV/zeolite composites with respect to the electrical conductivity sensitivity were investigated through the infrared spectroscopy.

1. Introduction

The combustion of petroleum products such as diesel oil, heating oil, and heavy fuel oil generates pollutant emissions in the environment. Carbon monoxide (CO) causes chest pain in heart patients, headaches, nausea and reduced mental alertness. Sulfur dioxide (SO2) can induce lung disease and breathing problems for asthmatics. Emissions of sulfur dioxide also lead to the deposition of acid rain and other acidic compounds. Such deposition can change the chemical balance of soils which leads to the leaching of trace minerals and nutrients critical to trees and plants. In addition to those toxic gases present in atmosphere, terrorist bomb explosions are of main concern. A safe method is required to detect in advance the potential explosion via tailored gas sensors which can sense various volatiles of typical bomb chemicals: cyclotrimethylenetrinitramine (RDX), trinitrotulene (TNT), and ammonium nitrate [14].
Conducting polymers such as poly(p-phenylenevinylene) (PPV) can serve as a potential sensing material because PPV possesses good optical and electrical properties, and it can be synthesized by a relative simple technique. To obtain an analyte-specific material, the sensors should have very narrow chemical specificity with high sensitivity towards polar chemicals [5,6]. A zeolite is chosen as a selective microporous adsorbent to be introduced into the polymer matrix in order to increase sensitivity towards NH4NO3 [79]. PPV and their oligomers have been shown to be useful as active sensing materials. PPV has been shown to detect eight organic solvents (chloroform, acetone, ethanol, ethyl acetate, toluene, hexane, acetic acid, methanol, diethyl ether); their sensitivity values were between 10–40% [10]. In our work, we demonstrate further that PPV can detect NH4NO3 vapor, commonly found in fertilizers and explosive material industries [11]. In this paper, PPV/zeolite Y composites were prepared and electrical conductivity sensitivities of the composites under the NH4NO3 exposure were investigated, and data were compared with those of pristine PPV and zeoltite Y. Influence of Si/Al ratios of the zeolite Y on the electrical conductivity sensitivities was studied. Based on IR spectroscopy studies, interactions between NH4NO3 molecules and PPV, zeolite Y, and the PPV/zeolite Y composites are proposed.

2. Experimental

2.1. Materials

α, α’-Dichloro-p-xylene, tetrahydrothiophene and methanol (Aldrich) were used to synthesize p-xylene-bis(tetrahydrothiophenium chloride) monomer. Sodium hydroxide (Merck) and hydrochloric acid (Merck) were used as the basic and the acidic reagents, respectively. Sulfuric acid (Merck) was used as the oxidant. Zeolites: CVB400 (Si/Al = 5.1, H+), CVB720 (Si/Al = 30, H+), CVB760 (Si/Al = 60, H+) and CVB780 (Si/Al = 80, H+) (all from Zeolyst) were used as the adsorbents. Ammonium hydroxide (Suksapan, Thailand) and nitric acid (Fluka) were used to make ammonium nitrate (NH4NO3) as the target chemical. Nitrogen (N2, TIG) was used as the surface cleaning gas and to vaporize ammonium nitrate. All chemicals were used without further purification.

2.2. Poly(p-phenylenevinylene) Synthesis and Doping Process

Synthesis of the p-xylene-bis(tetrahydrothiophenium chloride) monomer was achieved by reacting α,α’-dichloro-p-xylene with tetrahydrothiophene [12]. The precursor sulfonium polyelectrolyte was prepared in an aqueous solution by the base induced polymerization of an appropriate bis-sulfonium monomer. The polymerization reaction was terminated by the addition of dilute aqueous hydrochloric acid to the reaction mixture which was then dialyzed against water in order to separate the high molecular weight fraction from the monomeric and oligomeric residues as well as the sodium and chloride ions. Poly(p-phenylenevinylene) (PPV) was obtained by heating pol[(p-xylene-bis(tetrahydro-thiophenium chloride)] under vacuum at 180 °C for 6 hours [12]. 18 M sulfuric acid was used as a dopant solution at the mole ratios between PPV repeating unit per sulfuric acid equal to 1:300. The doping process occurred after adding the dopant solution to a polymeric powder, and it was monitored by observing the color changes of the powder from bright yellow to black [13].

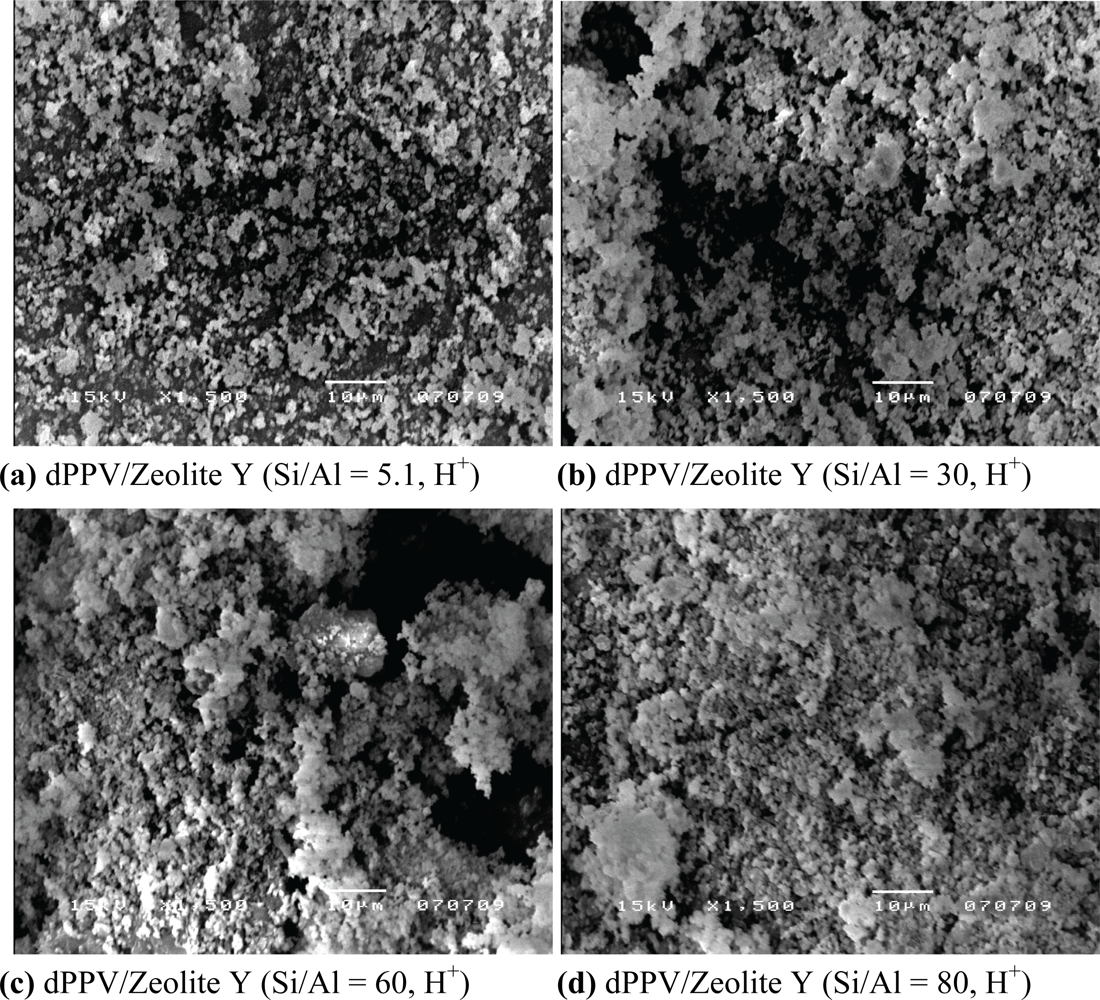
2.3. Composite Preparation

dPPV/zeolite composites were prepared by dry mixing doped PPV particles with the zeolites at a volume ratio equal to 10:90. The composites were compressed into a disc form by using a hydraulic press at a pressure of 6 kN.

2.4. Characterization

FT-IR spectrometry (Bruker, model FRA 106/S) was used to characterize functional groups. A scanning electron microscope (SEM, JEOL, model JSM-5200) was used to study the morphology of PPV, doped PPV, the zeolites, and PPV/zeolite composites at magnifications of 1,500 and 5,000 and at 15 kV. BET (Sorptomatic-1990) was used to measure the pore sizes and the surface areas of the zeolites. A custom made two-point probe with a linear geometric array was used to measure the specific electrical conductivity of samples.

2.5. Electrical Conductivity and Gas Measurements

The electrical conductivity of the PPV pellets under exposures to air, N2, and NH4NO3 were measured using a custom made two-point probe which was connected to a voltage supplier (Keithley, 6517A), in which its voltage was varied and the resultant current was measured. The electrical conductivity was calculated by using the equation: σ = (I/KVt), where I is the measured current (A), V is the applied voltage (V), t is the thickness, and K is the geometric correction factor of the two-point probe as determined by calibrating the probe with a silicon wafer with a known resistivity value. The electrical conductivity response and sensitivity of the composites were determined by following the equations: Δσ = σNH4NO3 −σN2,initial and Δσ/σN2,initial, respectively. Δσ is the difference in the specific electrical conductivity (S/cm), σN2,initial is the specific electrical conductivity in N2 before exposure (S/cm), and σNH4NO3 is the specific electrical conductivity under NH4NO3 exposure (S/cm).

3. Results and Discussion

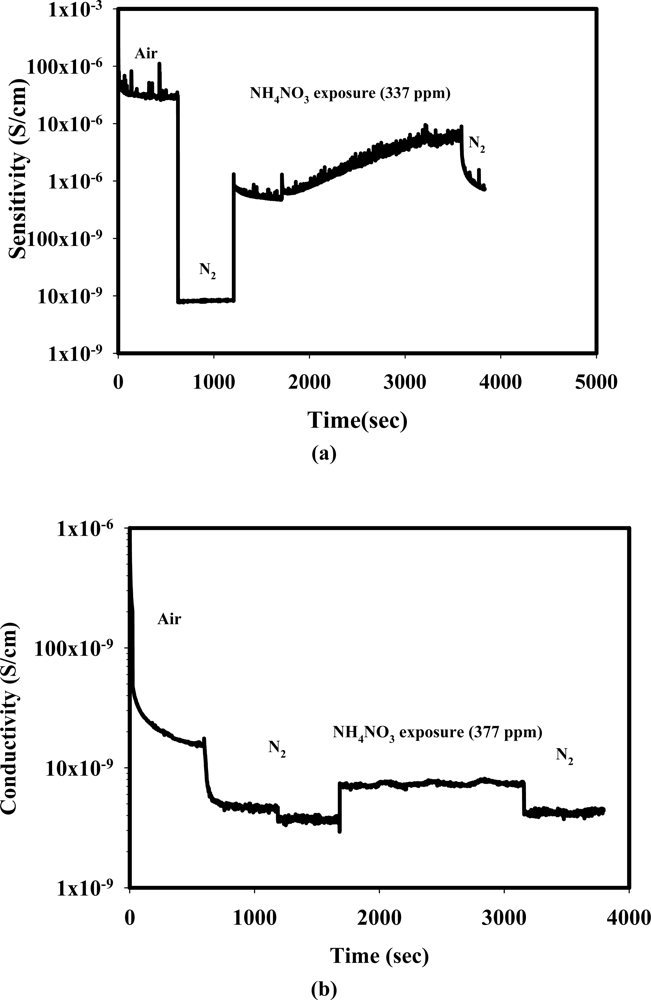
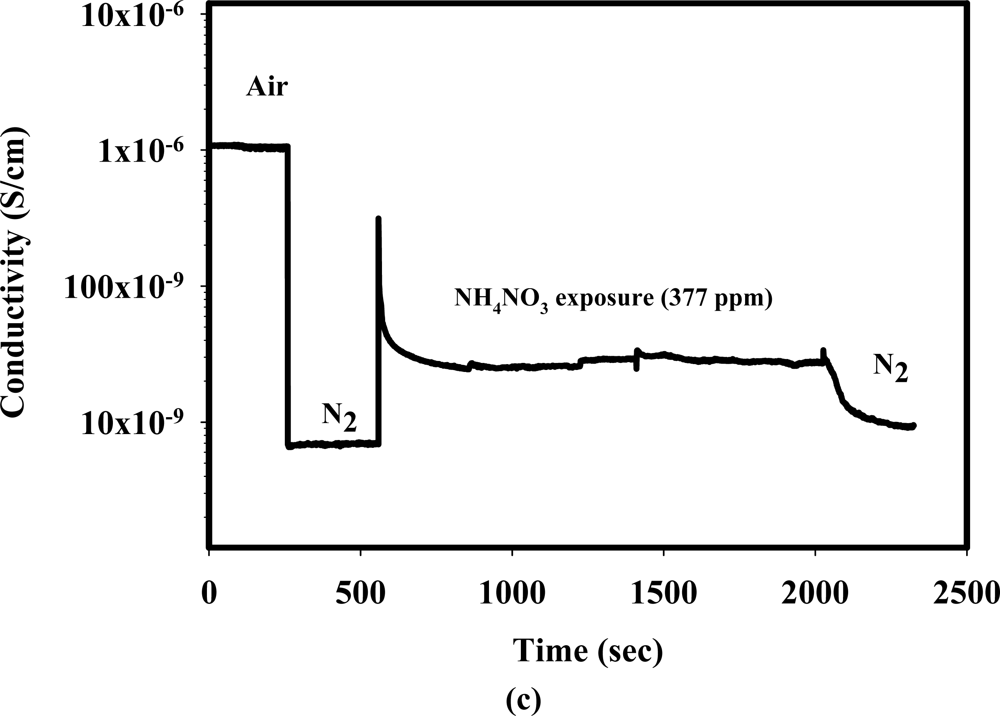
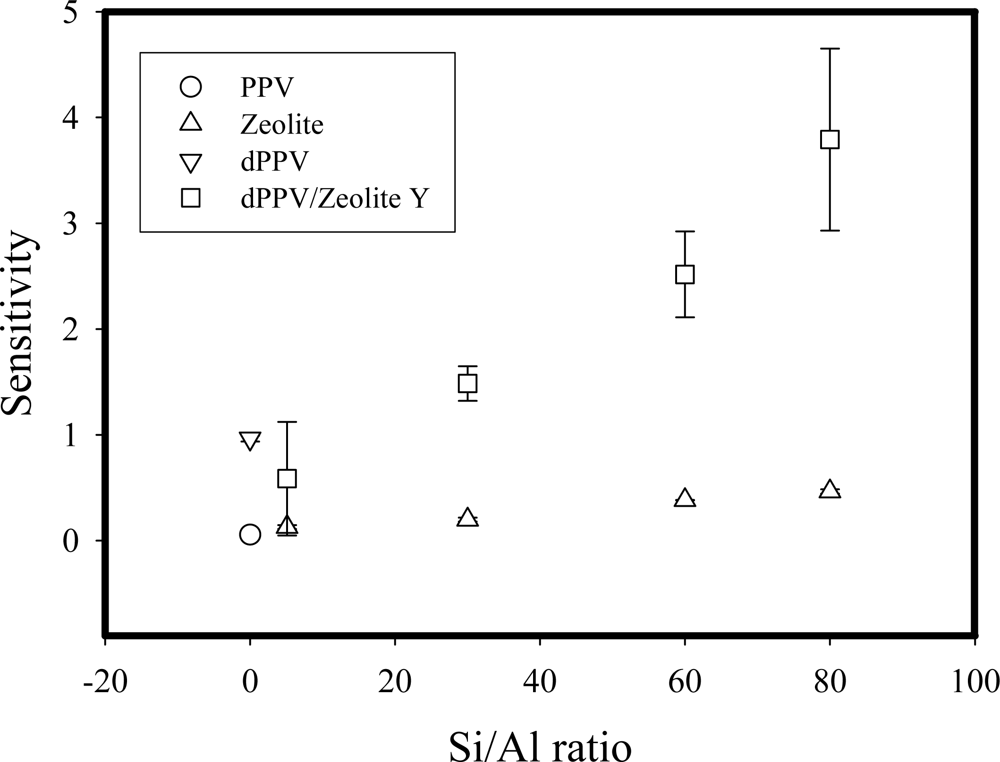
3.1. Electrical Conductivity Sensitivity of PPV, dPPV and Zeolite Y Exposed to NH4NO3

The electrical response (Δσ = σNH4NO3−σN2initial [S/cm]) of each sample was calculated by the difference between the saturated electrical conductivity when exposed to NH4NO3 and the steady state conductivity value when exposed to pure N2 at 1 atm and 30 ± 2 °C. Due to appreciable differences in initial conductivity between various composites, the sensitivity (sensitivity = Δσ/σN2), defined as the electrical conductivity response divided by the electrical conductivity when exposed to pure N2, will be used for comparison purposes.
When PPV and dPPV is exposed to NH4NO3 at 377 ppm, its electrical conductivity increases and the corresponding electrical conductivity sensitivity values are 5.55 × 10⁻² and 9.65 × 10⁻¹, respectively. The positive increment of the sensitivity upon exposed to NH4NO3 implies that NH4NO3 molecules act as a primary and secondary dopants for PPV and dPPV, respectively, resulting in a greater number of charges along the polymer backbone.
In this study, the zeolites Y having different Si/Al ratios (Si/Al = 5.1, 30, 60, 80, H+) were selected to investigate the effect of Si/Al ratios on the electrical conductivity sensitivity towards NH4NO3. Figures 1(a)–(d) show that the zeolites have nearly the same morphology. In addition, the zeolites Y with different Si/Al ratios possess nearly the same surface areas, pore sizes, and densities. When the zeolites Y are exposed to NH4NO3 at 377 ppm, the electrical conductivity values increase by one order of magnitude, relative to the values when exposed to nitrogen. The electrical conductivity sensitivity, Δσ/σN2, increases with the increasing Si/Al ratios as shown in Table 1.
A higher Si content of the zeolite Y, as accompanied by a greater amount of cations present, appears to facilitate the static interaction between oxygen on the Si molecule on the zeolite Y and NH4NO3 [14,15]. The dPPV/zeolite Y composites were fabricated by mixing of the dPPV and zeolite Y having different Si/Al ratios (Si/Al = 5.1, 30, 60, 80, H+). All composites contain 90% by volume of the zeolites Y. Zeolite Y particles appear to possess the irregular shape of crystals and appear to be inhomogenously dispersed in the polymer matrix [15].
Figures 2(a)–(c) show the response of the doped PPV, Zeolite Y (Si/Al = 5.1, H+) and dPPV/zeolite Y (Si/Al = 5.1, H+) composite when exposed to NH4NO3. It is obvious that the doped PPV and the dPPV/zeolite Y composite show comparable increases in electrical conductivity when exposed to NH4NO3 whereas the zeolite Y exhibits a slight increase in its electrical conductivity. Table 2 tabulates the electrical conductivity sensitivities and the induction times of the doped PPV/zeolite Y composites having different Si/Al ratios. It can be seen from the Table 2 that a higher sensitivity is observed for the composite containing a higher Si/Al ratio. A similar trend is observed for the induction times; a longer induction time is required for the composite with a higher Si/Al ratio. The composite with a higher Si/Al ratio corresponds with the zeolite containing a greater amount of cations which induces a more favorable interaction between NH4NO3 molecules and the active sites on the conductive polymer chain [16].
Figure 3 shows that all of the composites have larger sensitivity values than that of the pristine PPV and the doped PPV with the corresponding sensitivity values of 5.55 × 10⁻², 9.65 × 10⁻¹, respectively. The increase in the sensitivity values of PPV/zeolite composites relative to those of the pristine PPV and the doped PPV reflects the fact that NH4NO3 molecules can adsorb into the zeolites by the electrostatic interaction. Therefore, under this condition, a larger amount of NH4NO3 molecules are available to interact with dPPV chains.

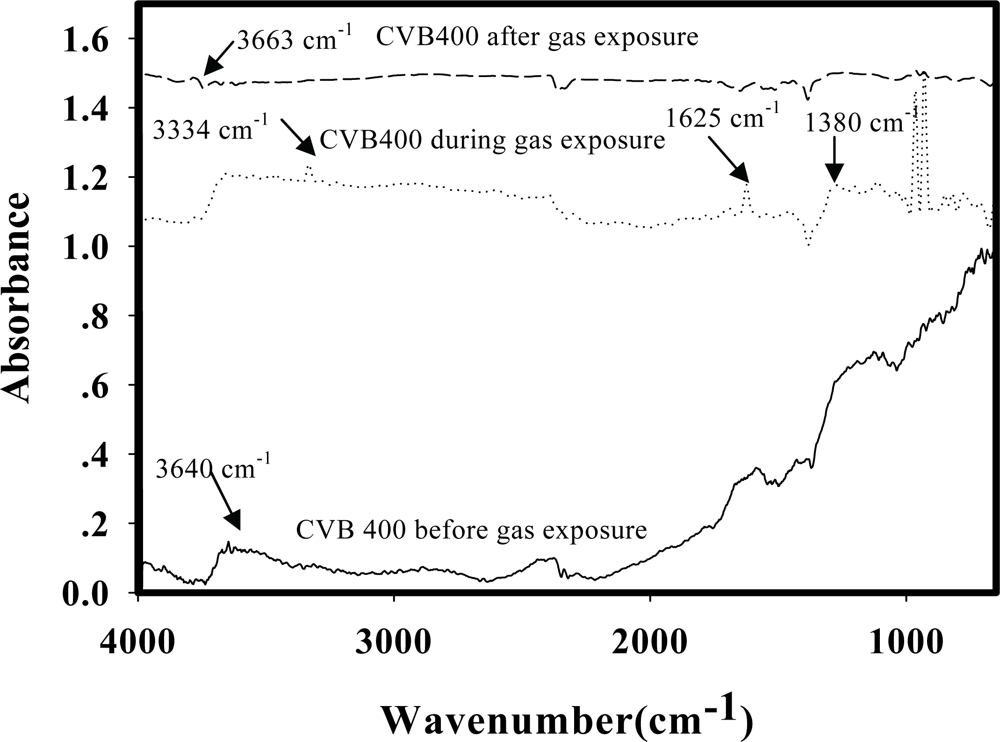
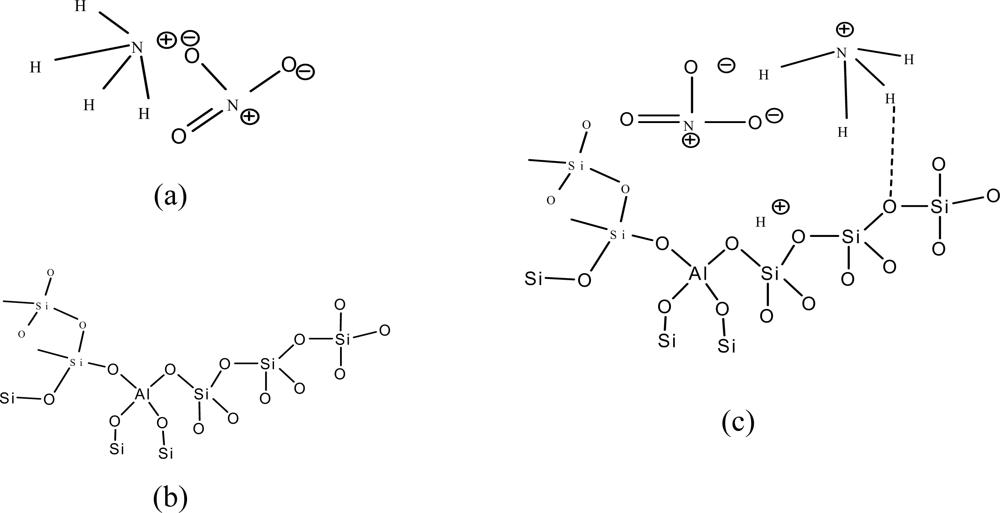
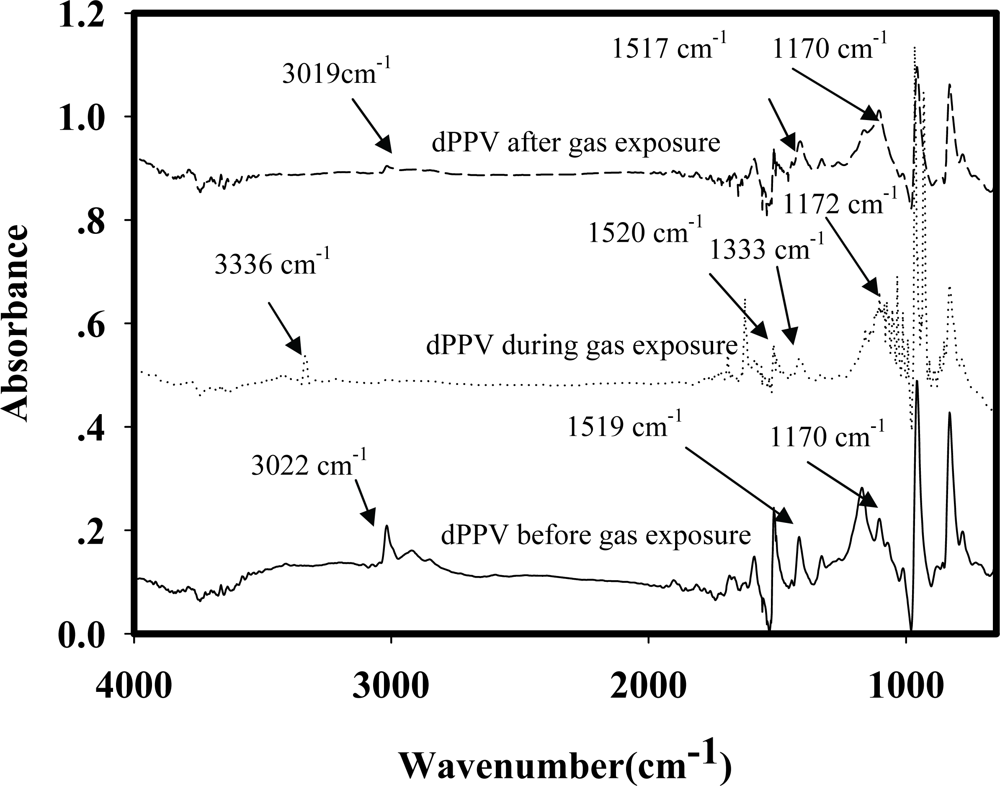
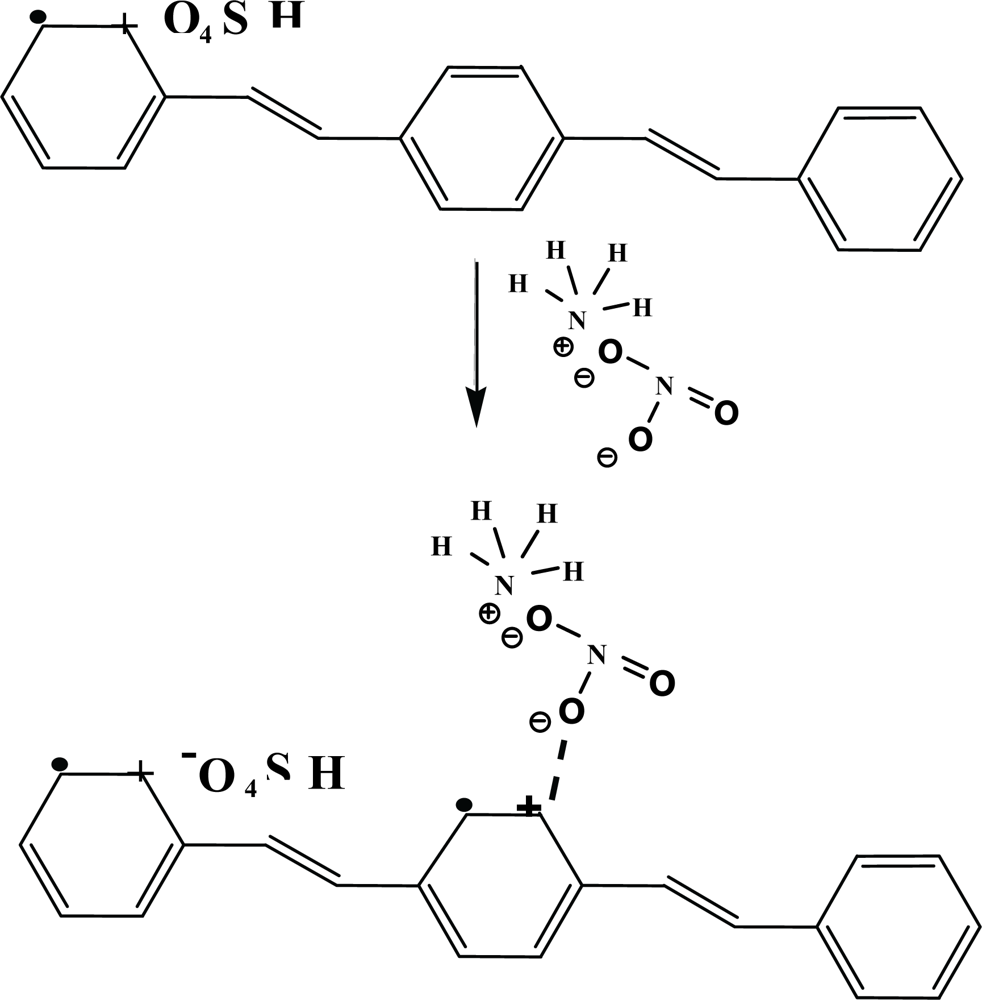
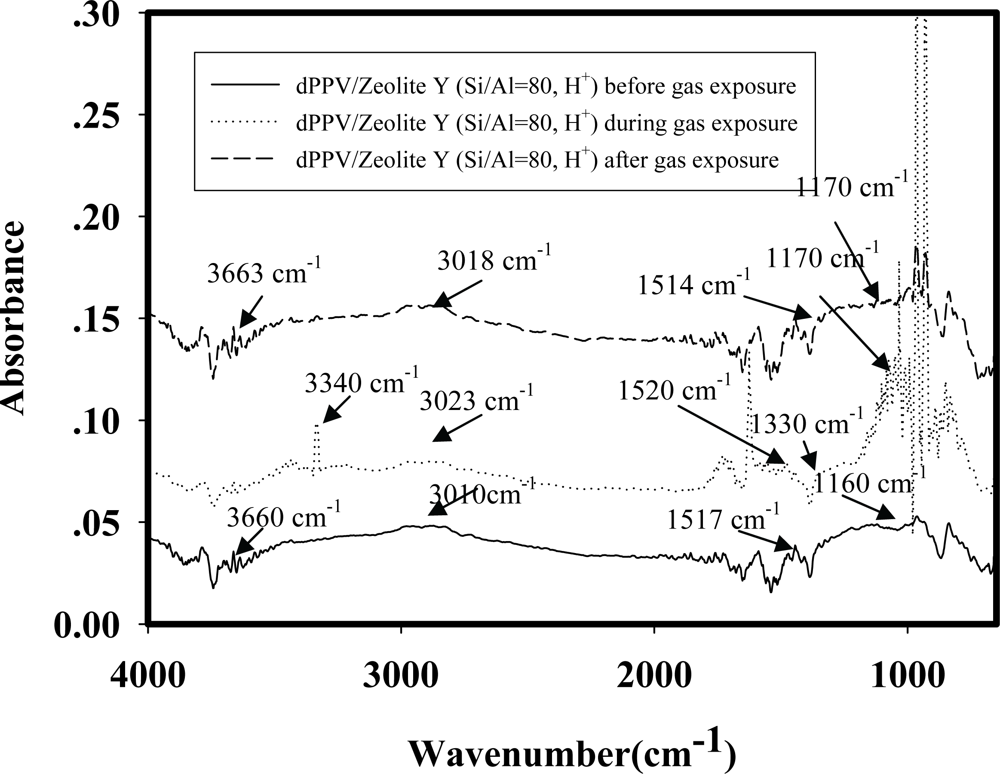
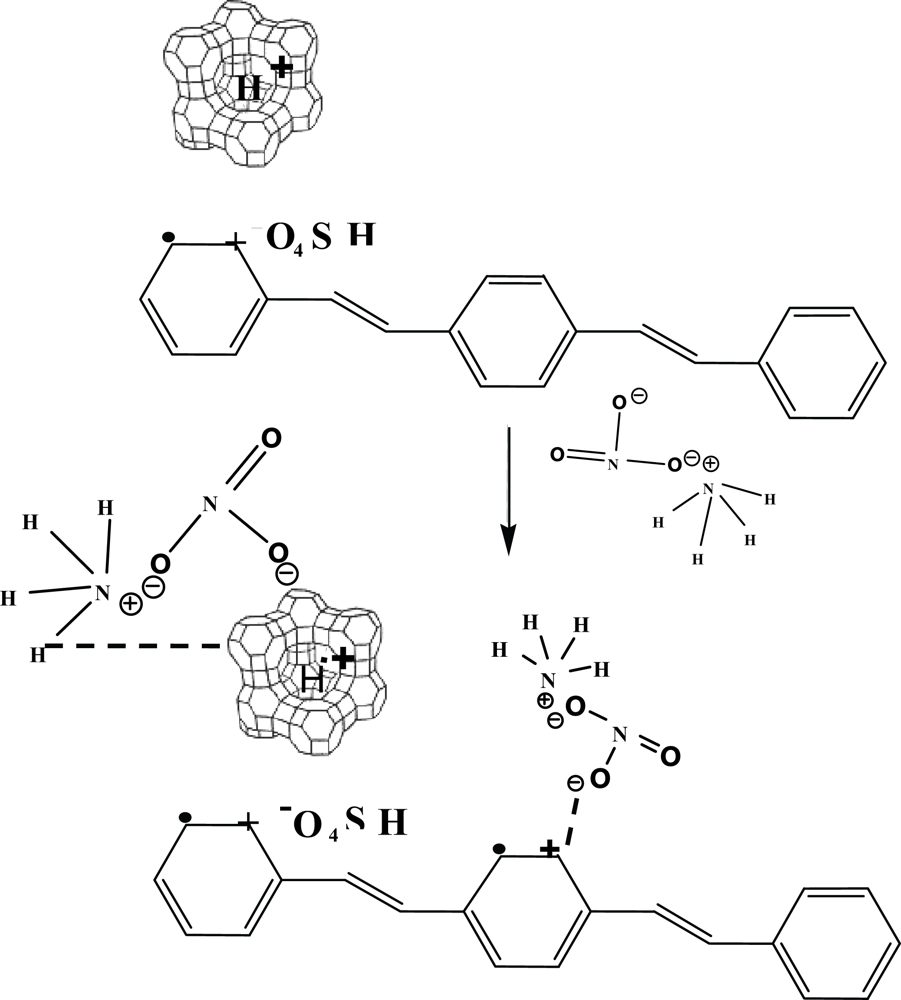
3.2. FTIR Investigations of Reactions of Adsorbed NH4NO3

FTIR spectra of a dPPV, a zeolite Y and a dPPV/zeolite Y composite were taken. The spectra of samples were collected before, during at 15 minutes interval, and after the NH4NO3 exposure, in order to study the interaction between the samples and NH4NO3. The IR spectrum of NH4NO3 recorded in the 700–3,500 cm−1 region (not shown here) exhibits the vibrational stretching frequencies of the free NH4+ molecules at 3,330, 3,300 cm−1 [16,17] and of the free NO3 molecules at 1,300 – 1,350 cm−1, 815 – 840 cm−1 [18].
Figure 4 shows the IR spectra of the zeolite Y (Si/Al = 5.1, H+) before the NH4NO3 exposure, during the NH4NO3 exposure, and after the NH4NO3 exposure. Before the NH4NO3 exposure, the IR spectrum shows a peak at 3,640 cm−1 which can be assigned to the silanol group [19]. During NH4NO3 exposure, the IR spectrum shows two new peaks at 3,334 and 1,625 cm−1; they can be assigned to the interaction between NH4+ and the oxygen molecules of the zeolite [14,17]. The peak at 1,380 cm−1 can be assigned to the interaction between NO3 and the oxygen molecules of the zeolite [18]. These three peaks disappears after the NH4NO3 exposure, and the peak at 3,663 cm−1, the stretching vibration of the silanol group, reappears. This suggests that no interaction between the zeolite and NH4NO3 remains and the interaction is reversible. Overall, there is no significant difference in the zeolite spectra before and after exposure to NH4NO3 [2022].
Figure 5 shows the structure of NH4+, the zeolite Y structure and the interaction between NH4+ and the zeolite Y. Zeolite Y (Si/Al = 80) and zeolite Y (Si/Al = 5.1) have comparable specific surface areas: 728 and 868 g/cm2. The higher surface area induces more easily the target gas to reside in the cavity [14]. With increasing Si/Al ratio, it appears that the increase in Si in the zeolite Y structure facilitates the static interaction between NH4NO3 and oxygen on the Si molecule in the zeolite Y. Increasing the static interaction between the target gas and zeolite in turn improves the sensitivity of the PPV/zeolite Y composites as described previously [23,24].
Figure 6 shows the IR spectrum of a dPPV before the NH4NO3 exposure, during the NH4NO3 exposure, and after the NH4NO3 exposure. Before the NH4NO3 exposure, the IR spectrum shows a peak at 1,170 cm−1 which can assigned to the quinoid structure, peaks at 1,519 and 3,022 cm−1 can be assigned to the phenylene characteristics [10,25]. During the NH4NO3 exposure, the IR spectrum shows a new peak at 3,336 cm−1 which can be assigned to the vibration of NH4+. The two new peaks at 1,333 and 830 cm−1 can be assigned to the vibration of NO3 interacting with the cation on the quiniod structure of doped PPV [18]. Increasing peak intensity at 1,172 cm−1 during the NH4NO3 exposure is caused by the increase in the quinoid structures in the doped PPV. The intensities of peaks at 3,019, 1,517 cm−1 decrease after the NH4NO3 exposure and the peaks at 3,336, 1,333 cm−1 disappear. The decreases in the intensities at 3,019, 1,517 cm−1 after the NH4NO3 exposure suggest that NH4NO3 molecules may act as a secondary dopant and the number of the quinoid structures of DPPV increases [18]. From the FTIR result shown in Figure 6, the interaction between the doped PPV and a zeolite Y may be proposed as shown in Figure 7.
Figure 8 shows the IR spectra of NH4NO3 (pressure at 1 atm and at room temperature) adsorbed on dPPV/zeolite-Y (Si/Al = 80, H+) before the NH4NO3 exposure, during the NH4NO3 exposure, and after the NH4NO3 exposure.
Before the NH4NO3 exposure, the IR spectrum shows a peak at 1,160 cm−1 which can be assigned to the quinoid structure, peaks at 1,517 and 3,010 cm−1 can be assigned to the phenylene characteristic [10,25], and the peak at 3,660 cm−1 can be assigned to the silanol group [19]. During the NH4NO3 exposure, the IR spectrum shows a new peak at 3,340 cm−1 which can be assigned to NH4+ interacting with oxygen on Si molecule [14,17]. The new peak at 1,330 cm−1 can be assigned to NO3 interacting with the cation on dPPV and oxygen on Si molecule [18]. The intensities of the peaks at 3,023, 1,520 cm−1 decrease during and after the exposure. The decreases in the intensities at 3,023, 1,520 cm−1 during and after the exposure suggest that NH4NO3 molecules may act as a secondary dopant. The number of the quinoid structures increases in the doped PPV structure corresponding to the intensity increase at 1,170 cm−1 during the NH4NO3 exposure. After the NH4NO3 exposure, the peaks at 3,340, 1,330 cm−1 disappear. A peak at 3,663 cm−1 is characteristic of the zeolite after the NH4NO3 exposure, suggesting that no interaction between zeolite and NH4NO3 remains [17,22]. This is the FTIR evidence for the previously proposed mechanism that zeolite Y induces a larger volume of NH4NO3 vapor to interact with the doped PPV and NH4NO3 molecules act as a secondary dopant. A previous study also suggested the interactions between a target gas and a zeolite were further induced by the presence of the zeolite [14]. Figure 9 shows a schematic of the proposed interactions between NH4NO3 and the dPPV/zeolite Y composites.

4. Conclusions

Doped PPV with H2SO4 is utilized as a NH4NO3 gas sensing material due to the positive electrical conductivity response. Electrical conductivity sensitivity of the doped PPV towards NH4NO3 can be improved by introducing the zeolites Y into the doped PPV matrix. The effect of Si/Al ratio was investigated at the ratios of 5.1, 30, 60, and 80. The sensitivity increases monotonically with Si/Al ratio up to 80. The increases in electrical conductivity sensitivity with increasing Si/Al ratio can be described in terms acidity or the amount of cations present on the zeolites. The dPPV/zeolite Y (Si/Al = 80, H+) possesses the highest sensitivity of 3.79 since zeolite Y (Si/Al=80, H+) has the highest acidity; it can induce a more favorable NH4NO3 vapor adsorption onto the composite. From FTIR investigations, the NH4NO3-dPPV interaction is irreversible while NH4NO3-zeolite interaction is reversible.

Acknowledgments

AS would like to acknowledge the financial supports from the Conductive and Electroactive Polymers Research Unit and KFAS, both of Chulalongkorn University, the Thailand Research Fund (TRF-BRG), the Center of Petroleum, Petrochemicals and Advanced Materials, and Thai Royal Government (Budget of Fiscal Year 2552).

References

  1. Collins, G.E.; Buckley, L.J. Conductive polymer coated fabrics for chemical sensing. Synth. Met 1996, 78, 93–101. [Google Scholar]
  2. Heeger, A.J.; Maria, A.D. Semiconducting polymers as a material for photonic device. Solid State Sci 1998, 3, 16–22. [Google Scholar]
  3. Heeger, A.J. Semiconducting and metallic polymers: the fourth generation of polymeric materials. Synth. Meth 2002, 125, 23–42. [Google Scholar]
  4. Persaud, K.C. Polymer in chemical sensing. Mat. Today 2005, 8, 38–44. [Google Scholar]
  5. Babudri, F.; Farinola, G.M.; Giancane, S.; Naso, F.; Rella, R.; Scarpa, A.; Valli, L. Deposition and application in gas sensors of thin films of a bridged chain dialkoxy PPV derivative. Mater. Sci. Eng. C 2002, 22, 445–448. [Google Scholar]
  6. Bouchet, R.; Rosiri, S.; Vitter, G.; Siebert, E. Solid state hydrogen sensor based on acid doped polybenzimidazole. Sens. Actuat. B 2001, 76, 610–616. [Google Scholar]
  7. Graham, S.C.; Fung, S.; Moratti, S.C.; Friend, R.H. High sensitivity radiation sensing by photo induced doping in PPV derivatives. Synth. Met 1999, 102, 1169–1170. [Google Scholar]
  8. Hagen, G.; Dubbe, A.; Retting, F.; Jerger, A.; Birkhofer, T.; Muller, R.; Rlog, C.; Moos, R. Selective impedance based gas sensors for hydrocarbons using ZSM-5 zeolite films with chromium (3) oxide interface. Sens. Actuat. B 2006, 119, 441–448. [Google Scholar]
  9. Vilaseca, M.; Coronas, J.; Cirera, A.; Cornet, A.; Morante, R.J.; Santamaria, J. Gas detection with SnO2 sensors modified by zeolite films. Sens. Actuat. B 2007, 124, 99–110. [Google Scholar]
  10. Cirpan, A.; Kucukyavuz, Z.; Kucukyavuz, S. Synthesis, characterization and electrical conductivity of poly (paraphenylene vinylene). Turk. J. Polym 2003, 27, 135–143. [Google Scholar]
  11. Peres, L.O.; Mauro, R.; Fernandes, B.; Jarem, R.; Garcia, B.; Wang, S.H.; Francisco, C.; Nart, B. Synthesis and characterization of chloro and bromo substituted p-phenylene vinylene homopolymers and alternating copolymers. Synth. Met 2006, 156, 529–536. [Google Scholar]
  12. Wessling, R.A.; Zimmerman, R.G. Polyelectrolytes from bis-sulfonium salts. U.S. Patent 3,401,152 1966. [Google Scholar]
  13. Ahlskog, M.; Reghu, M.; Noguch, T.; Ohnishi, B. Doping and conductivity studies on poly (p-phenylene vinylene). Synth. Met 1997, 89, 11–15. [Google Scholar]
  14. Zecchina, A.; Marchese, L.; Bordiga, S.; Paze, C.; Gianotti, E. Vibrational spectroscopy of NH4+ ions in zeolitic materials: An IR study. J. Phys. Chem. B 1997, 101, 10128–10135. [Google Scholar]
  15. Break, D.W. Zeolite Molecular Sieves; Robert E. Krieger Publishing: Malabar, Florida, USA, 1973. [Google Scholar]
  16. Densakulprasert, N.; Ladawan, W.; Datchanee, C.; Hiamtup, P.; Sirivat, A.; Schwank, J. Electrical conductivity of polyaniline/zeolite composites and synergetic interaction with CO. Mater. Sci. Eng. B 2005, 117, 276–282. [Google Scholar]
  17. Geobaldo, F.; Lamberti, C.; Ricchiardi, G.; Bordiga, S.; Zecchina, A.; Palomino, T.; Arean, C.O. Reply to comments on “N2 adsorption at 77 K on H-mordenite and alkali-metal-exchanged mordenites: An IR study”. J. Phys. Chem 1996, 99, 11167–11177. [Google Scholar]
  18. Matsumoto, A.; Kitajima, T.; Tsutsumi, K. Adsorption characteristics and polymerization of pyrrole on Y-zeolites. Langmuir 1999, 15, 7626–7631. [Google Scholar]
  19. Venkatathri, N. Synthesis and characterization of high silica content silicoaluminophosphate SAPO-35 from non-aqueous medium. Catal. Commun 2006, 7, 773–777. [Google Scholar]
  20. Yang, J.C.; Dutta, P.K. Promoting selectivity and sensitivity for a high temperature YSZ-based electrochemical total NOx sensor by using a Pt loaded zeolite Y filter. Sens. Actuat. B 2007, 125, 30–39. [Google Scholar]
  21. Angell, C.L. Carbon dioxide adsorbed on Linde X and Y zeolites. J. Phys. Chem 1996, 70, 2420. [Google Scholar]
  22. Carmen, C.; Thomas, S.; Elke, L.; Alexander, B.; Wolfgang, B. Preparation and structure of In-ZSM 5 catalysts for the selective reduction of NO by hydrocarbon. J. Phy. Chem. B 2002, 106, 4085–4097. [Google Scholar]
  23. Thuwachawsoan, K.; Chotpattananont, D.; Sirivat, A.; Rujiravanit, R.; Schwank, J. Electrical conductivity responses and interactions of poly(3-thiopheneaceticacit)/zeolites L, mordernite, beta and H2. Mater. Sci. Eng. B 2007, 140, 23–30. [Google Scholar]
  24. Soontornworajit, B.; Wannatong, L.; Hiamtup, P.; Niamlang, S.; Chotpattananont, D.; Sirivat, A.; Schwank, J. Induced interaction between polypyrrole and SO2 via molecular sieve 13X. Mater. Sci. Eng. B 2007, 136, 78–86. [Google Scholar]
  25. Gagnon, D.R.; Capistran, J.D.; Karasz, F.E.; Lenz, R.W.; Antoun, S. Synthesis, doping, and electrical conductivity of high molecular weight poly(p-phenylene vinylene). Polymer 1987, 28, 567–573. [Google Scholar]
Figure 1. SEM micrographs of the dPPV/zeolite Y composites having different Si/Al ratios (magnification 1,500, 15 kV).
Sensors 10 05590f1
Figure 2. The responses of: (a) doped PPV; (b) Zeolite Y (H+, Si/Al = 5.1); and (c) dPPV/Zeolite Y (H+, Si/Al = 5.1).
Sensors 10 05590f2aSensors 10 05590f2b
Figure 3. Electrical conductivity sensitivity of PPV, dPPV, Zeolite Y, and dPPV/zeolite Y composites of different Si/Al ratios.
Sensors 10 05590f3
Figure 4. IR spectra of the zeolite Y (Si/Al = 5.1, H+) exposed to NH4NO3 (NH4NO3 = 377 ppm, pressure at 1 atm, and at T = 25 °C).
Sensors 10 05590f4
Figure 5. The structures of: (a) NH4NO3; (b) Zeolite Y structure; and; (c) the interaction between NH4NO3 and a zeolite.
Sensors 10 05590f5
Figure 6. IR spectra of the doped PPV exposed to NH4NO3 (NH4NO3 = 377 ppm, pressure at 1 atm, and at T = 25 °C).
Sensors 10 05590f6
Figure 7. Schematic of the proposed mechanism of the NH4NO3-dPPV.
Sensors 10 05590f7
Figure 8. IR spectra of dPPV/zeolite Y (Si/Al = 80, H+) exposed to NH4NO3 (NH4NO3 = 377 ppm, pressure at 1 atm and at T = 25 °C).
Sensors 10 05590f8
Figure 9. Schematic of the proposed interactions between NH4NO3 and the dPPV/zeolite Y composite.
Sensors 10 05590f9
Table 1. Surface areas, pore size and electrical conductivity sensitivity of the zeolites and the electrical conductivity sensitivity when exposed to NH4NO3.
ZeoliteBET surface area (m2/g)Median Pore width (°A)Apparent Density (g/cm3)Sensitivity (Δσ/σN2)

Zeolite Y (Si/Al = 5.1, H+)864 ± 5.6510.75 ± 0.00252.0046 ± 0.341.21 × 10−1 ± 7.88 × 10⁻³
Zeolite Y (Si/Al = 30, H+)780 ± 0.359.56 ± 0.09821.8331 ± 0.271.98 × 10−1 ± 1.81 × 10⁻²
Zeolite Y (Si/Al = 60, H+)740 ± 28.9910.74 ± 0.02542.0102 ± 0.073.83 × 10−1 ± 2.55 × 10⁻³
Zeolite Y (Si/Al = 80, H+)728 ± 4.3510.10 ± 0.02122.0048 ± 0.364.64 × 10−1 ± 2.15 × 10⁻²
Table 2. The electrical conductivity sensitivity and the induction and recovery times the dPPV/90%Zeolite Y composites when exposed to NH4NO3.
SampleΔσ (σNH4NO3σN2) (S/cm)Sensitivity (Δσ/σN2)Induction time (minutes)Recovery time, tr (minutes)

dPPV/90% Zeolite Y (Si/Al = 5.1, H+)2.60 × 10⁻³ ± 3.57 × 10−35.86 × 10−1 ± 5.37 × 10−141 ± 1123 ± 8
dPPV/90% Zeolite Y (Si/Al = 30, H+)1.73 × 10⁻⁴ ± 1.64 × 10−41.48 × 100 ± 1.64 × 10−134 ± 1147 ± 14
dPPV/90% Zeolite Y (Si/Al = 60, H+)1.61 × 10⁻³ ± 2.20 × 10−32.52 × 100 ± 4.06 × 10−191 ± 2338 ± 6
dPPV/90% Zeolite Y (Si/Al = 80, H+)9.73 × 10⁻⁵ ± 2.02 × 10−53.79 × 100 ± 8.60 × 10−1118 ± 3820 ± 10
σ = electrical conductivity values, Δσ = the electrical conductivity response, and Δσ/ΔσN2 = electrical conductivity sensitivity, at T = 28 ± 1 °C, and at atmospheric pressure.

