In-situ Monitoring of Internal Local Temperature and Voltage of Proton Exchange Membrane Fuel Cells

Abstract
:1. Introduction
2. Methodology
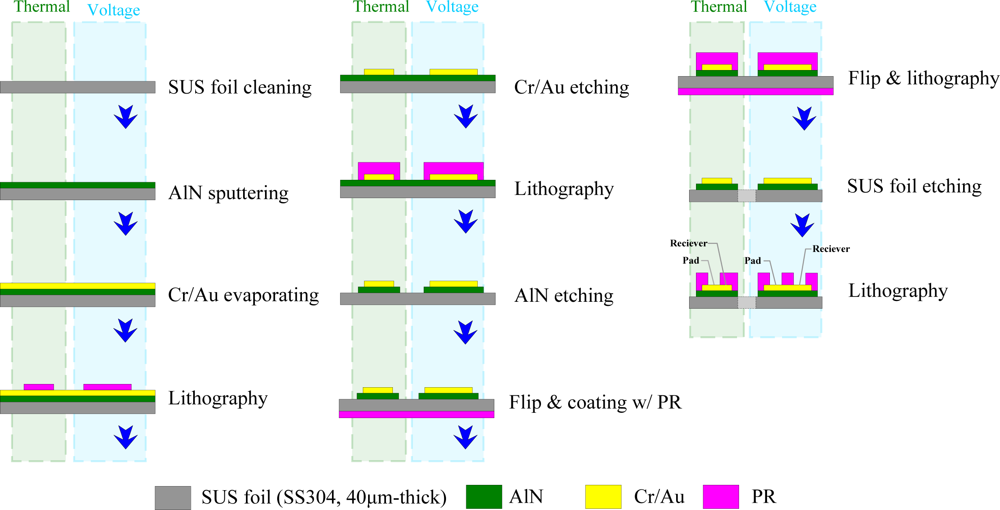
3. Fabrication of Flexible Multi-functional Micro Sensors
4. Results and Discussion
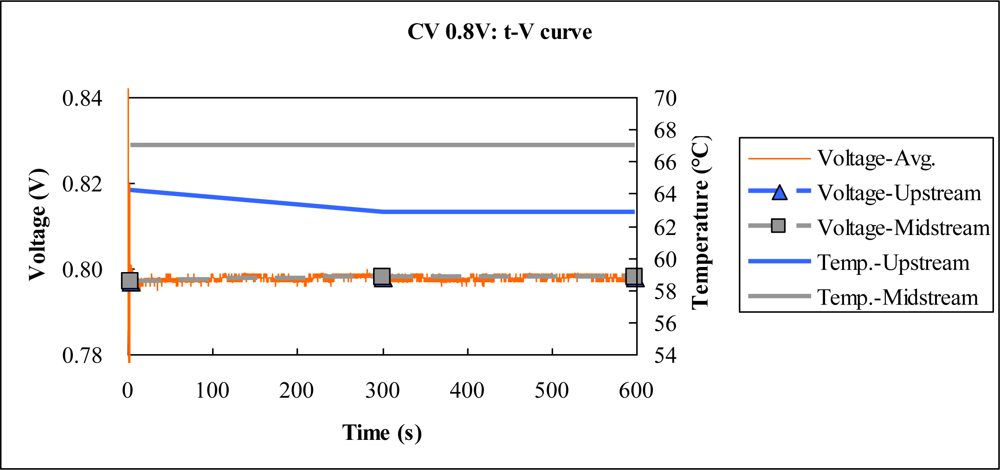
4.1. Constant Voltage Test
4.2. Constant Current Test
4.3. Constant P Test
4.4. Comparison with Polarization Curve
5. Conclusions
Acknowledgments
References
- Mench, MM; He, S; Tadigadapa, S. Thin film temperature sensor for real-time measurement of electrolyte temperature in a polymer electrolyte fuel cell. Sens. Actuat. A 2006, 125, 170–177. [Google Scholar]
- Lee, CY; Wu, GW; Hsieh, CL. In situ diagnosis of micrometallic proton exchange membrane fuel cells using microsensors. J. Power Sources 2007, 172, 363–367. [Google Scholar]
- Wang, M; Guo, H; Ma, C. Temperature distribution on the MEA surface of a PEMFC with serpentine channel flow bed. J. Power Sources 2006, 157, 181–187. [Google Scholar]
- Trabold, TA; Owejan, JP; Jacobson, DL; Arif, M; Huffman, PR. In situ investigation of water transport in an operating PEM fuel cell using neutron radiography: Part 1—Experimental method and serpentine flow field results. Int. J. Heat Mass Transfer 2006, 49, 4712–4720. [Google Scholar]
- Owejan, JP; Trabold, TA; Jacobson, DL; Baker, DR; Hussey, DS; Arif, M. In situ investigation of water transport in an operating PEM fuel cell using neutron radiography: Part 2—Transient water accumulation in an interdigitated cathode flow field. Int. J. Heat Mass Transfer 2006, 49, 4721–4731. [Google Scholar]
- David, NA; Wild, PM; Hu, J; Djilali, N. In-fibre Bragg grating sensors for distributed temperature measurement in a polymer electrolyte membrane fuel cell. J. Power Sources 2009, 192, 376–380. [Google Scholar]
- Liu, Z; Mao, Z; Wu, B; Wang, L; Schmidt, VM. Current density distribution in PEFC. J. Power Sources 2005, 141, 205–210. [Google Scholar]
- Hwang, JJ; Chang, WR; Peng, RG; Chen, PY; Su, A. Experimental and numerical studies of local current mapping on a PEM fuel cell. Int. J. Hydrogen Energy 2008, 33, 5718–5727. [Google Scholar]
- Sun, H; Zhang, GL; Guo, J; Liu, H. A novel technique for measuring current distributions in PEM fuel cells. J. Power Sources 2006, 158, 326–332. [Google Scholar]
- Zhang, G; Guo, L; Ma, B; Liu, H. Comparison of current distributions in proton exchange membrane fuel cells with interdigitated and serpentine flow fields. J. Power Sources 2009, 188, 213–219. [Google Scholar]
- Kaytakoğlu, S; Akyalçın, L. Optimization of parametric performance of a PEMFC. Int. J. Hydrogen Energy 2007, 32, 4418–4423. [Google Scholar]
- Akyalçın, L; Kaytakoğlu, S. Optimization of structural combinations on the performance of a PEMFC’s MEA. J. Power Sources 2008, 180, 767–772. [Google Scholar]
- Lee, CY; Wu, GW; Hsieh, WJ. Fabrication of micro sensors on a flexible substrate. Sens. Actuat. A 2008, 147, 173–176. [Google Scholar]
- Lee, CY; Hsieh, WJ; Wu, GW. Embedded flexible micro-sensors in MEA for measuring temperature and humidity in a micro-fuel cell. J. Power Sources 2008, 181, 237–243. [Google Scholar]
- Wilson, JS. Sensor technology handbook; Butterworth-Heinemann: Boston, MA, USA, 2004. [Google Scholar]


| Items | Conditions |
|---|---|
| Cell temperature | 65 °C |
| Relative humidity (%RH) | 100 % |
| H2 flow rate (Anode) | 120 SCCM (λ = 3x @ 1A/cm2) |
| Air flow rate (Cathode) | 365 SCCM (λ = 3.8x @ 1A/cm2) |
| MEA | E-TEK |
| Bipolar plate/Flow field type | Graphite/Dual-path serpentine |
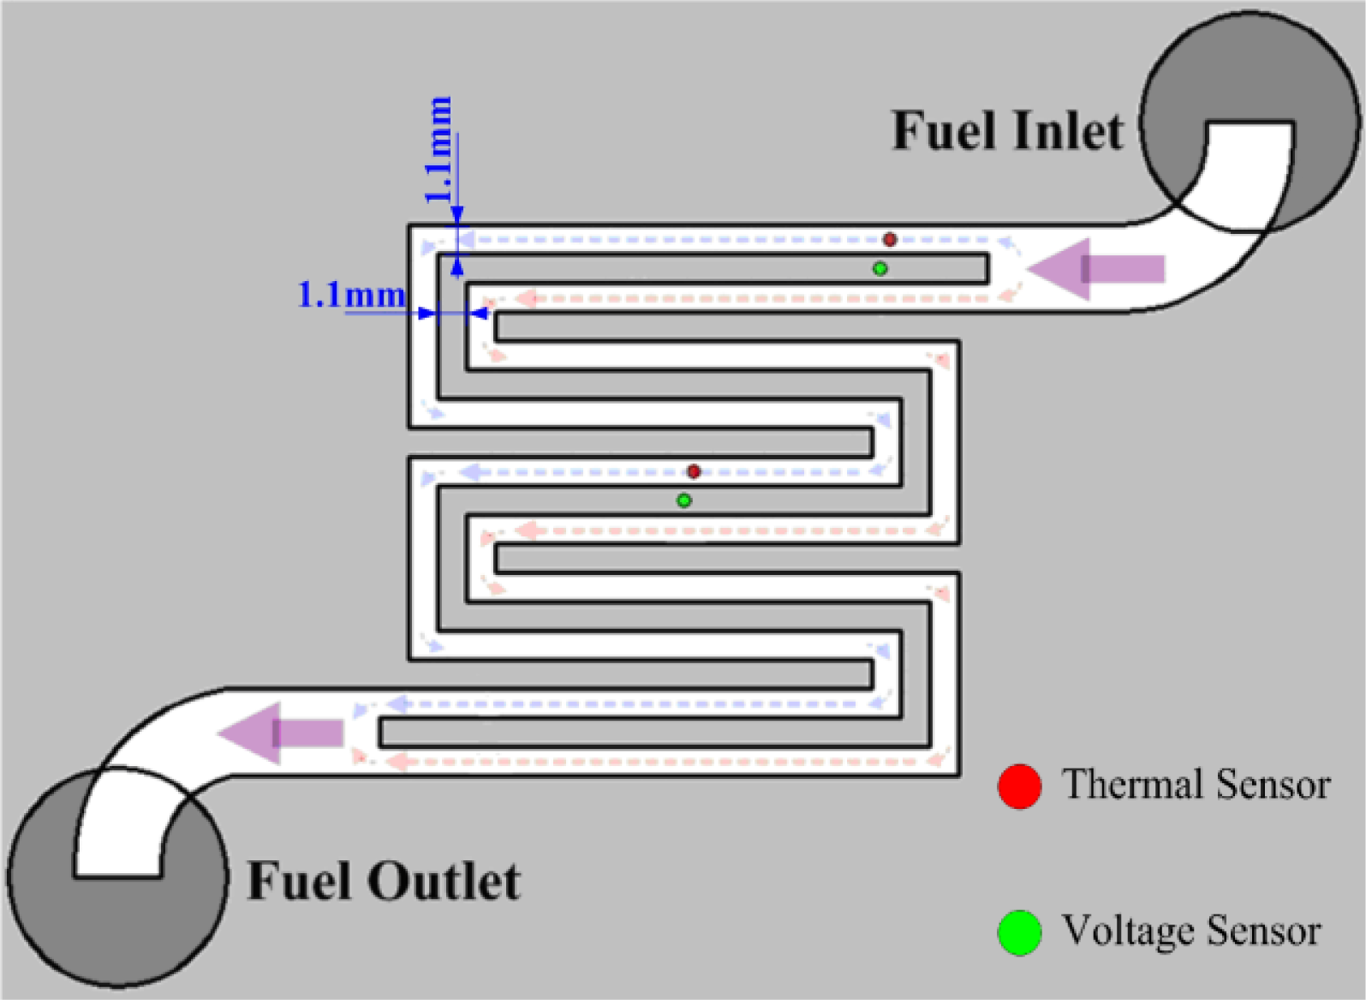
| Flow-channel depth | 1.1 mm |
| Flow-channel width | 1.1 mm |
| Flow-rib width | 1.1 mm |
| Reaction area | 5.29 cm2 |
| Motion | Time |
|---|---|
| Fuel cell heating to 65°C | About 30 minutes |
| Open circuit voltage testing (OCV) | Each 10 minutes |
| CV 0.8V | |
| CV 0.6V | |
| CV 0.4V | |
| CC 2.0A | |
| CC 4.5A | |
| CP 0.5W | |
| CP 1.5W |
| Power density at 0.5 V | Maximum power density | |
|---|---|---|
| Without microsensors | 450 mW/cm2 | 463 mW/cm2 |
| With microsensors | 426 mW/cm2 (degrade 5.3 %) | 420 mW/cm2 (degrade 9.3 %) |
© 2010 by the authors licensee MDPI, Basel, Switzerland. This article is an open access article distributed under the terms and conditions of the Creative Commons Attribution license (http://creativecommons.org/licenses/by/3.0/).
Share and Cite
Lee, C.-Y.; Fan, W.-Y.; Hsieh, W.-J. In-situ Monitoring of Internal Local Temperature and Voltage of Proton Exchange Membrane Fuel Cells. Sensors 2010, 10, 6395-6405. https://doi.org/10.3390/s100706395
Lee C-Y, Fan W-Y, Hsieh W-J. In-situ Monitoring of Internal Local Temperature and Voltage of Proton Exchange Membrane Fuel Cells. Sensors. 2010; 10(7):6395-6405. https://doi.org/10.3390/s100706395
Chicago/Turabian StyleLee, Chi-Yuan, Wei-Yuan Fan, and Wei-Jung Hsieh. 2010. "In-situ Monitoring of Internal Local Temperature and Voltage of Proton Exchange Membrane Fuel Cells" Sensors 10, no. 7: 6395-6405. https://doi.org/10.3390/s100706395