Flame-Made Nb-Doped TiO2 Ethanol and Acetone Sensors

Abstract
: Undoped TiO2 and TiO2 nanoparticles doped with 1–5 at.% Nb were successfully produced in a single step by flame spray pyrolysis (FSP). The phase and crystallite size were analyzed by XRD. The BET surface area (SSABET) of the nanoparticles was measured by nitrogen adsorption. The trend of SSABET on the doping samples increased and the BET equivalent particle diameter (dBET) (rutile) increased with the higher Nb-doping concentrations while dBET (anatase) remained the same. The morphology and accurate size of the primary particles were further investigated by high-resolution transmission electron microscopy (HRTEM). The crystallite sizes of undoped and Nb-doped TiO2 spherical were in the range of 10–20 nm. The sensing films were prepared by spin coating technique. The mixing sample was spin-coated onto the Al2O3 substrates interdigitated with Au electrodes. The gas sensing of acetone (25–400 ppm) was studied at operating temperatures ranging from 300–400 °C in dry air, while the gas sensing of ethanol (50–1,000 ppm) was studied at operating temperatures ranging from 250–400 °C in dry air.1. Introduction
TiO2 is used extensively as a gas sensing material due to its change in electrical conductivity under analyte gas exposure. Sensing capability has been improved with the addition of foreign atoms such as Cr [1], Mo and W [2], Pt and Nb [3], Fe [4], and La and Cu [5]. Nb doping of TiO2 has been used for O2, CO, NO2, and ethanol sensing. Nb doping modifies the microstructure of TiO2, controls grain growth mechanisms, introduces electronic defects at the surface or in the bulk of grains and so modifies TiO2 conductivity and gas sensing. TiO2 presents three crystalline structures: brookite, anatase, and rutile.
The Nb2O5-TiO2 system has been prepared by several methods such as the solid state reaction of Nb2O5 and TiO2 [6–8], sol-gel [9,10], RF-sputtering of thin films [11–13], laser induced pyrolysis [14], pulsed laser deposition [15] and thick film using powder screen printing [16]. The Nb2O5-TiO2 system can be used in applications such as varistors [17], catalysts [18], photocatalysts [19,20], and electrodes applicable to photoelectonic devices such as p-n type solar cells [21] and hybrid solar cells [22]. For gas sensing applications, it has been reported that the Nb2O5-TiO2 system shows higher sensitivity and shorter response time as an oxygen gas sensor than undoped TiO2 [11]. The Nb2O5-TiO2 system can be used for sensing other gases as well, such as CO [23], CO, and ethanol [9,16,24], CO and NO2 [16,24], and ethanol [3]. Table 1 lists literature examples of the use of Nb-TiO2 for gas sensing applications, showing the authors, method of preparation, % Nb, sensing gas, range of detection, type of titania, size, and some remarks.
Comini et al. [3] reported that Nb- and Pt-doped TiO2 thin films could be used for ethanol and methanol sensors. The thin films were prepared using the sol-gel process by the spin coating technique on Al2O3 substrate. The sensors were tested under exposure of ethanol and methanol gases at 300 °C with the concentration ranging from 500–1,250 ppm, making them feasible for development of breath analyzers (detection limit is 200 ppm). The thicknesses of the film were ranging from 60–100 nm. It was noticed that 1 at.% Nb and 0.5 at.% Pt/TiO2 showed the best sensing performance. The TiO2 sensors developed were sensitive at up to 500 ppm of ethanol. The response and recovery dynamics to ethanol were particularly promising for applications in food analysis, electronic noses, and breath analyzers.
In comparison to the same materials, Teleki et al. [16] reported the preparation of a flame-made TiO2 spherical particles film of about 30 μm thickness by drop-coating of a heptanol suspension of these powders, and sensing tests at 500 °C with ethanol at concentrations ranging from 10–75 ppm. The sensor showed the highest sensor signal at 75 ppm (S = 30) ethanol concentration. Secondly, Teleki et al. [23] reported in 2008 the effect on ethanol and CO gas sensing of flame-made Nb- and Cu-doped TiO2 thick film (5 μm) sensors fabricated by doctor-blading. All sensors were tested with gas concentrations ranging from 25–300 ppm during forward and backward cycles at 400 °C. Niobium stabilized the anatase phase and retarded grain growth up to 600 °C. The sensitivity increased by addition of either Cu and Nb to titania, and the best improvement was found for the 4 at.% Nb/TiO2 sensor. Decreasing the Nb concentrations from 10 to 4 at.% increased the response. The response of 10 at.% Nb/TiO2 sensor was high, but the baseline was not stable. The response time decreased with increased ethanol concentration, from 180 to 15 s for 25 and 300 ppm, respectively. The recovery time was very slow, within the 5–10 min range. This, however, decreased with increasing ethanol concentration. The anatase phase seems to be crucial as the Nb/TiO2 sensor showed the highest response while Cu doping had no influence on the response relative to undoped TiO2.
Flame spray pyrolysis (FSP) is a very promising technique for synthesis of high purity nanosized materials with controlled size and high surface area in one step. FSP has been demonstrated to produce high surface area of tin dioxide nanoparticles for gas sensing [24]. The aim of this research was to apply this technique to synthesize niobium-doped TiO2 nanoparticles. Characterization of the nanoparticles and their acetone and ethanol sensing properties were performed.
2. Experimental
2.1. Flame Synthesis of Nanopowders
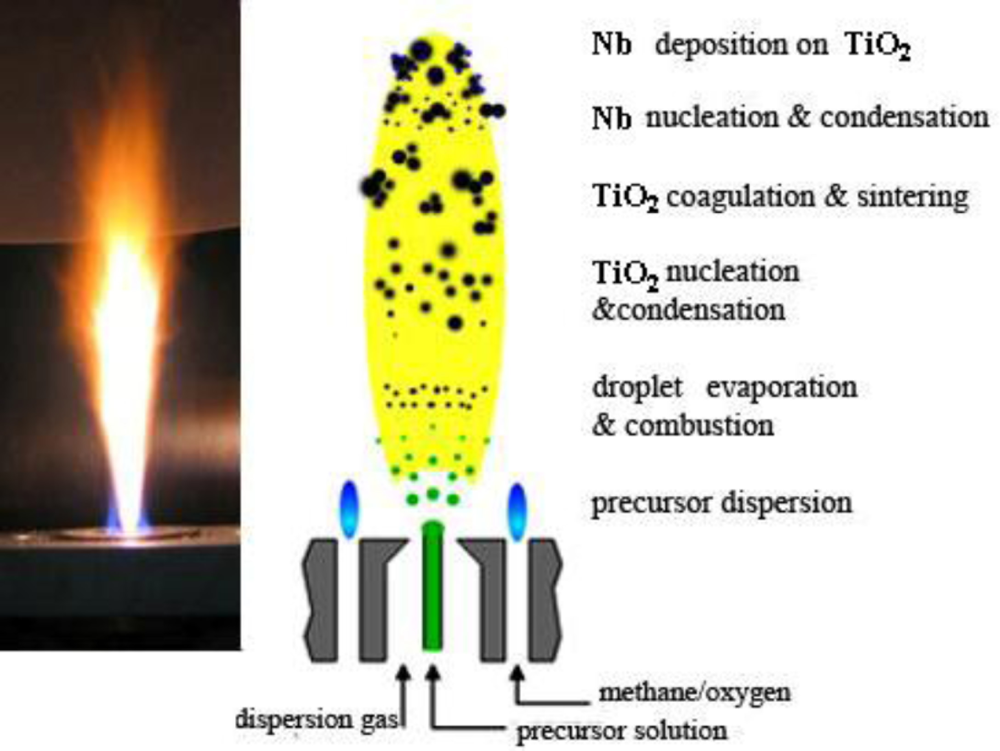
Titanium isopropoxide (Aldrich, 97%) and niobium (IV) 2-ethlyhexanoate (Strem Chemicals) were used as titanium and niobium precursors, respectively. Both precursors were dissolved in xylene (Fluka, >98.5%) and acetonitrile (Fluka, >99.5%) in equal volume with the total metal atom concentration maintained at 0.5 mol/L. The niobium concentration was varied between 1 and 5 at.%. The precursor was fed into a flame spray pyrolysis reactor [24] by a syringe pump (Inotech) with a rate of 5 mL/min and was dispersed into droplets by 5 L/min of oxygen (Pan Gas, purity > 99%) using a gas assisted nozzle. The pressure drop at the nozzle tip was kept at 1.5 bar. The water-cooled system of the reactor avoided any evaporation of the precursor within the liquid feed lines or overheating of the nozzle. The spray flame was maintained by a concentric supporting flamelet ring of premixed methane/oxygen (CH4 1.5 L/min, O2 3.2 L/min). In order to assure the presence of enough oxidant for complete conversion of the reactants, an additional outer oxygen flow (5 L/min) was supplied. The powder was collected with the aid of a vacuum pump (Vaccubrand) on a glass fiber filter (GF/D Whatman, 25.7 cm in diameter). During the experiment, the filter was placed in a water-cooled holder, 40 cm above the nozzle, keeping the off-gas temperature below 200 °C. Scheme 1 shows the formation of Nb-doped TiO2 by flame spray pyrolysis.
2.2. Powder Characterization
X-ray diffraction (XRD) patterns were recorded with a Bruker AXS D8 Advance (40 kV, 40 mA) operating with Cu Kα. The relative amounts of anatase and rutile and their respective crystallite sizes were calculated from the XRD data using the Rietveld method. BET powder-specific surface area (SSA), was measured by nitrogen adsorption at 77 K (Micromeritics Tristar) after degassing the sample for 1 h at 150 °C in nitrogen. The equivalent average primary particle diameter dBET was calculated by dBET = 6/(SSA ρP). Here, ρP is the average density of TiO2 calculated from weight percent and density of anatase and rutile where danatase and drutile are 3.97 g/cm3 and 4.17 g/cm3 respectively. Morphologies of all the flame-made powders were investigated by Transmission Electron Microscopy (TEM, Hitachi H600, operated at 100 kV).
2.3. Paste and Sensor Preparations
An appropriate quantity of homogeneous mixed solution (0.28 mL) was prepared by stirring and heating at 80 °C for 12 h ethyl cellulose (Fluka, 30–70 mPa·s) as the temporary binder and terpineol (Aldrich, 90%) as a solvent. The liquid mixture was combined with 60 mg of samples 1–5 at.% Nb/TiO2 nanopowders and mixed for 30 min to form a paste prior to spin-coating. The resulting paste was firstly spin-coated (700 rpm) 1 time for 10 s, and then subsequently at 3,000 ppm, 2 times for 30 s on the Al2O3 substrates interdigitated with Au electrodes (0.5 × 0.5 cm) to deposit sensing films. The resulting substrates were annealed in an oven at 150 °C for 1 h with an annealing rate of 1 °C/min and at 400 °C for 1 h with an annealing rate of 1 °C/min for binder removal prior to the sensing test.
2.4. Sensor Measurement
The sensor characteristics of the sensing films were determined with acetone (25–400 ppm) and ethanol (50–1,000 ppm). The flow through technique was used to test the gas-sensing properties of sensing films. A constant flux of synthetic air of 2 L/min as gas carrier was flowed to mix with the desired concentration of pollutants dispersed in synthetic air. All measurements were conducted in a temperature-stabilized sealed chamber at 20 °C under controlled humidity. The gas flow rates were precisely manipulated using a computer controlled multi-channel mass flow controller. The external NiCr heater was heated by a regulated DC power supply to different operating temperatures. The operating temperature was varied from 250 °C to 400 °C. The resistances of various sensors were continuously monitored with a computer-controlled system by voltage-amperometric technique with 5 V DC bias and current measurement through a picoammeter. The sensor was exposed to the gas mixed sample for ∼5 min for each gas concentration testing and then the air flux was restored for 15 min. The response (S) is defined in the following as the resistance ratio Ra/Rg [25], where Ra is the resistance in dry air, and Rg is the resistance in the test gas. The response time (Tres) is defined as the time required until 90% of the response signal is reached. The recovery time (Trec) denotes the time needed until 90% of the original baseline signal is recovered [25]. After the sensors fabricated using samples undoped TiO2, 1 at.% Nb/TiO2, 3 at.% Nb/TiO2, and 5 at.% Nb/TiO2 had been tested with varied operating temperatures, they were designated as S0, S1, S3, and S5, respectively.
3. Results and Discussion
3.1. Nanopowder Properties
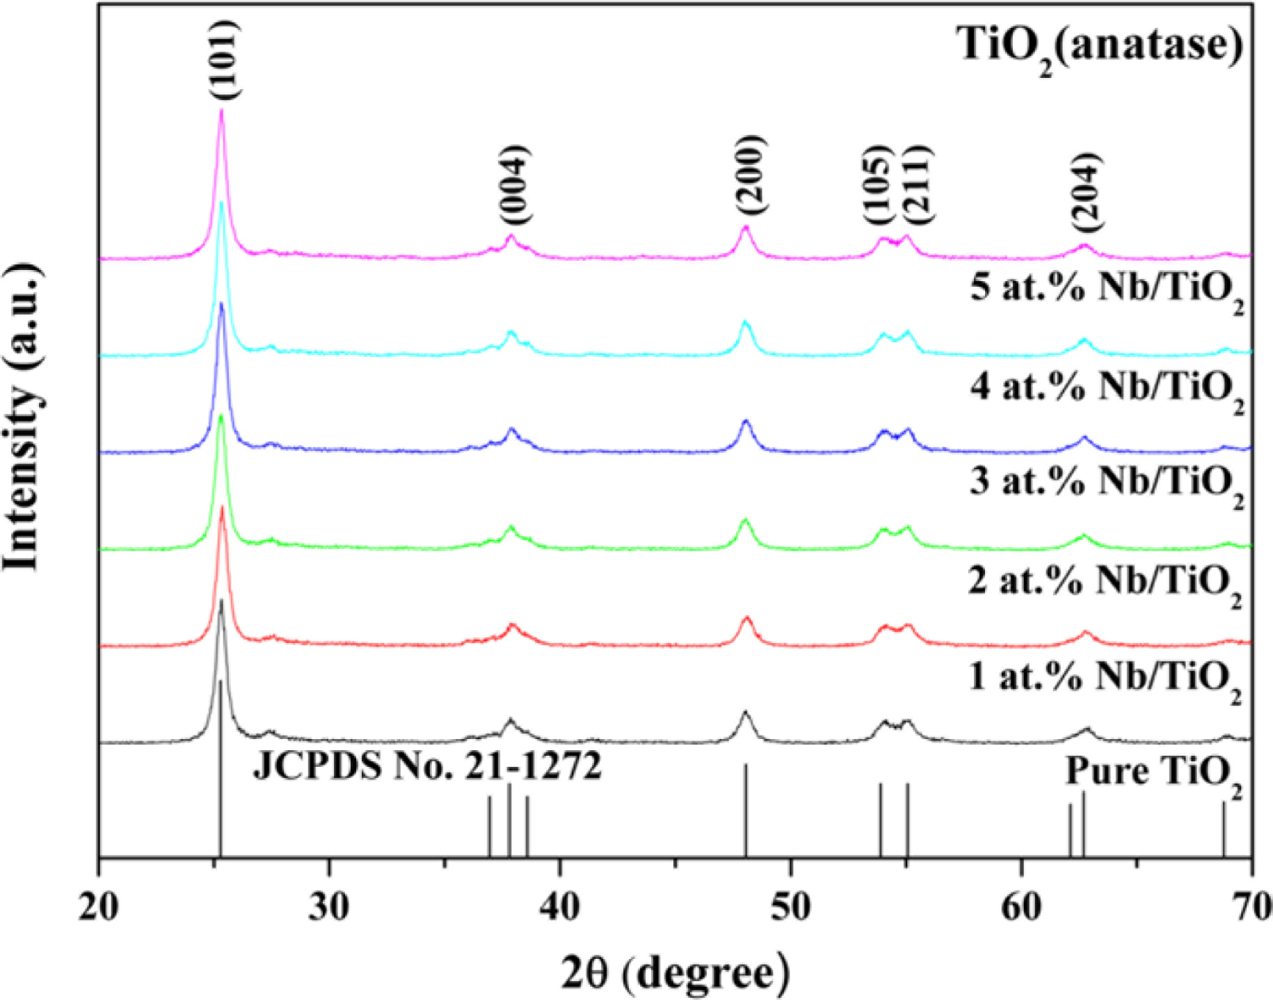
The XRD technique was used to study the relative amounts of anatase and rutile phases and the evolution of crystallite sizes as a function of composition of the flame-made undoped TiO2 and Nb-doped TiO2. Figure 1 shows the XRD patterns of nano-sized undoped TiO2 and 1–5 at.% Nb/TiO2 samples. The nanopowders were highly crystalline, and all peaks can be confirmed to be the anatase phase (JCPDS file no. 21-1272). No amorphous phase and the characteristic peaks attributed to Nb or NbO2 were found in the XRD patterns. It can be assumed that the amount of Nb doping particles was very low, which resulted in non-appearance of the Nb peaks. The relative amounts of anatase and rutile and their respective crystallite sizes were calculated from the XRD data using the fundamental parameter approach Rietveld method [26]. The average crystal sizes (dXRD ave.) were calculated based on the half-maximum widths in Scherrer equation [27] using the TOPAS-3 software, which compared with the average BET-equivalent particle diameter (dBET) as shown in Table 2. The dXRD (rutile) was slightly increased with increasing Nb-doped concentrations. On the other hand, the dXRD (anatase) decreased with increasing Nb-doping concentrations. The rutile weight fraction percentage and dBET remained almost the same with increasing Nb concentrations. It can be concluded from Table 2 that (1) dXRD anatase were smaller than dXRD rutile (2) dBET and dXRD anatase were not affected by the amount of dopant but dXRD rutile were.
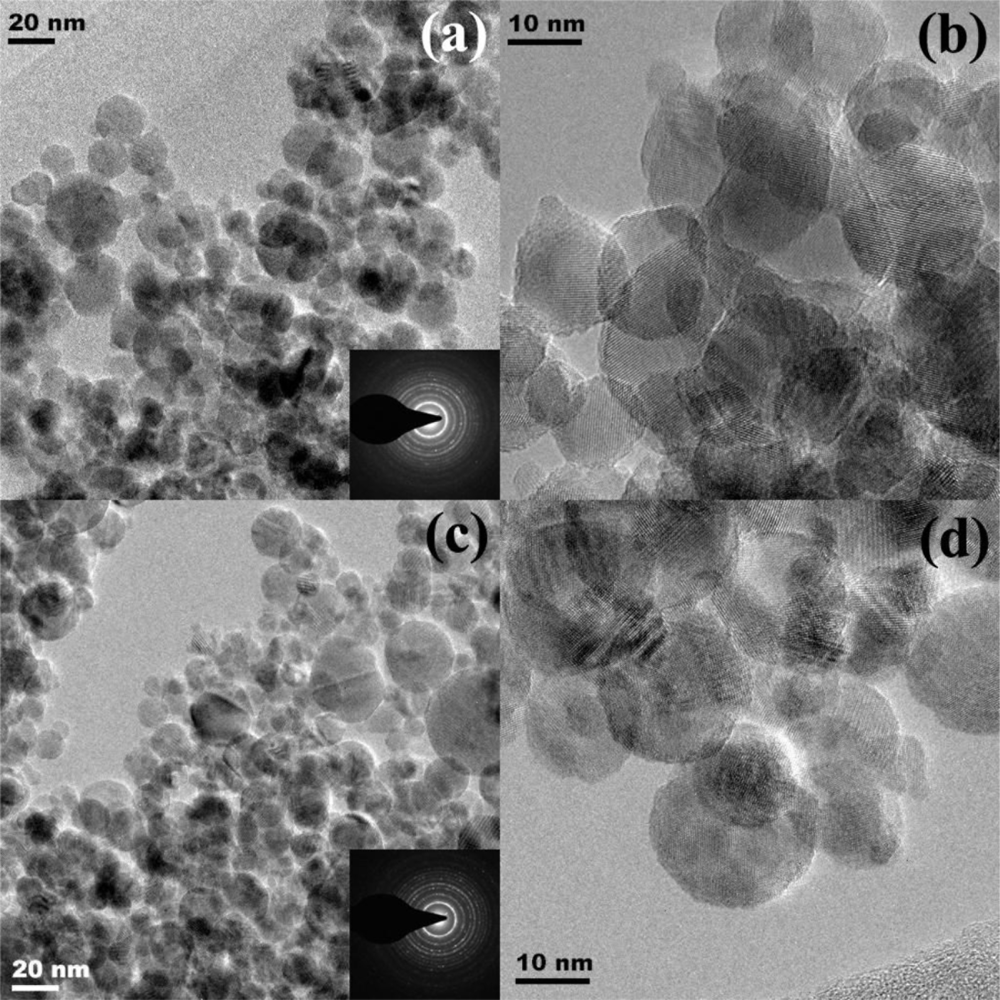
Figure 2 shows HR-TEM bright-field images of (a,b) undoped TiO2 and (c,d) 5 at.% Nb/TiO2 nanoparticles with different magnifications. The corresponding diffraction patterns were shown in the insets. Both samples were highly crystalline as seen from the intense electron diffraction patterns (Figure 2(a,c): insets), which were in good agreement with the XRD data. Figure 2(a–d) show the TEM bright-field images of the FSP-made (5/5) nanoparticles, which were aggregated of primary particles. Nb-doped TiO2 nanopowder formed Ti1−xNbxO2 with a fully solid solution due to diffusion of Nb atom into the TiO2 nanoparticles because Nb4+ has a similar ionic radius (0.64 Å) to Ti4+ (0.605 Å). Teleki et al. [23] reported that niobium was partly incorporated in the titania lattice promoting anatase formation.
Figures 2(a,b) show the morphologies of flame-made (5/5) undoped TiO2 and 5 at.% Nb/TiO2 nanoparticles containing spherical nanoparticles with average diameters of 13 and 11 nm, respectively. The primary particle diameters observed by TEM were consistent with both the dBET and the dXRD. Particularly, the lattice fringes of 5 at.% Nb/TiO2 nanoparticles were also clearly visible in a HRTEM image at higher magnification (Figures 2(b,d)). TEM bright-field images can reveal internal structure and a more accurate measurement of particle size and morphology.
3.2. Gas Sensing Properties
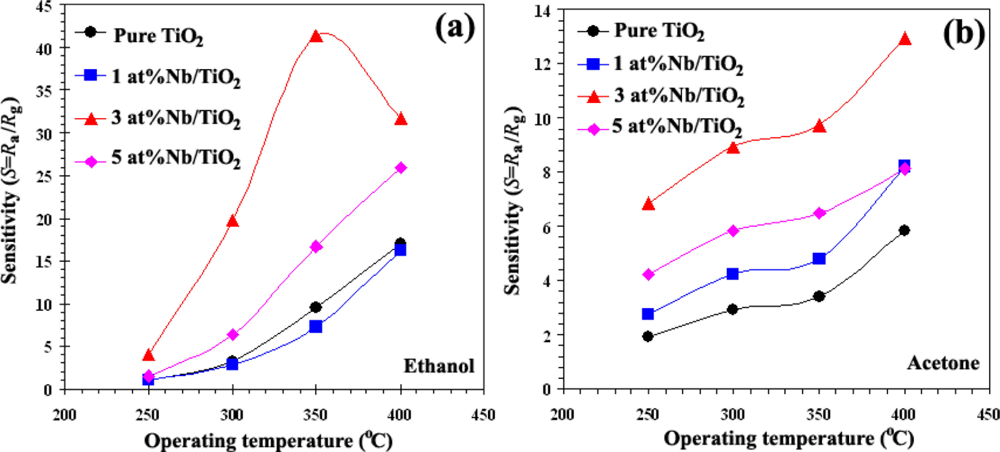
The gas sensitivity is usually dependent on the sensor operating temperature and the dopant. Figure 3 shows the response as a function of sensor operating temperature for undoped and doped with different Nb concentrations (1, 3, and 5 at.% Nb) for ethanol (Figure 3(a)) and acetone (Figure 3(b)) vapors in dry air atmosphere. The measurement of the resistance vs. temperature (R/T) profile of undoped TiO2 sensor revealed a strong temperature dependence of their resistance and quite low response. It was evident from these results that the response of the undoped sensor (S0) was very poor compared to the doped sensors in different concentration concentrations. With 3 at.% Nb doped TiO2 sensor (S3), the sensor showed maximum response to ethanol vapor at an operating temperature of 350 °C for sensor S3 and 400 °C for the other sensors, and for acetone vapor maximum sensitivity at an operating temperature of 400 °C for all sensors. The best sensitivities can be seen at the highest concentration of gases (to 1,000 ppm; Seth = 41.4 (350 °C), Seth = 31.7 (400 °C), to 400 ppm, Sacet = 13.0) and response time was extremely fast about 1 s (400 °C) and 9 s (350 °C) for ethanol vapor and of about 33 s for acetone vapor. On the other hand, the response decreased at higher Nb concentration (5 at.% Nb/TiO2; S5). Further increase of the dopant concentration decreased the ethanol and acetone sensitivity and deteriorated the response time. The optimum concentration of Nb doping on TiO2 sensor was found to be 3 at.% Nb. Possibly a segregated Nb phase was formed on the surface at a higher Nb content (5 at.% Nb/TiO2). For low Nb content (3 at.%), Nb nanoparticles are very small compared to TiO2 nanoparticles and they can be well dispersed on TiO2 nanoparticles. Thus, Nb nanoparticles are very effective catalyst. In contrast, larger Nb nanoparticles, which are formed at higher Nb contents, cannot be well dispersed and cause possible separation among TiO2 nanoparticles. Therefore, catalytic action of Nb becomes considerably less effective. This is the reason why the gas sensitivity decreases significantly at the higher Nb content of 5 at.%.
Traversa et al. [9] reported a solubility of up to 5 at.% Nb in anatase TiO2. They attributed this to small segregated crystalline domains of niobia (Nb2O5), which were not visible in the TEM bright-field images (Figure 2). Our results agreed well with those of Comini et al. [28] showing that Nb doping improved the response to ethanol with respect to undoped TiO2. Teleki et al. [23] reported that 4 at.% Nb/TiO2 showed higher response towards 25–300 ppm ethanol than 10 at.% Nb/TiO2 at 400 °C.
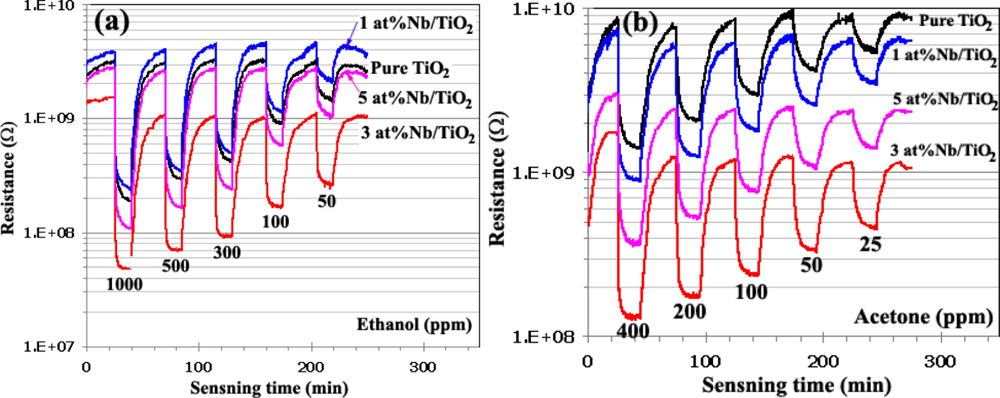
Figures 4(a,b) show the change in resistance of sensor S0 (Undoped TiO2), S1(1 at.% Nb/TiO2), S3 (3 at.% Nb/TiO2), and S5 (5 at.% Nb/TiO2) under exposure to reducing gas ethanol (Figure 4(a)) and acetone (Figure 4(b)) at the concentration ranging from 50–1,000 ppm and 25–400 ppm, respectively with the same operating temperature of 400 °C during the backward cycle. The original baseline (dry air) of ethanol sensing was stable during the sensing test. The resistance drastically decreased during the gas exposure with increasing VOC analyte gas concentration, typical for anatase TiO2 as an n-type semiconductor. Nb-doped TiO2 could exhibit a stronger n-type character and a higher electronic conductivity than undoped TiO2 as the electron concentration in the titania lattice might increase and the Fermi level might be shifted closer to the conduction band level. The stabilized original baselines of sensors led to sensor response accuracy in terms of sensitivity and response time detection. The base-resistance of the sensor S3 (3 at.% Nb/TiO2) was the lowest compared to the other sensors. This is because the sensor S3 had the appropriate amount of concentration and also could perform the sensing properties on the surface and by bulk interaction. The gas sensing behavior of semiconducting oxide sensors could be attributed to both regions of surface and bulk interactions, depending on the small grain size and the appropriate thickness of sensing films. The effects of a high conductivity of the sensor are described clearly from the interactions between VOCs gases and the surface-absorbed oxygen species such as peroxide ion and superoxide ion . These reactions produce more electrons and thus increased the conductivity of TiO2 upon exposure to ethanol and acetone vapor.
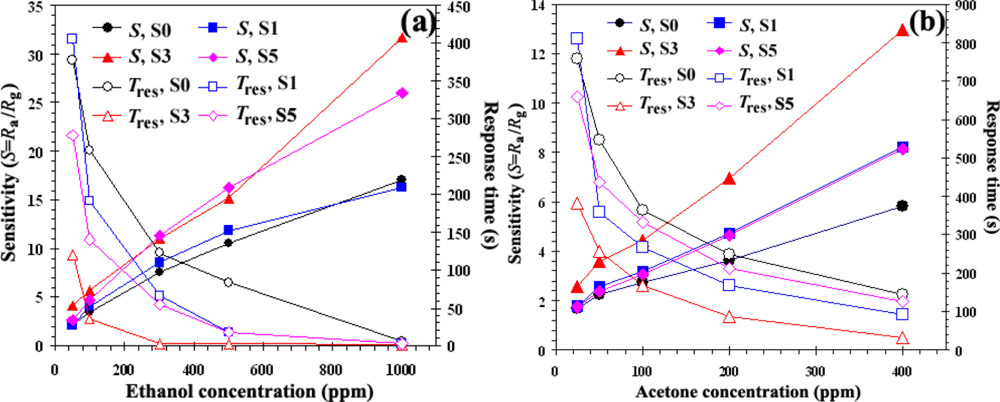
Figures 5(a,b) show the plots of response (S) and response times (Tres) versus the ethanol and acetone vapor concentrations ranging from 50–1,000 ppm and 25–400 ppm plot for the sensors S0, S1, S3, and S5 during the backward cycle at the operating temperature of 400 °C. Because the particle size of TiO2 was in the nanometer range and Nb is known as an excellent catalyst for VOC gases, we paid close attention to the gas sensing activity of this material. From the data, the response of all Nb doping concentrations (S1, S3, and S5) appeared to be higher than that of an undoped TiO2 sensor (S0). The response of both gases (filled symbols, left axis) increased linearly and the response time (open symbols, right axis) decreased drastically with increasing ethanol and acetone concentrations. Moreover, it was found that the 3 at.% Nb concentration (S3) sensor showed the best sensing performance in terms of response (S = 31.7) and response time. The response time of 3 at.% Nb/TiO2 sensor (S3) for 1,000 ppm at 400 °C was very fast—within 1 s (open triangles, right axis)—which was better than that of undoped TiO2 (6 s) (open circles, right axis) and other doping concentrations (1 at.% Nb/TiO2 = 3 s (open rectangles, right axis), and 5 at.% Nb/TiO2 = 2 s (open diamonds, right axis)). The fast response time suggests a surface controlled sensing mechanism, where a steady-state adsorption of ethanol and desorption of CO2 [25] on the sensing films was rapidly reached. This is the common interaction between the reducing gas ethanol and surface-adsorbed oxygen species of sensing layer including ethanol with those of its oxidation products (CO2 and H2O) versus times in dry air. This is because CO2 was the majority product oxidized with oxygen on the surface of semiconductor materials. This indicates a partial combustion of ethanol to CO2 and H2O, as well as a release of ethoxides formed during the adsorption of ethanol on the sensing surface. Also, Nb possible increases the number of surface-adsorbed oxygen species, thus promoting reaction sizes for CO oxidations. Teleki et al. [23] reported the response of 30 with response time of 375 seconds towards 75 ppm ethanol at 500 °C for undoped TiO2 sensing film by the drop-coating technique.
With the acetone response, the sensing performances were lower than for ethanol vapor in terms of the sensor response, sensitivity, and response time. It was noticed that the Nb concentration (3 at.%; S3) sensor showed the best sensing performance at an operating temperature of 400 °C for the highest acetone concentration to 400 ppm in terms of response (S = 13.0) and response time. The response time of acetone sensors were with a few minutes. The best response time of 3 at.% Nb/TiO2 sensor (S3) for 400 ppm at 33 s which was better than undoped TiO2 (147 s) (open circles, right axis) and the other doping concentrations (1 at.% Nb/TiO2 = 93 s (open rectangles, right axis), and 5 at.% Nb/TiO2 = 126 s (open diamonds, right axis)). The response time of 3 at.% Nb/TiO2 sensor (S3) for 400 ppm at 400 °C was slightly sluggish compared to 300 ppm of an ethanol (2 s) (Figure 5(a), open triangles, right axis) sample. Doping the TiO2 with 3 at.% Nb resulted in a much steeper calibration curve and the highest sensor signal compared to undoped TiO2 (see Figures 5(a,b)). The higher sensor signal and especially the higher response (i.e., the steeper response curve) increased sensor performance.
4. Conclusions
FSP was successfully used for the preparation of undoped TiO2 and 1–5 at.% Nb/TiO2 nanopowders for application to acetone and ethanol gas sensing. The trend of SSABET on the doping samples increased and the dXRD (rutile) increased with the higher Nb-doping concentrations while dBET remained almost the same. Nb could form a solid solution in the crystal structure of TiO2 due to the fact the size of Nb5+ (0.64 Å) is similar to that of Ti+4 (0.605 Å), thus the size of particles in the doping samples were not affected by Nb atoms as shown from the HRTEM. The crystallite sizes of undoped and Nb-doped TiO2 spherical were in the 10–20 nm range. The gas sensing of acetone (25–400 ppm) was studied at operating temperatures ranging from 300–400 °C in dry air while the gas sensing of ethanol (50–1,000 ppm) was studied at operating temperatures ranging from 250–400 °C in dry air. The 3 at.% Nb-dispersed on TiO2 sensing film showed a response of 31.7 and a very fast response time of 1 second towards 400 ppm ethanol, as compared to an undoped TiO2 sensing film. The 3 at.% Nb-dispersed on TiO2 sensing film also showed a response of 13 and a response time of 33 seconds towards 400 ppm acetone. The response times in our study were faster than the previously reported values [16,23]. The highest responses for acetone and ethanol occurred at 400 and 350 °C, respectively.
Acknowledgments
The authors would like to gratefully acknowledge the financial support from National Research University Project under the Office of the Higher Education Commission, Ministry of Education, Thailand; Particle Technology Laboratory, ETH, Zurich, Switzerland for the experimental facilities, and the NECTEC laboratory for the sensor experiments. One of the authors (S.P.) would like to thank Swiss Federal Institute of Technology, Zurich for providing an ETH Fellowship.
References
- Dawson, D.H.; Henshaw, G.S.; Williams, D.E. Description and characterization of a hydrogen sulfide gas sensor based on Cr2-yTiyO3+x. Sens. Actuat. B-Chem 1995, 26–27, 76–80. [Google Scholar]
- Bregani, F.; Casale, C.; Depero, L.E.; Natali-Sora, I.; Roba, D.; Sangaletti, L.; Toledo, G.P. Temperature effects on the size of anatase crystalline in Mo-TiO2 and W-TiO2 powders. Sens. Actuat. B-Chem 1996, 31, 25–28. [Google Scholar]
- Comini, E.; Faglia, G.; Sberveglieri, G.; Li, Y.X.; Wlodarski, W.; Ghantasala, M.K. Sensitivity enhancement towards ethanol and methanol of TiO2 films doped with Pt and Nb. Sens. Actuat. B-Chem 2000, 64, 169–174. [Google Scholar]
- Comini, E.; Guidi, V.; Frigeri, C.; Ricco, I.; Sberveglieri, G. CO sensing properties of titanium and iron oxide nanosized thin films. Sens. Actuat. B-Chem 2001, 77, 16–21. [Google Scholar]
- Ruiz, A.M.; Cornet, A.; Monrante, J.R. Study of La and Cu influence on the growth inhibition and phase transformation of nano-TiO2 used for gas sensors. Sens. Actuat. B-Chem 2004, 100, 256–260. [Google Scholar]
- Sharma, R.K.; Bhatnagar, M.C.; Sharma, G.L. Effect of Nb metal in TiO2 oxygen gas sensor. Appl. Surf. Sci 1996, 92, 647–650. [Google Scholar]
- Sharma, R.K.; Bhatnagar, M.C.; Sharma, G.L. Mechanism in Nb doped titania oxygen gas sensor. Sens. Actuat. B-Chem 1998, 46, 194–201. [Google Scholar]
- Ruiz, A.; Dezanneau, G.; Arbiol, J.; Cornet, A.; Monrante, J.R. Study of the influence of Nb content and sintering temperature on TiO2 sensing films. Thin Solid Films 2003, 436, 90–94. [Google Scholar]
- Traversa, E.; Di Vona, M.L.; Licoccia, S.; Sacerdoti, M.; Carotta, M.C.; Crema, L.; Martinelli, G. Sol-gel processed TiO2-based nano-sized powders for use in thick film gas sensors for atmospheric pollutant monitoring. J. Sol-Gel Sci. Technol 2001, 22, 167–179. [Google Scholar]
- Elezović, N.R.; Babić, B.M.; Gajić-Krstajić, L.; Radmilović, V.; Krstajić, N.V.; Vraćar, L.J. Synthesis, characterization and electrocatalytical behavior of Nb-TiO2/Pt nanocatalyst for oxygen reduction reaction. J. Power Sources 2010, 195, 3961–3968. [Google Scholar]
- Zakrzewska, K.; Radecka, M.; Rekas, M. Effect of Nb, Cr, Sn additions on gas sensing properties of TiO2 thin films. Thin Solid Films 1997, 310, 161–166. [Google Scholar]
- Ishida, T.; Okada, M.; Tsuchiya, T.; Murakami, T.; Nakano, M. Structural and surface property study of sputter deposited transparent conductive Nb-doped titanium oxide films. Thin Solid Films 2010. in press.. [Google Scholar]
- Yamada, N.; Hitosugi, T.; Kasai, J.; Hoang, N.L.H.; Nakao, S.; Hirose, Y.; Shimada, T.; Hasegawa, T. Transparent conducting Nb-doped anatase TiO2 (TNO) thin films sputtered from various oxide targets. Thin Solid Films 2010, 518, 3101–3104. [Google Scholar]
- Bonini, N.; Carotta, M.C.; Chiorino, A.; Martinelli, G.F.; Ronconi, M.; Traversa, E.S. Doping of a nanostructured titania thick film: Structural and electrical investigations. Sens. Actuat. B-Chem 2000, 68, 274–280. [Google Scholar]
- Tonooka, K.; Chiu, T.-W.; Kikuchi, N. Preparation of transparent conductive TiO2: Nb thin films by pulsed laser deposition. Appl. Surf. Sci 2009, 255, 9695–9698. [Google Scholar]
- Teleki, A.; Pratsinis, S.E.; Kalyanasundaram, K.; Gouma, P.I. Sensing of organic vapors by flame-made TiO2 nanoparticles. Sens. Actuat. B-Chem 2006, 119, 683–690. [Google Scholar]
- Li, C.P.; Wang, J.F.; Su, W.B.; Chen, H.C.; Wang, Y.J.; Zhuang, D.X. Effect of sinter temperature on the electrical properties of TiO2-based capacitor-varistors. Mater. Lett 2003, 57, 1400–1405. [Google Scholar]
- Papageorgiou, D.; Vamvouka, D.; Boudouvas, D.; Verykios, X.E. Oxidative coupling of methane to C2 hydrocarbons over titania- based catalysts. Catal. Today 1992, 13, 391–400. [Google Scholar]
- Karvinen, S. The effects of trace elements on the crystal properties of TiO2. J. Sol-Gel Sci. Technol 2003, 19, 811–819. [Google Scholar]
- Castro, A.L.; Nunes, M.R.; Carvalho, M.D.; Ferreira, L.P.; Jumas, J.-C.; Costa, F.M.; Florêncio, M.H. Doped titanium dioxide nanocrystalline powders with high photocatalytic activity. J. Solid State Chem 2009, 182, 1838–1845. [Google Scholar]
- Lin, H.; Kozuka, H.; Yoko, T. Electrical properties of transparent doped oxide films. J. Sol-Gel Sci. Technol 2000, 19, 529–532. [Google Scholar]
- Lira-Cantu, M.; Siddiki, M.K.; Muñoz-Rojas, D.; Amade, R.; González-Pech, N.I. Nb-TiO2/polymer hybrid solar cells with photovoltaic response under inert atmosphere conditions. Sol. Energ. Mater. Sol. Cell 2010, 94, 1227–1234. [Google Scholar]
- Teleki, A.; Bjelobrk, N.; Pratsinis, S.E. Flame-made Nb- and Cu-doped TiO2 sensors for CO and ethanol. Sens. Actuat. B-Chem 2008, 130, 449–457. [Google Scholar]
- Sahm, T.; Mädler, L.; Gurlo, A.; Barsan, N.; Pratsinis, S.E.; Weimar, U. Flame spray synthesis of tin oxide nanoparticles for gas sensing. Sens. Actuat. B-Chem 2004, 98, 148–153. [Google Scholar]
- Liewhiran, C.; Phanichphant, S. Improvement of flame-made nanoparticulate thick film morphology for ethanol sensing. Sensors 2007, 7, 650–675. [Google Scholar]
- Cheary, R.W.; Coelho, A.A. Axial divergence in a conventional X-ray powder diffractometer. I. Theoretical foundations. J. Appl. Crystallogr 1998, 31, 851–861. [Google Scholar]
- Cullity, B.D. Structure of polycrystalline aggregates. In Elements of X-ray Diffraction; Addison Wesley: Boston, MA, USA, 1978; Volume 2, Chapter 9,; p. 284. [Google Scholar]
- Comini, E.; Ferroni, M.; Guidi, V.; Vomiero, A.; Merli, P.G.; Morandi, V.; Sacerdoti, M.; Della Mea, G.; Sberveglieri, G. Effects of Ta/Nb-doping on titania-based thin films for gas sensing. Sens. Actuat. B-Chem 2005, 108, 21–28. [Google Scholar]


| Authors | Method | % Nb | Gas | Range | Titania | Size | Remarks |
|---|---|---|---|---|---|---|---|
| Sharma et al. [7] | Thick film using screen printing of powder at 1,300 °C for 5 h | 0, 0.2, 0.4 wt.% Nb | O2 | 1,200 ppm Nb-doped 1,000 ppm Cr-doped | Rutile | 0.7 mm Nb-doped, 1–5μm Cr-doped | Highest sensitivity of Nb-doped at 550 °C and Cr-doped at 700 °C |
| Bonini et al. [16] | Laser induced Pyrolysis powders Screen printing at 650–1,050 °C | 10 at.% Nb, Ta, Ga | CO NO2 | 100 ppm | Anatase + rutile | 50–150 nm | Addition of dopants inhibits grain growth and hinders conversion of anatase to rutile |
| Ruiz et al. [8] | Sol-gel powders | 0, 2, 4, 6, 8, 10 at.% | CO EtOH | CO 0–1,000 ppm EtOH 0–150 ppm | Rutile 100% (0 at.% Nb) Anatase 87% (10 at.% Nb) | 8.5 nm (6 at.%Nb) 10 nm (10 at.%·Nb) | CO sensitivity increases with addition of Nb, EtOH is slightly inhibited |
| Traversa et al. [9] | Sol-gel powders, Screen printing | 0, 5, 10 at.% Nb, Ta | CO | 0.5 ppm | Anatase (400 °C) Rutile(850 °C) | 200–600 nm | Ta and Nb inhibit anatase to rutile transformation |
| Teleki et al. [16] | FSP | undoped | EtOH | 1–75 ppm | Anatase + rutile | 20–50 nm | Highest sensor signal at 75 ppm (S = 30) |
| Teleki et al. [23] | FSP | 4, 10 at.% | CO EtOH | 25–300 ppm | Anatase + rutile | 4 at.% Nb gave higher sensitivity towards EtOH at 400 °C | |
| at.% Nb | Anatase (wt.%) | dXRD, Anatase (nm) | Rutile (wt.%) | dXRD, Rutile (nm) | dBET (nm) |
|---|---|---|---|---|---|
| 0 | 86.3 | 17.9 | 13.7 | 12.5 | 15.0 |
| 1 | 86.7 | 17.5 | 13.3 | 10.9 | 14.1 |
| 2 | 88.1 | 17.7 | 11.9 | 11.3 | 14.0 |
| 3 | 90.5 | 18.1 | 9.5 | 13.6 | 14.3 |
| 4 | 90.9 | 18.8 | 9.1 | 14.3 | 14.8 |
| 5 | 93.4 | 17.3 | 6.6 | 15.2 | 14.4 |
© 2011 by the authors; licensee MDPI, Basel, Switzerland. This article is an open access article distributed under the terms and conditions of the Creative Commons Attribution license (http://creativecommons.org/licenses/by/3.0/).
Share and Cite
Phanichphant, S.; Liewhiran, C.; Wetchakun, K.; Wisitsoraat, A.; Tuantranont, A. Flame-Made Nb-Doped TiO2 Ethanol and Acetone Sensors. Sensors 2011, 11, 472-484. https://doi.org/10.3390/s110100472
Phanichphant S, Liewhiran C, Wetchakun K, Wisitsoraat A, Tuantranont A. Flame-Made Nb-Doped TiO2 Ethanol and Acetone Sensors. Sensors. 2011; 11(1):472-484. https://doi.org/10.3390/s110100472
Chicago/Turabian StylePhanichphant, Sukon, Chaikarn Liewhiran, Khatcharin Wetchakun, Anurat Wisitsoraat, and Adisorn Tuantranont. 2011. "Flame-Made Nb-Doped TiO2 Ethanol and Acetone Sensors" Sensors 11, no. 1: 472-484. https://doi.org/10.3390/s110100472