Effect of TiO2 on the Gas Sensing Features of TiO2/PANi Nanocomposites

Abstract
: A nanocomposite of titanium dioxide (TiO2) and polyaniline (PANi) was synthesized by in-situ chemical polymerization using aniline (ANi) monomer and TiCl4 as precursors. SEM pictures show that the nanocomposite was created in the form of long PANi chains decorated with TiO2 nanoparticles. FTIR, Raman and UV-Vis spectra reveal that the PANi component undergoes an electronic structure modification as a result of the TiO2 and PANi interaction. The electrical resistor of the nanocomposite is highly sensitive to oxygen and NH3 gas, accounting for the physical adsorption of these gases. A nanocomposite with around 55% TiO2 shows an oxygen sensitivity of 600–700%, 20–25 times higher than that of neat PANi. The n-p contacts between TiO2 nanoparticles and PANi matrix give rise to variety of shallow donors and acceptor levels in the PANi band gap which enhance the physical adsorption of gas molecules.1. Introduction
New materials with exceptional properties are urgently needed to satisfy the increasing demands coming from the electronic, photoelectronic and nanoelectronic industries [1–3]. The combination of organic and inorganic materials with different nature has been proposed as an effective approach to access complementary properties and synergetic effects [4–8]. Polyaniline (PANi), a typical semiconducting polymer with good environmental stability and usually considered as p-type semiconductor, has a variety of potential applications for lightweight battery electrodes, electro-magnetic shielding devices, anticorrosion coatings, and sensors [9]. The conductivity of PANi can be tuned by electrochemical redox, reversible acid/base doping/dedoping and it is then sensitive to environmental changes [10,11]. PANi is a type of material exhibiting sensing features at room temperature and convenient operation and therefore is an attractive prospect for the development of a variety of gas sensors. The properties of PANi, including its sensing characteristics, are found to be modified by dopants or by the interface interaction in a composite [12–14].
Titanium dioxide (TiO2), a typical oxide metal and n-type semiconductor exhibits interesting photocatalytic and electronic properties which has opened many promising applications in photo-voltaics, photocatalysis, photo-electrochromics and sensors [15–17]. TiO2, especially in the anatase form, can oxidize organic materials directly due to its strong oxidative activity, therefore the presence of TiO2 in the PANi matrix could cause some modifications and bring about new interesting properties, including sensing features. Based on these assumptions, an attempt was carried out to investigate the effect of TiO2 on the gas sensing characteristics of a TiO2/PANi nanocomposite synthesized by in-situ chemical polymerization.
2. Experimental Section
Aniline 99.5% (ANi), TiCl4 (Aldrich) and ammonium persulphate (APS, Kanto Chemical Co. Inc.) were used as starting materials to synthesize TiO2/PANi nanocomposites. All the materials were used as received. The procedure was carried out as follows: a solution of 40 mM TiCl4 was heated to 70–80 °C for 2 hours to make a sol of TiO2. The pH of the resulting solution after cooling down to room temperature was around 1.0 due to the formation of HCl. The TiO2 sol was then treated with a solution of 0.1 M aniline and 1.0 M HCl with different volumetric ratios. Then, a solution of 0.1 M ammonium persulphate with 1.0 M HCl used as an oxidant was added dropwise to the ANi and TiO2 sol mixture. The color of the solution gradually changed to blue, dark blue and dark green color, indicating the polymerization of PANi was occurring in the solution. After 2 hours the dark green deposited materials (TiO2/PANi nanocomposite) were filtered out, washed repeatedly with distilled water, rinsed in 1.0 M HCl solution and dried under vacuum. The nanocomposite morphology was characterized using FESEM (Hitachi-S4800) and TEM (Jeol) while the chemical and electronic structure was analyzed by FTIR, Raman spectroscopy (Nicolet 6700 NRX FT-Raman Module Spectrometer) and UV-Vis spectroscopy (Cary IE Varian). The gas sensitivity of TiO2/PANi composite was determined as its electrical resistor variation upon exposure to two kinds of gas with different chemical nature, namely oxygen O2 (an oxidizing agent) and ammonium NH3 (a reducing agent). The test TiO2/PANi layers were coated on interdigital Pt electrodes and the layer resistor changes were acquired and analyzed by a personal computer.
3. Results and Discussion
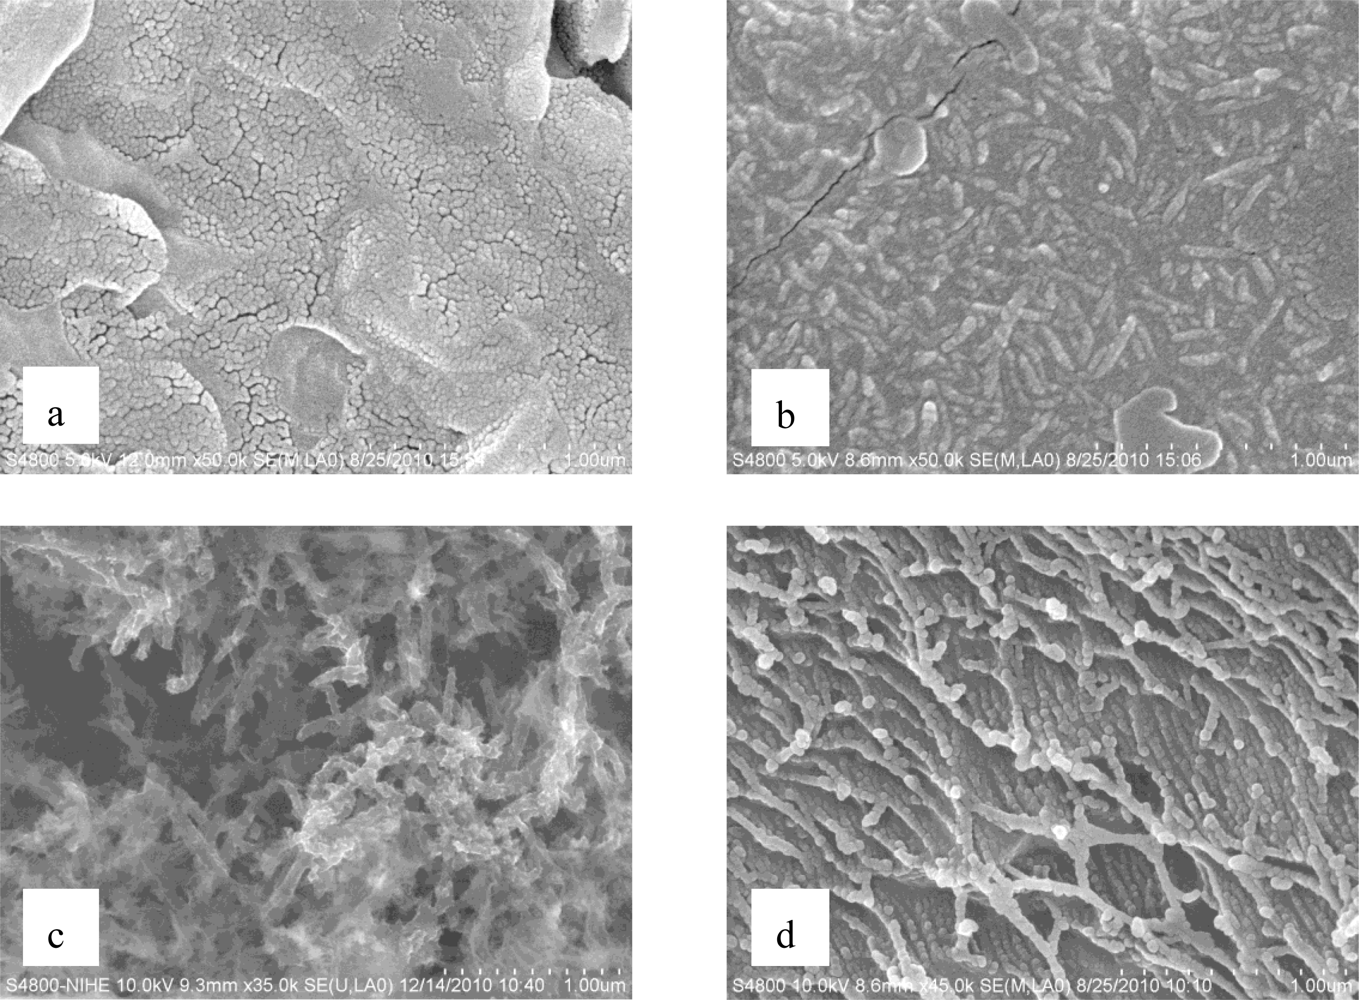
SEM images show that the morphology of TiO2/PANi changes depended on the ANi concentration. Without ANi, TiO2 nanoparticles in the form of uniform granular with mean sizes around 20–25 nm are created (Figure 1a). When ANi is added, the resulting nanocomposite appears in the form of long PANi chains. The length of the chain increased with increasing ANi concentration (see Figures 1b, 1c, and 1d). The TiO2 nanoparticle size is significantly reduced in the presence of PANi.
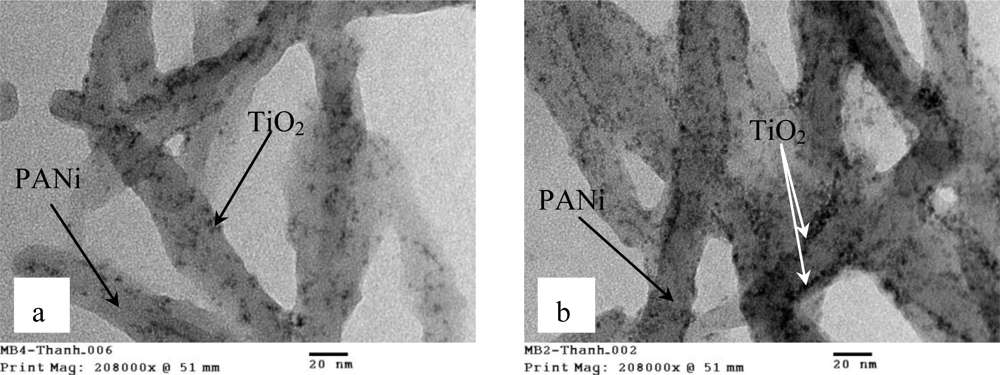
As can be seen from the TEM images in Figure 2, black TiO2 nanoparticles with sizes around 3–4 nm are randomly distributed in the PANi matrix and tend to line up along the PANi chains. Consecutive p-n junctions of TiO2 nanoparticles and PANi are formed, as a result a variety of shallow levels (both donor and acceptor) are created in the nanocomposite.
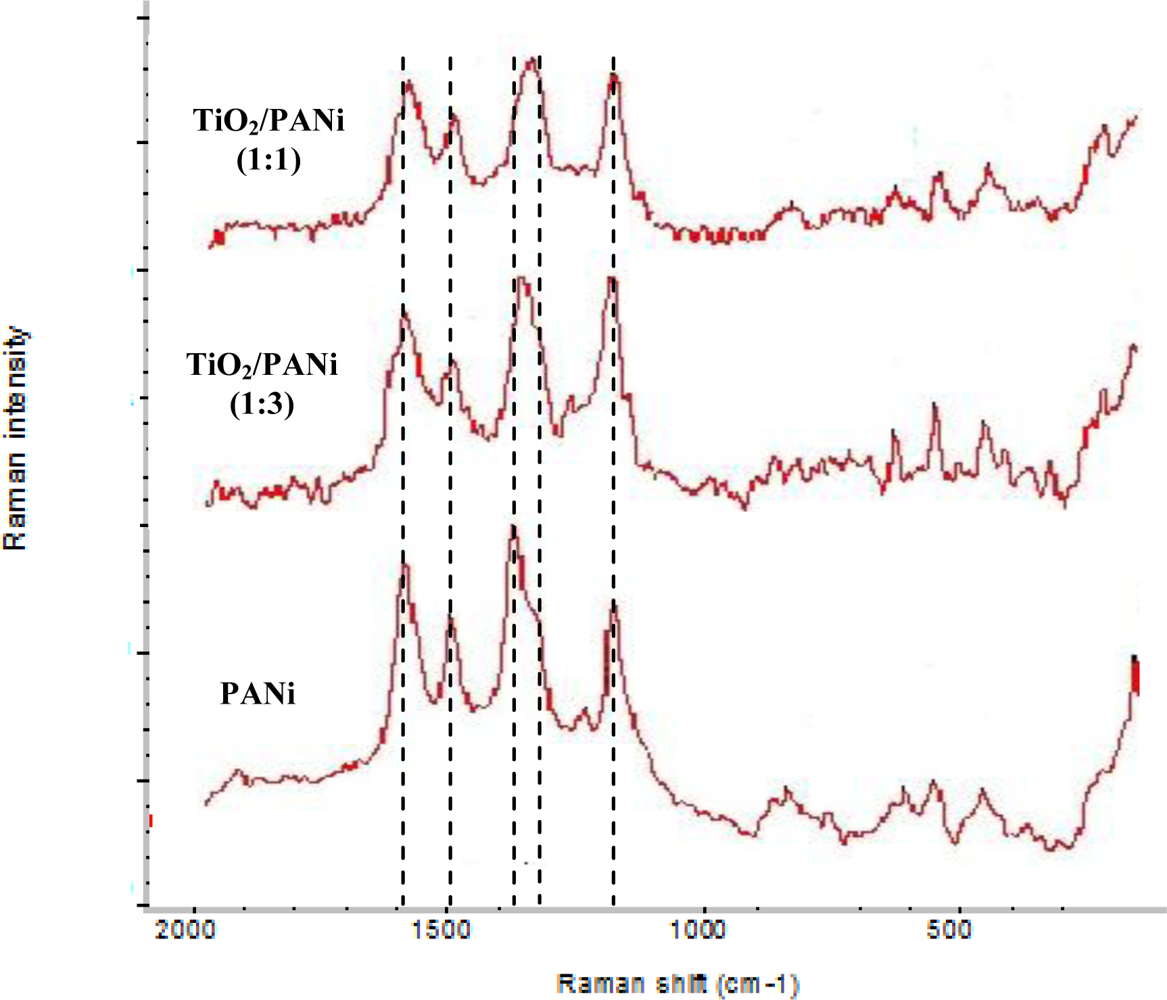
Raman spectra recorded for the TiO2/PANi nanocomposites (see Figure 3) show the vibration modes characterizing of PANi emeradine and anatase TiO2. In the Raman spectrum of the anatase single crystal TiO2 the following modes can be assigned: ∼144 (Eg), 197 (Eg), 399 (B1g), 513 (A1g), 519 (B1g) and 639 cm−1 (Eg). From the Raman assignment of the PANi vibration modes in Table 1, the band in the 1,490 cm−1 region is due to the C-N stretching vibration from benzenoid (B) ring while the band near 1,580 cm−1 is related to the C=N stretching from quinoid (Q) structure, the 1,140 cm−1 band is assigned to a vibration mode of the B-NH+=Q structure. It is an electronic-like band and is considered as a measure of the degree of delocalization of electrons. The three bands at 1,580, 1,490 and 1,140 cm−1 are slightly red shifted in TiO2/PANi nanocomposites indicating a slight effect of TiO2 on the bonds involved in these bands. The most striking point observed in Raman spectra is the red shift and increase in the intensity of the 1,338 cm−1, band which is assigned to the C-N+ stretching mode (semiquinoid form) of PANi in the nanocomposite. The 1,338 cm−1 band involves the polaron lattice and thus relates to the pristine conductance of the PANi.
As can be seen from Figure 3, the relatively higher intensities of the 1,140 and 1,338 cm−1 bands are evidence indicating that the PANi in TiO2/PANi nanocomposites has a higher degree of protonation than neat PANi. The TiO2-PANi interaction will loosen the chemical bonds and then TiO2 will play the role of counteranion and countercation along the polymer chain. From a physics point of view, when brought into contact with p-type semiconductor PANi, n-type semiconductor TiO2 may extracts some electrons from the valence band (HOMO) and adds some electrons to the conducting band (LUMO) of PANi and thus increases its conductance. The electronic structure of PANi then is modified by the interaction between TiO2 and PANi in the nanocomposite.
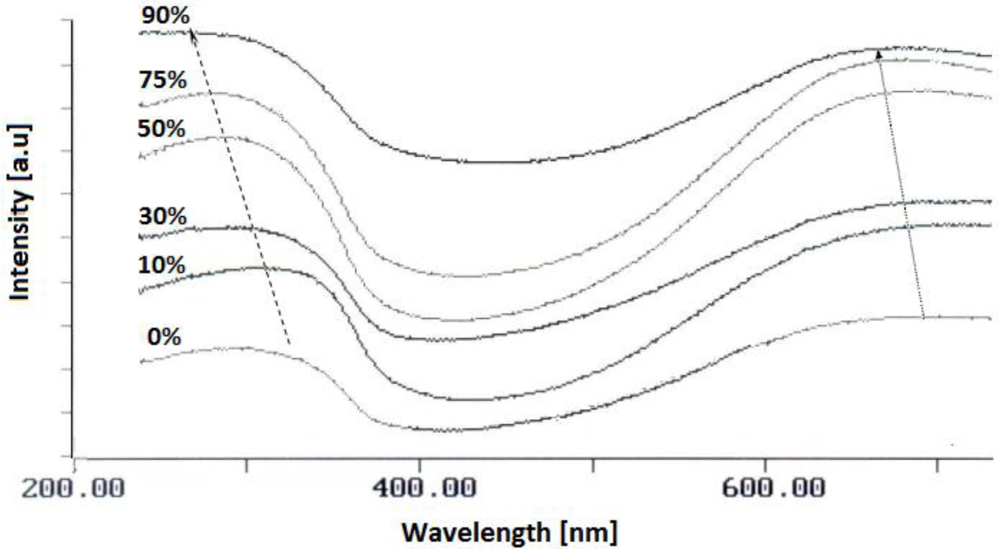
The UV-Vis spectrum of TiO2/PANi nanocomposites (Figure 4) generally consists of two broad bands centered around 730–800 nm and 390–410 nm which originate from π → polaron, polaron → π* and π → π* transitions in the PANi emeradine salt. The positions of these bands are blue shifted depending on TiO2 concentration. The shift indicates a redistribution of polaron density in the band gap of PANi emeradine due to the impact of TiO2 nanoparticles.
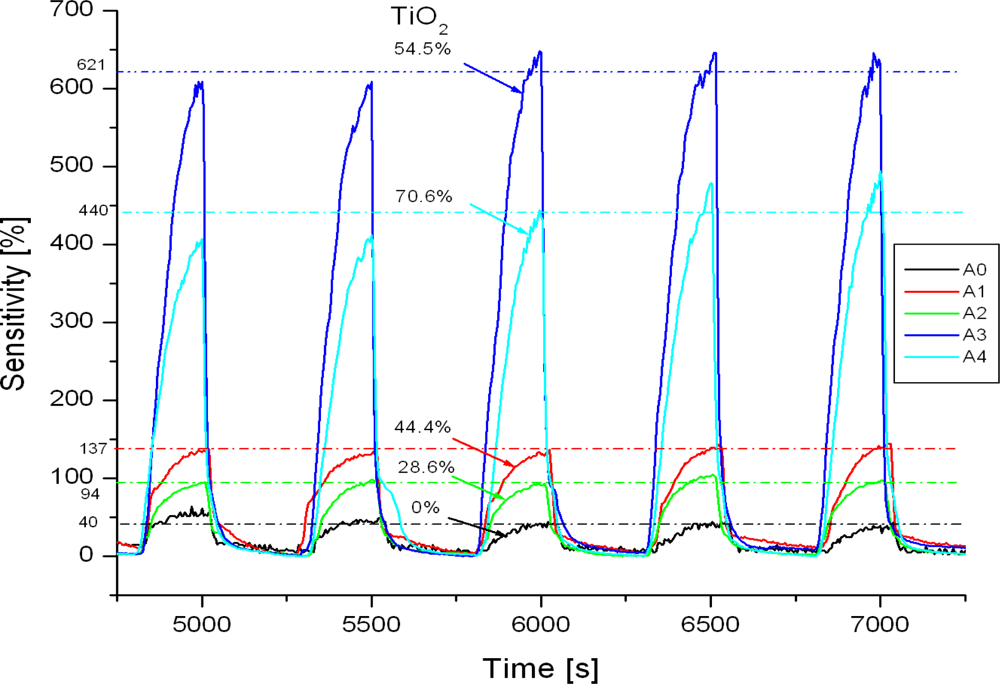
The conductivity of TiO2/PANi layers is found to be strongly affected by the environment. As can be seen from Figure 5 the resistance of TiO2/PANi layers changed with dry air pressure which was controlled by a vacuum pump. The reduction of air pressure causes a fast increase in the resistance of the TiO2/PANi layers and vice versa. The change in conductivity is accounted for by the interaction between oxygen (an electron acceptor) and PANi which loses more electrons in valence band then converts to be a p-type semiconducting species. The response and the recovery are fast, indicating the fact that the physical adsorption is dominant in the process. As can be seen from the plots, the sensitivity is strongly depending on TiO2/PANi ratio. Pure PANi exhibits a sensitivity of around 30–40%, while TiO2 shows no sensitivity. The highest sensitivity of around 650% is found in the composite containing around 55.0% of TiO2. In comparison to pure PANi, a 20–25 folds improvement in sensitivity is achieved. The appearance of a variety of n-p semiconductor contacts likely facilitates the formation of various gas molecular adsorption sites on the PANi surface (shallow levels). Oxygen, an electron acceptor, compensates for the sites gaining electrons on the PANi chain and this enhances the oxygen adsorption on the PANi surface.
The sensing behavior of TiO2/PANi nanocomposite upon exposure to NH3, a reducing agent acting as an electron donor, is different. The NH3 sensing profile of TiO2/PANi nanocomposite is shown in Figure 6. As can be seen from the figure, the resistance of TiO2/PANi layer increases as NH3 gas is injected. Upon interaction with NH3 some electrons are added into the valence band of the PANi p-type semiconductor, and as a result the conductance of PANi is decreased. The NH3 sensitivity of TiO2/PANi is high, but gradually declines with increasing cycles due to the saturation of NH3 adsorbed on the PANi surface. The nanocomposite with TiO2 concentration around 45.0 at % shows a peak in NH3 sensitivity. The effect of the n-type semiconducting TiO2 nanoparticles on the overall conducting properties of the nanocomposite is considered to be a reason, however the mechanism and the nature of the effect are still unclear.
4. Conclusions
TiO2/PANi nanocomposite synthesized by in-situ chemical polymerization formed long PANi chains with embedded TiO2 nanoparticles which tend to line up along the PANi chain with increasing TiO2 concentration. The length of the chain depends on the relative concentration of ANi monomer. FTIR, UV-Vis and Raman spectra show that the electronic structure of PANi is modified as TiO2 is brought into the nanocomposite. The conductivity of the nanocomposite layer increases upon exposure to O2 gas (an oxidizing agent) and decreases upon exposure to NH3 gas (a reducing agent). The process is reversible as a result from the physical adsorption and desorption processes which act as doping and dedoping on semiconducting PANi. Upon exposure to the oxygen in air the resistance of nanocomposite shows a 20–25 folds change in comparison to that of neat PANi. The n-p contacts between TiO2 nanoparticles and PANi matrix give rise to variety of shallow donors and acceptor levels increasing the physical adsorption sites for gas molecules thus enhancing the gas sensitivity.
Acknowledgments
The work is carried on thanks to the support from Basic Research Project 103 02 103 09 Grant in Aid by National Foundation for Science and Technology Development (Nafosted).
References
- Baibarac, M.; Gomez-Romero, P. Nanocomposites based on conducting polymers and carbon nanotubes: From fancy materials to functional applications. J. Nanosci. Nanotech 2006, 2, 289–302. [Google Scholar]
- Thomas, V.; Namdeo, M.; Mohan, Y.M.; Bajpai, S.K.; Bajpai, M. Review on polymer, hydrogel and microgel metal nanocomposites: A facile nanotechnological approach. J. Macromol. Sci. Part A 2008, 1, 107–119. [Google Scholar]
- Weder, C. Functional polymer blends and nanocomposites. CHIMIA Int. J. Chem 2009, 11, 758–763. [Google Scholar]
- Su, S.-J.; Kuramoto, N. Processable polyaniline-titanium dioxide nanocomposites: Effect of titanium dioxide on the conductivity. Synthet. Metal 2000, 114, 147–153. [Google Scholar]
- Tai, H.; Jiang, Y.; Xie, G.; Yu, J.; Chen, X. Fabrication and gas sensitivity of polyaniline-titanium dioxide nanocomposite thin film. Sensor. Actuator. B: Chem 2007, 125, 644–650. [Google Scholar]
- Nabid, M.R.; Golbabaee1, M.; Moghaddam, A.B.; Dinarvand, R.; Sedghi, R. Polyaniline/TiO2 nanocomposite: Enzymatic synthesis and electrochemical properties. Int. J. Electrochem. Sci 2008, 3, 1117–1126. [Google Scholar]
- Pawar, S.G.; Patil, S.L.; Chougule, M.A.; Raut, B.T.; Jundale, D.M.; Patil, V.B. Polyaniline: TiO2 nanocomposites: Synthesis and characterization. Arch. Appl. Sci. Res 2010, 2, 194–201. [Google Scholar]
- Sun, H.; Luo, Y.; Zhang, Y.; Li, D.; Yu, Z.; Li, K.; Meng, Q. In situ preparation of a flexible polyaniline/carbon composite counter electrode and its application in dye-sensitized solar cells. J. Phys. Chem. C 2010, 114, 11673–11679. [Google Scholar]
- Handbook of Conducting Polymer, Theory, Synthesis, Properties and Characterization, Processing and Application, 3rd ed; Skotheim, T.A., Reynolds, J.R., Eds.; CRC Press: Boca Raton, FL, USA, 2007.
- Diaz, A.F.; Logan, J.A. Electroactive polyaniline film. J. Electroanal. Chem 1980, 111, 111. [Google Scholar]
- MacDiarmid, A.G.; Epstein, A.J. Polyanilines—a novel class of conducting polymers. Faraday Discuss. J. Chem. Soc 1989, 88, 317. [Google Scholar]
- Sinha, S.; Bhadra, S.; Khastgir, D. Effect of dopant type on the properties of polyaniline. J. Appl. Polym. Sci 2009, 1123135–1123140. [Google Scholar]
- Huyen, D.N.; Chien, N.D. Gas sensing characteristics of polyaniline-single wall carbon nanotube composites. J. Korean Phys. Soc 2008, 52, 1564. [Google Scholar]
- Huyen, D.N. In situ chemically polymerized PANi-SWNTs composites: Characterizations and gas sensing feature. Spring. Proc. Phys 2009, 113, 279–286. [Google Scholar]
- Chen, X.B.; Mao, S.S. Titanium dioxide nanomaterials: Synthesis, properties, modifications, and applications. Chem. Rev 2007, 107, 2891–2959. [Google Scholar]
- Fujishima, A.; Honda, K. Electrochemical photolysis of water at a semiconductor electrode. Nature 1972, 37, 5358. [Google Scholar]
- Tang, H.; Prasad, K.; Sanjinés, R.; Lévy, F. TiO2 anatase thin films as gas sensors. Sensor. Actuator. B: Chem 1995, 26, 71–75. [Google Scholar]


| Frequencies (cm−1) | Assignments |
|---|---|
| 1120–1140 | B-NH+=Q stretching |
| 1230–1255 | C-N stretching |
| 1317–1338 | C-N+ stretching |
| 1470–1490 | C-N stretching (B) |
| 1515–1520 | N-H bending |
| 1580 | C=N stretching (Q) |
| 1600–1620 | C-C stretching |
© 2011 by the authors; licensee MDPI, Basel, Switzerland. This article is an open access article distributed under the terms and conditions of the Creative Commons Attribution license (http://creativecommons.org/licenses/by/3.0/).
Share and Cite
Huyen, D.N.; Tung, N.T.; Thien, N.D.; Thanh, L.H. Effect of TiO2 on the Gas Sensing Features of TiO2/PANi Nanocomposites. Sensors 2011, 11, 1924-1931. https://doi.org/10.3390/s110201924
Huyen DN, Tung NT, Thien ND, Thanh LH. Effect of TiO2 on the Gas Sensing Features of TiO2/PANi Nanocomposites. Sensors. 2011; 11(2):1924-1931. https://doi.org/10.3390/s110201924
Chicago/Turabian StyleHuyen, Duong Ngoc, Nguyen Trong Tung, Nguyen Duc Thien, and Le Hai Thanh. 2011. "Effect of TiO2 on the Gas Sensing Features of TiO2/PANi Nanocomposites" Sensors 11, no. 2: 1924-1931. https://doi.org/10.3390/s110201924