Optical Microcavity: Sensing down to Single Molecules and Atoms

Abstract
: This review article discusses fundamentals of dielectric, low-loss, optical micro-resonator sensing, including figures of merit and a variety of microcavity designs, and future perspectives in microcavity-based optical sensing. Resonance frequency and quality (Q) factor are altered as a means of detecting a small system perturbation, resulting in realization of optical sensing of a small amount of sample materials, down to even single molecules. Sensitivity, Q factor, minimum detectable index change, noises (in sensor system components and microcavity system including environments), microcavity size, and mode volume are essential parameters to be considered for optical sensing applications. Whispering gallery mode, photonic crystal, and slot-type microcavities typically provide compact, high-quality optical resonance modes for optical sensing applications. Surface Bloch modes induced on photonic crystals are shown to be a promising candidate thanks to large field overlap with a sample and ultra-high-Q resonances. Quantum optics effects based on microcavity quantum electrodynamics (QED) would provide novel single-photo-level detection of even single atoms and molecules via detection of doublet vacuum Rabi splitting peaks in strong coupling.
1. Introduction
A narrow resonance spectrum and enhanced light-matter interaction are unique characteristics of a dielectric microcavity [1] that are fundamental parameters limiting the performance of microcavity optical sensing. Biochemical sensing based on optical microcavity [2–4] is enabled via detection of modified optical properties of the microcavity mode. On the other hand, surface plasmon polariton (SPP) modes are often used for sensing and spectroscopy applications including SPP sensors and surface enhanced Raman spectroscopy (SERS) [5–9], for which the intensified field at the surface interacts with particles, molecules or liquid, and induces resonance shift and strong Raman signals. However, we do not discuss optical sensing based on SPP [10–14]; we focus on dielectric microcavities for optical sensing in this article.
State-of-the-art optical microcavities can show sharp resonances limited by material absorption in dielectrics. For example, toroidal optical microcavities [15,16] are demonstrated to show resonance linewidth of less than 0.0155 pm at λ = 1,550 nm resonance vacuum wavelength, corresponding to quality (Q) factor of 108. Light-matter interaction within the microcavity is enhanced owing to photon trapping effect. The photon decay time τ is as long as 82.2 nsec, corresponding to 1.59 × 10⁷ optical cycles, for Q factor of 108 at 1,550 nm wavelength of light. One of fundamental characteristic values of microcavities is the Q factor defined by
The enhanced light-matter interaction is observed through a resonance shift and the reduction of the resonator Q factor. The resonance shift is mainly caused by two reasons; local refractive index change and thermo-optic (TO) effect due to heat induced from light absorption. Even these small perturbations induce the resonance shift that is larger than the resonance linewidth.
Perturbations can also change the mode-to-mode coupling via light scattering. The detection of altered coupling enables optical sensing of small amounts of analytes [17,18]. Zhu et al. [17] measured the mode splitting of coupled modes that originated from clock-wise and counter-clock-wise whispering gallery modes (WGMs), and detected nanoparticles.
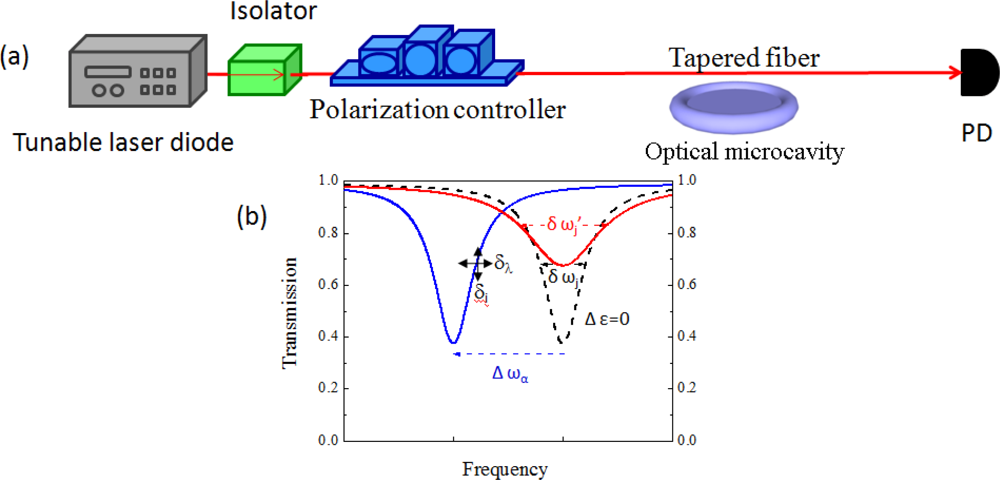
Optical microcavities can perform label-free detection of single molecules due to the enhanced interaction of resonance light with molecules [15,19,20]. One typical microcavity-based optical sensing system is shown in Figure 1(a). Narrow laser spectrum line light with appropriate polarization is evanescently coupled to a microcavity via a tapered fiber. At resonance, the light is dropped into the optical resonator, and we see a dip in a transmission spectrum as seen in Figure 1(b); dashed black, blue, and red resonance dips represent ones without any perturbation, with index shift perturbation, and with absorptive perturbation. The values δωj and δ ωj’ are full width at half maximum (FWHM) of resonances, and δi and δλ are intensity and wavelength noises, which depend on each system. Detection of the wavelength shift Δωα or broadening δωj’−δωj allows us to detect analytes on the microcavity.
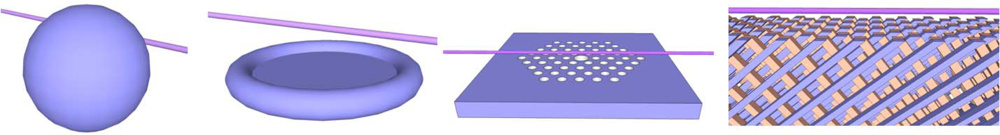
Representative microcavity designs are shown in Figure 2. Microcavity requires three-dimensional optical confinement, and high-reflectivity (HR) mirrors are often used. Metallic materials are not used due to absorption power loss. Instead, we use inhomogeneity of refractive index or simply index contrast. There are two major choices for obtaining high reflectance; total internal reflection (TIR) and distributed Bragg reflection. TIR demands that an angle of incidence on the interface is greater than the critical angle sin−1(n1/n2) for an interface of n1 and n2 media (n1 < n2), and TIR is expected. Combined TIR with a loop of optical trajectory, WGMs can be supported. The WGMs are essentially travelling wave resonator modes, and a modal optical round-trip satisfies constructive interference conditions. Representative WGMs include micro-sphere, micro-toroid, micro-disk, and micro-ring microcavity modes. On the other hand, distributed Bragg reflection is constructed based on destructive interference from multiple periodic scattering of light waves. Depending upon the dimension of distributed Bragg reflection, there are 1D, 2D and 3D photonic crystals; see Figure 2. Although it is possible to induce WGM-like modes in photonic crystals, the modes are typically constructed via standing waves.
Table 1 compares SPP, photonic and surface modes in terms of structure, sensitivity and Q factor. SPP and surface Bloch modes are surface waves. In order to support SPP modes, the negative value of the real part of the permittivity is required [25]. Therefore, the modes typically require metal. However, the SPP modes are lossy as indicated by ɛ1 = n’2 − k2 < 0 where the index of refraction is n = n’+ ik. The sensitivity S = dλ/dn is large thanks to large field penetration into air, but the mode resonance is spectrally broad due to large optical absorption, i.e., quick photon decay time τ. We discuss photonic modes and surface Bloch modes in this article.
2. Resonance Perturbation
Resonance states are modified due to a system perturbation induced upon an event of analyte arrival at a microcavity. The modifications detected by the sensing system are typically either those of resonance wavelength or Q factor (i.e., linewidth); we call each index shift or Q-factor sensing.
2.1. Resonance Frequency Shift
This resonance change can be expressed in terms of permittivity change by the perturbation theory [26]. We assume that the unperturbed, non-magnetic system defined by ɛ(r⃗) supports the mode j of resonance frequency ωj and modal electric field E⃗j(r⃗). Upon an arrival event of an analyte on the microcavity, the system is modified from ɛ(r⃗) to ɛ(r⃗) + Δɛ(r⃗). The resonance (angular) frequency shift due to a small perturbation in the permittivity Δɛ(r⃗) is given by
The resonance shift is effective for the change in the real part of permittivity, i.e., Δɛ1(r⃗). The index sensing detects the resonance wavelength shift shown in Equation (2). The resonance Q of the unperturbed system is equal to ωj/δωj. Assuming no change in the Q value, which is true for transparent molecules, we can sense the small perturbation when the resonance shift is comparable or exceeds the resonance linewidth δωj As seen in Equation (2), the analyte position must have a sufficiently high optical field of the mode j. The sensitivity is greatly dependent upon the field overlap of the analyte.
2.2. Q Factor Change
Monitoring the optical Q factor change, we can detect an analyte. This is so-called Q-factor sensing, typically based on absorption perturbation. Although many works use resonance shifts for sensing (i.e., index sensing), the Q factor reduction can also be monitored for the detection of single molecules. Conventional non-surface-based microcavities lack sufficient light-matter interaction with single molecules. In this regard, surface-mode-based sensors would be advantageous. The Q factor can be strongly altered due to the small perturbation. Next, we consider probing the Q factor for sensing. The original unperturbed Q factor is limited by radiation and scattering loss on the microcavity or by absorption of microcavity dielectric media. As an increase in the perturbation strength, the Q factor [26] is decreased to
The Q factor reduction is significant by increasing the light-matter interaction, i.e., increasing the value of R2. The Q factor can be varied from Q to Q’ = R2−1 so that the dynamic range is QR2. Although the state-of-the-art microcavities are demonstrated to perform label-free, single-molecule detection, there are few kinds of single molecules that have been demonstrated to be detected. An absorptive analyte can be sensed via the Q factor sensing. This is unique in dielectric microcavity as SPP modes have a metal-absorption-limited, low-Q factor given by the Equation (5) without any analytes.
2.3. Sensitivity
The sensitivity is one figure of merit value for resonance shift optical microcavity sensing. It is typically defined by S ≡ ∂λ / ∂n where n is the refractive index of the media containing analytes, and its typical unit is nm/RIU (refractive index unit: unitless). For transparent analytes, the sensitivity can be written from the Equation (2) as
As seen in Equation (7), in general, long wavelength resonance has a large sensitivity value S. Comparisons among different microcavity systems become appropriate by the use of the normalized sensitivity S’. The normalized sensitivity is increased by optimizing field overlap with analytes so that it is desired to place the analytes on field maxima or large field points.
2.4. Minimum Detectable Index Change
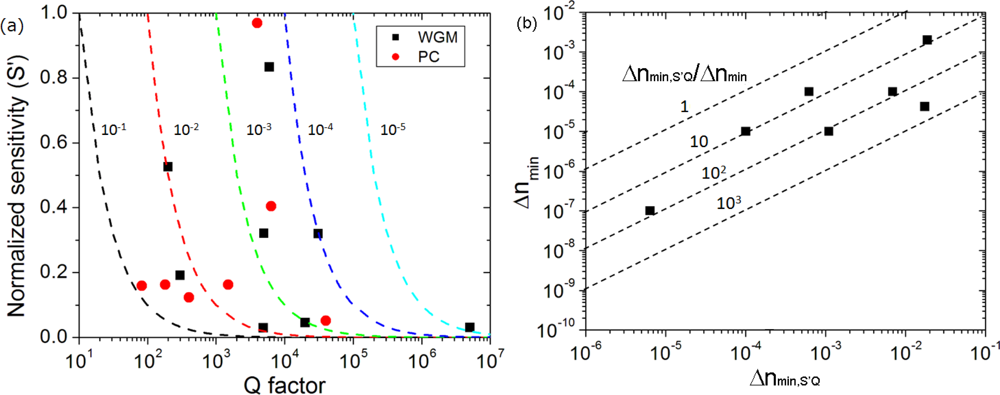
The smallest detectable refractive index change by a sensor microcavity provides a good and practical figure of merit, but true minimum detectable index change in its total system may be dependent upon the measurement system including curve fitting method and the quality of light source and detector, i.e., system noises. It would not be convenient to consider all kinds of noises and compare the quality of sensing microcavity. Therefore, we use the minimum detectable index change Δnmin,S′Q at which the wavelength shift is equal to the linewidth of a resonance mode, i.e.,
2.5. Noises
Noises are often an important factor determining the minimum detectable index change. Hu et al. [41] theoretically studied the effects of two kinds of noises—intensity noise and wavelength noise—on the time-averaged sensitivity, which is an inverse of the index change Δnmin that produces a signal to noise ratio of unity, normalized to square root unit equivalent bandwidth df / N as
Temperature fluctuations including those from thermo-optic effect are one source of wavelength noise. Other factors influencing wavelength noises result from other sensing instrument components such as accuracy and repeatability of wavelength in a tunable laser and a spectrometer.
2.6. Thermo-Optic Effect
The refractive index change due to the TO effect is given by dn = (dn / dT)dT where dn / dT is the thermo-optic coefficient; this is often treated as a linear term. The TO effect can act positively or negatively. When the temperature fluctuations are well suppressed, the resonance shift due to the TO effect can be utilized as a sensing scheme. Optical absorption by the system including analytes induces the temperature increase and thus refractive index shift. On the other hand, when the temperature fluctuation noises are large, the effect acts negatively. Depending upon sensing scheme, index drift due to the TO effect is enhanced or suppressed. Using the Equation (2), we find the resonance frequency shift due to the TO effect and normal index shift Δna as
3. Optical Microcavity Designs for Optical Sensing
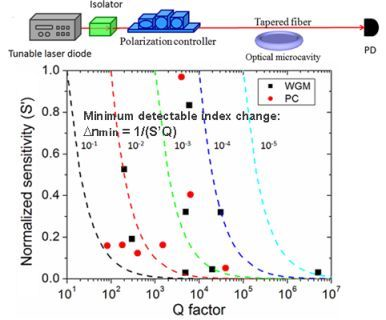
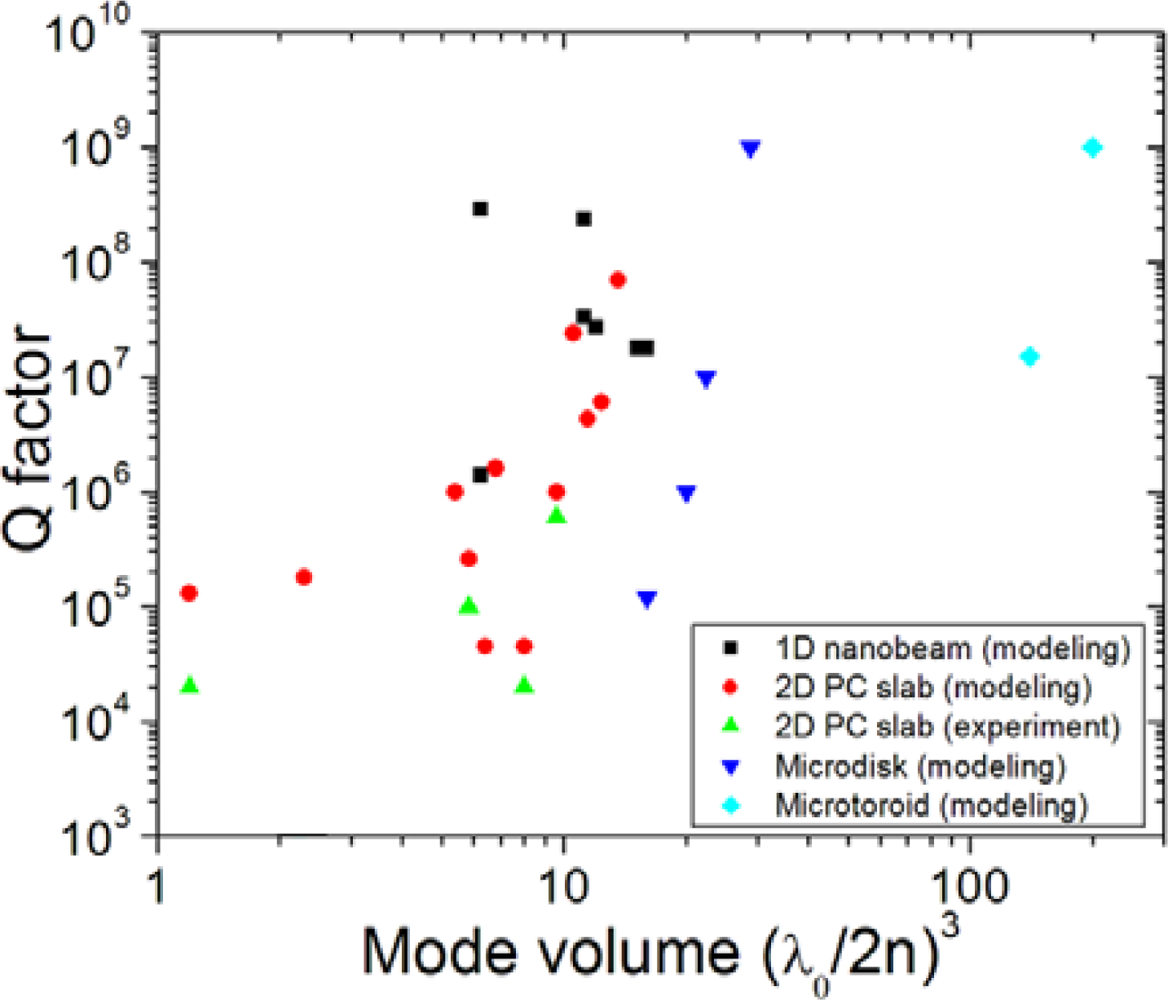
There are many optical microcavity sensing reports, and each microcavity design is unique in terms of Q factor, mode volume, size, and mode profile. In this section, we describe some examples of optical microcavities used in optical sensing technologies. As seen in Figure 3(a), there is more space to improve the figure of merit by Q factor enhancement than sensitivity, especially for dielectric optical resonators.
For WGMs, the radiation loss degrading the Q factor is due to failure of TIR defined by an index contrast at an interface. WGM optical resonator geometries are well optimized for enhancement of Q factor, and micro-toroid resonators can show as large Q factor as 109. Momentum component within an escape light cone results in radiation loss. In general, the passive (or unloaded) Q factor can be increased as an increase in the feedback size relative to a wavelength. Some Q factor enhancement cases are understood by far-field cancellation as, for example, presented by Vuckovic et al. [43]. For planar microcavities, the averaged radiated power is given by
Field profile determines the sensitivity as seen in Equation (6). Opposed to surface modes, photonic dielectric modes tend to have large field localization in dielectrics, thus leading to low sensitivity. The larger the mode number is, the smaller sensitivity is likely. This is seen in Figure 3(a).
Mode volume is not an apparently important factor in figure of merit for conventional optical sensing in classical optics regime, but small mode volume tends to have a small detection volume so that it is useful for high-density sensing arrays. For a given analyte, the smaller the mode volume is, the larger the resonance shift is; this is understood from Equation (2). In this regard, small mode volume microcavities have an advantage. UHQ, small mode volume resonators are desired. On the other hand, small mode volume microcavities provide potentially novel optical sensing techniques based on quantum electrodynamics (QED) [57]. Although it is required to satisfy a strict condition, strong coupling between quantum electronic and photonic systems would provide ultimate optical sensing scheme as a single atom or molecule is detected by measuring optical response of the strong coupling system. The microcavity QED system [55,58–65] consists of a single atom (or molecule) and single mode filed, and its eigenmode becomes a doublet separated by 2g where g is the interaction rate. Without a molecule (i.e., an analyte) we observe a resonator peak only in a spectrum. As a result, we can detect the atom or the molecule. In a strong-coupling cavity-QED system, large ratios and are desired, where κ and γ are decay rates of cavity and emitter. Thus, high Q and small V are required. Vacuum Rabi splitting was observed in various systems such as atom-photon and quantum dot-photon systems, meaning that the detection of a single atom or a single quantum dot was succeeded via measurements of doublet peaks. It should be noted that they are realized in low temperature and require precise positioning of single atoms
3.1. Whispering Gallery Mode Microcavity
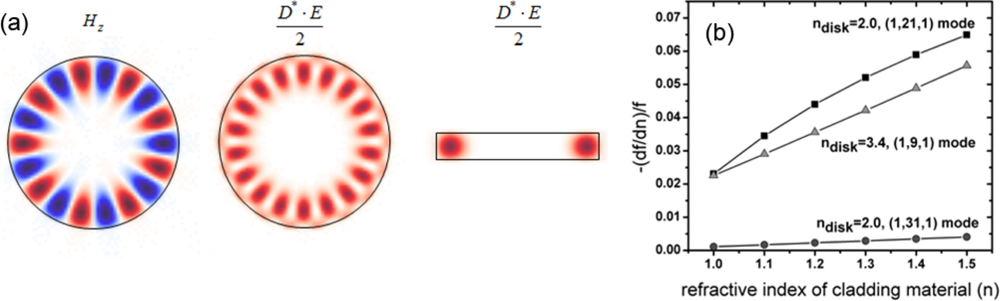
Total internal reflection along the circumference of a circular dielectric supports doubly-degenerate WGMs, which can be realized in several types of microcavities such as sphere [20,30,66–74], cylinder [75], disk [31,34,76], ring [28,77–80], toroid [15,17], and fiber coil [35,81] geometries. WGMs tend to provide large mode volume relative to photonic crystal ones, but the structure is compact and simple in fabrication. Figure 5 shows mode profiles of a microdisk and the normalized sensitivity S’ as a function of background index. Due to small penetration of field into low-index media, the sensitivity tends to be small. However, the mode number can be increased and this does not deteriorate the sensitivity significantly. Therefore, the factor S’Q can be high and the minimum detectable index change becomes small. Label-free single molecule detection events are reported via digital resonance shifts of UHQ WGMs [15,19,20].
3.2. Photonic Crystal Microcavity
Yablonovitch [82] and John [83] proposed to use 3D dielectric superlattice structures for studying suppression of spontaneous emission and amorphous 3D photonic crystal for strong localization in disordered dielectric superlattices, respectively. A photonic crystal is an artificial optical material based on sub-wavelength-scale interferences. Photonic crystals have either translational or rotational symmetry in permittivity and/or permeability with periodicity in order of wavelength. Efficient confinement of light in small volumes is a unique characteristic of photonic crystal microcavities. Two-dimensional photonic crystal slab microcavities have been the most popular choice among photonic crystals as the fabrication is simple and they provide large quality factor and small mode volume. One-dimensional photonic crystal nanobeam microcavity [84] also provides high-Q resonance and simple fabrication. A complete photonic bandgap is formed in a 3D photonic crystal, and omni-directional confinement of light is accomplished. With sufficiently large 3D photonic crystals [85–95], the Q factor is limited by dielectric absorption loss or scattering loss, not by radiation loss. For example, a monopole mode in woodpile has UHQ [95] and sufficiently large sensitivity (S’ ∼0.24 at n = 1.0) with small mode volume ∼ 0.4(λ/2)3.
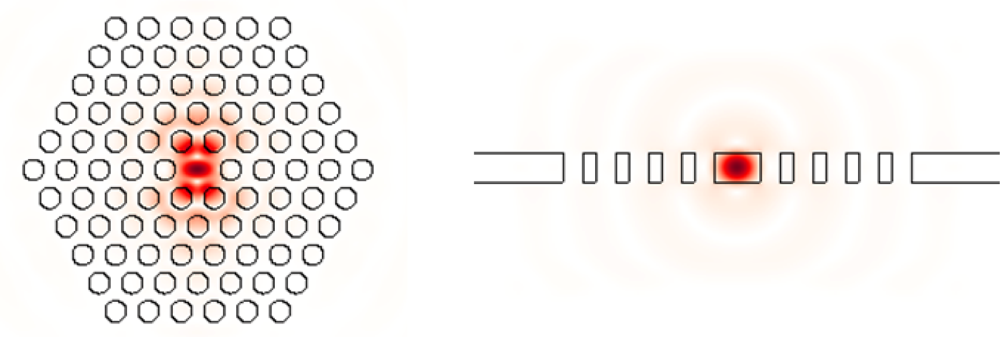
The performance of two-dimensional photonic crystal slab microcavities has been advanced in the past decade, and there are many choices in terms of mode volume and Q factor. Popular 2D photonic crystal slab microcavity designs include H1 [96], L3 [97], and double-hetero [98] modes in a triangular lattice and D0 mode in a square lattice [99]; see Figure 6. For gas sensing, i.e., background index ∼ 1.0, the calculated Q factors can exceed 1 million for mode volume of ∼ 2(λ/n)3. For background index ranging (1.3, 1.5), i.e., liquid, the Q factor is reduced due to small index contrast; however it is still possible to obtain large Q factor.
3.3. Slot-Type Microcavity
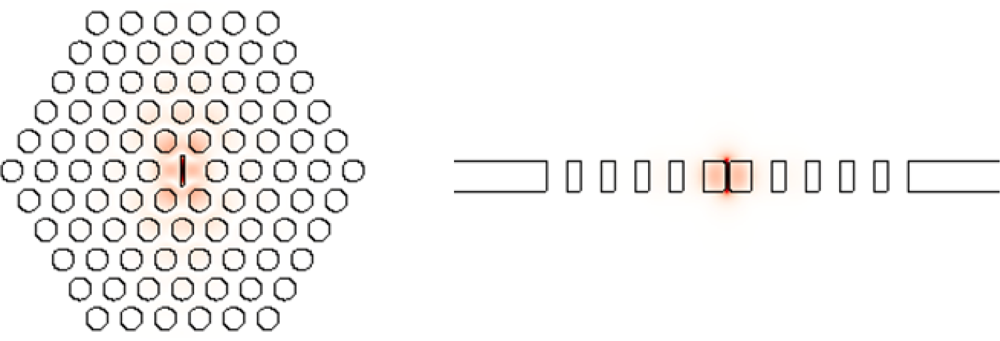
A discontinuity of permittivity enhances the electric field due to the continuity condition of the normal component of displacement vector at the discontinuity interface [100], i.e., E1⊥ = (ɛ2 / ɛ1) E2⊥. The field can be enhanced by the factor of ɛ2 / ɛ1. As a consequence, the sensitivity is enhanced. Figure 7 shows a slot field enhancement in an H1 2D photonic crystal slab microcavity. Optical sensing with slot microcavity and waveguide [33,101–104] has been tested. They showed great potential of high-sensitivity optical sensing.
3.4. Microcavity Laser
Linewidth can be reduced by the introduction of gain [105], and thus reduction of Δnmin is possible. One of the first microcavity laser sensing was done by Loncar et al. [22,106] who succeeded to show the possibility of femto-liter chemical detection and integration of the optical sensing with microfluidic platform. Kita et al. [107] recently showed chemical sensing by nanoslot laser that combined a photonic crystal slab microcavity with a permittivity discontinuity slot.
In general, microlasers tend to show much broader mode linewidth due to small photon numbers in the microcavity than large lasers. However, there are two advantages in microcavity laser: it does not require an external laser and the linewidth can be narrower than a passive microcavity with the similar mode volume size.
4. Surface Mode for Optical Sensing
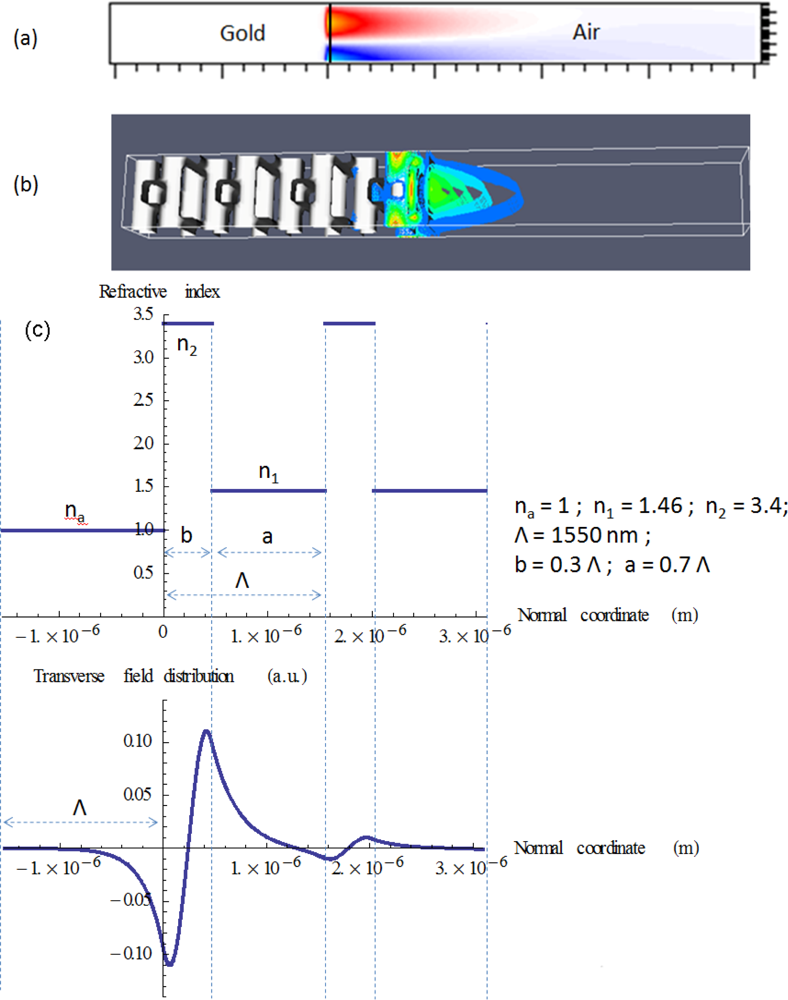
Surface modes tend to have large sensitivity. SPP modes are induced in electromagnetic wave interaction with electrons in metal at surface, provided that the metallic media have negative real part of the permittivity. The fields exponentially decay from the interface and significantly overlap with air where we can place samples for detection; see Figure 8(a).
As seen in Figure 5 (WGMs) and Figure 6 (2D photonic crystal slab), for conventional photonic mode, most of the lightwave field and energy stay inside the microcavity. Although it is possible to slightly increase the field strength outside the microcavity, it is fundamentally difficult to enhance the field outside the microcavity significantly. On the other hand, surface modes [108–110] can utilize its large field on the surface for high-sensitivity optical detection of analytes. Conventional surface plasmon systems are lossy in optical frequency and it is difficult to build UHQ surface plasmon microcavities. There is a space to still improve the sensitivity by using UHQ surface microcavity modes.
The surface Bloch modes of photonic crystals are optical analogue to those of atomic crystals, and are excited in the lossless materials; see Figure 8(b). Yeh et al. [109] analyzed surface modes on a terminated 1D periodic dielectric structure; see Figure 8(c). Meade et al. [111] reported the first study of surface Bloch modes on a Yablonovite crystal, one of 3D dielectric photonic crystals. 2D photonic crystal slab surface modes are studied [32], and the surface modes are induced on the side facet of a membrane. 3D photonic crystal surface modes have a large surface area. The investigation of such surface Bloch modes has been hindered due to the lack of large 3D photonic crystals with complete photonic bandgap (PBG). Ishizaki et al. [88] experimentally confirmed surface modes on 3D photonic crystal. There still remain many tasks of applying the surface modes to sensing technology, but the work provides the possibility of high-sensitivity optical surface sensing. We analyzed surface Bloch modes on a terminated woodpile as seen in Figure 8(b). The sensitivity is high and the waveguide resonance is ultra-low-loss; the results will be reported elsewhere.
Fabrication of 3D photonic crystals is a challenge. Although many 3D photonic crystal designs show a complete PBG, the significance of woodpile 3D photonic crystals is that they are simple layered structures possessing a relatively large complete PBG. The woodpile photonic crystal is one of 〈100〉 diamond structured photonic crystals. Typical woodpile has approximately 15% complete PBG, defined by a complete PBG frequency width divided by a midgap frequency. The two-directional etching fabrication method [86,93,112] without wafer bonding can be used for woodpile photonic crystal fabrication. This is a promising fabrication technique which provides optical sensing on 3D photonic crystal with a complete photonic bandgap. Ultra-low radiation loss is possible due to the complete photonic bandgap.
5. Conclusions
Optical sensing technology by dielectric microcavity has been advanced significantly due to both demands of analysis of small amounts of analytes and rapid development of microcavity technology. This review article discusses fundamentals of optical micro-resonator sensing. Whispering gallery mode, photonic crystal, and slot-type microcavities typically provide compact, high-quality optical resonance modes for optical sensing applications. Surface Bloch modes induced on photonic crystals, are shown to be a promising candidate thanks to large field overlap with a sample and ultra-high-Q resonances. Quantum optics effects based on microcavity QED would offer a test bed for investigating novel, single-photon-level optical sensing of a single atom or single molecule.
Acknowledgments
The authors acknowledge the discussions with Nan M. Jokerst, Lin Luan, Matthew Royal, Ozlem Senlik, Pantana Tor-ngern, Axel Scherer, Marko Loncar and Mark Adams.
References and Notes
- Vahala, K.J. Optical microcavities. Nature 2003, 424, 839–846. [Google Scholar]
- Lukosz, W. Integrated optical chemical and direct biochemical sensors. Sens. Actuat. B 1995, 29, 37–50. [Google Scholar]
- Vollmer, F.; Arnold, S. Whispering-gallery-mode biosensing: Label-free detection down to single molecules. Nat. Methods 2008, 5, 591–596. [Google Scholar]
- Weiss, S.M.; Rong, G.; Lawrie, J.L. Current status and outlook for silicon-based optical biosensors. Phys. E 2009, 41, 1071–1075. [Google Scholar]
- Homola, J. Surface Plasmon Resonance Based Sensors; Springer: Berlin, Germany, 2006. [Google Scholar]
- Fleischmann, M.; Hendra, P.J.; McQuillan, A.J. Raman spectra of pyridine adsorbed at a silver electrode. Chem. Phys. Lett 1974, 26, 163–166. [Google Scholar]
- Wabuyele, M.; Yan, F.; Vo-Dinh, T. Plasmonics nanoprobes: Detection of single-nucleotide polymorphisms in the breast cancer BRCA1 gene. Anal. Bioanal. Chem 2010, 398, 729–736. [Google Scholar]
- Yan, F.; Vo-Dinh, T. Surface-enhanced Raman scattering detection of chemical and biological agents using a portable Raman integrated tunable sensor. Sens. Actuat. B 2007, 121, 61–66. [Google Scholar]
- White, I.M.; Gohring, J.; Fan, X. SERS-based detection in an optofluidic ring resonator platform. Opt. Express 2007, 15, 17433–17442. [Google Scholar]
- Chen, H.M.; Pang, L.; Kher, A.; Fainman, Y. Three-dimensional composite metallodielectric nanostructure for enhanced surface plasmon resonance sensing. Appl. Phys. Lett 2009, 94, 073117. [Google Scholar]
- Hwang, G.M.; Pang, L.; Mullen, E.H.; Fainman, Y. Plasmonic Sensing of biological analytes through nanoholes. IEEE Sens. J 2008, 8, 2074–2079. [Google Scholar]
- Cooper, M.A. Label-free screening of bio-molecular interactions. Anal. Bioanal. Chem 2003, 377, 834–842. [Google Scholar]
- Gelfand, R.M.; Bruderer, L.; Mohseni, H. Nanocavity plasmonic device for ultrabroadband single molecule sensing. Opt. Lett 2009, 34, 1087–1089. [Google Scholar]
- Nakatani, K.; Sando, S.; Saito, I. Scanning of guanine-guanine mismatches in DNA by synthetic ligands using surface plasmon resonance. Nat. Biotechnol 2001, 19, 51–55. [Google Scholar]
- Armani, A.M.; Kulkarni, R.P.; Fraser, S.E.; Flagan, R.C.; Vahala, K.J. Label-free, single-molecule detection with optical microcavities. Science 2007, 317, 783–787. [Google Scholar]
- Zhang, X.; Choi, H.S.; Armani, A.M. Ultimate quality factor of silica microtoroid resonant cavities. Appl. Phys. Lett 2010, 96, 153304. [Google Scholar]
- Zhu, J.; Ozdemir, S.K.; Xiao, Y.-F.; Li, L.; He, L.; Chen, D.-R.; Yang, L. On-chip single nanoparticle detection and sizing by mode splitting in an ultrahigh-Q microresonator. Nat. Photonics 2010, 4, 46–49. [Google Scholar]
- Koch, B.; Yi, Y.S.; Zhang, J.Y.; Znameroski, S.; Smith, T. Reflection-mode sensing using optical microresonators. Appl. Phys. Lett 2009, 95, 201111. [Google Scholar]
- Arnold, S.; Shopova, S.I.; Holler, S. Whispering gallery mode bio-sensor for label-free detection of single molecules: Thermo-optic vs. reactive mechanism. Opt. Express 2010, 18, 281–287. [Google Scholar]
- Vollmer, F.; Arnold, S.; Keng, D. Single virus detection from the reactive shift of a whispering-gallery mode. Proc. Natl. Acad. Sci. USA 2008, 105, 20701–20704. [Google Scholar]
- Luan, L.; Evans, R.D.; Jokerst, N.M.; Fair, R.B. Integrated optical sensor in a digital microfluidic platform. IEEE Sens. J 2008, 8, 628–635. [Google Scholar]
- Adams, M.L.; Loncar, M.; Scherer, A.; Qiu, Y.M. Microfluidic integration of porous photonic crystal nanolasers for chemical sensing. IEEE J. Sel. Areas Commun 2005, 23, 1348–1354. [Google Scholar]
- Monat, C.; Domachuk, P.; Eggleton, B.J. Integrated optofluidics: A new river of light. Nat. Photonics 2007, 1, 106–114. [Google Scholar]
- White, I.M.; Oveys, H.; Fan, X.; Smith, T.L.; Zhang, J. Integrated multiplexed biosensors based on liquid core optical ring resonators and antiresonant reflecting optical waveguides. Appl. Phys. Lett 2006, 89, 191106. [Google Scholar]
- Sernelius, B.E. Surface Modes in Physics; Wiley-VCH: Berlin, Germany, 2001. [Google Scholar]
- Senlik, O.; Tang, L.; Tor-Ngern, P.; Yoshie, T. Optical microcavities clad by low-absorption electrode media. IEEE Photonic. J 2010, 2, 794–801. [Google Scholar]
- Chow, E.; Grot, A.; Mirkarimi, L.W.; Sigalas, M.; Girolami, G. Ultracompact biochemical sensor built with two-dimensional photoniccrystal microcavity. Opt. Lett 2004, 29, 1093–1095. [Google Scholar]
- De Vos, K.; Bartolozzi, I.; Schacht, E.; Bienstman, P.; Baets, R. Silicon-on-Insulator microring resonator forsensitive and label-free biosensing. Opt. Express 2007, 15, 7610–7615. [Google Scholar]
- DeLouise, L.A.; Kou, P.M.; Miller, B.L. Cross-correlation of optical microcavity biosensor response with immobilized enzyme activity. Insights into biosensor sensitivity. Anal. Chem 2005, 77, 3222–3230. [Google Scholar]
- Hanumegowda, N.M.; Stica, C.J.; Patel, B.C.; White, I.; Fan, X. Refractometric sensors based on microsphere resonators. Appl. Phys. Lett 2005, 87, 201107. [Google Scholar]
- Krioukov, E.; Klunder, D.J.W.; Driessen, A.; Greve, J.; Otto, C. Sensor based on an integrated optical microcavity. Opt. Lett 2002, 27, 512–514. [Google Scholar]
- Lu, T.W.; Hsiao, Y.H.; Ho, W.D.; Lee, P.T. Photonic crystal heteroslab-edge microcavity with high quality factor surface mode for index sensing. Appl. Phys. Lett 2009, 94, 141110. [Google Scholar]
- Robinson, J.T.; Chen, L.; Lipson, M. On-chip gas detection in silicon optical microcavities. Opt. Express 2008, 16, 4296–4301. [Google Scholar]
- Schweinsberg, A.; Hocde, S.; Lepeshkin, N.N.; Boyd, R.W.; Chase, C.; Fajardo, J.E. An environmental sensor based on an integrated optical whispering gallery mode disk resonator. Sens. Actuat. B 2007, 123, 727–732. [Google Scholar]
- Xu, F.; Horak, P.; Brambilla, G. Optical microfiber coil resonator refractometric sensor. Opt. Express 2007, 15, 7888–7893. [Google Scholar]
- Dündar, M.A.; Ryckebosch, E.C.I.; Nötzel, R.; Karouta, F.; van IJzendoorn, L.J.; van der Heijden, R.W. Sensitivities of InGaAsP photonic crystal membrane nanocavities to hole refractive index. Opt. Express 2010, 18, 4049–4056. [Google Scholar]
- Falco, A.D.; O’Faolain, L.; Krauss, T.F. Chemical sensing in slotted photonic crystal heterostructure cavities. Appl. Phys. Lett 2009, 94, 063503. [Google Scholar]
- Levi, O.; Lee, M.M.; Zhang, J.; Lousse, V.; Brueck, S.R.J.; Fan, S.; Harris, J.S. Sensitivity analysis of a photonic crystal structure for index-of-refraction sensing. Proc. SPIE 2007, 6447, 64470P. [Google Scholar]
- Ryckebosch, E.C.I.; Dündar, M.A.; Nötzel, R.; Karouta, F.; van IJzendoorn, L.J.; van der Heijden, R.W. Refractive index sensing with an InGaAsP photonic crystal membrane cavity by means of photoluminescence. Proceedings of Symposium IEEE Photonics Benelux Chapter, Brussels, Belgium, 5–6 November 2009; pp. 45–48.
- Sunner, T.; Stichel, T.; Kwon, S.-H.; Schlereth, T.W.; Hofling, S.; Kamp, M.; Forchel, A. Photonic crystal cavity based gas sensor. Appl. Phys. Lett 2008, 92, 261112. [Google Scholar]
- Hu, J.; Sun, X.; Agarwal, A.; Kimerling, L.C. Design guidelines for optical resonator biochemical sensors. J. Opt. Soc. Am. B 2009, 26, 1032–1041. [Google Scholar]
- Palik, E.D. Handbook of Optical Constants of Solids; Academic Press: San Diego, CA, USA, 1998. [Google Scholar]
- Vuckovic, J.; Loncar, M.; Mabuchi, H.; Scherer, A. Optimization of the Q factor in photonic crystal microcavities. IEEE J. Quantum Electron 2002, 38, 850–856. [Google Scholar]
- Akahane, Y.; Asano, T.; Song, B.-S.; Noda, S. Fine-tuned high-Q photonic-crystal nanocavity. Opt. Express 2005, 13, 1202–1214. [Google Scholar]
- Englund, D.; Fushman, I.; Vuckovic, J. General recipe for designing photonic crystal cavities. Opt. Express 2005, 13, 5961–5975. [Google Scholar]
- Kuramochi, E.; Notomi, M.; Mitsugi, S.; Shinya, A.; Tanabe, T.; Watanabe, T. Ultrahigh-Q photonic crystal nanocavities realized by the local width modulation of a line defect. Appl. Phys. Lett 2006, 88, 041112. [Google Scholar]
- Kuramochi, E.; Taniyama, H.; Tanabe, T.; Kawasaki, K.; Roh, Y.-G.; Notomi, M. Ultrahigh-Q one-dimensional photonic crystal nanocavities with modulated mode-gap barriers on SiO2 claddings and on air claddings. Opt. Express 2010, 18, 15859–15869. [Google Scholar]
- Loncar, M.; Hochberg, M.; Scherer, A.; Qiu, Y. High quality factors and room-temperature lasing in a modified single-defect photonic crystal cavity. Opt. Lett 2004, 29, 721–723. [Google Scholar]
- McCutcheon, M.W.; Loncar, M. Design of a silicon nitride photonic crystal nanocavity with a Quality factor of one million for coupling to a diamond nanocrystal. Opt. Express 2008, 16, 19136–19145. [Google Scholar]
- Nozaki, K.; Kita, S.; Baba, T. Room temperature continuous wave operation and controlled spontaneous emission in ultrasmall photonic crystal nanolaser. Opt. Express 2007, 15, 7506–7514. [Google Scholar]
- Song, B.-S.; Noda, S.; Asano, T.; Akahane, Y. Ultra-high-Q photonic double-heterostructure nanocavity. Nat. Mater 2005, 4, 207–210. [Google Scholar]
- Spillane, S.M.; Kippenberg, T.J.; Vahala, K.J.; Goh, K.W.; Wilcut, E.; Kimble, H.J. Ultrahigh- Q toroidal microresonators for cavity quantum electrodynamics. Phys. Rev. A 2005, 71, 013817. [Google Scholar]
- Srinivasan, K.; Borselli, M.; Painter, O.; Stintz, A.; Krishna, S. Cavity Q, mode volume, and lasing threshold in small diameter AlGaAs microdisks with embedded quantum dots. Opt. Express 2006, 14, 1094–1105. [Google Scholar]
- Vuckovic, J.; Yamamoto, Y. Photonic crystal microcavities for cavity quantum electrodynamics with a single quantum dot. Appl. Phys. Lett 2003, 82, 2374–2376. [Google Scholar]
- Yoshie, T.; Scherer, A.; Hendrickson, J.; Khitrova, G.; Gibbs, H.M.; Rupper, G.; Ell, C.; Shchekin, O.B.; Deppe, D.G. Vacuum Rabi splitting with a single quantum dot in a photonic crystal nanocavity. Nature 2004, 432, 200–203. [Google Scholar]
- Zhang, Z.; Qiu, M. Small-volume waveguide-section high Q microcavities in 2D photonic crystal slabs. Opt. Express 2004, 12, 3988–3995. [Google Scholar]
- Mabuch, H.; Doherty, A.C. Cavity quatnum electrodynamics: Coherence in context. Science 2002, 298, 1372–1377. [Google Scholar]
- Houdre, R.; Gibernon, J.L.; Pellandini, P.; Stanley, R.P.; Oesterle, U.; Weisbuch, C.; Ogorman, J.; Roycroft, B.; Ilegems, M. Saturation of the strong-coupling regime in a semiconductor microcavity—free-carrier bleaching of cavity polaritons. Phys. Rev. B 1995, 52, 7810–7813. [Google Scholar]
- Peter, E.; Senellart, P.; Martrou, D.; Lemaitre, A.; Hours, J.; Gerard, J.M.; Bloch, J. Exciton-photon strong-coupling regime for a single quantum dot embedded in a microcavity. Phys. Rev. Lett 2005, 95, 067401. [Google Scholar]
- Reithmaier, J.P.; Sek, G.; Loffler, A.; Hofmann, C.; Kuhn, S.; Reitzenstein, S.; Keldysh, L.V.; Kulakovskii, V.D.; Reinecke, T.L.; Forchel, A. Strong coupling in a single quantum dot-semiconductor microcavity system. Nature 2004, 432, 197–200. [Google Scholar]
- Srinivasan, K.; Painter, O. Linear and nonlinear optical spectroscopy of a strongly coupled microdisk-quantum dot system. Nature 2007, 450, 862–865. [Google Scholar]
- Englund, D.; Faraon, A.; Fushman, I.; Stoltz, N.; Petroff, P.; Vuckovic, J. Controlling cavity reflectivity with a single quantum dot. Nature 2007, 450, 857–861. [Google Scholar]
- Thompson, R.J.; Rempe, G.; Kimble, H.J. Observation of normal-mode splitting for an atom in an optical cavity. Phys. Rev. Lett 1992, 68, 1132–1135. [Google Scholar]
- Boca, A; Miller, R.; Birnbaum, K.M.; Boozer, A.D.; McKeever, J.; Kimble, H.J. Observation of the vacuum Rabi spectrum for one trapped atom. Phys. Rev. Lett 2004, 93, 233603. [Google Scholar]
- Manuz, P.; Puppe, T.; Schuster, I.; Syassen, N.; Pinkkse, P.W.H.; Rempe, G. Normal-mode spectroscopy of a single-bound-atom-cavity system. Phys. Rev. Lett 2005, 94, 033002. [Google Scholar]
- Ren, H.-C.; Vollmer, F.; Arnold, S.; Libchaber, A. High-Q microsphere biosensor—analysis for adsorption of rodlike bacteria. Opt. Express 2007, 15, 17410–17423. [Google Scholar]
- Vollmer, F.; Braun, D.; Libchaber, A.; Khoshsima, M.; Teraoka, I.; Arnold, S. Protein detection by optical shift of a resonant microcavity. Appl. Phys. Lett 2002, 80, 4057–4059. [Google Scholar]
- Noto, M.; Keng, D.; Teraoka, I.; Arnold, S. Detection of protein orientation on the silica microsphere surface using transverse electric/transverse magnetic whispering gallery modes. Biophys. J 2007, 92, 4466–4472. [Google Scholar]
- Teraoka, I.; Arnold, S.; Vollmer, F. Perturbation approach to resonance shifts of whispering-gallery modes in a dielectric microsphere as a probe of a surrounding medium. J. Opt. Soc. Am. B 2003, 20, 1937–1946. [Google Scholar]
- Topolancik, J.; Vollmer, F. Photoinduced transformations in bacteriorhodopsin membrane monitored with optical microcavities. Biophys. J 2007, 92, 2223–2229. [Google Scholar]
- Arnold, S.; Khoshsima, M.; Teraoka, I.; Holler, S.; Vollmer, F. Shift of whispering-gallery modes in microspheres by protein adsorption. Opt. Lett 2003, 28, 272–274. [Google Scholar]
- Arnold, S.; Ramjit, R.; Keng, D.; Kolchenko, V.; Teraoka, I. MicroParticle photophysics illuminates viral bio-sensing. Faraday Discuss 2008, 137, 65–83. [Google Scholar]
- Keng, D.; McAnanama, S.R.; Teraoka, I.; Arnold, S. Resonance fluctuations of a whispering gallery mode biosensor by particles undergoing Brownian motion. Appl. Phys. Lett 2007, 91, 103902. [Google Scholar]
- Vollmer, F.; Arnold, S.; Braun, D.; Teraoka, I.; Libchaber, A. Multiplexed DNA quantification by spectroscopic shift of two microsphere cavities. Biophys. J 2003, 85, 1974–1979. [Google Scholar]
- Blair, S.; Chen, Y. Resonant-enhanced evanescent-wave fluorescence biosensing with cylindrical optical cavities. Appl. Opt 2001, 40, 570–582. [Google Scholar]
- Boyd, R.W.; Heebner, J.E. Sensitive disk resonator photonic biosensor. Appl. Opt 2001, 40, 5742–5747. [Google Scholar]
- Chao, C.-Y.; Guo, L.J. Biochemical sensors based on polymer microrings with sharp asymmetrical resonance. Appl. Phys. Lett 2003, 83, 1527–1529. [Google Scholar]
- Yalcin, A.; Popat, K.C.; Aldridge, J.C.; Desai, T.A.; Hryniewicz, J.; Chbouki, N.; Little, B.E.; Oliver, K.; Van, V.; Sai, C.; Gill, D.; Anthes-Washburn, M.; Unlu, M.S.; Goldberg, B.B. Optical sensing of biomolecules using microring resonators. IEEE J. Sel. Top. Quantum Electron 2006, 12, 148–155. [Google Scholar]
- Sumetsky, M.; Windeler, R.S.; Dulashko, Y.; Fan, X. Optical liquid ring resonator sensor. Opt. Express 2007, 15, 14376–14381. [Google Scholar]
- Chao, C.-Y.; Fung, W.; Guo, L.J. Polymer microring resonators for biochemical sensing applications. IEEE J. Sel. Top. Quantum Electron 2006, 12, 134–142. [Google Scholar]
- Sumetsky, M. Basic elements for microfiber photonics: Micro/nanofibers and microfiber coil resonators. IEEE J. Lightwave Technol 2008, 26, 21–27. [Google Scholar]
- Yablonovitch, E. Inhibited spontaneous emission in solid-state physics and electronics. Phys. Rev. Lett 1987, 58, 2059–2062. [Google Scholar]
- John, S. Strong localization of photons in certain disordered dielectric superlattices. Phys. Rev. Lett 1987, 58, 2486–2489. [Google Scholar]
- Deotare, P.B.; McCutcheon, M.W.; Frank, I.W.; Khan, M.; Loncar, M. High quality factor photonic crystal nanobeam cavities. Appl. Phys. Lett 2009, 94, 121106. [Google Scholar]
- Aoki, K.; Miyazaki, H.T.; Hirayama, H.; Inoshita, K.; Baba, T.; Sakoda, K.; Shinya, N.; Aoyagi, Y. Microassembly of semiconductor three-dimensional photonic crystals. Nat. Mater 2003, 2, 117–121. [Google Scholar]
- Cheng, C.C.; Scherer, A. Fabrication of photonic band-gap crystals. J. Vac. Sci. Technol. B 1995, 13, 2696–2700. [Google Scholar]
- Ho, K.M.; Chan, C.T.; Soukoulis, C.M. Existence of a photonic gap in periodic dielectric structures. Phys. Rev. Lett 1990, 65, 3152. [Google Scholar]
- Ishizaki, K.; Noda, S. Manipulation of photons at the surface of three-dimensional photonic crystals. Nature 2009, 460, 367–370. [Google Scholar]
- Noda, S.; Tomoda, K.; Yamamoto, N.; Chutinan, A. Full Three-dimensional photonic bandgap crystals at near-infrared wavelengths. Science 2000, 289, 604–606. [Google Scholar]
- Ogawa, S.; Imada, M.; Yoshimoto, S.; Okano, M.; Noda, S. Control of light emission by 3D photonic crystals. Science 2004, 305, 227–229. [Google Scholar]
- Qi, M.; Lidorikis, E.; Rakich, P.T.; Johnson, S.G.; Joannopoulos, J.D.; Ippen, E.P.; Smith, H.I. A three-dimensional optical photonic crystal with designed point defects. Nature 2004, 429, 538–542. [Google Scholar]
- Tang, L.; Yoshie, T. High-Q hybrid 3D-2D slab-3D photonic crystal microcavity. Opt. Lett 2010, 35, 3144–3146. [Google Scholar]
- Tang, L.; Yoshie, T. Woodpile photonic crystal fabricated in GaAs by two-directional etching method. J. Vac. Sci. Technol. B 2010, 28, 301–303. [Google Scholar]
- Tang, L.; Yoshie, T. Ultra-high-Q three-dimensional photonic crystal nano-resonators. Opt. Express 2007, 15, 17254–17263. [Google Scholar]
- Tang, L.; Yoshie, T. Monopole woodpile photonic crystal modes for light-matter interaction and optical trapping. Opt. Express 2009, 17, 1346–1351. [Google Scholar]
- Painter, O.; Vuckovic, J.; Scherer, A. Defect modes of a two-dimensional photonic crystal in an optically thin dielectric slab. J. Opt. Soc. Am. B 1999, 16, 275–285. [Google Scholar]
- Akahane, Y.; Asano, T.; Song, B.S.; Noda, S. High-Q photonic nanocavity in a two-dimensional photonic crystal. Nature 2003, 425, 944–947. [Google Scholar]
- Song, B.S.; Noda, S.; Asano, T.; Akahane, Y. Ultra-high-Q photonic double-heterostructure nanocavity. Nat. Mater 2005, 4, 207–210. [Google Scholar]
- Lu, T.-W.; Lin, P.-T.; Sio, K.-U.; Lee, P.-T. Optical sensing of square lattice photonic crystal point-shifted nanocavity for protein adsorption detection. Appl. Phys. Lett 2010, 96, 213702. [Google Scholar]
- Almeida, V.R.; Xu, Q.F.; Barrios, C.A.; Lipson, M. Guiding and confining light in void nanostructure. Opt. Lett 2004, 29, 1209–1211. [Google Scholar]
- Baehr-Jones, T.; Hochberg, M.; Walker, C.; Scherer, A. High-Q optical resonators in silicon-on-insulator-based slot waveguides. Appl. Phys. Lett 2005, 86, 081101. [Google Scholar]
- Gylfason, K.B.; Carlborg, C.F.; Kazmierczak, A.; Dortu, F.; Sohlstrom, H.; Vivien, L.; Barrios, C.A.; van der Wijngaart, W.; Stemme, G. On-chip temperature compensation in an integrated slot-waveguide ring resonator refractive index sensor array. Opt. Express 2010, 18, 3226–3237. [Google Scholar]
- Lee, S.; Eom, S.C.; Chang, J.S.; Huh, C.; Sung, G.Y.; Shin, J.H. Label-free optical biosensing using a horizontal air-slot SiNx microdisk resonator. Opt. Express 2010, 18, 20638–20644. [Google Scholar]
- Skivesen, N.; Têtu, A.; Kristensen, M.; Kjems, J.; Frandsen, L.H.; Borel, P.I. Photonic-crystal waveguide biosensor. Opt. Express 2007, 15, 3169–3176. [Google Scholar]
- Yariv, A.; Yeh, P. Photonics; Oxford University Press: Oxford, UK, 2007. [Google Scholar]
- Loncar, M.; Scherer, A.; Qiu, Y. Photonic crystal laser sources for chemical detection. Appl. Phys. Lett 2003, 82, 4648–4650. [Google Scholar]
- Kita, S.; Hachuda, S.; Nozaki, K.; Baba, T. Nanoslot laser. Appl. Phys. Lett 2010, 97, 161108. [Google Scholar]
- Rahachou, A.I.; Zozoulenko, I.V. Waveguiding properties of surface states in photonic crystals. J. Opt. Soc. Am. B 2006, 23, 1679–1683. [Google Scholar]
- Yeh, P.; Yariv, A.; Hong, C.-S. Electromagnetic propagation in periodic stratified media. I. General theory. J. Opt. Soc. Am 1977, 67, 423–438. [Google Scholar]
- Vlasov, Y.A.; Moll, N.; McNab, S.J. Observation of surface states in a truncated photoniccrystal slab. Opt. Lett 2004, 29, 2175–2177. [Google Scholar]
- Meade, R.D.; Brommer, K.D.; Rappe, A.M.; Joannopoulos, J.D. Electromagnetic Bloch waves at the surface of a photonic crystal. Phys. Rev. B 1991, 44, 10961. [Google Scholar]
- Takahashi, S.; Okano, M.; Imada, M.; Noda, S. Three-dimensional photonic crystals based on double-angled etching and wafer-fusion techniques. Appl. Phys. Lett 2006, 89, 123106. [Google Scholar]


| SPP mode | Photonic mode | Surface Bloch mode | |
|---|---|---|---|
| Structure | Metal-dielectric interface | Dielectrics | Dielectric photonic crystal |
| Sensitivity | High to Very High | Low | High |
| Q factor | Low (10–102) | High | High |
© 2011 by the authors; licensee MDPI, Basel, Switzerland. This article is an open access article distributed under the terms and conditions of the Creative Commons Attribution license (http://creativecommons.org/licenses/by/3.0/).
Share and Cite
Yoshie, T.; Tang, L.; Su, S.-Y. Optical Microcavity: Sensing down to Single Molecules and Atoms. Sensors 2011, 11, 1972-1991. https://doi.org/10.3390/s110201972
Yoshie T, Tang L, Su S-Y. Optical Microcavity: Sensing down to Single Molecules and Atoms. Sensors. 2011; 11(2):1972-1991. https://doi.org/10.3390/s110201972
Chicago/Turabian StyleYoshie, Tomoyuki, Lingling Tang, and Shu-Yu Su. 2011. "Optical Microcavity: Sensing down to Single Molecules and Atoms" Sensors 11, no. 2: 1972-1991. https://doi.org/10.3390/s110201972