Catalytic and Inhibitory Kinetic Behavior of Horseradish Peroxidase on the Electrode Surface

Abstract
: Enzymatic biosensors are often used to detect trace levels of some specific substance. An alternative methodology is applied for enzymatic assays, in which the electrocatalytic kinetic behavior of enzymes is monitored by measuring the faradaic current for a variety of substrate and inhibitor concentrations. Here we examine a steady-state and pre-steady-state reduction of H2O2 on the horseradish peroxidase electrode. The results indicate the substrate-concentration dependence of the steady-state current strictly obeys Michaelis-Menten kinetics rules; in other cases there is ambiguity, whereby he inhibitor-concentration dependence of the steady-state current has a discontinuity under moderate concentration conditions. For pre-steady-state phases, both catalysis and inhibition show an abrupt change of the output current. These anomalous phenomena are universal and there might be an underlying biochemical or electrochemical rationale.1. Introduction
Enzymatic electrodes are not only used to detect trace levels of specific substances, but also used to assay enzyme activities. Peroxidases participate in numerous physiological processes, such as cell wall synthesis, plant defence and activation of oxygen. Horseradish peroxidase (HRP) is a representative peroxidase; the mechanisms of peroxidase-catalyzed reactions have been widely studied using HRP, especially in understanding the biological behavior of the catalyzed oxidation of analytes by H2O2[1–4]. Many H2O2 biosensors have been constructed using HRP due to its ready availability in high purity and low cost [5–7]. The amperometric biosensors with various enzymes are very useful for the determination of analytes with a very low concentration [8–15]. Enzymatic sensors based on electrochemical reduction of H2O2[16–18] and oxidation of NADH [19–21] are now available for clinical and environmental detection of glucose, pyruvate, hypoxanthine, alcohol and formaldehyde.
The use of the rotating disk electrode for the study of an electrochemical mechanism was derived by Levich [22]. The output currents obtained are elucidated using the Koutecky-Levich formalism and the ping-pong kinetic scheme for peroxidase [23–25]. In recent years, a large body of research has focused on the mathematical modeling of enzymatic biosensors. Baronas and coworkers [26,27] presented a two-dimensional-in-space mathematical model of amperometric biosensors. They developed later a model based on non-stationary diffusion equations containing a non-linear term related to the Michaelis-Menten kinetics of amperometric enzyme electrodes [28]. Subsequently, they also provided another model of the biosensor based on the mixed enzyme kinetics and diffusion limitations in the case of substrate inhibition [29], the system of non-linear reaction-diffusion equations [30], and the synergistic substrate determination [31]. Andreu and coworkers [32] formulated analytical expressions describing the voltammetric response of a reagentless mediated enzyme electrode operated under rotating disk conditions. Patre and Sangam [33] built a model based on a diffusion mechanism related to Michaelis-Menten kinetics, which can be used in a membrane of the biosensor. Loghambal and Rajendran [34] worked out a steady-state non-linear reaction/diffusion equation. They also developed a mathematical model of amperometric and potentiometric biosensor [35]. Recently, Garay and coworkers [36] presented a comprehensive numerical treatment of the diffusion and reactions within a sandwich-type amperometric biosensor.
In our work, the electrochemical behavior of HRP enzyme activity is reexamined using H2O2 reduction on the electrode. This enzymatic biosensor is optimized for the detection of HRP activity, including the catalytic and inhibitory kinetic behaviors in steady-state and pre- steady-state phases. Actually, only enzymatic activity during steady state follows the Michaelis-Menten formalism, and anomalous behaviors could be observed in all other kinetic processes, suggesting that there might be an unknown mechanism for the regulation of mass transfer or/and kinetic rate.
2. Experimental
2.1. Reagents
Horseradish peroxidase (EC 1.11.1.7, 300 U/mg) was purchased from Aladdin Reagent Co. Ltd (Beijing, China). Bovine serum albumin (BSA) was obtained from NewProbe Chemicals Co. (Beijing, China). Hydrogen peroxide (30%, w/v solution) was purchased from Yingdaxigui Reagent Company (Tianjin, China) and the concentration of the more diluted hydrogen peroxide solutions prepared from 30% hydrogen peroxide was determined by titration with potassium permanganate. Phenylhydrazine was obtained from Sinopharm Chemical Reagent Co. Ltd (Beijing, China). Phosphate buffer solution (PBS, pH 7.0) contained 3.8 M KH2PO4 and 6.2 M Na2HPO4. All other reagents were of analytical grade.
2.2. Electrode Modification
Prior to modification, the glassy carbon electrode surface was polished with 0.05 mm alumina paste on a micro-cloth and subsequently ultrasonically cleaned thoroughly with acetone, NaOH (1:1), HNO3 (1:1), and doubly distilled water and then dried at room temperature. A mixed solution of 2.0 U/mL HRP and 0.5% (w/w) BSA was prepared by dissolving HRP and BSA in 0.2 mL PBS (50 mM, pH 7.0). A volume of 3 mL of the mixed solution was then added dropwise on the surface of the glassy carbon electrode. The surface area of the electrode is 0.28 cm2. The HRP/BSA electrode was cross-linked by placing the electrode in a closed vessel contained 25% glutaraldehyde and water vapor for 20 min and dried at room temperature for 1 h and stored at 4 °C until use.
2.3. Apparatus
Cyclic voltammetry and amperometric experiments were performed with a LabChem 10M electrochemical workstation (Tianjin, China) and a conventional three-electrode system. The modified glassy carbon electrode served as working electrode, a platinum wire as counter electrode, and a saturated calomel electrode (SCE) as reference electrode. A 0.10 M pH 7.0 phosphate buffer solution (PBS) was used as supporting electrolyte. A magnetic stirrer (approximately 400 rpm) was employed during the amperometric measurements. All experiments were carried out at room temperature.
2.4. Cyclic Voltammetry Test
The electrochemical properties of the electrode modified were characterized by cyclic voltammetry. Electrochemical experiments were performed in a conventional electrochemical cell containing a three electrode arrangement and the potential swept from −0.4 to 0.2 V (vs. SCE) at a sweeping rate of 0.1 V/s. The cyclic voltammetry experiment was performed in 5 mL pH 7.0 PBS. All experiments were conducted at 25 °C.
2.5. Amperometric Assay
Electrochemical experiments were undertaken in the electrochemical cell containing 25 mL of the supporting electrolyte. Amperometric measurements were carried out in a stirred solution (approx. 400 rpm). The electrodes were immersed into a stirred phosphate buffer solution (pH 6.5) containing 1.0 mM hydroquinone as the electron mediator and an initial baseline current was recorded. 0.1 mM H2O2 solution was added to get an increased steady-state current record. Subsequently, solution of increasing phenylhydrazine concentration was added with a micropipette in succession and the current decrease was recorded. All experiments were conducted at 25 °C.
2.6. Correlation Analysis
Pearson correlation was a measurement of the strength and direction of a linear relationship between two groups of data. Statistical significance is determined for a p-value <0.05 for all tests. Strong correlation is determined for an absolute r value >0.7; weak correlation > 0.5. The bi-variate correlation analysis was carried out by the R statistical package (version 2.13.0; http://www.r-project.org/) [37]. The linear regression analysis was performed by the online Free Statistics and Forecasting Software (version 1.1.23-r6; http://www.wessa.net/slr.wasp).
3. Results and Discussion
3.1. The Model
The following reaction sequence can be proposed for the case of mediated electrocatalytic reduction of H2O2 at HRP electrode [38,39]:
where HRP is horseradish peroxidase. Fe3+ is the HRP cofactor. Compound (I) (oxidation state +5) and Compound(II) (oxidation state +4) are oxidized intermediates. QH2 and Q represent hydroquinone and its oxidized form (benzoquinone), respectively. In these reactions, a two-electron oxidation of the ferriheme moiety of HRP enzyme is caused by H2O2. The resulting intermediate Compound (I) consists of oxyferryl iron and a porphyrin π cation radical. Compound (I) is reduced to Compound (II) and then it was further reduced to the original form of HRP (Fe3+) by the mediator QH2. Q is finally reduced back to QH2 by a rapid reaction involving the acceptance of two electrons from the electrode.
The inhibition of phenylhydrazine to HRP is an anticompetitive inhibition [39]. When the inhibitor (phenylhydrazine) is added into the electrolyte solution, it can combine with Compound (I) causing the decrease of the current i. The possible mechanism of inhibition could be represented as follows:
After adding substrate or inhibitor dropwise, the current rapidly returns toward equilibrium (steady state) with increasing time. For the pre-steady-state part of enzymatic reaction, the current obeys exponential decay equation, i.e.,
where i is the faradaic current at time t. i∞ is the steady-state current. τ is relaxation time, being equal to the time constant of an exponential return of a faradaic current to equilibrium after adding substrate or inhibitor, which reflects the rate at which excited current return to steady-state current.
Suppose that a steady-state current (i∞) is the current when the biosensor system approaches to equilibrium as t → ∞:
where i(t) is the current at time t. In practice, the current at the response time tR is assumed as i∞. tR is defined as the time when the absolute current slope falls below a given small value (ε < 0.0001) [27], i.e.,
A reduction current (i∞) observed on electrode is a combination of the mass transport-limited current (i∞,L) and the reaction-rate-limited current (i∞,K) [40], accords with the Koutecky-Levich equation, i.e.,
For a rotating disk electrode, the mass-transport-limited current (i∞,L) depends on the angular rotation velocity (ω) of the electrode and the bulk concentration ([H2O2]) of H2O2, i.e., i∞,L is determined by the Levich equation [22,41]:
where n is the number of electrons transferred to the enzyme in one catalytic cycle (n = 2). F is the Faraday constant. A is the area of the electrode surface. D is the diffusion coefficient of H2O2. ν is the kinematic viscosity of water. For a given biosensor that is rotating at a constant angular velocity, i∞,L is proportional to [H2O2], Equation (7) reduces to:
where a1 is constant (a1 = 0.62nFAD2/3ν−1/6ω1/2).
When the transport of H2O2 is high enough to keep its concentration at the electrode surface equal to that in the bulk solution, the reaction-rate-limited current i∞,K is governed by the ping-pong kinetic scheme, being expressed by [24,39]:
Where Γ is the surface concentration of HRP enzyme. [QH2] is the concentration of hydroquinone. [I] is the concentration of phenylhydrazine inhibitor. Assuming that a2 = 1/nFAΓk1, b = 1/nFAΓkI, and c1 = (k2 + k3)/(nFAΓk2k3[QH2])+1/nFAΓ, Equation (9) can be also reduced to:
Substituting Equations (8) and (10) into Equation (6), the Koutecky-Levich equation can be reduced to:
where a3 = a2 + 1/a1.
Combining b[I] term with constant c1 in Equation (11) in a constant phenylhydrazine concentration, we obtain c2 = c1 + b[I]. The dependence of the steady-state current on the substrate concentration is written as:
Combining a3/[H2O2] term with constant c1 in Equation (11) in a constant H2O2 concentration, we obtain c3 = c1 + a3/[H2O2]. The dependence of the steady-state current on the inhibitor concentration is written as:
3.2. Electrochemical Biosensor
Horseradish peroxidase (HRP) and bovine serum albumin (BSA) are immobilized on the surface of a glassy carbon (GC) electrode. Hydroquinone/quinone mediator facilitates the electron transfer between protein and the electrode. Experiments are performed with H2O2 to ascertain if HRP is indeed immobilized on the electrode.
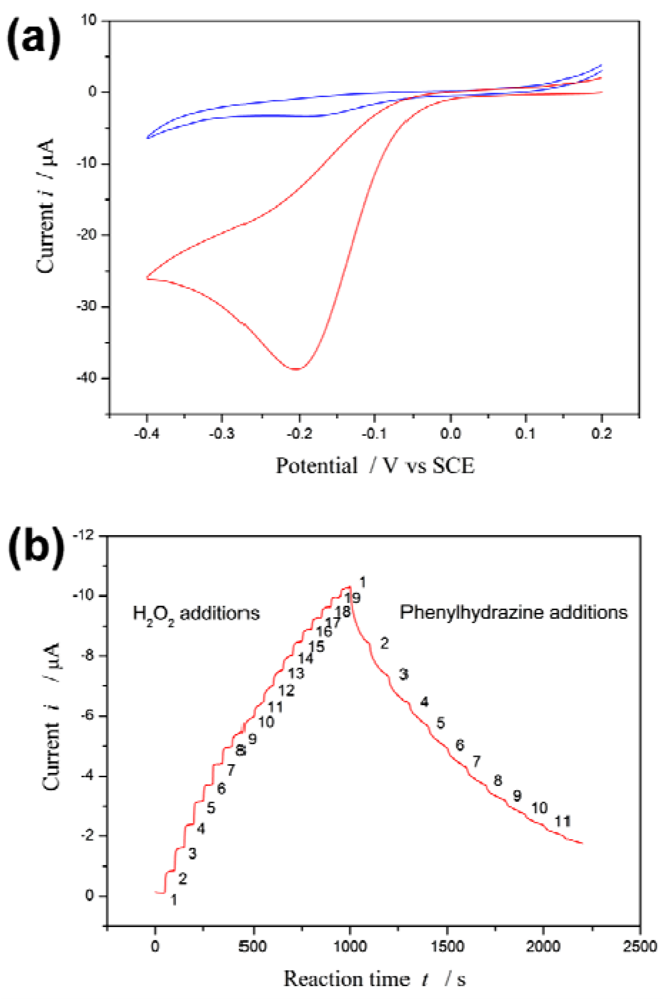
Figure 1(a) depicts the cyclic voltammetry curves of the proposed biosensor in the presence and absence of H2O2. A redox couple is observed in the absence of H2O2. However, an enhancement of the peak current is observed in the presence of H2O2. On the other hand, it has been reported that phenylhydrazine is able to inhibit or abrogate HRP activity by competing with the normal hydroquinone [42,43]. The inhibition effect of phenylhydrazine is measured by using the proposed biosensor.
Upon 19 successive additions of 0.1 mM H2O2 substrate to the electrolyte solution, i increases with [H2O2]. Subsequently, upon 11 successive additions of 0.5 mM phenylhydrazine inhibitor to the electrolyte solution, i decreases with increasing [I] see Figure 1(b).
The steep increased (or decreased) in magnitude of the current is observed when H2O2 (or phenylhydrazine) is added into the electrolyte solution, and then the current returns to equilibrium (steady state i∞) following an exponential decay with a certain recovery speed (relaxation time τ). The values of i∞ and τ are best computed by non-linear regression of data fitted to Equation (2). These values at different substrate concentration are listed in Table S1 (Appendix); they at different inhibitor concentration in Table S2 (Appendix).
3.3. Electrochemical Enzyme Assay
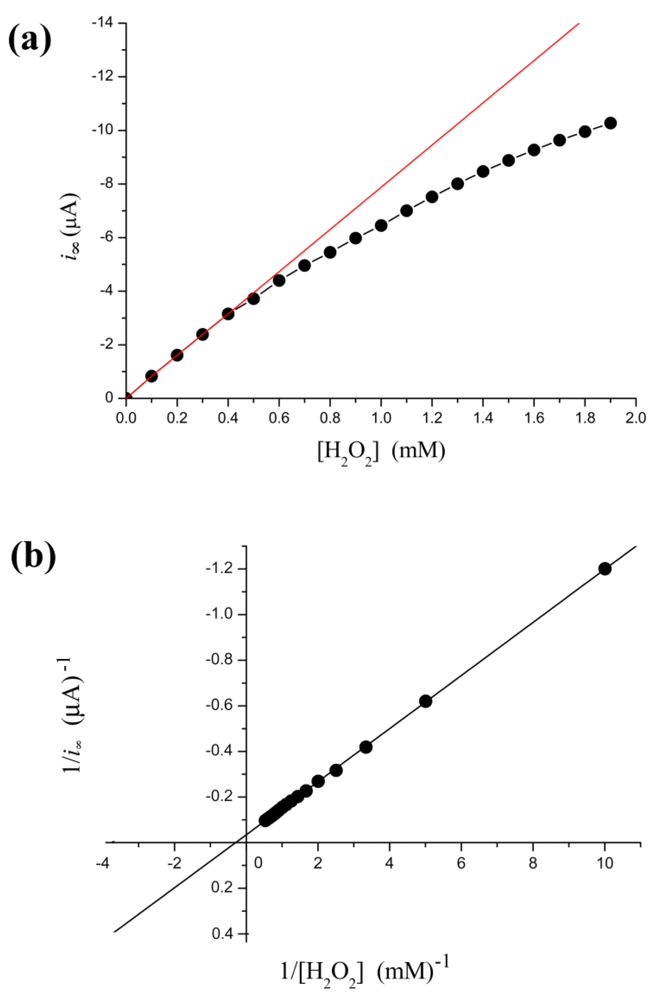
From Figure 2(a), the relation between i∞ and [H2O2] is not linear. The calibration curve is valid only under low concentration of substrate conditions. More specifically, when [H2O2] < 0.4 mM, the relation is very close to a straight line (calibration curve): i∞ = −7.86(±0.074) × [H2O2] − 0.025(±0.018) with r = −0.999; p < 0.0001. This linear correlation is a prerequisite for applying the electrochemical biosensors. Thus electrocatalysis reduction to H2O2 with HRP electrode can detect trace levels of H2O2. In fact, our result shows the steady-state current follows the Michaelis-Menten kinetic model within a broader concentration range. Kinetic constants are determined by fitting the initial rate data to Lineweaver-Burk plot Figure 2(b). Thus, the current is regarded as a relative enzyme reaction rate. This methodology could monitor in real-time subtle changes in enzyme activity.
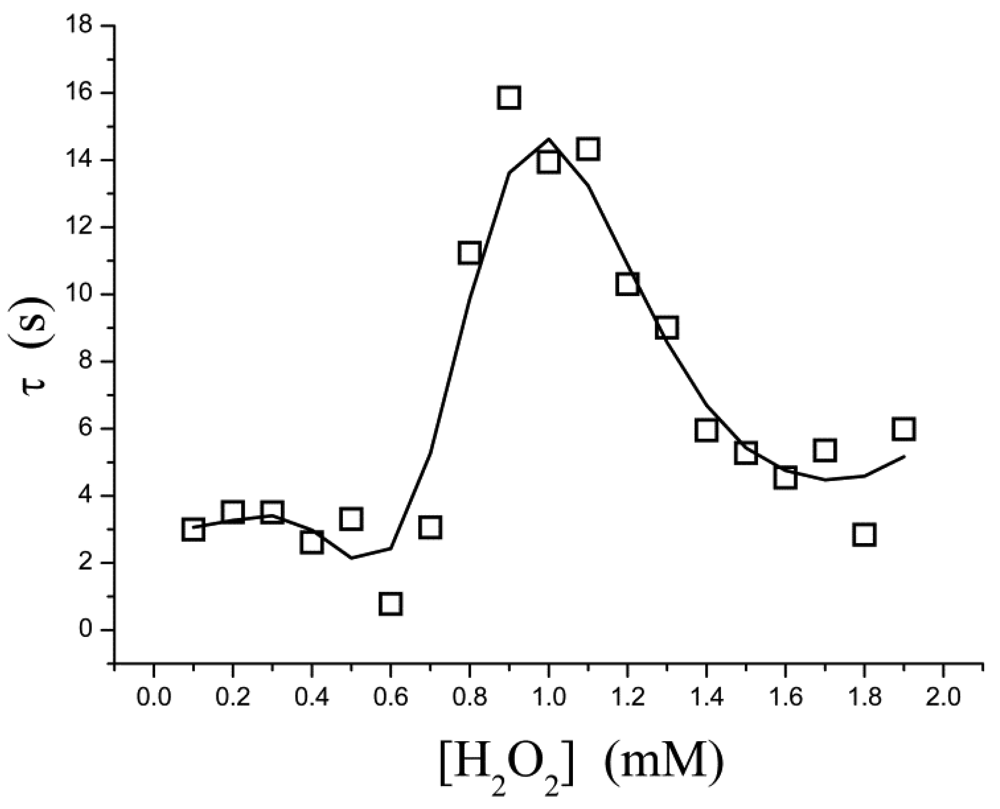
The pre-steady-state time course of the i → i∞ process is fitted to Equation (3) for a single exponential decay, in which τ is the apparent relaxation time for output current (i.e., the reciprocal of the apparent first-order rate constant). It is found, however, that τ is not a simple function of the substrate concentration. As shown in Figure 3, τ is low in both the low- and high-concentration regions; a relatively larger τ occurs in at a moderate concentration ([H2O2] = 0.8–1.4 mM). This suggests that, within this concentration range, the rate at which the equilibrium is approached is slowed down.
If the kinetic control becomes operative, there is a possible explanation: a “shoulder” appears on the curve of t0.5versus[H2O2] in the two-dimensional-in-space biosensor model, as has been proposed in reference [27]. Where t0.5 is the half time (t0.5 = 0.693τ). Baronas et al.[27] showed that the shoulder occurs at [H2O2] near to the Michaelis constant Km. At [H2O2] ≪ Km (τ = 1/k1Km) the reaction kinetics for [H2O2] is a zero order throughout the biosensor, whereas for [H2O2] ≫ Km (τ = 1/k1[H2O2]) the kinetics is a first order throughout. At intermediate values of [H2O2] the kinetics undergoes a transition from zero order to first order. This phenomenon is also manifested in inhibition assays, so it is not obvious whether agreement between our data and the shoulder of t0.5 is not a coincidence. Inhibition kinetics also experiences a transition from zero order to first order, but it is not proof.
3.4. Electrochemical Inhibition Assay
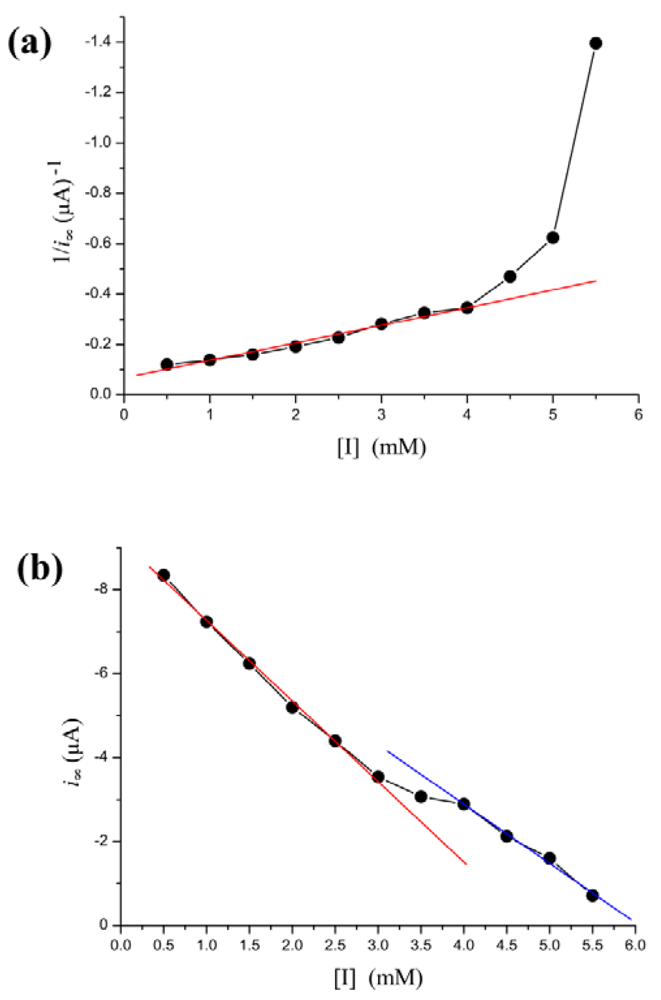
Phenylhydrazine can inhibit HRP activity [42,43]. In our biosensor, i∞ decreased steadily as [I] is increased. However, the Lineweaver-Burk plot for the substrate dependence shows that the reaction does not follow Michaelis-Menten kinetics, as the curve connecting the experimental points is clearly curved Figure 4(a). However, there is a more simple linear relationship between i∞ and [I]. The dependence of the rate of i∞ change on [I] is illustrated in Figure 4(b). As shown in the figure, the regression line is discontinuous at inhibitor concentration of 3–4 mM. The [I]-i∞ relation is broken into two individual lines. When [I] < 3 mM, decrease of i∞ along a regression line is given by the equation: i∞ = −1.92(±0.075) × [I] − 9.19(±0.03) with r = −0.999; p < 0.0001. When [I] > 4 mM, decline of i∞ along another line is given by the equation: i∞ = −1.41(±0.024) × [I] − 8.54(±0.1) with r = −0.999; p < 0.0001.
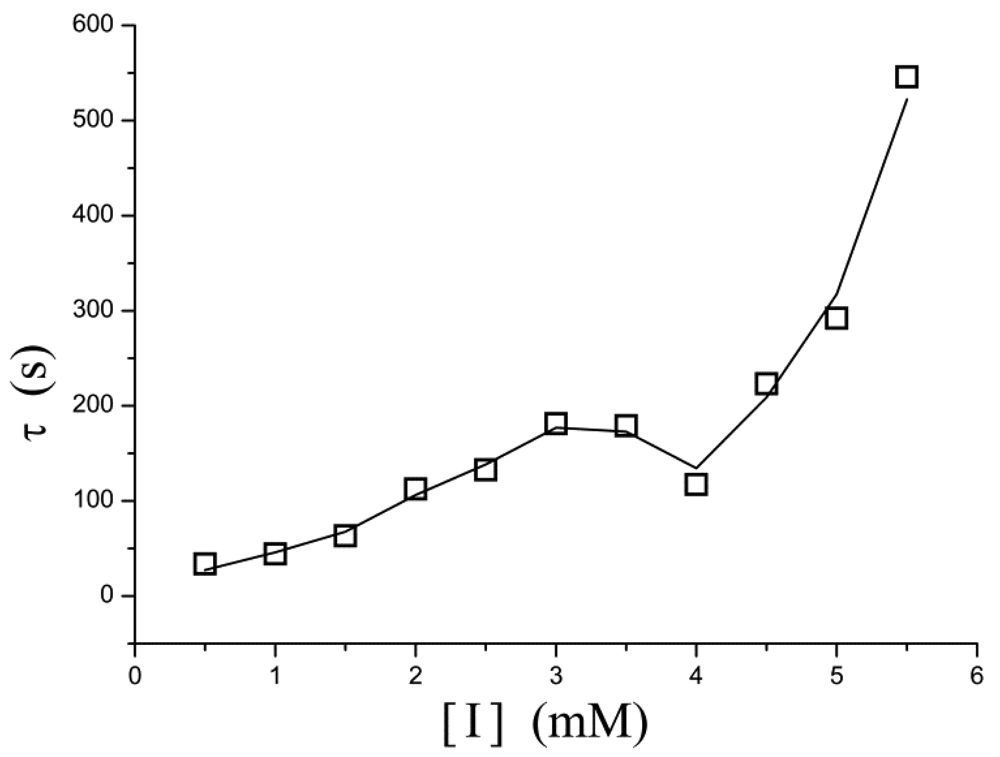
A similar phenomenon occurs in the relation between [I] and τ as well. In Figure 5, τ increases exponentially as the inhibitor concentration increases. However, in the concentration of 3–4 mM, the points determined experimentally is lower than τ value extrapolated from low concentration and thus the curve displays a drop.
4. Conclusions
We have examined the electrocatalytic behavior of enzymatic biosensors and possibilities for measuring the enzymatic activities. The substrate concentration-dependence of such a steady-state current is governed by the Michaelis-Menten equation under the condition of constant diffusion, suggesting that the output current reflects the relative rate of the enzyme reaction. For our datasets, we find that Michaelis-Menten model does not work well at high inhibitor concentrations and works better at low concentrations, and the enzymatic kinetics gives the best results in the absence of inhibitor. Deviations from this model cause observed sudden changes in the current occurring at intermediate concentrations of inhibitor or substrate. An auto-deceleration of the current occurs when the substrate reaches a specific concentration ([H2O2] = 0.7 mM). In contrast, an auto-acceleration occurs when the inhibitor reaches another critical concentration ([I] = 3 mM).
Electrochemical enzyme assays provide an extremely sensitive measure but suffer from difficulties in interpretation of the data. At relatively higher concentrations of H2O2, the steady-state current follows the Michaelis-Menten equation (Figure 2) and the relaxation time is low (Figure 3). These indicate that no significant H2O2-induced suicide inactivation of HRP enzyme occurs in our experiment. The Levich equation and ping-pong kinetics emphasize that the current should be a monotonically increasing (or decreasing) function of the concentration of substrate (or inhibitor) either under diffusion limitations or under enzyme kinetics. However, peaks, discontinuities and sudden changes appear in Figures 3–5 and their definite mechanism is unknown yet. Also, it is not clear whether the same would be true for other enzymes. Electrochemical biosensors do not provide any microscopic information, and even assignment of the relaxation modes (whether it is the mode of a mass transfer or of a chemical reaction) is not obvious.
Acknowledgments
The authors wish to thank Professor Jinpeng Cheng of Nankai University for his continuous support and encouragement. We are indebted to our colleagues Professor Jiaqi He for very useful discussions. This work was supported by the National Natural Science Foundations of China (NSFC-20972078 and NSFC-20721062).
References
- Park, B.W.; Ko, K.A.; Yoon, D.Y.; Kim, D.S. Enzyme activity assay for horseradish peroxidase encapsulated in peptide nanotubes. Enzyme Microb. Technol. 2012, 51, 81–85. [Google Scholar]
- Salinas, E.; Torriero, A.A.; Sanz, M.I.; Battaglini, F.; Raba, J. Continuous-flow system for horseradish peroxidase enzyme assay comprising a packed-column, an amperometric detector and a rotating bioreactor. Talanta 2005, 66, 92–102. [Google Scholar]
- Ambler, L.; Peters, G.E. An immune specific enzyme assay for horseradish peroxidase. Anal. Biochem. 1984, 137, 66–68. [Google Scholar]
- Zaitsu, K.; Ohkura, Y. New fluorogenic substrates for horseradish peroxidase: rapid and sensitive assays for hydrogen peroxide and the peroxidase. Anal. Biochem. 1980, 109, 109–113. [Google Scholar]
- Wang, Y.; Du, J.; Li, Y.; Shan, D.; Zhou, X.; Xue, Z.; Lu, X. Aamperometric biosensor for hydrogen peroxide by adsorption of horseradish peroxidase onto single-walled carbon nanotubes. Colloid. Surf. B Biointerface. 2012, 90, 62–67. [Google Scholar]
- Periasamy, A.P.; Yang, S.; Chen, S.M. Preparation and characterization of bismuth oxide nanoparticles-multiwalled carbon nanotube composite for the development of horseradish peroxidase based H2O2 biosensor. Talanta 2011, 87, 15–23. [Google Scholar]
- Zeng, X.; Li, X.; Liu, X.; Liu, Y.; Luo, S.; Kong, B.; Yang, S.; Wei, W. A third-generation hydrogen peroxide biosensor based on horseradish peroxidase immobilized on DNA functionalized carbon nanotubes. Biosens. Bioelectron. 2009, 25, 896–900. [Google Scholar]
- Wu, H.; Liu, S.; Jiang, J.; Shen, G.; Yu, R. A sensitive electrochemical biosensor for detection of DNA methyl transferase activity by combining DNA methylation-sensitive cleavage and terminal transferase-mediated extension. Chem. Commun. 2012, 48, 6280–6282. [Google Scholar]
- Wang, C.L.; Wei, L.Y.; Yuan, C.J.; Hwang, K.C. Reusable amperometric biosensor for measuring protein tyrosine kinase activity. Anal. Chem. 2012, 84, 971–977. [Google Scholar]
- Reder-Christ, K.; Bendas, G. Biosensor applications in the field of antibiotic research—A review of recent developments. Sensors 2011, 11, 9450–9466. [Google Scholar]
- Palchetti, I.; Laschi, S.; Mascini, M. Electrochemical biosensor technology: Application to pesticide detection. Meth. Mol. Biol. 2009, 504, 115–126. [Google Scholar]
- Healy, D.A.; Hayes, C.J.; Leonard, P.; McKenna, L.; O'Kennedy, R. Biosensor developments: Application to prostate-specific antigen detection. Trends Biotechnol. 2007, 25, 125–131. [Google Scholar]
- Goldschmidt, M.C. The use of biosensor and microarray techniques in the rapid detection and identification of salmonellae. J. AOAC Int. 2006, 89, 530–537. [Google Scholar]
- Ligler, F.S.; Taitt, C.R.; Shriver-Lake, L.C.; Sapsford, K.E.; Shubin, Y.; Golden, J.P. Array biosensor for detection of toxins. Anal. Bioanal. Chem. 2003, 377, 469–477. [Google Scholar]
- Hall, R.H. Biosensor technologies for detecting microbiological foodborne hazards. Microb. Infect. 2002, 4, 425–432. [Google Scholar]
- Cui, L.; Yin, H.; Dong, J.; Fan, H.; Liu, T.; Ju, P.; Ai, S. A mimic peroxidase biosensor based on calcined layered double hydroxide for detection of H2O2. Biosens. Bioelectron. 2011, 26, 3278–3283. [Google Scholar]
- Rui, Q.; Komori, K.; Tian, Y.; Liu, H.; Luo, Y.; Sakai, Y. Electrochemical biosensor for the detection of H2O2 from living cancer cells based on ZnO nanosheets. Anal. Chim. Acta 2010, 670, 57–62. [Google Scholar]
- Han, M.; Liu, S.; Bao, J.; Dai, Z. Pd nanoparticle assemblies—As the substitute of HRP, in their biosensing applications for H2O2 and glucose. Biosens. Bioelectron. 2012, 31, 151–156. [Google Scholar]
- Jones, R.D.; Hancock, J.T.; Morice, A.H. NADPH oxidase: A universal oxygen sensor? Free Radic. Biol. Med. 2000, 29, 416–424. [Google Scholar]
- Brekasis, D.; Paget, M.S. A novel sensor of NADH/NAD+ redox poise in Streptomyces coelicolor A3(2). EMBO. J. 2003, 22, 4856–4865. [Google Scholar]
- Ricci, F.; Amine, A.; Moscone, D.; Palleschi, G. A probe for NADH and H2O2 amperometric detection at low applied potential for oxidase and dehydrogenase based biosensor applications. Biosens. Bioelectron. 2007, 22, 854–862. [Google Scholar]
- Levich, B. The theory of concentration polarization. Acta Phys. Chim. URSS 1942, 17, 257–307. [Google Scholar]
- Vidal-Iglesias, F.J.; Solla-Gullon, J.; Montiel, V.; Aldaz, A. Errors in the use of the Koutecky-Levich plots. Electrochem. Commun. 2012, 15, 42–45. [Google Scholar]
- Rosca, V.; Popescu, I.C. Kinetic analysis of horseradish peroxidase “wiring” in redox polyelectrolyte-peroxidase multilayer assemblies. Electrochem. Commun. 2002, 4, 904–911. [Google Scholar]
- Ruzgas, T.; Gorton, L.; Emnéus, J.; Marko-Varga, G. Kinetic models of horseradish peroxidase action on a graphite electrode. J. Electroanal. Chem. 1995, 391, 41–49. [Google Scholar]
- Baronas, R.; Ivanauskas, F.; Kulys, J.; Sapagovas, M. Modelling of amperometric biosensors with rough surface of the enzyme membrane. J. Math. Chem. 2003, 34, 227–242. [Google Scholar]
- Baronas, R.; Ivanauskas, F.; Kulys, J. Mathematical modeling of biosensors based on an array of enzyme microreactors. Sensors 2006, 6, 453–465. [Google Scholar]
- Baronas, R.; Kulys, J.; Ivanauskas, F.C. Modellingamperometric enzyme electrode with substrate cyclic conversion. Biosens. Bioelectron. 2004, 19, 915–922. [Google Scholar]
- Kulys, J.; Baronas, R. Modelling of amperometric biosensors in the case of substrate inhibition. Sensors 2006, 6, 1513–1522. [Google Scholar]
- Baronas, R.; Kulys, J. Modelling amperometric biosensors based on chemically modified electrodes. Sensors 2008, 8, 4800–4820. [Google Scholar]
- Simelevicius, D.; Baronas, R.; Kulys, J. Modelling of amperometric biosensor used for synergistic substrates determination. Sensors 2012, 12, 4897–4917. [Google Scholar]
- Calvente, J.J.; Narvaez, A.; Dominguez, E.; Andreu, R. Kinetic analysis of wired enzyme electrodes: Application to horseradish peroxidase entrapped in a redox polymer matrix. J. Phys. Chem. B 2003, 107, 6629–6643. [Google Scholar]
- Patre, B.M.; Sangam, V.G. Mathematical model of an amperometric biosensor for the design of an appropriate instrumentation system. J. Med. Eng. Technol. 2007, 31, 351–360. [Google Scholar]
- Loghambal, S.; Rajendran, L. Mathematical modeling in amperometric oxidase enzyme-membrane electrodes. J. Membr. Sci. 2011, 373, 20–28. [Google Scholar]
- Meena, A.; Rajendran, L. Mathematical modeling of amperometric and potentiometric biosensors and system of non-linear equations—Homotopy perturbation approach. J. Electroanal. Chem. 2010, 644, 50–59. [Google Scholar]
- Romero, M.R.; Baruzzi, A.M.; Garay, F. Mathematical modeling and experimental results of a sandwich-type amperometric biosensor. Sens. Actuators B: Chem. 2012, 162, 284–291. [Google Scholar]
- Gonzalez, J.R.; Armengol, L.; Sole, X.; Guino, E.; Mercader, J.M.; Estivill, X.; Moreno, V. SNPassoc: An R package to perform whole genome association studies. Bioinformatics 2007, 23, 654–655. [Google Scholar]
- Dunford, H.B.; Everse, J.; Everse, K.E.; Grisham, M.B. Peroxidases in Chemistry and Biology; CRC Press: Boca Raton, FL, USA, 1991; Volume 2, p. 1. [Google Scholar]
- Tang, L.; Zeng, G.M.; Huang, G.H.; Shen, G.L.; Niu, C.G. Kinetic study on the inhibition and catalysis of horseradish peroxidase biosensor. J. Chin. Biotechnol. 2004, 24, 70–75. [Google Scholar]
- Bard, A.J.; Faulkner, L.R. Electrochemical Methods: Fundamentals and Applications; Wiley: New York, NY, USA, 1980; p. 290. [Google Scholar]
- Burgess, K.S.D.; Kable, J.W.; Justice, J.B., Jr. Rotating disk electrode voltammetry applied to the kinetics of uptake and efflux in wild-type and mutant catecholamine transporters. Electroanalysis 1999, 11, 337–343. [Google Scholar]
- Yang, Z.S.; Wu, W.L.; Chen, X.; Liu, Y.C. An amperometric horseradish peroxidase inhibition biosensor for the determination of phenylhydrazine. Anal. Sci. 2008, 24, 895–899. [Google Scholar]
- Straus, W. Phenylhydrazine as inhibitor of horseradish peroxidase for use in immune peroxidase procedures. J. Histochem. Cytochem. 1972, 20, 949–951. [Google Scholar]


Appendix

| [H2O2]mM | i∞(μA) | τ (s) | Accuracy | |
|---|---|---|---|---|
| χ2/dof | r | |||
| 0.1 | −0.833 | 2.996 | 3.01 × 10⁻⁴ | 0.990 |
| 0.2 | −1.614 | 3.513 | 4.52 × 10⁻⁴ | 0.992 |
| 0.3 | −2.389 | 3.507 | 4.08 × 10⁻⁴ | 0.992 |
| 0.4 | −3.153 | 2.614 | 2.20 × 10⁻⁴ | 0.993 |
| 0.5 | −3.718 | 3.307 | 9.32 × 10⁻⁵ | 0.995 |
| 0.6 | −4.403 | 4.370 | 1.87 × 10⁻⁴ | 0.985 |
| 0.7 | −4.961 | 3.059 | 3.17 × 10⁻⁴ | 0.979 |
| 0.8 | −5.450 | 11.232 | 5.94 × 10⁻⁴ | 0.962 |
| 0.9 | −5.979 | 15.859 | 3.71 × 10⁻⁴ | 0.981 |
| 1.0 | −6.451 | 13.940 | 8.40 × 10⁻⁴ | 0.964 |
| 1.1 | −7.006 | 14.331 | 6.21 × 10⁻⁴ | 0.977 |
| 1.2 | −7.520 | 10.307 | 5.10 × 10⁻⁴ | 0.980 |
| 1.3 | −8.008 | 9.009 | 3.47 × 10⁻⁴ | 0.984 |
| 1.4 | −8.468 | 5.952 | 2.27 × 10⁻⁴ | 0.988 |
| 1.5 | −8.881 | 5.278 | 2.24 × 10⁻⁴ | 0.986 |
| 1.6 | −9.268 | 4.542 | 3.17 × 10⁻⁴ | 0.973 |
| 1.7 | −9.633 | 5.355 | 1.49 × 10⁻⁴ | 0.988 |
| 1.8 | −9.953 | 2.840 | 4.20 × 10⁻⁴ | 0.927 |
| 1.9 | −10.272 | 5.987 | 3.87 × 10⁻⁴ | 0.954 |
| [I] mM | i∞(μA) | τ (s) | Accuracy | |
|---|---|---|---|---|
| χ2/dof | r | |||
| 0.5 | −8.348 | 33.777 | 1.48 × 10⁻³ | 0.997 |
| 1.0 | −7.235 | 44.277 | 6.57 × 10⁻⁴ | 0.995 |
| 1.5 | −6.240 | 63.354 | 5.21 × 10⁻⁴ | 0.994 |
| 2.0 | −5.201 | 112.63 | 3.84 × 10⁻⁴ | 0.994 |
| 2.5 | −4.402 | 132.71 | 4.24 × 10⁻⁴ | 0.992 |
| 3.0 | −3.543 | 181.32 | 2.61 × 10⁻⁴ | 0.994 |
| 3.5 | −3.069 | 179.08 | 3.42 × 10⁻⁴ | 0.990 |
| 4.0 | −2.893 | 117.37 | 2.19 × 10⁻⁴ | 0.991 |
| 4.5 | −2.128 | 223.28 | 1.58 × 10⁻⁴ | 0.992 |
| 5.0 | −1.602 | 292.14 | 1.71 × 10⁻⁴ | 0.989 |
| 5.5 | −0.716 | 545.95 | 1.62 × 10⁻⁴ | 0.986 |
© 2012 by the authors; licensee MDPI, Basel, Switzerland. This article is an open access article distributed under the terms and conditions of the Creative Commons Attribution license (http://creativecommons.org/licenses/by/3.0/).
Share and Cite
Huang, J.; Huang, W.; Wang, T. Catalytic and Inhibitory Kinetic Behavior of Horseradish Peroxidase on the Electrode Surface. Sensors 2012, 12, 14556-14569. https://doi.org/10.3390/s121114556
Huang J, Huang W, Wang T. Catalytic and Inhibitory Kinetic Behavior of Horseradish Peroxidase on the Electrode Surface. Sensors. 2012; 12(11):14556-14569. https://doi.org/10.3390/s121114556
Chicago/Turabian StyleHuang, Jitao, Wei Huang, and Titi Wang. 2012. "Catalytic and Inhibitory Kinetic Behavior of Horseradish Peroxidase on the Electrode Surface" Sensors 12, no. 11: 14556-14569. https://doi.org/10.3390/s121114556