A Bioanalytical Platform for Simultaneous Detection and Quantification of Biological Toxins

Abstract
: Prevalent incidents support the notion that toxins, produced by bacteria, fungi, plants or animals are increasingly responsible for food poisoning or intoxication. Owing to their high toxicity some toxins are also regarded as potential biological warfare agents. Accordingly, control, detection and neutralization of toxic substances are a considerable economic burden to food safety, health care and military biodefense. The present contribution describes a new versatile instrument and related procedures for array-based simultaneous detection of bacterial and plant toxins using a bioanalytical platform which combines the specificity of covalently immobilized capture probes with a dedicated instrumentation and immuno-based microarray analytics. The bioanalytical platform consists of a microstructured polymer slide serving both as support of printed arrays and as incubation chamber. The platform further includes an easy-to-operate instrument for simultaneous slide processing at selectable assay temperature. Cy5 coupled streptavidin is used as unifying fluorescent tracer. Fluorescence image analysis and signal quantitation allow determination of the toxin’s identity and concentration. The system’s performance has been investigated by immunological detection of Botulinum Neurotoxin type A (BoNT/A), Staphylococcal enterotoxin B (SEB), and the plant toxin ricin. Toxins were detectable at levels as low as 0.5–1 ng·mL−1 in buffer or in raw milk.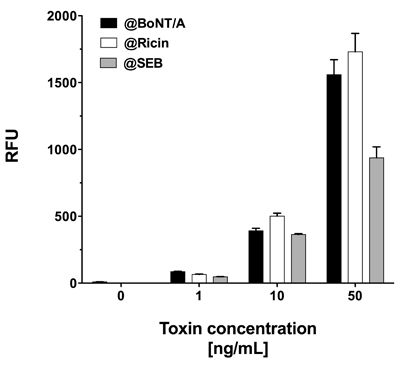
1. Introduction
Despite intensified efforts, intoxication by toxins such as the bacterial toxins Staphylococcal enterotoxin B (SEB) or Botulinum Neurotoxin type A (BoNT/A) still present significant threats to public health [1]. Ingestion of SEB, produced by gram positive cocci of Staphylococcus aureus, can cause Staphylococcal Food Poisoning (SFP), a form of gastroenteritis that manifests clinically as emesis with or without diarrhea. As little as 1–20 μg SEB may lead to severe illness in an adult [2,3]. BoNT/A, /B, /E, and /F, are produced by toxigenic strains of the Gram positive Clostridium botulinum and may provoke food borne botulism in humans, a severe neuroparalytic illness. BoNT is the most toxic substance known to man. Quantities of 0.01–1 μg BoNT per kg body weight can be fatal if ingested, e.g., with improperly processed food [4,5].
With more than 200,000 estimated intoxication cases in USA in 2006, SEB caused costs of approximately $1.2–1.5 billion for appropriate treatment, thus generating an enormous economic loss. Between 1992 and 1997 there occurred only about 60 cases of food borne botulism in the USA per year, with often very severe etiopathology. Treatment in intensive care units is often inevitable, and in certain cases artificial ventilation during up to 6 months is required. Such medical treatment increases the costs per patient to $14,000–75,000 and may reach annual care costs of $800,000 to $4.2 million [6–9]. Another dreaded toxin is ricin, a toxic lectin of the castor oil plant Ricinus communis. While seeds of R. communis are pressed cold to extract the oil, water-soluble ricin remains after processing within fibrous residues. Ricin is a prototypic A–B toxin, which effectively inhibits protein synthesis by depurinating the 28S ribosomal RNA. The actual oral toxicity of ricin for humans is estimated 1 to 30 mg per kg body weight. Nevertheless, facile extraction and industrial castor oil production lead to toxin abundance and facilitated access [10,11]. Hence, ricin is regarded as threatening biowarfare agent. Likewise, due to their exceptional toxicity, both SEB and BoNT are considered potential biowarfare agents [12]. It is thus considered appropriate to develop tools and procedures applicable for fast and early detection and typing of toxins for food safety and homeland security.
Over the last five decades, the development of biosensors has attracted considerable interest, and the number of analytes detected increases continuously [13–15]. Though most biosensors are currently used in clinical diagnosis [16], they also gain importance for applications such as DNA hybridization and sequencing [17], high throughput drug discovery [18,19], detection of biological warfare agents [20], environmental analysis, e.g., of pesticides [21], food production and safety [22], and detection of illicit drugs [23,24]. Microfluidic biosensing systems in particular have gained attention, as they offer advantages over other biosensors. Commonly, they include fluid channel systems imprinted in plastic or silicone platforms [25,26]. In many instances, channels are connected to appropriate fluid propagation systems allowing fluid transport to and from reaction chambers. Depending on the microfluidic channel arrangement, selective contact of analyte-containing sample fluids with distinct areas of the analytical platform is assured [27]. Minute sample volumes are generally needed due to the nanometer to micrometer channel dimensions. This renders large amounts of expensive reagents superfluous, and assays can be performed with scarce and precious samples.
Currently, an increasing number of Lab-on-a-chip devices are emerging. Due to their ability to test multiple samples with small amount of reagents, they offer optimal conditions to detect highly contagious or harmful substances. While a wide range of methods is used to address this matter, many assays rely on immunological detection of target molecules due to the high specificity and sensitivity of immunological reagents. This is of particular importance when considering the high toxicity of certain toxins, foremost BoNT/A, where detection in the range of few picogram per milliliter is required. To guarantee food safety, at least 125–250 ng of SEB per 100 g of a given food sample should be detected [28]. This corresponds to approximately 1.25–2.5 ng·mL−1 liquid foodstuff. Although the toxicity of ricin is much lower, it is evident that safety margins are required, i.e., a detection limit of few nanogram per mL would be eligible. Accordingly, there is need for sensitive and reliable detection of such toxins.
If proteinaceous or peptidic toxins are to be detected, immunological detection techniques, such as enzyme-linked immunosorbent assay (ELISA) or fluorescence-linked immunosorbent assay (FLISA), are currently the methods of choice, as they offer both high sensitivity and specificity [29,30]. Accordingly, many biosensors utilize capture molecules such as antibodies immobilized in discrete locations on the surface of microfluidic platforms [27,31–33]. By passing the detection area, analytes may interact with capture molecules. Captured analytes can subsequently be detected immunologically, by hybridization or by direct molecular detection. An often-employed sensing scheme is based on fluorescence detection: a fluorescent label coupled to a detection molecule serves to identify and quantify captured analytes [34,35]. Sandwich assays employing two specific antibodies, allow highly sensitive and specific analyte detection—even in complex matrices [36]. Immobilization of different capturing molecules to analytical platforms enables both, simultaneous detection of several analytes and integration of relevant positive and negative control features [37].
The present contribution describes a bioanalytical platform, which combines the specificity of covalently immobilized capture probes with a dedicated instrumentation and microfluidic array analytics. A set of toxin specific antibody pairs is used to challenge the portrayed bioanalytical system with three biological threat agents BoNT/A, SEB, and ricin. The described system allowed for simultaneous characterization of toxin type and concentration. While optimum conditions for highest sensitivity were established in buffer, the system also qualified for the detection of BoNT/A and ricin in a complex matrix such as raw milk.
2. Experimental Section
2.1. Toxins and Antibodies
The study was performed using purified 150 kDa BoNT/A from Clostridium botulinum strain Hall A (BoNT/A1; Metabiologics, Madison, WI, USA), ricin from Ricinus communis (RCA60; Institute of Phytochemistry, University Witten/Herdecke, Witten, Germany), and SEB from Staphylococcus aureus (S4881; Sigma-Aldrich, Seelze, Germany). For sample analysis, toxins were diluted in pH 7.2 phosphate buffered saline (PBS), pH 7.4 Tris buffered saline (TBS) or raw cow’s milk (pH 6.5, approximately 4% fat content), respectively. The following mouse-derived monoclonal antibodies were used as capturing antibodies: anti-BoNT/A (A1688; ZBS 3, RKI, Berlin, Germany) as described before [38], anti-SEB (89/3; Institute for Medical Microbiology and Hygiene, TU Dresden, Dresden, Germany), and anti-Ricin (RCH1; Institute of Phytochemistry, University Witten/Herdecke, Witten, Germany). Detection of the toxins was performed with polyclonal equine anti-BoNT/A (BoNT/A/B/E; Novartis Behring, Marburg, Germany), polyclonal rabbit anti-SEB (S9008; Sigma-Aldrich, Seelze, Germany), and monoclonal mouse anti-ricin (1RK1; Institute of Phytochemistry, University Witten/Herdecke, Witten, Germany). The detection antibodies were coupled to biotin according to the manufacturer’s instructions (EZ-Link Sulfo-NHS-LC-biotin; Pierce, Rockford, IL, USA). They were used at concentrations between 5–10 μg·mL−1. Biotinylated antibodies were stored in phosphate buffered saline with 0.2% (w/v) bovine serum albumin and 0.05% (w/v) NaN3.
2.2. Inca Bioanalytical System
The Inca Bioanalytical System is a microarray-based system for use in diagnostics and environmental control. The current configuration of the system consists of two essential components: IncaTrace (Figure 1(a)) and IncaSlide (Figure 1(b)), the first being a small and easy-to-use laboratory appliance for simultaneous IncaSlide processing. Toxin assays were performed with the Inca Bioanalytical System depicted in Figure 1.
2.3. IncaSlide
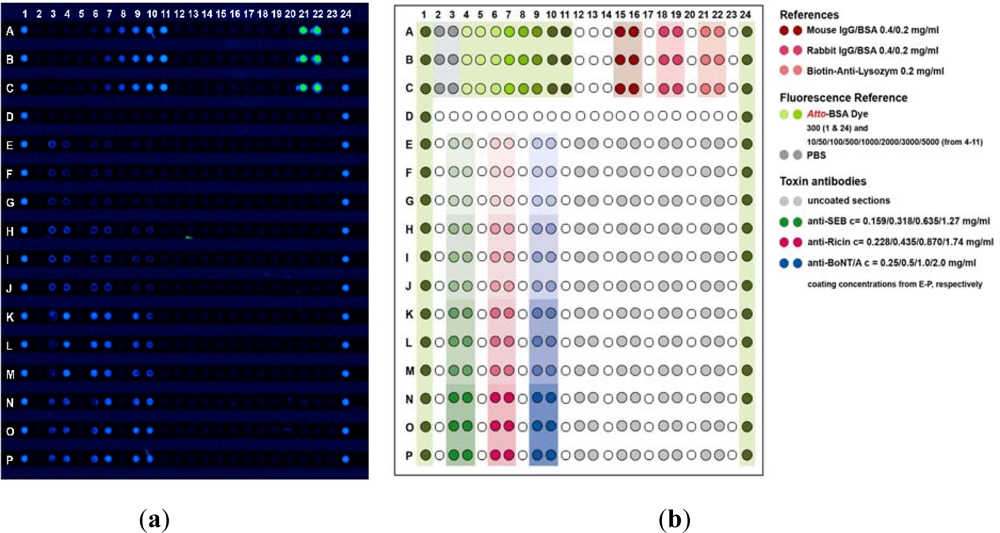
Contrary to most commercialized high performance microarray platforms, the IncaSlide is manufactured by injection molding. The slide’s dimensions fully comply with international standards (25 × 75.7 × 1 mm). The basic architecture of the IncaSlide includes a substructured microchannel with a channel width of 500 μm. Molecules are printed onto 384 protruding posts situated within the channel (Figure 1(b)). A low volume reaction chamber (28 μL) is generated by lamination of the IncaSlide. Prior to dispensing the capture antibodies, the entire channel is treated with the photolinker polymer OptoDex™, and capture molecules are printed using a non-contact microdispensing array printer (Nano-Plotter™, GeSIM, Germany). For microarray manufacturing, capture antibodies were diluted with 1% (w/v) PBS buffer at concentrations ranging from 0.1–2.0 mg·mL−1 and dispensed on top of the substructure features (400 pL per feature). Printed arrays were then vacuum dried and slides were exposed to UV light (350 nm, 11.4 mW per cm2) for 4 min to achieve covalent binding of the capture molecules. Following photo-immobilization, the slides were rinsed three times each with PBS buffer containing 0.05% Tween 20, PBS buffer and deionized water, respectively, and blocked with Inca Block 6000 (Arrayon Biotechnology, Neuchatel, Switzerland). Upon drying, printed slides were laminated with a transparent acrylate film, packaged under oxygen-free atmosphere (400 mbar N2) and stored at 4 °C. All microarray manufacturing procedures were carried out in clean room environment. Besides capture molecules, the microarray is designed to host analytical references and calibrators as required for quality controlled, unambiguous and quantitative analysis of analyte fluids. Packaged microarrays can be stored at ambient temperature. Storage at 4 °C, however, is recommended. Figure 2 shows a typical fluorescence scan image of a processed IncaSlide as well as the underlying layout scheme.
2.4. IncaTrace
IncaTrace is small laboratory instrument designed for processing IncaSlides. The instrument consists of a solid base plate with six recesses, a cover plate with fluid connections and fluid reservoirs and screws to tighten the properly positioned IncaSlides. Inlet and outlet ports of the IncaSlide connect to the reservoir (at inlet) and the tubing connection (at outlet), respectively. For processing, up to six IncaSlides are placed in the respective recesses, with the laminated surface down. The cover plate is overlaid and tightened by screws. Buffer solutions, analytes and reagents (max. 100 μL) are sequentially manually dispensed into the fluid reservoirs. Fluids are channeled in the reaction chamber by a multiplex peristaltic pump (IPC-N8 Multichannel pump, Ismatec SA, Switzerland) with a flux rate of 70 μL·min−1. Cyclic reversed flux incubation (20 s for each direction) is performed during two times 16 min at ambient temperature or at 37 °C. Upon completion of the incubation and rinsing steps, IncaSlides are removed from the instrument, delaminated and blown dry with N2 before fluorescence scanning.
2.5. Fluorescence Scanning and Signal Quantification
Cy5-labeled Streptavidin (5 μg·mL−1; Milan Analytica AG, Rheinfelden, Switzerland) was used for fluorescence detection of toxin-antibody complexes. Upon scanning of processed IncaSlides, fluorescence signal intensities were registered and quantified with a commercial instrument and software (GenePix Personal 4100 A; Molecular Devices, Inc., Sunnyvale CA, USA). The relative fluorescence intensity (RFU) of each individual array feature was quantitated by relating measured fluorescence intensities to on-chip fluorescence calibrator intensities. Atto-BSA dye (Arrayon Biotechnology, Neuchatel, Switzerland) was used to calibrate fluorescence intensity. Calibrator features were individually printed in triplicates; they contained 5–5,000 atto dye molecules per μm2 at constant protein (BSA) concentration.
2.6. Decontamination
Plastic parts of the IncaTrace instrument were regularly decontaminated by incubation in 6% NaOH (30 min) followed by 1% detergent (10 min) and subsequently rinsed with deionized H2O (3 times 5 min). Similarly, tubings were flushed with 6% NaOH (10 min), followed by deionized H2O (10 min), then 100% ethanol (10 min) and finally rinsed with deionized H2O (30 min). IncaSlides are designed for single use. They were discarded after decontamination.
3. Results
3.1. IncaSlide Processing
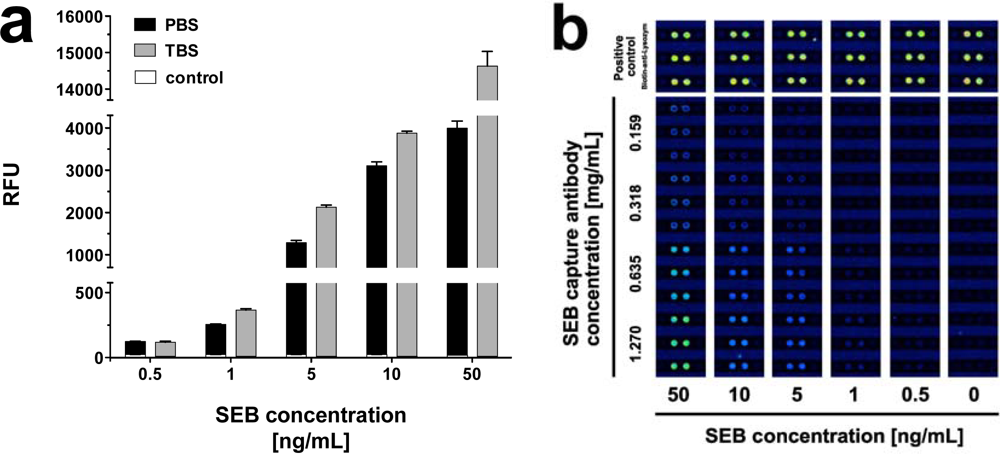
IncaSlides included a microstructured channel, which—upon lamination—established a low volume reaction chamber. In a typical analysis, IncaSlides printed with assay specific capture probes, calibrator and control items were placed in the IncaTrace instrument. A multichannel peristaltic pump was connected via fluidic connections. Initializing channel charging with buffer solution (by applying negative pressure) reconstituted the previously dry-immobilized capture molecules. Different dilutions of anti-toxin antibodies were used to determine the optimal print concentration of the capture antibody. As a result, the highest antibody concentration (2.0 mg·mL−1 anti-BoNT/A, 1.74 mg·mL−1 anti-ricin, and 1.27 mg·mL−1 anti-SEB) was chosen as it provided high sensitivity and a good signal to noise ratio.
Assay procedures were initiated by applying the analyte samples in two steps (100 μL each). The first sample charge (100 μL) was placed in the IncaTrace sample reservoir. The efficiency of analyte binding to capture molecules was enhanced by cyclic reverse flow incubation for 16 min. After discharging the channels, the second sample charge (100 μL) was applied and handled the same way as above. Subsequently, 100 μL of biotin labeled detection antibodies was added. For fluorescence detection, fluorophore (Cy5) labeled Streptavidin was used to visualize established complexes of capture antibody, analyte and biotinylated second antibody. Each incubation step took 16 min and was followed by three rinsing steps with PBS buffer containing 0.05% Tween 20, then PBS buffer and deionized water. Processed slides were scanned and the fluorescent signals were quantified. Relating the recorded fluorescence to the intensities of the on-chip fluorescence calibrator allowed quantitation of each individual array feature.
3.2. Assay Development
3.2.1. Dose Response versus Assay Temperature
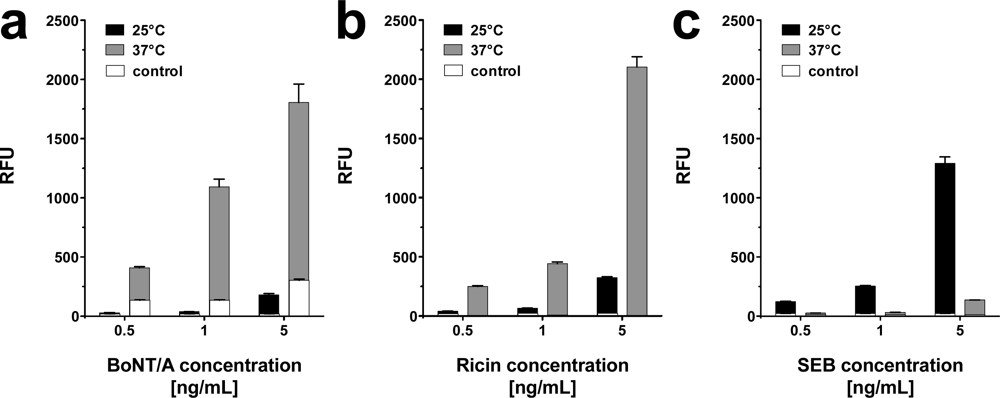
To elucidate optimal assay conditions, the dose response of the system was determined at 25 °C and 37 °C with toxins diluted in phosphate buffered saline (PBS; pH 7.2). For each toxin concentration an individual slide was used. As depicted in Figure 3, all toxins could be reliably detected at 25 °C at concentrations as low as 0.5 ng·mL−1 for SEB and 0.5–1 ng·mL−1 for BoNT/A and ricin, respectively. Upon incubation at 37 °C, the signal intensities of BoNT/A and ricin increased significantly, allowing toxin detection at 0.5 ng·mL−1. SEB related signals, however were negatively affected by elevated assay temperatures.
3.2.2. Dose Response versus Assay Buffer Composition
In an attempt to find the optimal buffer composition for the simultaneous detection of the toxins, we performed assays with PBS (pH 7.2) and Tris buffered saline (TBS; pH 7.4) at 25 °C. While SEB in PBS displayed very good signal intensities, we found even higher signals with TBS as an assay buffer (Figure 4). For 50 ng·mL−1, for example, the signal intensity increased by 72.7%, while the effect was less pronounced at lower concentrations. Signal intensities for 0.5 ng·mL−1 SEB, for instance, increased merely by 6.5%. In contrast to SEB, the signal intensities for BoNT/A and ricin decreased dramatically with toxins dissolved in TBS. As a result, solutions of ricin in TBS could only be detected at concentrations ≥ 5 ng·mL−1, and concentrations ≥ 50 ng·mL−1 were required for detection of BoNT/A in TBS (data not shown).
3.2.3. Dose Response versus Incubation Time
In view of further optimizing the assay conditions, extension of the analyte incubation time was explored (twice instead of once 16 min for each sample charge). Results obtained indicated that doubling the incubation time did not increase the signal intensity.
3.3. Simultaneous Detection of Toxins
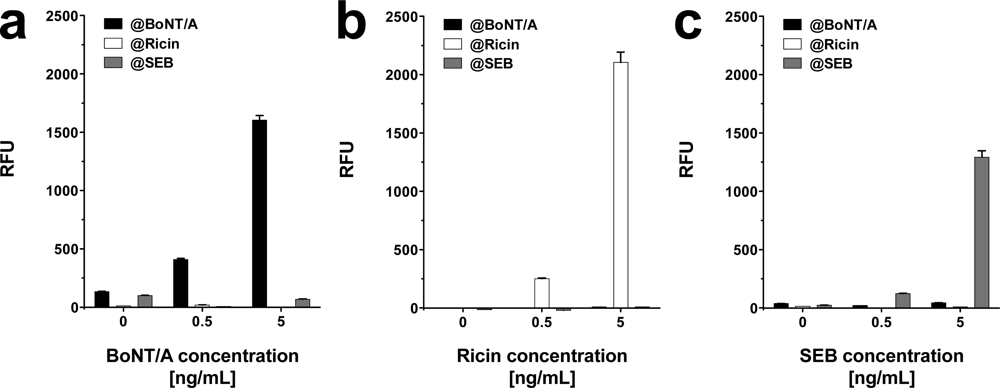
In addition to demonstrating the detection of toxins in parallel, we tested the system’s performance by detecting different toxins simultaneously on one slide. Prior to these investigations the cross-reactivity of the antibody pairings was determined. Toxins were diluted in PBS at concentrations of 0.5 and 5 ng·mL−1 and the slides were incubated with one toxin at the time at a concentration of either 0.5 or 5 ng·mL−1. Next, a mixture of biotin labeled secondary antibodies specific for all three toxins, and subsequently Cy5 labeled streptavidin were applied. The fluorescence intensities at features functionalized with capture antibodies, which do interact with the toxin in question were compared to the respective negative control without toxin. As shown in Figure 5, even at a tenfold increase of spiked toxin the amount of unspecific signal, registered on the features specific for non-target toxins, did not increase significantly. The results imply minimal cross-reactivity between capture and detection antibodies, as well as between toxins and non-pairing capture antibodies.
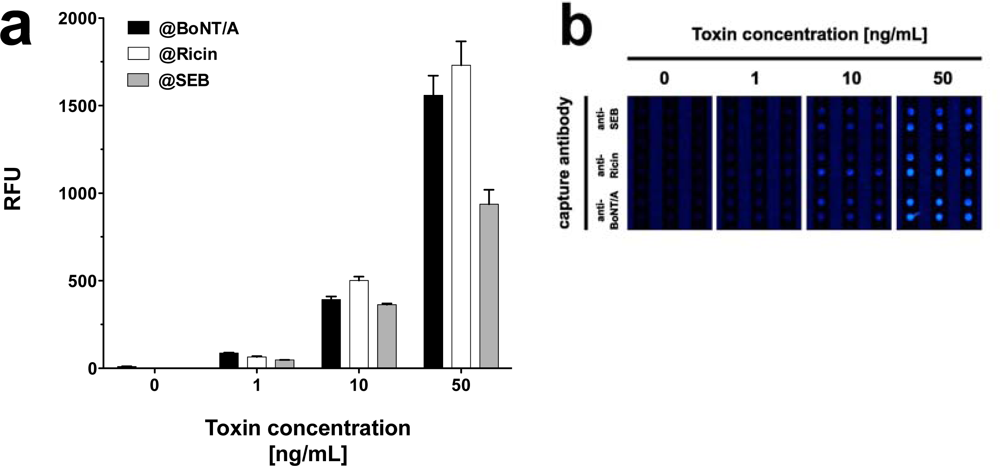
As all three toxins showed significant signals when assayed in PBS, this buffer was chosen for simultaneous toxin detection. To attain this, PBS was spiked with equal concentrations of all three toxins, i.e., 1, 10 or 50 ng·mL−1. Similar to singleplex assays, each mixture of equally concentrated toxins was incubated on a single slide at 37 °C. Although generally lower signals were observed, the signal intensities were sufficiently high to detect all three toxins simultaneously at concentrations as low as 1 ng·mL−1 (Figure 6). Interestingly, in spite of incubation at 37 °C, signal intensities for SEB did not decrease notably and quantification was possible, even with mixtures of toxins at different concentrations (data not shown).
3.4. Detection of Toxins in a Complex Matrix
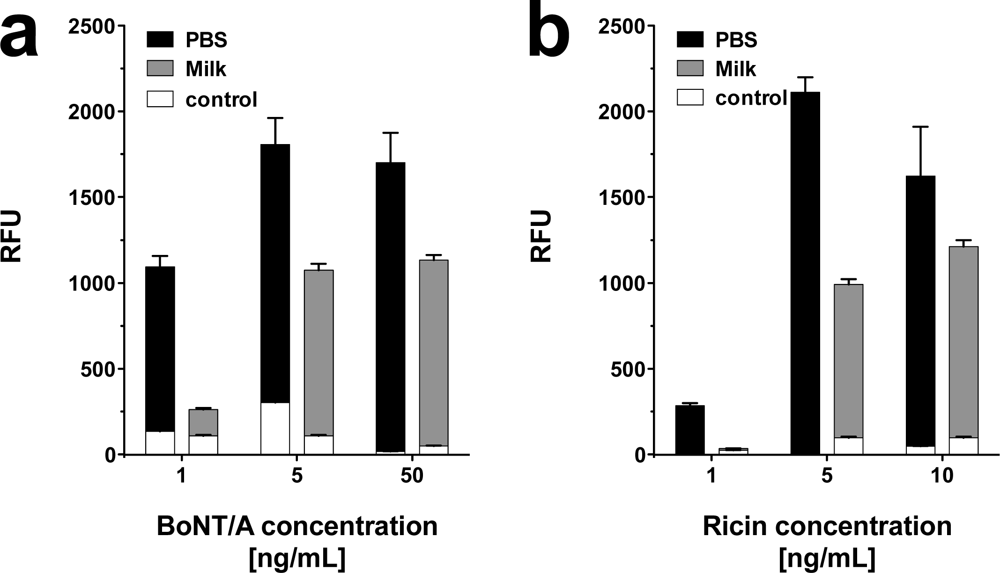
It has been discussed in the relevant literature [39], whether BoNT/A might be used in case of a bioterror attack to contaminate the food supply, i.e., the milk production. Accordingly, it seemed pivotal to test the bioanalytical system with toxins in raw milk as food matrix. Due to its high protein and lipid content, raw milk represents a complex and thus challenging matrix. In the context of the present investigations, the toxins were diluted in raw milk and applied to the bioanalytical platform without prior sample preparation.
As shown in Figure 7, BoNT/A and ricin were detected in raw milk at concentrations as low as 1 and 5 ng·mL−1, respectively. Unexpectedly, detection of SEB in raw milk was only possible at concentrations ≥ 50 ng·mL−1 (data not shown). A minor increase in background signal was observed for ricin. False positives or false negatives were not detected. Hence, although raw milk as a complex matrix impaired the assay, in particular for SEB, it was still possible to detect low concentrations of BoNT/A and ricin.
4. Discussion and Conclusions
The primary goal of this study was to demonstrate validity of design and performance of a scalable, microfluidic device for parallel and simultaneous detection of specific antigens. Therefore, an assay was developed consisting of capture antibody-functionalized slides with microfluidic channels connected to an appropriate instrument with sample reservoir and connection to a fluid propagation system. Capture antibodies were photochemically immobilized in the dry state using OptoDex™, a dextran based linker polymer, to obtain covalent capture binding on top of sub-microstructured channels [40,41]. The performance of the bioanalytical system was challenged with three toxins, which present a major threat to food industry and public health. BoNT/A, Ricin, and SEB were examined, and the assay parameters: buffer composition, incubation temperature, incubation time, assay format (single or simultaneous) as well as matrix effects were investigated.
The presented data show that the Inca Bioanalytical System enables the detection of 0.5 ng·mL−1 of BoNT/A, ricin, or SEB in buffer. An increase in sensitivity was observed for BoNT/A and ricin when the incubation temperature was shifted from 25 °C to 37 °C. While detection of SEB was negatively affected by elevated temperature, the use of TBS as sample buffer exhibited a positive effect on the binding affinity between SEB and its antibodies. Although the exact mechanism is still largely unknown, it has been reported before that different buffer compositions may cause protein stabilization or destabilization [42–44]. Hence, we believe that binding properties between SEB and its antibodies were affected in a similar way. Yet, this finding warrants future research. As the antibody combinations used in the assay displayed only minute cross-reactivity, the system qualified for simultaneous detection of the three toxins. Although the presence of all toxins leads to a decrease in signal intensities, toxin concentrations as low as 1 ng·mL−1 were detectable. If raw milk was used as sample matrix, the procedure allowed detection of 1 and 5 ng·mL−1 of BoNT/A and ricin, respectively. Accordingly, raw milk partially impaired the sensitivity for these toxins. For SEB however, incubation with raw milk at 37 °C leads to a dramatic decrease in signal intensities. In addition, unspecific binding of milk components to the anti-SEB capture antibody or to the toxin itself may have interfered.
As far as sensitivity is concerned, the presented data correspond to the detection limits of similar biosensor devices for the detection of the investigated toxins. Other publications describe sensitivities in buffers and some food samples as low as 1–20 ng·mL−1 for BoNT/A, 10 ng·mL−1 for ricin, and 0.1–4 ng·mL−1 for SEB, using different forms of flow-coupled immuno-analysis [45–48]. Introduction of enrichment steps, e.g., by antibody-coupled paramagnetic beads may further increase the sensitivity to few picogram per milliliter [49–51]. Using planar waveguide sensors, sensitivities for BoNT/A toxin or toxoid, ricin, and SEB were reported in the range of few ng·mL−1 in buffer and milk, respectively [27,33]. Methods, such as capillary electrophoresis combined with laser-induced fluorescence detection, mass-sensitive magneto elastic sensors or diffractive grating sensors reportedly detect SEB, ricin, or BoNT/A at concentrations between 0.5 and 100 ng·mL−1 [52–54].
The key strength of the presented bioanalytical platform is its ability to analyze, on a modular scheme, multiple samples for multiple analytes simultaneously with multiple reaction media. The instrument allows fast assay development and exploration of different assay strategies, i.e., buffer compositions, varying sample volumes, flow specifications, incubation times and pre-defined temperature settings. As the entire process can be completed in less than 90 min it is faster than common ELISA procedures and overcomes the sensitivity limitations of existing lateral flow devices [55–57]. In addition, if further detection molecules were incorporated, the system would facilitate simultaneous detection of up to 28 agents with six replicates each on the same slide. Due to inexpensive production, IncaSlides reduce assay costs. Also, they can be easily disposed of, thereby minimizing the risk of post-assay contamination or intoxication, respectively. All parts of the IncaTrace are amenable to decontamination strategies. Hence, by applying the appropriate assay conditions and specific detection molecules, the bioanalytical platform qualifies for sensitive detection of a wide range of molecules, including toxins, simultaneously and in parallel.
Acknowledgments
This work was supported in part by the European Community’s Sixth Framework Programme (FP6) “NanoSecure” under the grant agreement number NMP3-CT-2007-026549.
References
- Nyachuba, D. Foodborne illness: Is it on the rise? Nutr. Rev 2010, 68, 257–269. [Google Scholar]
- Baird-Parker, T.C. Staphylococcus aureus. In Microbiological Safety and Quality of Food, 1st ed; Baird-Parker, T.C., Lund, B.M., Gould, G.W., Eds.; Aspen Publishers, Inc: Gaithersburg, MD, USA, 2000; Volume II, pp. 1317–1335. [Google Scholar]
- Ulrich, R.G.; Wilhelmsen, C.L.; Krakauer, T. Staphylococcal enterotoxin B and related toxins. In Part 1: Medical Aspects of Biological Warfare; Lehnart, M.K., Lounsbury, D.E., Martin, J.W., Eds.; Office of the Surgeon General US Army Medical Department Center and School Borden Institute: Washington, DC, USA, 2007; Volume 2, pp. 311–322. [Google Scholar]
- Herrero, B.; Ecklung, A.; Streett, C.; Ford, D.; King, J. Experimental botulism in monkeys—A clinical pathological study. Exp. Mol. Pathol 1967, 6, 84–95. [Google Scholar]
- Lund, B. Foodborne disease due to Bacillus and Clostridium species. Lancet 1990, 336, 982–986. [Google Scholar]
- Mead, P.; Slutsker, L.; Dietz, V.; McCaig, L.; Bresee, J.; Shapiro, C.; Griffin, P.; Tauxe, R. Food-related illness and death in the United States. Emerg. Infect. Dis 1999, 5, 607–625. [Google Scholar]
- Scallan, E.; Hoekstra, R.; Angulo, F.; Tauxe, R.; Widdowson, M.; Roy, S.; Jones, J.; Griffin, P. Foodborne illness acquired in the United States—Major pathogens. Emerg. Infect. Dis 2011, 17, 7–15. [Google Scholar]
- Todd, E. Costs of acute bacterial foodborne disease in Canada and the United States. Int. J. Food Microbiol 1989, 9, 313–326. [Google Scholar]
- Arnon, S.S.; Schechter, R.; Maslanka, S.E.; Jewell, N.P.; Hatheway, C.L. Human botulism immune globulin for the treatment of infant botulism. N. Engl. J. Med 2006, 354, 462–471. [Google Scholar]
- Audi, J.; Belson, M.; Patel, M.; Schier, J.; Osterloh, J. Ricin poisoning: A comprehensive review. JAMA 2005, 294, 2342–2351. [Google Scholar]
- Holtermann, K.; Hughes, C.A. Response to a Ricin Incident: Guidelines for Federal, State and Local Public Health and Medical Officials; Department of Health and Human Services.; Office of Public Health Emergency Preparedness: Washington, DC, USA, 2006. [Google Scholar]
- Darling, R.G.; Catlett, C.L.; Huebner, K.D.; Jarrett, D.G. Threats in bioterrorism. I: CDC category A agents. Emerg. Med. Clin. North Am 2002, 20, 273–309. [Google Scholar]
- Clark, L.; Lyons, C. Electrode systems for continuous monitoring in cardiovascular surgery. Ann. N. Y. Acad. Sci 1962, 102, 29–45. [Google Scholar]
- Lowe, C. Chemoselective biosensors. Curr. Opin. Chem. Biol 1999, 3, 106–111. [Google Scholar]
- Song, S.; Xu, H.; Fan, C. Potential diagnostic applications of biosensors: Current and future directions. Int. J. Nanomed 2006, 1, 433–440. [Google Scholar]
- Newman, J.; Turner, A. Home blood glucose biosensors: A commercial perspective. Biosens. Bioelectron 2005, 20, 2435–2453. [Google Scholar]
- Mir, M.; Homs, A.; Samitier, J. Integrated electrochemical DNA biosensors for lab-on-a-chip devices. Electrophoresis 2009, 30, 3386–3397. [Google Scholar]
- Fernandes, T.; Diogo, M.; Clark, D.; Dordick, J.; Cabral, J. High-throughput cellular microarray platforms: Applications in drug discovery, toxicology and stem cell research. Trends Biotechnol 2009, 27, 342–349. [Google Scholar]
- Jain, K. The role of nanobiotechnology in drug discovery. Adv. Exp. Med. Biol 2009, 655, 37–43. [Google Scholar]
- Lim, D.V.; Simpson, J.M.; Kearns, E.A.; Kramer, M.F. Current and developing technologies for monitoring agents of bioterrorism and biowarfare. Clin. Microbiol. Rev 2005, 18, 583–607. [Google Scholar]
- Palchetti, I.; Laschi, S.; Mascini, M. Electrochemical biosensor technology: Application to pesticide detection. Methods Mol. Biol 2009, 504, 115–126. [Google Scholar]
- Rasooly, A.; Herold, K. Biosensors for the analysis of food- and waterborne pathogens and their toxins. J. AOAC Int 2006, 89, 873–883. [Google Scholar]
- Bonanno, L.; Delouise, L. Tunable detection sensitivity of opiates in urine via a label-free porous silicon competitive inhibition immunosensor. Anal. Chem 2010, 82, 714–722. [Google Scholar]
- Minunni, M.; Scarano, S.; Mascini, M. Affinity-based biosensors as promising tools for gene doping detection. Trends Biotechnol 2008, 26, 236–243. [Google Scholar]
- Gonzalez, R.; Seurynck-Servoss, S.; Crowley, S.; Brown, M.; Omenn, G.; Hayes, D.; Zangar, R. Development and validation of sandwich ELISA microarrays with minimal assay interference. J. Proteome Res 2008, 7, 2406–2414. [Google Scholar]
- Moorthy, J.; Mensing, G.A.; Kim, D.; Mohanty, S.; Eddington, D.T.; Tepp, W.H.; Johnson, E.A.; Beebe, D.J. Microfluidic tectonics platform: A colorimetric, disposable botulinum toxin enzyme-linked immunosorbent assay system. Electrophoresis 2004, 25, 1705–1713. [Google Scholar]
- Taitt, C.R.; Golden, J.; Shubin, Y.; Shriver-Lake, L.; Sapsford, K.E.; Rasooly, A.; Ligler, F. A portable array biosensor for detecting multiple analytes in complex samples. Microb. Ecol 2004, 47, 175–185. [Google Scholar]
- Reiser, R.; Conaway, D.; Bergdoll, M.S. Detection of staphylococcal enterotoxin in foods. Appl. Microbiol 1974, 27, 83–85. [Google Scholar]
- Goldman, E.R.; Clapp, A.R.; Anderson, G.P.; Uyeda, H.T.; Mauro, J.M.; Medintz, I.L.; Mattoussi, H. Multiplexed toxin analysis using four colors of quantum dot fluororeagents. Anal. Chem 2004, 76, 684–688. [Google Scholar]
- Vikesland, P.J.; Wigginton, K.R. Nanomaterial enabled biosensors for pathogen monitoring—A review. Environ. Sci. Technol 2010, 44, 3656–3669. [Google Scholar]
- Golden, J.P.; Floyd-Smith, T.M.; Mott, D.R.; Ligler, F.S. Target delivery in a microfluidic immunosensor. Biosens. Bioelectron 2007, 22, 2763–2767. [Google Scholar]
- Lian, W.; Wu, D.; Lim, D.; Jin, S. Sensitive detection of multiplex toxins using antibody microarray. Anal. Biochem 2010, 401, 271–279. [Google Scholar]
- Ligler, F.S.; Taitt, C.R.; Shriver-Lake, L.C.; Sapsford, K.E.; Shubin, Y.; Golden, J.P. Array biosensor for detection of toxins. Anal. Bioanal. Chem 2003, 377, 469–477. [Google Scholar]
- Rabbany, S.Y.; Kusterbeck, A.W.; Bredehorst, R.; Ligler, F.S. Effect of antibody density on the displacement kinetics of a flow immunoassay. J. Immunol. Methods 1994, 168, 227–234. [Google Scholar]
- Sapsford, K.E.; Liron, Z.; Shubin, Y.S.; Ligler, F.S. Kinetics of antigen binding to arrays of antibodies in different sized spots. Anal. Chem 2001, 73, 5518–5524. [Google Scholar]
- Grate, J.W.; Warner, M.G.; Ozanich, R.M.; Miller, K.D.; Colburn, H.A.; Dockendorff, B.; Antolick, K.C.; Anheier, N.C.; Lind, M.A.; Lou, J.; Marks, J.D.; Bruckner-Lea, C.J. Renewable surface fluorescence sandwich immunoassay biosensor for rapid sensitive botulinum toxin detection in an automated fluidic format. Analyst 2009, 134, 987–996. [Google Scholar]
- Frisk, M.L.; Tepp, W.H.; Johnson, E.A.; Beebe, D.J. Self-assembled peptide monolayers as a toxin sensing mechanism within arrayed microchannels. Anal. Chem 2009, 81, 2760–2767. [Google Scholar]
- Pauly, D.; Kirchner, S.; Stoermann, B.; Schreiber, T.; Kaulfuss, S.; Schade, R.; Zbinden, R.; Avondet, M.-A.; Dorner, M.; Dorner, B. Simultaneous quantification of five bacterial and plant toxins from complex matrices using a multiplexed fluorescent magnetic suspension assay. Analyst 2009, 134, 2028–2039. [Google Scholar]
- Weingart, O.; Schreiber, T.; Mascher, C.; Pauly, D.; Dorner, M.; Berger, T.; Egger, C.; Gessler, F.; Loessner, M.; Avondet, M.; Dorner, B. The case of botulinum toxin in milk: Experimental data. Appl. Environ. Microbiol 2010, 76, 3293–3300. [Google Scholar]
- Angeloni, S.; Ridet, J.; Kusy, N.; Gao, H.; Crevoisier, F.; Guinchard, S.; Kochar, S.; Sigrist, H.; Sprenger, N. Glycoprofiling with micro-arrays of glycoconjugates and lectins. Glycobiology 2005, 15, 31–41. [Google Scholar]
- Caelen, I.; Gao, H.; Sigrist, H. Protein density gradients on surfaces. Langmuir 2002, 18, 2463–2467. [Google Scholar]
- Dunn, S.D. Effects of the modification of transfer buffer composition and the renaturation of proteins in gels on the recognition of proteins on Western blots by monoclonal antibodies. Anal. Biochem 1986, 157, 144–153. [Google Scholar]
- Manning, M.C.; Chou, D.K.; Murphy, B.M.; Payne, R.W.; Katayama, D.S. Stability of protein pharmaceuticals: An update. Pharm. Res 2010, 27, 544–575. [Google Scholar]
- Ugwu, S.O.; Apte, S.P. The effect of buffers on protein conformational stability. Pharm. Technol 2004, 28, 86–113. [Google Scholar]
- Delehanty, J.B.; Ligler, F.S. A microarray immunoassay for simultaneous detection of proteins and bacteria. Anal. Chem 2002, 74, 5681–5687. [Google Scholar]
- Han, S.-M.; Cho, J.-H.; Cho, I.-H.; Paek, E.-H.; Oh, H.-B.; Kim, B.-S.; Ryu, C.; Lee, K.; Kim, Y.-K.; Paek, S.-H. Plastic enzyme-linked immunosorbent assays (ELISA)-on-a-chip biosensor for botulinum neurotoxin A. Anal. Chim. Acta 2007, 587, 1–8. [Google Scholar]
- Lillehoj, P.B.; Wei, F.; Ho, C.-M. A self-pumping lab-on-a-chip for rapid detection of botulinum toxin. Lab Chip 2010, 10, 2265–2270. [Google Scholar]
- Sapsford, K.E.; Taitt, C.R.; Loo, N.; Ligler, F.S. Biosensor detection of botulinum toxoid A and staphylococcal enterotoxin B in food. Appl. Environ. Microbiol 2005, 71, 5590–5592. [Google Scholar]
- Frisk, M.L.; Lin, G.; Johnson, E.A.; Beebe, D.J. Synaptotagmin II peptide-bead conjugate for botulinum toxin enrichment and detection in microchannels. Biosens. Bioelectron 2011, 26, 1929–1935. [Google Scholar]
- Garber, E.A.E.; Venkateswaran, K.V.; O’Brien, T.W. Simultaneous multiplex detection and confirmation of the proteinaceous toxins abrin, ricin, botulinum toxins, and Staphylococcus enterotoxins a, B, and C in food. J. Agric. Food Chem 2010, 58, 6600–6607. [Google Scholar]
- Yu, H.; Raymonda, J.W.; McMahon, T.M.; Campagnari, A.A. Detection of biological threat agents by immunomagnetic microsphere-based solid phase fluorogenic- and electro-chemiluminescence. Biosens. Bioelectron 2000, 14, 829–840. [Google Scholar]
- Lam, M.T.; Wan, Q.H.; Boulet, C.A.; Le, X.C. Competitive immunoassay for staphylococcal enterotoxin A using capillary electrophoresis with laser-induced fluorescence detection. J. Chrom 1999, 853, 545–553. [Google Scholar]
- Ruan, C.; Zeng, K.; Varghese, O.K.; Grimes, C.A. A staphylococcal enterotoxin B magnetoelastic immunosensor. Biosens. Bioelectron 2004, 20, 585–591. [Google Scholar]
- O’Brien, T.; Johnson, L.H.; Aldrich, J.L.; Allen, S.G.; Liang, L.T.; Plummer, A.L.; Krak, S.J.; Boiarski, A.A. The development of immunoassays to four biological threat agents in a bidiffractive grating biosensor. Biosens. Bioelectron 2000, 14, 815–828. [Google Scholar]
- Gessler, F.; Pagel-Wieder, S.; Avondet, M.-A.; Böhnel, H. Evaluation of lateral flow assays for the detection of botulinum neurotoxin type A and their application in laboratory diagnosis of botulism. Diagn. Microbiol. Infect. Dis 2007, 57, 243–249. [Google Scholar]
- Scotcher, M.C.; Cheng, L.W.; Stanker, L.H. Detection of botulinum neurotoxin serotype B at sub mouse LD50 levels by a sandwich immunoassay and its application to toxin detection in milk. PLoS One 2010. [Google Scholar] [CrossRef]
- Sharma, S.K.; Eblen, B.S.; Bull, R.L.; Burr, D.H.; Whiting, R.C. Evaluation of lateral-flow Clostridium botulinum neurotoxin detection kits for food analysis. Appl. Environ. Microbiol 2005, 71, 3935–3941. [Google Scholar]


© 2012 by the authors; licensee MDPI, Basel, Switzerland This article is an open access article distributed under the terms and conditions of the Creative Commons Attribution license ( http://creativecommons.org/licenses/by/3.0/).
Share and Cite
Weingart, O.G.; Gao, H.; Crevoisier, F.; Heitger, F.; Avondet, M.-A.; Sigrist, H. A Bioanalytical Platform for Simultaneous Detection and Quantification of Biological Toxins. Sensors 2012, 12, 2324-2339. https://doi.org/10.3390/s120202324
Weingart OG, Gao H, Crevoisier F, Heitger F, Avondet M-A, Sigrist H. A Bioanalytical Platform for Simultaneous Detection and Quantification of Biological Toxins. Sensors. 2012; 12(2):2324-2339. https://doi.org/10.3390/s120202324
Chicago/Turabian StyleWeingart, Oliver G., Hui Gao, François Crevoisier, Friedrich Heitger, Marc-André Avondet, and Hans Sigrist. 2012. "A Bioanalytical Platform for Simultaneous Detection and Quantification of Biological Toxins" Sensors 12, no. 2: 2324-2339. https://doi.org/10.3390/s120202324