TiO2 Nanotube Array Sensor for Detecting the SF6 Decomposition Product SO2

Abstract
: The detection of partial discharge through analysis of SF6 gas components in gas-insulated switchgear, is significant for the diagnosis and assessment of the operating state of power equipment. The present study proposes the use of a TiO2 nanotube array sensor for detecting the SF6 decomposition product SO2, and the application of the anodic oxidation method for the directional growth of highly ordered TiO2 nanotube arrays. The sensor response of 10–50 ppm SO2 gas is tested, and the sensitive response mechanism is discussed. The test results show that the TiO2 nanotube sensor array has good response to SO2 gas, and by ultraviolet radiation, the sensor can remove attached components very efficiently, shorten recovery time, reduce chemical poisoning, and prolong the life of the components.1. Introduction
SF6 has been widely used in gas-insulated switchgear (GIS) because it has good insulating performance and arc extinction, and it can markedly improve insulation intensity [1–4] when used as an insulating medium. Although the reliability of GIS equipment is very high, inevitable failures due to internal defects can still cause different degrees of partial discharge. The active gas generated by discharging electricity accelerates insulation aging and corrodes the metal surface, which may eventually trigger a GIS fault. A massive amount of research locally and abroad demonstrates that when insulation faults occur in GIS, discharging electricity energy causes the SF6 gas to undergo a decomposition reaction, thus producing several kinds of low-fluorine sulfides, such as SF4, SF3, SF2, and so on. These low-fluorine sulfides react further with trace moisture and oxygen in the SF6 gas, thus producing the compounds SOF4, SOF2, SO2F2, SO2, and HF, among others [5,6]. At present, the main methods used to analyze and detect the decomposition component of SF6 partial discharge are gas chromatography, test tube method, infrared absorption spectrometry, and so on. Consequently, there has been increasing interest in the use of the contents of the characteristic components of the gas detect GIS internal insulation faults.
Titanium dioxide nanotube array (TiO2 NTs) is a typical three-dimensional nanomaterial. TiO2 NTs has rich chemical and physical properties and low manufacturing costs. Thus, TiO2 NTs has broad application prospects [7]. In recent years, research has shown that because of its large specific surface area and nanosize effect, the TiO2 nanotube arrays have an enormous potential for development compared with other nanostructure forms in fields such as light catalysis, sensor, and solar batteries. TiO2 nanotube arrays have become the hotspot of international nanometer material research [8]. The tiny gas sensor made from TiO2 NTs has several advantages, such as fast response, high sensitivity, and small size. Several scholars in the field have achieved significant progress. As a sensitive material, TiO2 NTs is used to test O2, NO2, H2, ethanol, and other gases [9–14]. Some key references about TiO2 nanotube sensors in the existing literature are listed below in Table 1:

| Available Literature | Nanotube Type | Nanotube diameter | Gas sensor | Sensitivity |
|---|---|---|---|---|
| Seo, M.-H., et al. [10] | TiO2 individual nanotubes | 70 nm | Toluene (50 ppm) | 25% |
| Lin, S., et al. [11] | TiO2 nanotube arrays | 150 nm | Formaldehyde (50 ppm) | 35% |
| Yun, H. [12] | TiO2 individual nanotubes | 20 nm | NO2 (12.5 ppm) | 67% |
| TiO2 nanotube arrays | 100 nm | NO2 (2.5 ppm) | 130% | |
| Varghese, O.K., et al. [13] | TiO2 nanotube arrays | 46 nm 76 nm | H2 (1,000 ppm) | 1,000% 90% |
The current study introduces and develops the TiO2 nanotube array sensor, which is then used to conduct laboratory research testing of SF6 decomposition products and gas sensor tests on one of the SF6 decomposition components, SO2. The findings indicate that the sensor has good sensitivity and rapid response.
2. Experimental Section
2.1. Preparation of the TiO2 Nanotube Array
The present study generated a TiO2 nanotube array by an anodic oxidation method using a two-electrode system. A platinum metal piece was used as cathode, whereas a titanium piece was used as anode. The experimental processes are as follows: first, 0.5 mm thick Ti foil (area of 0.8 cm × 2.0 cm and purity of 99.94%) was burnished with sandpaper, soaked in 30% HCl solution, and heated to 80 °C for 20 min to remove the surface oxidation layer. Then, the Ti pieces were cleaned by washing with deionized water. The clean Ti pieces acted as the anode, whereas the platinum pieces acted as the cathode in the two-electrode electrochemical electrolysis pool. Between the two electrodes, a constant 20 V of anodic oxidation was applied continuously for 2 h. The electrolyte concentration was 0.1 M HF solution, and the electrolyte pH value was tested using a Model 3000 pH meter. Magnetic stirring was applied to ensure the uniformity of the Ti electrode surface electric current and temperature in the oxidation process and reduce the influence of the double electric layer between the electrolyte and electrode interface. After the reaction, the TiO2 nanotube array was cleaned by washing with deionized water, and dried in air heated from 2 °C/min to 500 °C in a muffle furnace for 1 h, and then removed after the temperature dropped to room temperature.
2.2. Production of TiO2 Nanotube Array
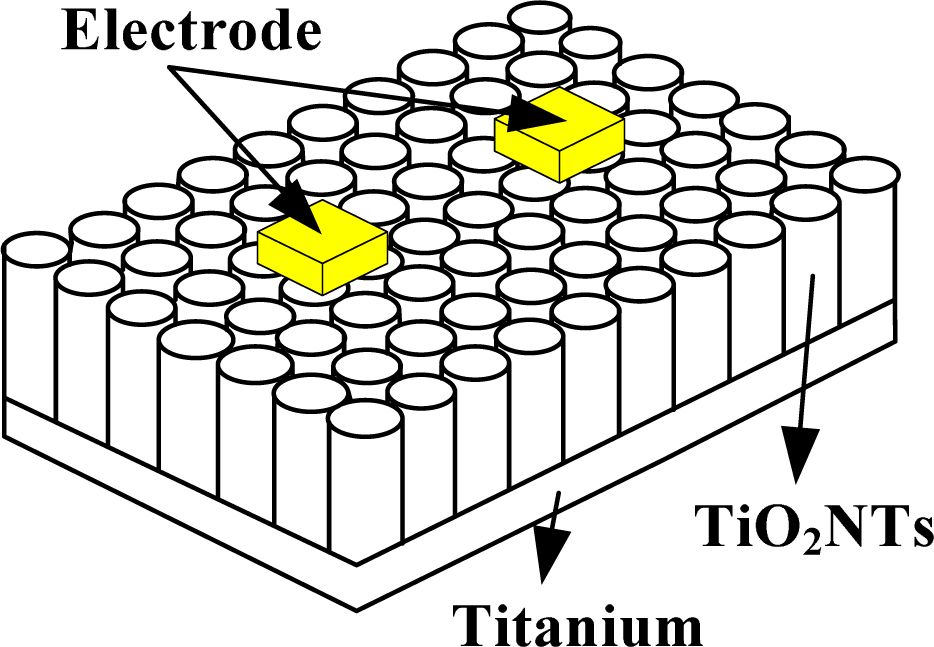
A gas-sensitive element of the TiO2 nanotube array is different from a traditional gas-sensitive element. A TiO2 nanotube array is generated directly on a metal titanium piece, not coated on traditional Si or A12O3 substrates. In the present study, a conductive silver glue was applied directly to create an electrical contact on the TiO2 nanotube array surface. The electrodes and TiO2 nanotube array were pasted firmly together to connect the leads. A schematic diagram of the sensor structure is shown in Figure 1.
2.3. TiO2 Nanotube Array Sensor Test Device and Method
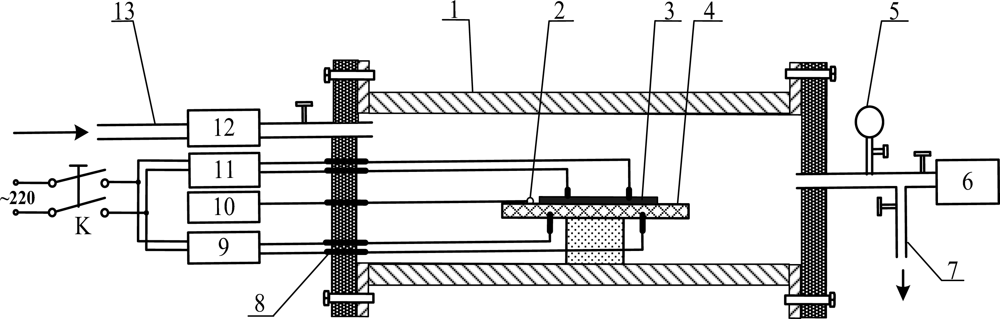
Figure 2 presents the detection test device for the TiO2 nanotube array sensor response measurement of the SF6 decomposition products. Shown in the figure are the following: 1. quartz glass tube; 2. thermal resistance probe; 3. carbon nanotube sensors; 4. ceramic heating slices; 5. vacuum form; 6. vacuum pump; 7. vent ducts; 8. terminals; 9. AC regulator; 10. temperature display apparatus; 11. impedance analyzer; 12. gas flow meter; and 13. inlet ducts.
In the current experiment, the standard gas containing the SF6 decomposition products that needs to be measured was injected through the inlet. The gas flow meter controlled and detected the measured gas flow rate. The ceramic heater and heat resistance of the probe controlled and measured the sensor surface temperature. The TiO2 nanotube array sensor was placed in an airtight quartz glass tube. The sensor detects the characteristics of the sensor resistance, and records the resistance of the whole process through the impedance analyzer. The relative variation of the resistance of the TiO2 nanotube array sensor (i.e., sensitivity) was calculated using the following formula:
The response time of the sensor is the same as 90% of the amount of time that its resistance changes to the maximum amount. The TiO2 nanotube array has adsorption effects with the oxygen in air and water vapor; hence, to eliminate those factors, this experiment used the dynamic method [13]. The specific steps are as follows: before the sensitivity response test, high-purity N2 was first injected at a flow rate of 0.1 L/min, and at the same time, connected to the heating power supply. The voltage regulator was adjusted to control the surface temperature of the sensor (required to maintain a certain temperature) until the TiO2 nanotube sensor array resistance was stable. The value obtained for R0 was recorded.
Second, one of the SF6 gas decomposition products, namely SO2, was passed, and the gas flow velocity in the device was maintained (the same as the previous N2 gas flow velocity). At this time, the sensor resistance exhibited pronounced changes and achieved stability (waves near one resistance) immediately. In the process, the resistance value R was recorded. Finally, when the sensor resistance was stable, high-purity N2 was injected again at 0.1 L/min velocity, until the resistance of the sensor gradually achieved numerical stability.
3. Results and Discussion
3.1. Morphology of the TiO2 Nanotube Array Obtained through Characterization and Analysis
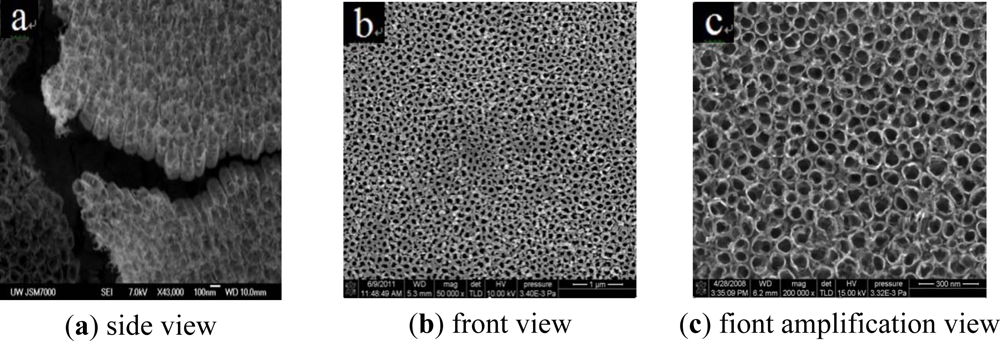
The sample was observed under a scanning electron microscope (SEM). In the present experiment, a JEOL JSM-7000 field emission SEM (Japan) was used. As observed from the SEM images, the anodic oxidation method and the above experimental scheme can grow a TiO2 nanotube array with a high order and directional growth, whose pipe diameter is about 80 nm and length of about 300 nm (shown in Figure 3).
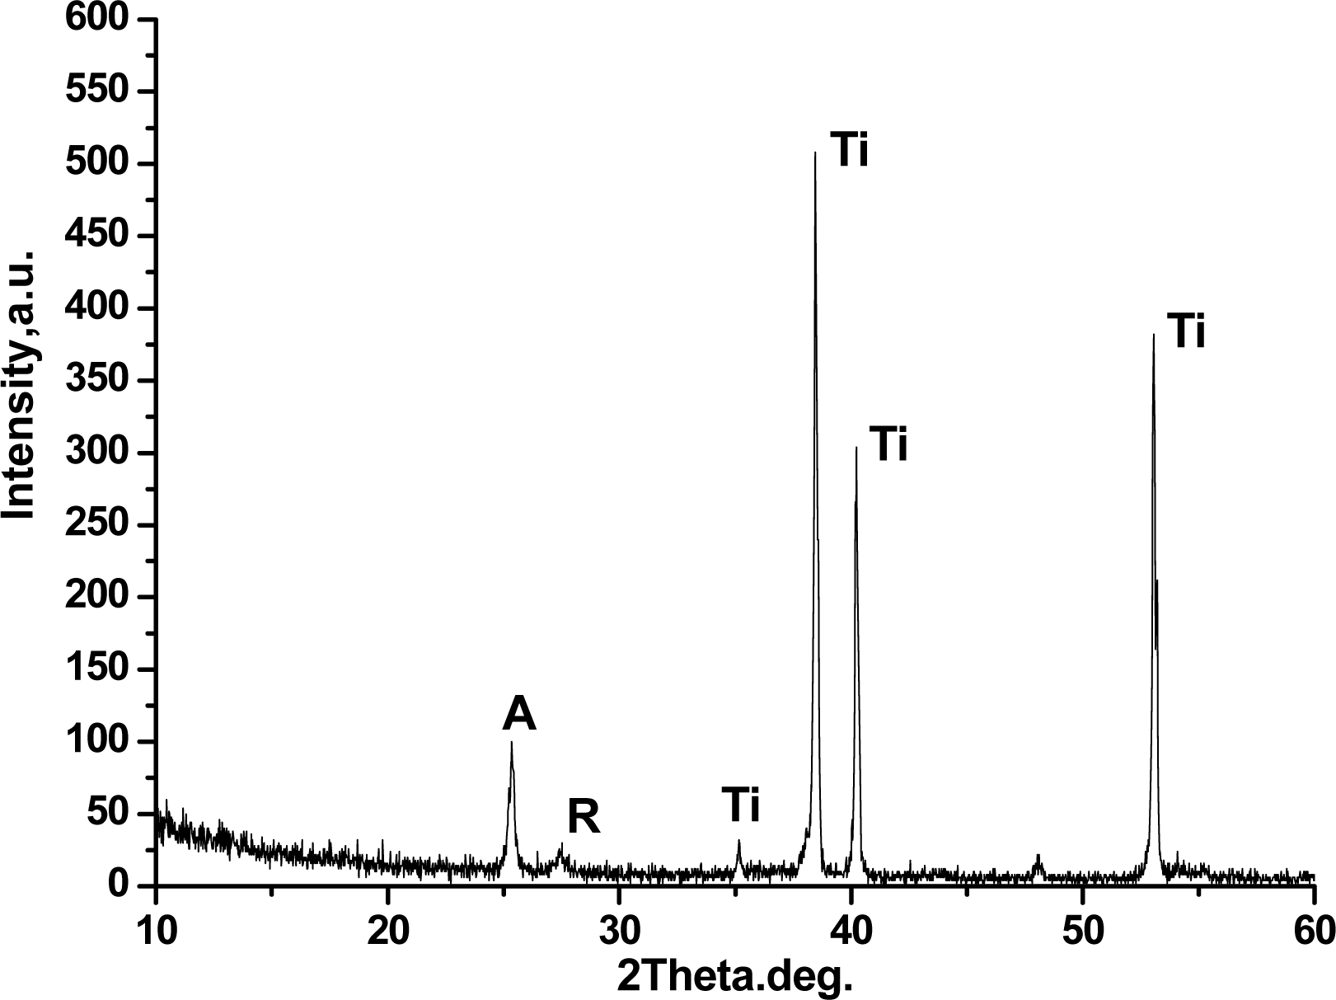
Figure 4 shows an X-ray diffraction spectrum diagram of the TiO2 nanotube array. From the figure, the crystal face peak of strong anatase (A in the figure) exists at 2θ = 25.3°, and the 101 crystal face peak of weak rutile exists at 2θ = 27.4° (R in the figure). These findings indicate that the TiO2 nanotube array is mainly anatase, and a small amount of rutile phase is observed.
3.2. Influence of Working Temperature on the Gas-Sensitive Characteristics of the TiO2 Nanotube Array Sensor
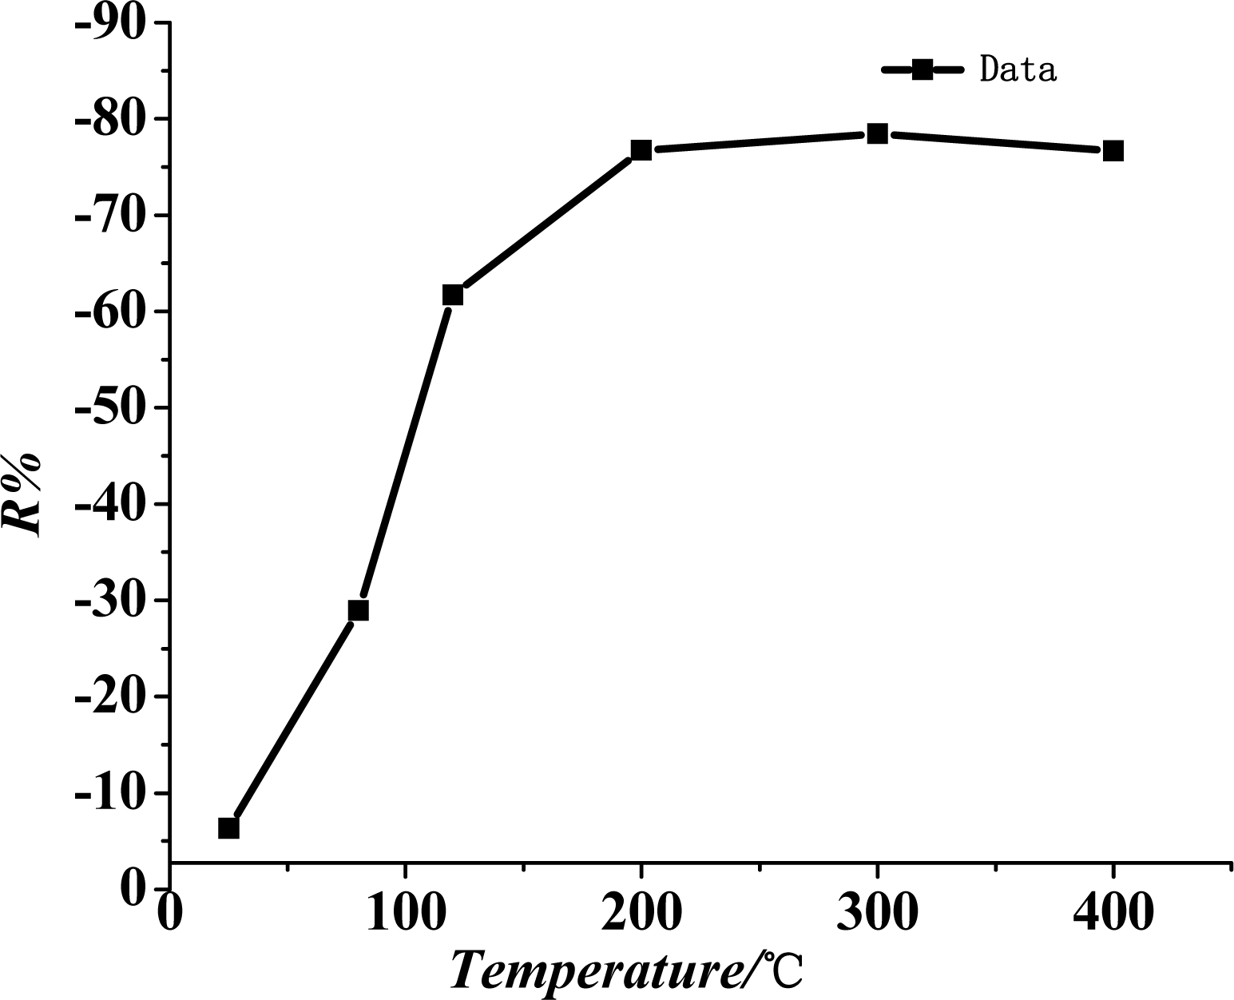
The performance of metal oxide semiconductor gas-sensitive materials is greatly influenced by the working temperature. The present study tested the SO2 gas sensor response curve of the TiO2 nanotube array sensor at different working temperatures.
The prepared sensor was placed inside the mentioned test device (Figure 2). Through the temperature control device, the surface of the sensor was heated, and its surface temperature was controlled. In the current study, the gas-sensitive characteristics of the TiO2 nanotube array sensor were tested with 50 ppm SO2 at surface temperatures ranging from 20 °C to 400 °C.
Figure 5 shows the curve of the sensitivity of the TiO2 nanotube array sensor at different working temperatures (i.e., surface temperature). The chart indicates that when work temperature is lower, the sensitivity of the sensor increases with the rise in its working temperature. When the temperature reaches 200 °C, the sensor reaches it maximum sensitivity at −76%. When the working temperature continues to rise, the sensitivity tends to be saturated and remains basically unchanged. Therefore, the best working temperature for the TiO2 nanotube array sensor is about 200 °C.
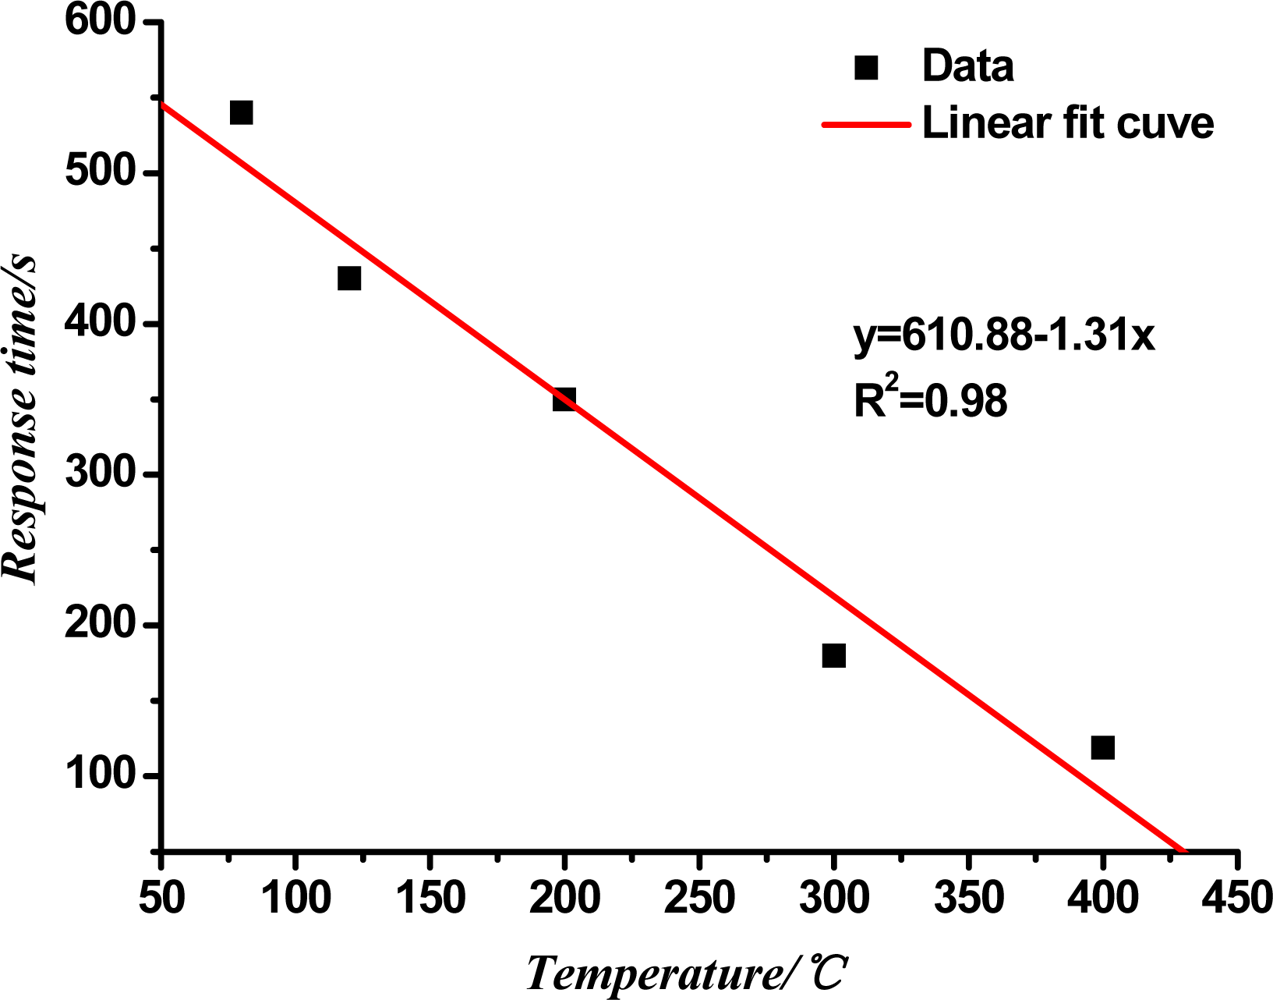
Figure 6 shows the curve of the response time of the TiO2 nanotube array sensor at different working temperatures. In the figure, the response time of the sensor decreases with the rise in the working temperature, and has a certain linear relationship with the temperature. Through the linear fit, the linear correlation coefficient R2 is 0.98.
The molecular motion and diffusion of the gas speed up because of the increase in temperature, and the gas absorption and the dissociation rate of the sensor's surface increase so the sensor response time decreases with the increasing temperature.
3.3. Sensor Response of the TiO2 Nanotube Array to Different SO2 Concentrations
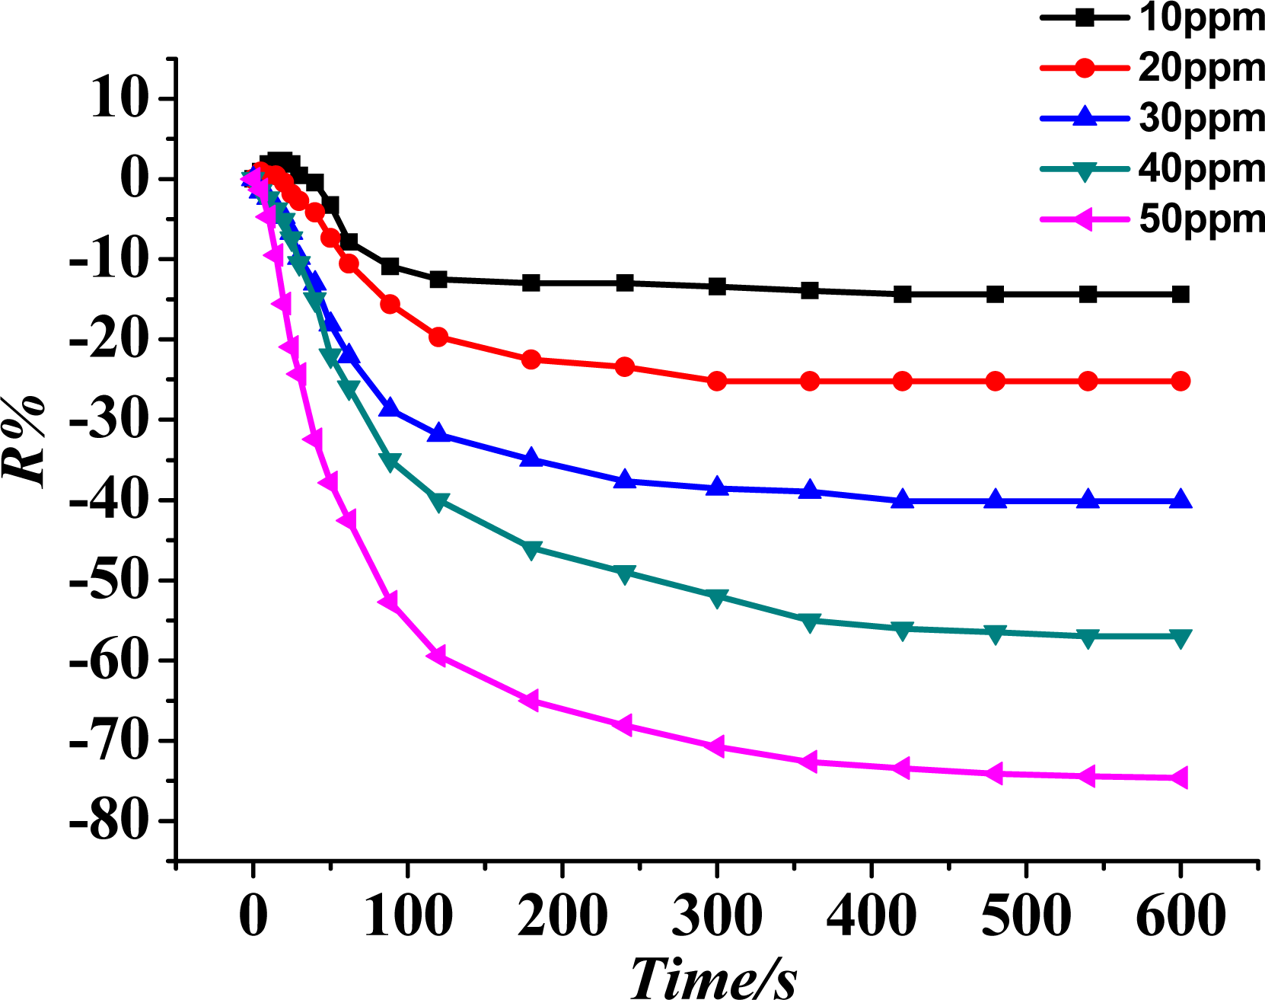
According to procedures of the experiment described in Section 2.3, under the condition that the sensor is under a 200 °C working temperature, the gas sensitivity (response curve) of the TiO2 nanotube array sensor is measured at SO2 gas concentrations of 10, 20, 30, 40 and 50 ppm, and the result is shown in Figure 7. The figure illustrates that the bigger the concentration of SO2 gas, the higher the sensor response (sensitivity).
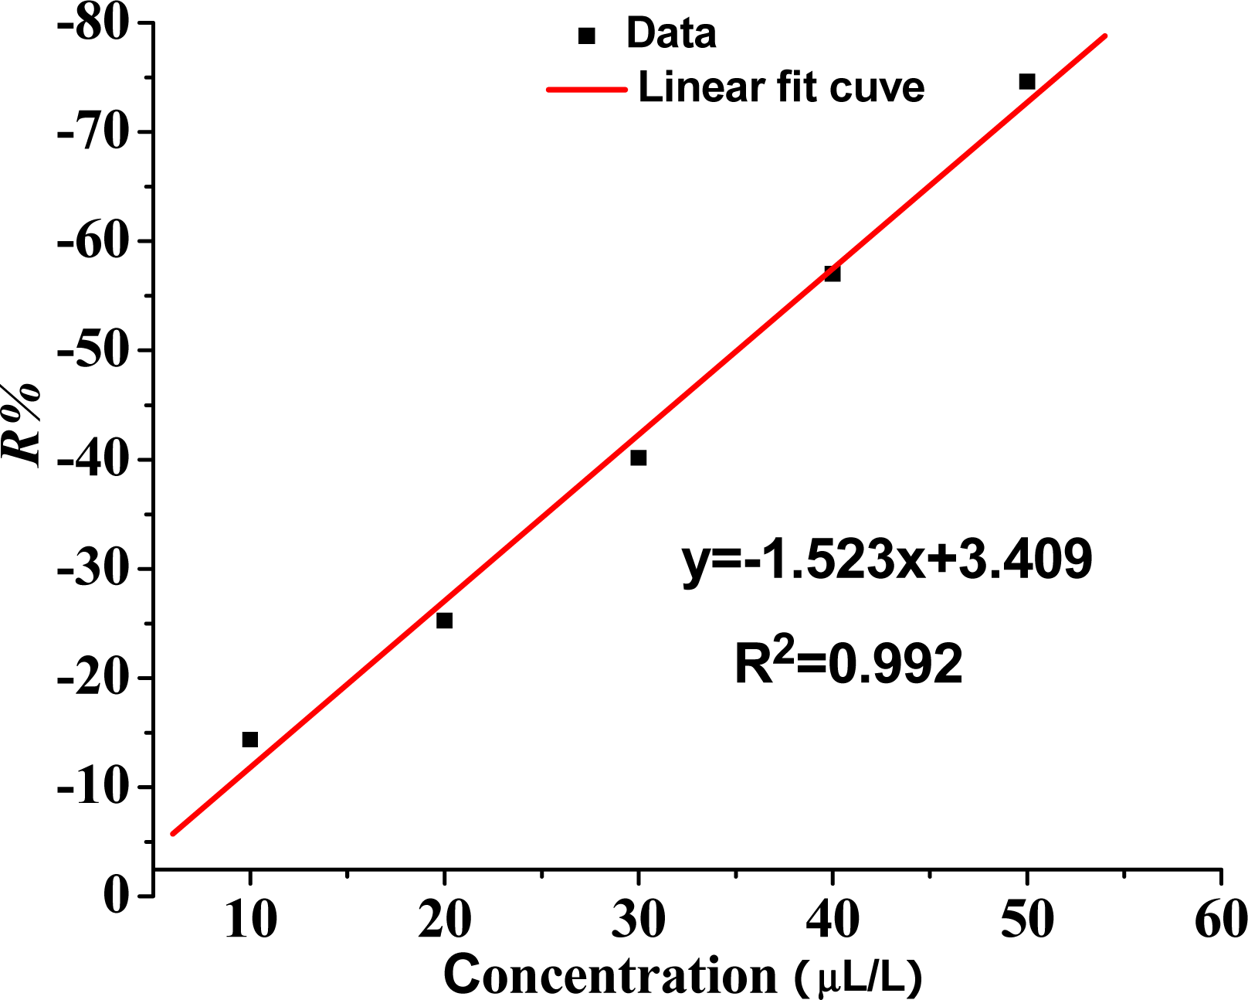
Therefore, based on the linear fitting, the relation between the concentration of SO2 gas and sensor sensitivity is a certain linear relation under a low concentration, and the linear correlation coefficient R2 is 0.992. As shown in Figure 8, the ability of the sensor to detect low concentrations of SO2 gas has a certain practical value.
3.4. Sensor Selectivity of the TiO2 Nanotube Array to Different SF6 Decomposition Components
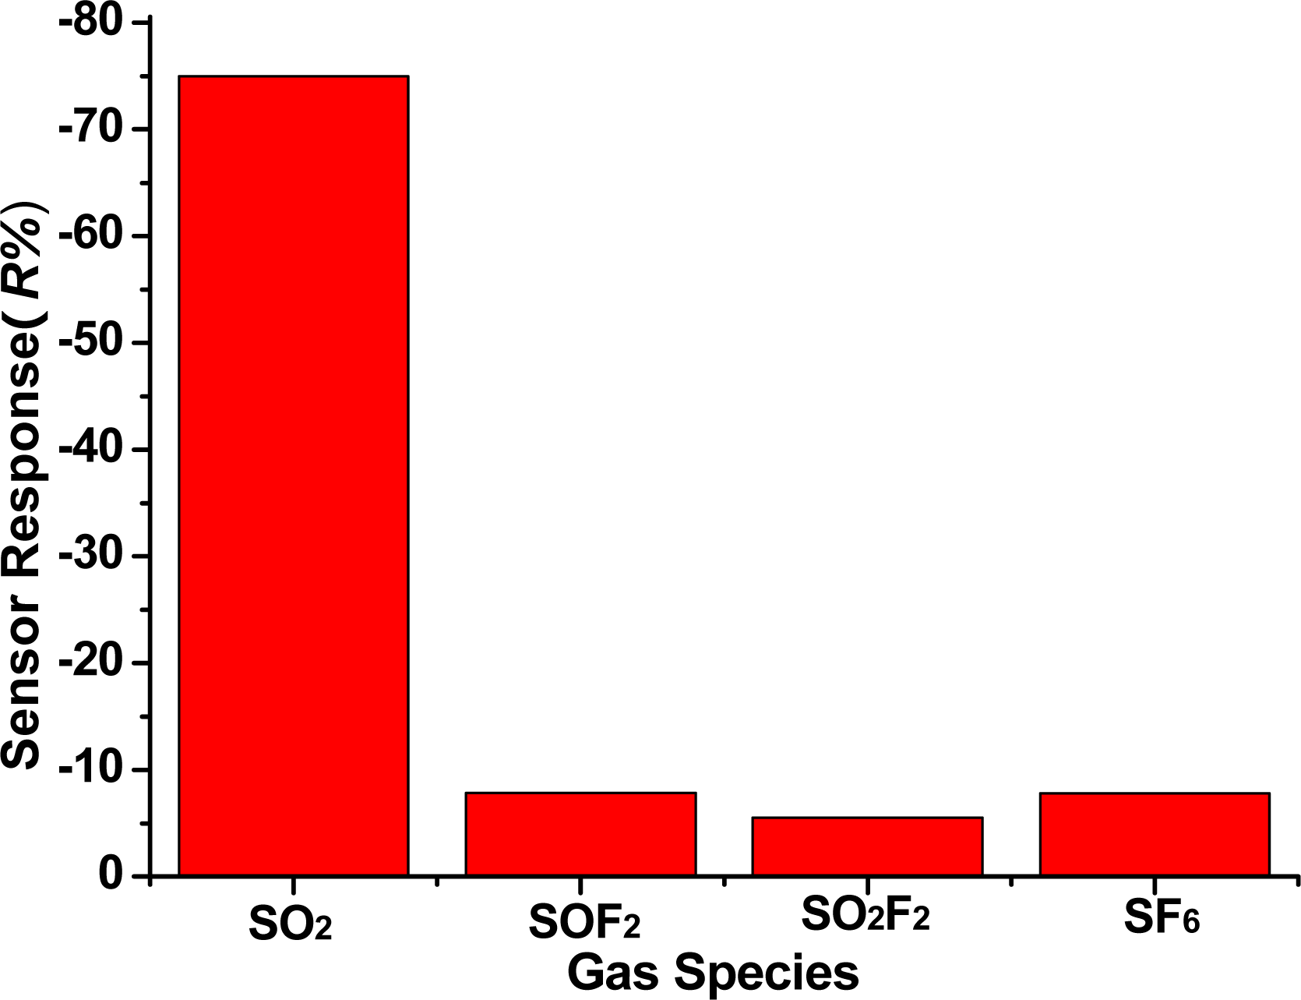
SO2 is produced by SF6 decomposition. It is necessary to study the TiO2 nanotubes sensor response to SF6 gas decomposition products and background gas SF6. According to methods and procedures of the experiment in Section 2.3, under the condition that the sensor is under a 200 °C working temperature, the gas sensitivity (response curve) of the TiO2 nanotube array sensor is measured at 50 ppm SO2, 50 ppm SOF2, 50 ppm SO2F2 and 99.999% SF6, and the result is shown in Figure 9. We can see that the sensor responses to 50 ppm SO2, 50 ppm SOF2, 50 ppm SO2F2 and 99.999% SF6 are −76%, −7.8%, −5.5% and −7.7%, respectively. This illustrates that the TiO2 nanotubes sensor has good selectivity for SO2 gas. It is suitable for checking SO2 gas, the main component of SF6 decomposition in the GIS.
3.5. Sensor Stability Testing of the TiO2 Nanotube Array
According to the experimental method and process in Section 2.3, when the temperature was at 200 °C, the sensor stability test towards the SF6 decomposition component SO2 was conducted. The test results are shown in Figure 10. Before the sensor stability test, the TiO2 nanotube array sensor resistance remained basically unchanged when flowing pure N2 was injected. When injected with 50 ppm SO2 gas, the sensor resistance changed dramatically and achieved stability immediately. When injected with N2 after a certain period, the sensor resistance gradually returned to the initial value. The above experiment was tested three times, and we found that the sensor response of SO2 gas is invariable, and every time through nitrogen cleaning, the resistance of sensor can be returned to the initial value. Thus it is shown that the sensor has good stability. The sensor was tested agian after two months, when we repeated the 50 ppm SO2 gas experiment once again, and found that the sensor response falls, and resistance can’t return to the initial value, showing that the sensor has experienced chemical poisoning. Ultraviolet light is used for illumination and quick reduction of the resistance of the sensor. When stability is achieved, the resistance becomes smaller than the initial one. By passing nitrogen gas again, the sensor resistance increases gradually, and finally achieves stability. The sensor resistance returns to the initial value; when we performed the 50 ppm SO2 gas experiment two times, the sensor response reaches the level of the two months ago. That is, through the ultraviolet irradiation, the SO2 gas molecules adsorbed on the sensor can be washed away completely. Therefore, the TiO2 nanotube array achieves complete desorption results.
3.6. Discussion on the Mechanism of TiO2 Nanotube Sensor Array Gas-Sensitive Response
TiO2 as a sensitive material that detects gases through changes in physical properties, such as electric conductivity, when the gas comes in contact with a TiO2 molecule surface. Oxygen has a very strong adsorption. Oxygen in the air at room temperature adsorbs physically on the TiO2 surface. When a certain energy is gained, oxygen adsorbs on the TiO2 nanotube array sensor surface in the form of chemical adsorption. The common forms of chemical absorption oxygen are O2ads−, Oads−, and Oads2−, which relate to the environmental temperature [15]. The experimental results indicate that under low temperatures, the oxide surface exists in the form of a “molecular ion” O2ads−, and changes into a form of an “atomic ion” Oads− and Oads2− with the rise in temperature. At more than 450 K, Oads− dominates the surface oxygen adsorption. In the current study, the working temperature of the sensor is 200 °C (473.15 K); hence, in the process, the oxygen in the air captures the surface electron of TiO2, changing into chemical adsorption. The chemical reaction equation is:
When the sensor surface has reduced the SO2 gas, the response between the adsorption of oxygen and the SO2 gas sensor is as follows:
SO2 gas undergoes an ionic reaction with the surface adsorption oxygen, removes an electron, releases back into the conduction band, and causes the conductivity of the TiO2 materials to increase, thus causing the resistance to decrease. In this manner, the TiO2 nanotube sensor plays a sensing function.
This finding is consistent with the experimental results. Although the TiO2 nanotube array and the TiO2 thin film semiconductor are different in microstructure and form, the above semiconductor adsorption mechanism is suitable for explaining the gas sensor response of the TiO2 nanotube array.
As seen in Figure 10, after two months, we repeated the 50 ppm SO2 gas experiment once again, and found that the sensor response was reduced, and the resistance can't return to the initial value. This phenomenon is due to the residual thermal decomposition of SO2 molecules fixed in the TiO2 nanotube arrays as the result of chemical adsorption. The adsorption energy of chemical adsorption is much larger than the physical adsorption capacity; hence, pure nitrogen gas flushing the sensor and low-temperature heating are not sufficient to remove completely the SO2 molecules left on the sensor by chemical adsorption. Therefore, ultraviolet light is used to desorb SO2 molecules attached on the sensor. In this manner, the sensor repeatability and service life can be improved because the forbidden bandwidth of the ultraviolet photon energy is almost the same as that of many metal oxide semiconductors. Hence, ultraviolet radiation can be absorbed effectively by the TiO2 nanotube array. The surface of the film and the inner portion undergo a range of physical and chemical processes. In the case of gas adsorption, ultraviolet radiation can be absorbed by the TiO2 nanotube array through electron-hole pair excitation, thus increasing the carrier concentration and reducing the grain interface barrier. Through these processes, the TiO2 nanotube array conductivity can be increased, and the resistor reduced. Ultraviolet radiation can be absorbed directly by gas molecules to produce desorption or stimulate chemical reactions between different types of molecules [16]. This finding indicates that the irradiation of ultraviolet light sensor can remove the remaining SO2 molecules effectively and thoroughly. This method can improve sensor repeatability and reduce sensor chemical poisoning, thereby increasing the service life of the sensor.
4. Conclusions
The current study is the first to report on the gas-sensitive characteristics of the TiO2 nanotube array of three-dimensional materials for the SF6 gas decomposition product SO2 gas. The following conclusions are drawn:
A highly ordered TiO2 nanotube array with directional growth is successfully produced by an anodic oxidation method. The TiO2 nanotube sensor array working temperature influences the sensitivity and the response time, and the best results are obtained when the sensor is at a working temperature of 200 degrees or so.
The current study analyzed the gas-sensitive characteristics of the TiO2 nanotube array of three-dimensional materials for the SF6 gas decomposition product SO2 gas. The results indicate that SO2 gas at low concentrations (10–50 ppm) creates a relative change in the resistance of TiO2 nanotube array, and that the response of TiO2 nanotube array sensor has a linear relationship with SO2 gas concentrations.
The irradiation of the sensor with ultraviolet light can remove the remaining SO2 molecules effectively and thoroughly, which can hasten the desorption process, thus avoiding chemical poisoning and extending service life.
Acknowledgments
We gratefully acknowledge the financial support from the National Basic Research Program of China (973 Program: 2009CB724506) and the Funds for Innovative Research Groups of China (51021005) and Open Funds of National Engineering Laboratory for Ultra High Voltage Engineering Technology (Kunming, Guangzhou).
References
- Beyer, C.; Jenett, H.; Kfockow, D. Ifluence of reactive SFX gases on electrode surfaces after electrical discharges under SF6 atmosphere. IEEE Trans. Dielectr. Electr. Insul 2000, 7, 234–240. [Google Scholar]
- Christophorou, L.G.; Olthoff, J.K. Electron interactions with SF6. J. Phys. Chem. Ref. Data 2000, 29, 267–330. [Google Scholar]
- Kurte, R.; Heise, H.M.; Klockow, D. Quantitative infrared spectroscopic analysis of SF6 decomposition products obtained by electrical partial discharges and sparks using PLS-calibrations. J. Mol. Struct 2001, 565–566, 505–513. [Google Scholar]
- Suehiro, J.; Zhou, G.; Hara, M. Detection of partial discharge in SF6 gas using a carbon nanotube-based gas sensor. Sens. Actuat. B 2005, 2, 164–169. [Google Scholar]
- Zhang, X.-X.; Liu, W.-T.; Tang, J.; Xiao, P. Study on PD detection in SF6 using multi-wall carbon nanotube gas sensor. IEEE Trans. Dielectr. Electr. Insul 2010, 17, 833–838. [Google Scholar]
- Piemontesi, M.; Niemeyer, L. Sorption of SF6 and SF6 Decomposition Products by Activated Alumina and Molecular Sieve 13X. Proceedings of IEEE International Symposium on Electrical Insulation, Montreal, QC, Canada, 16–19 June 1996.
- Beyer, C.; Jenett, H.; Klockow, D. Influence of reactive SFx gases on electrode surfaces after electrical discharges under SF6 atmosphere. IEEE Trans. Dielectr. Electr. Insul 2000, 7, 234–240. [Google Scholar]
- Mor, G.K.; Shankar, K.; Paulose, M.; Varghese, O.K.; Grimes, C.A. Enhanced photocleavage of water using Titania nanotube arrays. Nano Lett 2005, 5, 191–195. [Google Scholar]
- Grimes, C.A.; Mor, G.K. TiO2 NT Arrays Synthesis, Properties, and Applications; Springer: Norwell, MA, USA, 2009. [Google Scholar]
- Seo, M.-H.; Yuasa, M.; Kida, T.; Huh, J.-S.; Yamazoe, N.; Shimanoe, K. Detection of organic gases using TiO2 nanotube-based gas sensors. Procedia Chem 2009, 1, 192–195. [Google Scholar]
- Lin, S.; Li, D.; Wu, J.; Li, X.; Akbar, S.A. A selective room temperature formaldehyde gas sensor using TiO2 nanotube arrays. Sens. Actuat. B 2011, 156, 505–509. [Google Scholar]
- Yun, H. Preparation of NO2 Gas Sensor Based on TiO2 Nanotubes. M.S. Thesis,. Dalian University of Technology, Dalian, China, 2005. [Google Scholar]
- Varghese, O.K.; Gong, D.; Paulose, M.; Ong, K.G.; Grimes, C.A. Hydrogen sensing using Titania nanotubes. Sens. Actuat. B 2003, 93, 338–344. [Google Scholar]
- Mor, G.K.; Varghese, O.K.; Paulose, M.; Shankar, K.; Grimes, C.A. A review on highly ordered, vertically oriented TiO2 nanotube arrays: Fabrication, material properties, and solar energy applications. Sol. Energy Mater. Sol. Cells 2006, 90, 2011–2075. [Google Scholar]
- Ruiz, A.M.; Sakai, G.; Cornet, A.; Shimanoe, K.; Morante, J.R.; Yamazoe, N. Cr-doped TiO2 gas sensor for exhaust NO2 monitoring. Sens. Actuat. B 2003, 93, 509–518. [Google Scholar]
- Sun, J.-P.; Hui, C.; Xu, A.-L.; Liu, H.-W. Progress in research on gas-sensing properties of metal oxide thin films under UV irradiation. Electron. Compon. Mater 2005, 24, 65–68. [Google Scholar]


© 2012 by the authors; licensee MDPI, Basel, Switzerland This article is an open access article distributed under the terms and conditions of the Creative Commons Attribution license (http://creativecommons.org/licenses/by/3.0/).
Share and Cite
Zhang, X.; Zhang, J.; Jia, Y.; Xiao, P.; Tang, J. TiO2 Nanotube Array Sensor for Detecting the SF6 Decomposition Product SO2. Sensors 2012, 12, 3302-3313. https://doi.org/10.3390/s120303302
Zhang X, Zhang J, Jia Y, Xiao P, Tang J. TiO2 Nanotube Array Sensor for Detecting the SF6 Decomposition Product SO2. Sensors. 2012; 12(3):3302-3313. https://doi.org/10.3390/s120303302
Chicago/Turabian StyleZhang, Xiaoxing, Jinbin Zhang, Yichao Jia, Peng Xiao, and Ju Tang. 2012. "TiO2 Nanotube Array Sensor for Detecting the SF6 Decomposition Product SO2" Sensors 12, no. 3: 3302-3313. https://doi.org/10.3390/s120303302