Design and Testing of a Multi-Sensor Pedestrian Location and Navigation Platform

Abstract
: Navigation and location technologies are continually advancing, allowing ever higher accuracies and operation under ever more challenging conditions. The development of such technologies requires the rapid evaluation of a large number of sensors and related utilization strategies. The integration of Global Navigation Satellite Systems (GNSSs) such as the Global Positioning System (GPS) with accelerometers, gyros, barometers, magnetometers and other sensors is allowing for novel applications, but is hindered by the difficulties to test and compare integrated solutions using multiple sensor sets. In order to achieve compatibility and flexibility in terms of multiple sensors, an advanced adaptable platform is required. This paper describes the design and testing of the NavCube, a multi-sensor navigation, location and timing platform. The system provides a research tool for pedestrian navigation, location and body motion analysis in an unobtrusive form factor that enables in situ data collections with minimal gait and posture impact. Testing and examples of applications of the NavCube are provided.1. Introduction
The development of the NavCube multi-sensor navigation platform is primarily motivated by: (i) the desire to accurately position and navigate pedestrians and objects in urban and indoor environments, (ii) simultaneously collect various sensor data at various points on the body, (iii) being unobtrusive when mounted on the body and (iv) unpretentiously collect data as though an individual was not configured with a data collection system (i.e., no physical change in the gait or posture). A system meeting these criteria is capable of providing extensive data in situ with the ability to compare various processing methods as a function of different sensor combinations or sensor locations (e.g., an ankle mounted tracking device vs. a smart phone).
While superficially comparable to other classes of navigation applications, pedestrian navigation brings numerous challenges. An important challenge is cost, as the navigation system used by a pedestrian will generally be a component of another unrelated system such as a communication system or smart phone. Often the price of the components used in the navigation system is to be minimized while factoring in weight, size and power demands placed upon the host device.
An additional challenge to practical pedestrian navigation systems involves the large range of dynamics that may be produced by human motions, which may exceed the measurement ranges of inertial navigation sensors [1]. As a consequence, a pedestrian navigation system must either omit inertial measurement units (IMUs) or alternatively select components, which are either capable of measuring the full range of expected human dynamics or implements algorithms which do not require continuous unsaturated observation of the user’s motion.
Another consideration is the fact that a pedestrian will operate in environments that either limit or deny availability of satellite navigation signals such as those from GPS. While GNSS signals are extremely useful outside, their weak power levels and signal reflections limit their use in many indoor settings. As such, a pedestrian navigation platform should be capable of prolonged operation in environments where satellite navigation signals are either unavailable or only intermittently accessible. When operating under these conditions, a navigation system must fall back on other positioning methods, or include complementary relative positioning systems, which allow short term propagation of a known position and heading.
Much research has been conducted in attempting to improve inertial based pedestrian navigation accuracy indoors (e.g., [2–16]), but very little is dedicated to methods of improving the data collection process’ within the study. It is therefore the scope of this paper to address a data collection tool that will facilitate an increased rate at which researchers can study pedestrian navigation and extend applications to the biomedical field. For examples of biomedical and navigation fields converging see [17–21]. Magnetometers are also being used to improve accuracy through innovative algorithms (e.g., [22–24]).
To permit indoor operation of the NavCube, complimentary relative positioning and navigation sensors such as IMUs, magnetometers, and barometers are included in the system design along with provision for future use of non-GNSS absolute positioning methods, such as received signal strength indicators (RSSI) from 802.11 network based positioning systems and wheel speed sensors.
The NavCube functionalities can be used in other applications, scenarios and research. Biomechanics, bioengineering, guidance, robotics and animation are all engineering fields that used to be independent from each other but now have merging sensors and principles. Indeed, with the progress in miniaturizing sensors, the data of interest for a specific domain is now available to others at little or no additional cost. For example, sport watches can include a GPS receiver and a heart rate monitor [25]. Accelerometers, gyroscopes, magnetometers and barometers are embedded in smartphones. The hardware is used in daily life activities and provides continuous information about their users. This is stimulating research in developing new processing methods for improving living conditions. Consequently, several new measurement units have been designed for conducting research on multiple aspects of micro-electromechanical measurement systems (MEMS) data processing for physiological or industrial applications and the combination of different scientific competences lead to novel results.
A major evolution in the usage of mobile measurement units comes from the fact that until recently they were rigidly attached to vehicles for navigation purposes whereas nowadays they are carried by human of all ages in their hands, pockets or bags. Globally two categories of measurement units exist. The first one consists in systems able of recording measurements in a specific location and often equip a dedicated room. They are essentially capturing human movements or used for shaping industrial components. The second category consists of IMUs whose use is not restricted to a specific area and can be carried out by the user in indoor and outdoor environments. Although not exhaustive, a survey of tracking systems for biomedical analysis (e.g., human movement and stroke rehabilitation) can be found in [26].
Among the first category are optical tracking systems that calculate the position and orientation of markers rigidly attached to the body, which are readily available in laboratories (e.g., [27–29]). They often use real-time digital photogrammetry and optical triangulation techniques to track the markers. A classical biomechanical application of these systems is the measurement of the exact nature of human body segments during motion. Completed with laser scanning or marker free-technology [30], the measurements, which are constrained in a specific volume, can also be used for industrial metrology (e.g., 3D modeling of automotive parts). Unfortunately, constraining the activity or body of interest to a specific location and area limits the applications range. Thus IMUs, members of the second category, are principally tri-axis sensors integrated on a single main circuit board, which has its own power management and data logging system. The MPU-6000/6050 product family of tri-axis accelerometer and gyroscope from Invense [31], the tactical grade ten degrees of freedom inertial sensor ADIS16375 from Analog Devices [32] or the iNErtial MOdule V2 from STMicroelectronics [33] are examples of these IMUs. Some more advanced solutions comprise a logging system for recording time synchronized data from multiple IMUs attached to the body along a distributed architecture. Widely used in Europe, the products based on inertial sensors proposed by Xsens are recording synchronized data from multiple IMUs. They provide different options for mounting the sensors on the user’s body and are principally oriented toward the use of accelerometers and gyroscopes, especially with the six degrees of freedom MTx IMU [34]. Solutions for using magnetic field data and GPS signals are also available.
The NavCube presented herein provides the ability to compare different GNSS receivers thus allowing comparison of different antenna combinations, locations and receiver type in pedestrian navigation activities. This benefit is in response to the advent of new GNSS signals and the wish to use GNSS pseudoranges and Doppler in signal degraded environments. As a consequence, research in navigation based on multiple IMUs (e.g., [35,36]) and GNSS has to follow the latest developments for integrating them in successful navigation solutions.
In order to develop algorithms for fusing inertial and GNSS signals for pedestrian navigation applications, especially using high sensitivity receiver (HSGPS) the NavCube comprises up to 11 sensor sets (IMUs, barometers and magnetometers), a multi-frequency survey grade GNSS receiver, two HSGPS receivers, and a high sensitivity GNSS (HSGNSS) receiver. In the following two sections, the design of the NavCube hardware platform will be described, and applications examples are provided which are common challenges facing pedestrian navigation research.
2. System Design
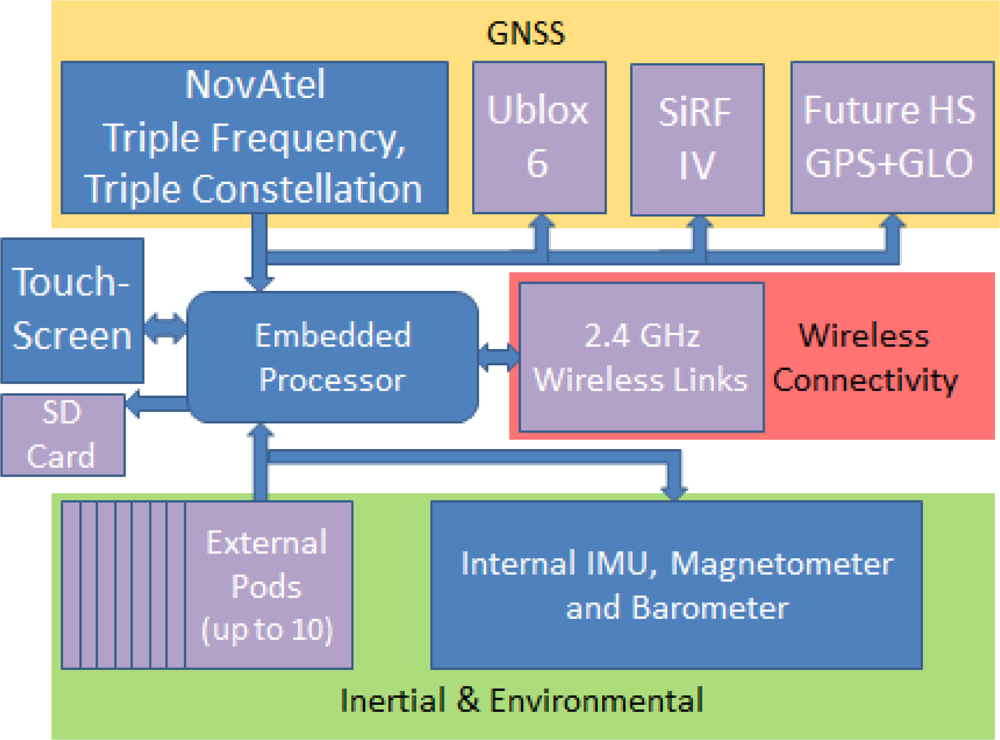
The NavCube has been designed to carry a wide variety of navigation sensors including accelerometers, gyroscopes, barometric pressure sensors, magnetic field sensors and future sensors including wheel speed sensors. Modularity has been emphasized where possible to allow the study of a variety of cutting edge sensors, with the option to exchange these as future developments in sensor technology occur. The primary strategy for obtaining this modularity was the subdivision of the system into core components and peripheral sensors. The block diagram of Figure 1 shows the modular/external elements of the system in violet, including the connection points for up to ten wired external sensors.
In order to support any selection of current and future sensors for any given testing scenario, external pod connections are provided by the NavCube to allow up to 10 external sensors to be interfaced to, synchronized with, and both powered and logged by the NavCube. This approach allows the replacement of any external and several internal systems when future versions become available, or to allow the side by side evaluation of past and present technologies. The multitude of external sensors supported allows multi-IMU pedestrian navigation applications such as those discussed in [35,36] as well as to provide an evolution path for the system to add new sensor types in the future. Combined with the Adaptable Sensor Pod (ASP) developed internally, which contains inertial barometric and magnetic field sensors, the NavCube is capable of instrumenting a pedestrian to provide this combination of data from 11 or more locations on the body simultaneously.
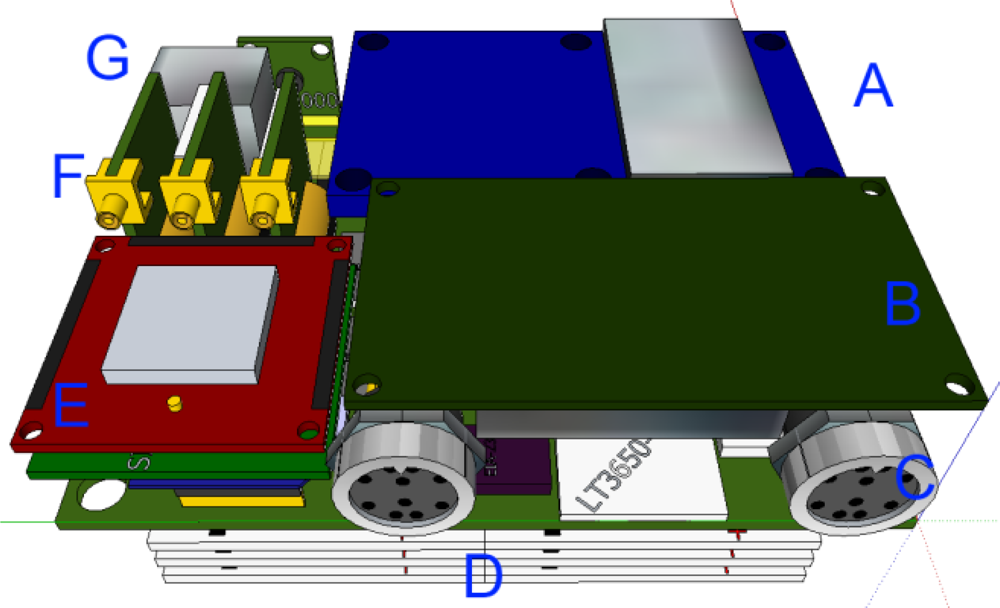
To facilitate the use of the system in typical pedestrian navigation applications the weight, size and physical dimensions were necessarily constrained, while device power storage and conditioning was integrated into the system enclosure in such a way as to provide power for both internal and external sensor systems. The layout of internal components was optimized to reduce system volume, as shown in Figure 2.
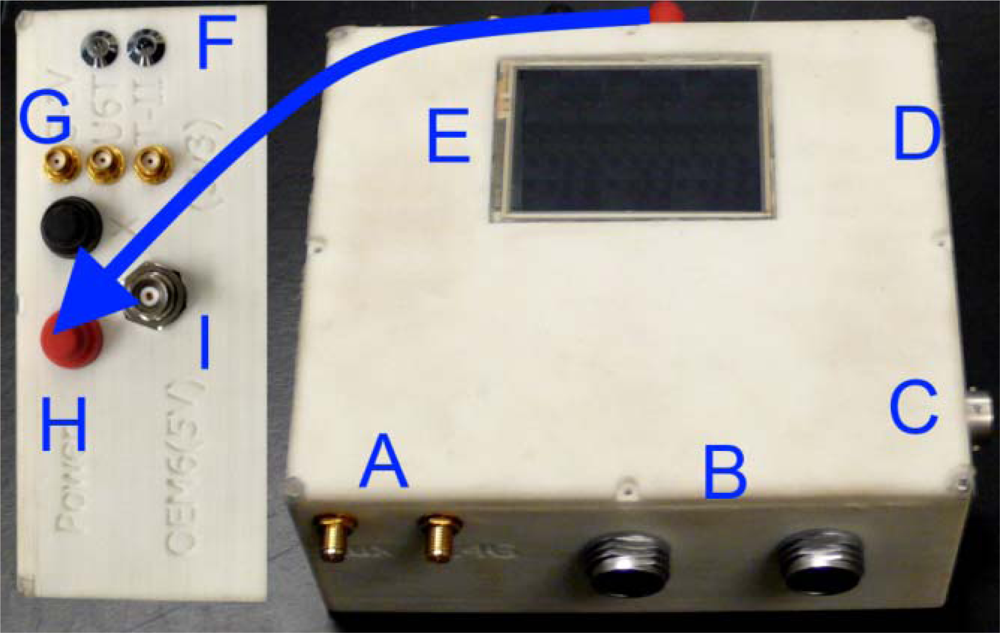
Not shown in Figure 2 is the removable storage media socket situated between the main circuit board and component A. All data collected by the system is internally synchronized and logged to this removable storage media for post processing. Element B in Figure 2 is identical to the ASP inertial, barometric and magnetic sensor ensemble. Figure 3 shows an external view of the assembled NavCube system installed within a custom laser deposition printed enclosure.
The internal sensors of the NavCube can be separated into the GNSS and non-GNSS categories, with the former containing the high sensitivity and high precision GPS and GLONASS receivers, and the latter containing the accelerometer and gyro triads, barometer and magnetometer. For comparison, the former category is enumerated in Table 1.
The list of GNSS receivers in Table 1 is not an exhaustive list of all possible supported GNSS systems, but rather indicates the receiver systems for which support boards have been designed to date. The OEM628 receiver forms the basis of the internal timing control of the NavCube and serves as the master timing reference for the rest of the system in addition to providing a GNSS receiver capable of very accurate phase measurements for Real-Time Kinematic positioning and high update rates. Secondary GNSS modules are installed via daughter cards, which allow future upgrade and replacement of these receivers, or the installation of multiple instances of the same receiver module when desired. Currently the system is operated with dual u-blox 6T modules, omitting the SiRF IV in order to gain multiple 5 Hz high sensitivity GPS sources.
Following the same design philosophy for non-GNSS sensors within the NavCube as that followed for the secondary GNSS sensors, the non-GNSS sensors are installed on a replaceable daughter card to permit future upgrade as more advanced models become available. The design cycle of this component was shortened substantially by sharing a common electrical and similar physical design to the sensor boards contained in the ASP pods. Currently the non-GNSS carrier board mounts the sensors indicated in Table 2, though it is intended to upgrade these at a future date as part of the system evolution. The ASP communication is via RS-232 signaling protocol, EIA-232 voltage levels, at 115,200 baud rate.
The ADIS16375 MEMS IMU is noteworthy for being a sub $1,000 inertial navigation solution, which is sufficiently stable in terms of gyro bias stability to detect the rotation rate of the earth under ideal conditions. Earth rotation detection is typically a task that requires the use of a much higher priced, much higher power consumption, and often much larger and heavier Fibre Optic Gyro (FOG) or Ring Laser Gyroscope (RLG) based IMU. While the ADIS16375 is still far less stable than FOG and RLG solutions, for a pedestrian navigation system designed to be effortlessly carried on the person of the user, the 100 gram mass of the ADIS16375 IMU is an excellent compromise of size and weight for performance.
To maintain the low weight of the system while gaining the capability of determining heading autonomously, the Honeywell HMC5883L magnetometer was selected for integration into the NavCube and ASP pods as a sub component of the inertial sensor carrier board. With a mass of less than 1 gram and negligible power consumption relative to the IMU, the inclusion of an HMC5883L enhances utility without degrading usability. Similarly, by integrating the Bosh Sensortec BMP085 barometer, the system is able to estimate changes in its elevation over time. Though sensitive to changes in weather pattern, as well as to the pressurization level of building ventilation systems, the barometer remains a useful tool in the estimation and constraint of vertical motion.
The NavCube weighs 1.2 kg, while each ASP is 0.1 kg. The total weight of the system including the NavCube, four ASPs, the wiring harness, a survey grade mobile GNSS antenna and its antenna cable, 3 low cost mobile antennas and a custom neoprene case is 2.7 kg.
2.1. Time Synchronization
Most navigation processing software assumes that each sensor is synchronized with GPS time (or another atomic time scale such as UTC where offsets are known). Thus, timing within the NavCube requires each sensor’s output to be either time-tagged or synchronized with its internal clock via a Pulse Per Second (PPS) signal. The OEM628 GNSS receiver provides a PPS signal that is distributed to each ancillary module to maintain timing.
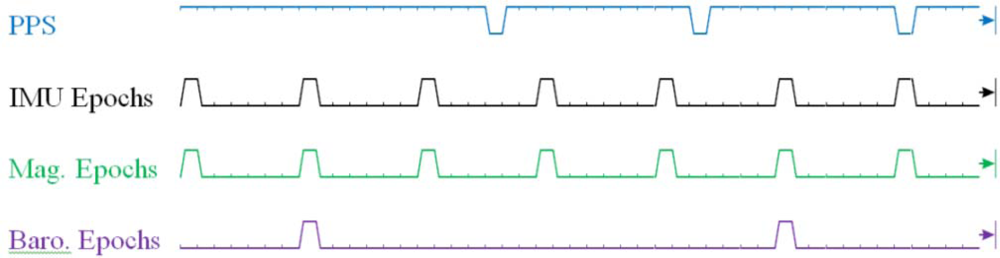
Within the ASP, the IMU, magnetometer and barometer timing is driven by a custom timing and data controller. This controller ensures that the 100 Hz IMU, 100 Hz magnetometer and 25 Hz barometer data has a near zero delay between sensors. Additionally, the controller steers the sampling train of all sensors such that the epochs of the IMU and barometer coincide with the next predicted PPS event. As shown below in Figure 4, the steering process takes 2–3 s to complete, and ensures that users with multiple ASP units driven by a UTC synchronized PPS train will have simultaneous IMU and magnetometer samples within ±100 μs. Barometric pressure sample times are similarly steered to maintain their alignment to IMU/magnetometer sample epochs. However, as is depicted in the timing diagram below, the epoch of barometric sensor output is not steered into alignment with expected PPS events.
The timing sequence of each ASP has three key aspects. First, the ASP time-stamps all events in terms of an internal free-running 32-bit counter. Naturally this counter will overflow back to zero on the clock cycle following 232-1. As such the user must take this overflow into account when handling data timing. Second, in order to unambiguously map the ASP PPS received epochs to UTC/GPS time, it is necessary to control the reception of the first time pulse and to know when this pulse occurred (e.g., by using the EVENT input from the NovAtel receiver log). Third, the timestamp data of the ADIS16375 sensor is compensated for the effects of digital filtering lag within the IMU. The implemented filter has a step response with a delay of 20 ms from the time of actual physical excitation. For this reason IMU timestamps will appear to refer to ‘the past’ with respect to other sensors, despite the fact that the actual sampling was simultaneous. When implementing a navigation filter which will utilize inertial data as well as barometric or magnetic data this timing behavior is required to be appropriately handled, as it should not be assumed that the samples of each sensor within the same frame are referred to the same moment in time.
2.2. Autonomous Operation
The NavCube operates on a four cell 88.8 Watt-hour lithium polymer battery pack. Given that the batteries data sheets are typically overly optimistic in terms of rated energy the available energy is approximately 82.1 Watt-hours within the batteries. A battery protection system ensures that the batteries remain within operating limits when nearing low power. Two voltage rails (3.3 V and 5.0 V) were required and thus power conversion circuitry was required. This reduced the available power by approximately 14%, to about 70.6 Watt-hours. Table 3 provides the net power usage of each component within the NavCube. The OEM6 GNSS receiver consumes the most power typically at 1.8 W, while each sensor pod requires 1.0 W. With a full complement eight sensor pods, the run time is approximately 4.5 h.
The NavCube file system controller supports the use of SD, and SDHC memory cards. Use of cards with a 133x+ or class 10 rating is best, but UHS 1 or 2 rated cards also work. Both FAT16 and FAT32 file systems are compatible with the system. Under these file systems maximum file size limits of two GB and four GB exist, respectively. Data collected exceeding these limits are stored in file sets and manually appended post mission. Data rates for each GNSS sensor are selectable by the user. Table 4 provides the approximate data rates of the maximum frequency of the observations. Actual data storage (and power draw) depends on many factors including satellite availability and the surrounding conditions/environment. The sensor pods however are more stable in their data rates.
3. Applications and Field Testing
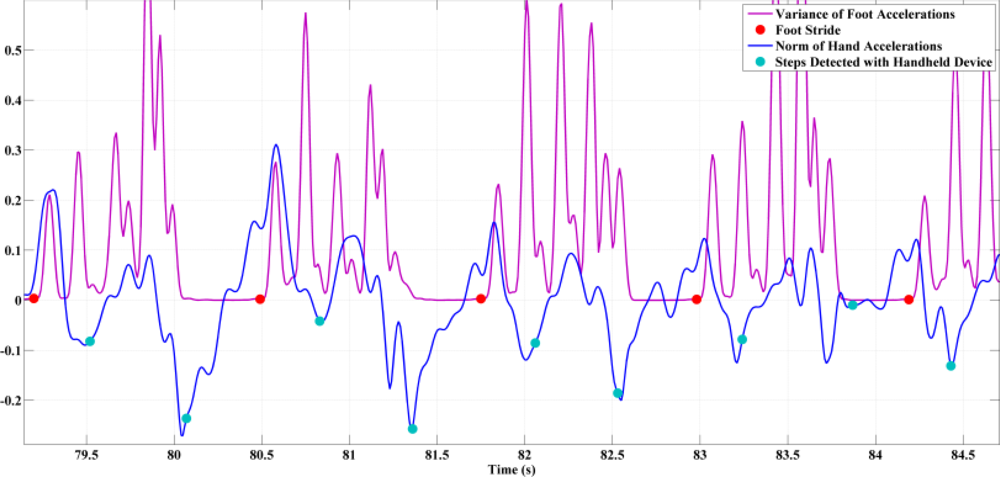
In this section field tests carried out with the NavCube and ASP pods are described to showcase its versatility in navigation based research. The first of these is a series of testing scenarios focused on the use of embedded sensors in handheld device navigation.
3.3. Sport Applications
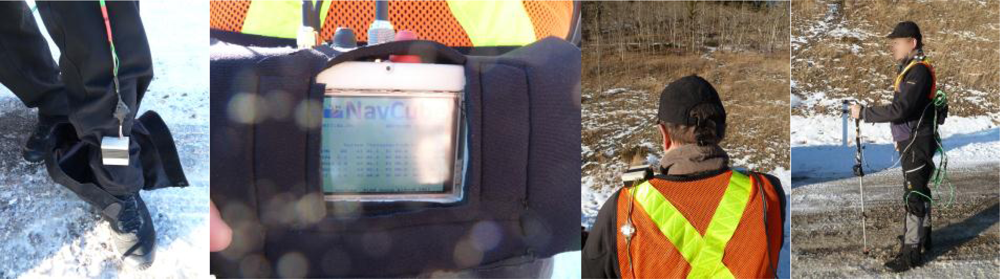
Navigation and body limb motion monitoring are becomingly more critical in athletic training and coaching. Numerous sports, including skiing, running, rowing and field hockey are using multisensory systems to track and improve performance (e.g., [26,42–46]). Because a large part of sport activities takes place outdoors, where users are free to perform any kind of motion, equipment used for performance evaluation must be light and noninvasive. Data collected by a hiker wearing the NavCube has been used for assessing different navigation and biometric parameters. Two APSs were rigidly attached to the legs above the hiking boots and another on the left shoulder; the core module of the NavCube was carried at the waist using a neoprene case and belt, two antennas located on the right shoulder and one antenna rigidly connected to the ASP located on the left foot. The complete data collection setup is illustrated in Figure 9.
The hiker hiked 3.5 km and ascended 700 m vertically in 68 min and took approximately 2,750 steps (one step is from heel lift to heel lift of the same foot). Each step length and velocity was averaged to determine a nominal step profile and is shown in Figures 10 and 11. The left foot was used to determine the start and end of each step. Figure 10 shows the displacement of each ASP, both horizontally and vertically. Each profile varies slightly due to uncorrectable errors, but these errors are limited to a few centimetres. It can be derived from this figure that the hiker has an average step height of 29 and 30 cm and a step length of 119 and 121 cm for the left and right feet while hiking. The back and shoulder sensors are in close agreement, but vary likely due to the user bending forward at steeper inclines.
Figure 11 provides a profile of the speed during the single gait cycle. The user had an average maximum foot speed of 2.20 m/s and 2.13 m/s for the left and right feet, respectively. The shoulder and back velocities also provide a clear view of the periodic speed related to each step. The vertical speed indicates a rising and falling velocity during each step on the order of 0.25 m/s. A GPS only, epoch-by-epoch least-squares solution averaged over the same intervals confirmed the negative velocities. This results from the hiker leaning forward at each step.
4. Conclusions and Future Plans
The system developed herein has proved an invaluable pedestrian navigation system due to its capability to power, synchronize, log and support a plurality of pedestrian navigation sensors. With applications of the system already spanning pedestrian navigation research topics, planned extension to include additional sensors will further broaden its range. The system also provides valuable information for biomechanics and sport applications.
Future sensors under consideration include supplementary absolute positioning via 802.11 wireless network observations through an internal network card, as well as the evolution of relative positioning capabilities through periodic replacement of both internal and external IMUs. The next planned non-GNSS enhancement is expected to be activation of the capability of the system to interface to a tactical grade IMU in order to provide researchers with a high accuracy indoor reference trajectory.
Acknowledgments
The authors would like to acknowledge the efforts of PLAN Group researchers H. Afzal, and M. Susi for their contributions to the testing of the NavCube system and their interest and sustained effort in developing, implementing and testing new navigation algorithms.
References
- Kwakkel, S.P.; Lachapelle, G.; Cannon, M.E. GNSS aided in situ human lower limb kinematics during running. Proceedings of the 21st International Technical Meeting of the Satellite Division of the Institute of Navigation (ION GNSS 2008), Savannah, GA, USA, 16–19 September 2008; pp. 1–10.
- Abdulrahim, K.; Hide, C.; Moore, T.; Hill, C. Using constraints for shoe mounted indoor pedestrian navigation. J. Navig. R. Inst. Navig 2012, 65, 15–28. [Google Scholar]
- Girard, G.; Côté, S.; Zlatanova, S.; Barette, Y.; St-Pierre, J.; van Oosterom, P. Indoor pedestrian navigation using foot-mounted IMU and portable ultrasound range sensors. Sensors 2011, 11, 7606–7624. [Google Scholar]
- Jimenez, A.R.; Seco, F.; Zampella, F.; Prieto, J.C.; Guevara, J. PDR with a foot-mounted IMU and ramp detection. Sensors 2011, 11, 9393–9410. [Google Scholar]
- Fuchs, C.; Aschenbruck, N.; Martini, P.; Wieneke, M. Indoor tracking for mission critical scenarios: A survey. Pervasive Mobile Comput 2011, 7, 1–15. [Google Scholar]
- Park, S.K.; Suh, Y.S. A zero velocity detection algorithm using inertial sensors for pedestrian navigation systems. Sensors 2010, 10, 9163–9178. [Google Scholar]
- Chen, R.; Chen, W.; Chen, X.; Zhang, X.; Chen, Y. Sensing strides using EMG signal for pedestrian navigation. GPS Solut 2010, 15, 161–170. [Google Scholar]
- Huang, C.; Liao, Z.; Zhao, L. Synergism of INS and PDR in self-contained pedestrian tracking with a miniature sensor module. IEEE Sens. J 2010, 10, 1349–1359. [Google Scholar]
- Torres-Solis, J.; Chau, T. Wearable indoor pedestrian dead reckoning system. Pervasive Mobile Comput 2010, 6, 351–361. [Google Scholar]
- Skog, I.; Handel, P.; Nilsson, J.; Rantakokko, J. Zero-velocity detection—An algorithm evaluation. IEEE Trans. Biomed. Eng 2010, 57, 2657–2666. [Google Scholar]
- Sun, Z.; Mao, X.; Tian, W.; Zhang, X. Activity classification and dead reckoning for pedestrian navigation with wearable sensors. Meas. Sci. Technol 2009, 20, 1–10. [Google Scholar]
- Godha, S.; Lachapelle, G. Foot mounted inertial system for pedestrian navigation. Meas. Sci. Technol 2008, 19, 1–9. [Google Scholar]
- Tan, H.; Wilson, A.M.; Lowe, J. Measurement of stride parameters using a wearable GPS and inertial measurement unit. J. Biomech 2008, 41, 1398–1406. [Google Scholar]
- Ojeda, L.; Borenstein, J. Non-GPS navigation for security personnel and first responders. J. Navig. R. Inst. Navig 2007, 60, 391–407. [Google Scholar]
- Cho, S.Y.; Park, C.G. MEMS based pedestrian navigation system. J. Navig. R. Inst. Navig 2006, 59, 135–153. [Google Scholar]
- Foxlin, E. Pedestrian tracking with shoe-mounted inertial sensors. IEEE Comput. Graph. Appl 2005, 25, 38–46. [Google Scholar]
- Sabatini, A.M. Estimating three-dimensional orientation of human body parts by inertial/magnetic sensing. Sensors 2011, 11, 1489–1525. [Google Scholar]
- Liu, Z.; Aduba, C.; Won, C.H. In-plane dead reckoning with knee and waist attached gyroscopes. Measurement 2011, 44, 1860–1868. [Google Scholar]
- Ayrulu-Erdem, B.; Barshan, B. Leg motion classification with artificial neural networks usingwavelet-based features of gyroscope signals. Sensors 2011, 11, 1721–1743. [Google Scholar]
- Luinge, H.J.; Veltink, P.H. Measuring orientation of human body segments using miniature gyroscopes and accelerometers. Med. Biol. Eng. Comput 2005, 43, 273–282. [Google Scholar]
- Terrier, P.; Schutz, Y. How useful is satellite positioning system (GPS) to track gait parameters? A review. In J. NeuroEngineering Rehabilit; 2005. [Google Scholar] [CrossRef]
- Faulkner, W.T.; Alwood, R.; Taylor, D.W.A.; Bohlin, J. GPS-denied pedestrian tracking in indoor environments using an imu and magnetic compass. Proceedings of the 2010 International Technical Meeting of the Institute of Navigation (ITM 2010), Washington, DC, USA, 25–27 January 2010; pp. 198–204.
- Li, D.; Landry, R.J.; Lavoie, O. Low-cost MEMS sensor-based attitude determination system by integration of magnetometers and GPS: A real-data test and performance evaluation. Proceedings of the 2008 IEEE/ION Position, Location and Navigation Symposium, Monterey, CA, USA, 5–8 May 2008; pp. 342–350.
- Ladetto, Q.; Merminod, B. Digital magnetic compass and gyroscope integration for pedestrian navigation. Proceedings of the 9th Saint Petersburg International Conference on Integrated Navigation Systems, St. Petersburg, Russia, 3–5 June 2002; p. 10.
- Garmin. Forerunner 310XT, 2012. Available online: http://garminforerunner310xts.com/forerunner-310xt/ (accessed on 18 February 2012).
- Zhou, H.Y.; Hu, H.S. A Survey—Human Movement Tracking and Stroke Rehabilitation; University of Essex: Essex, UK, 2004. [Google Scholar]
- Sato, T.; Nakamura, S.; Terabayashi, K.; Sugimoto, M.; Hashizume, H. Design and implementation of a robust and real-time ultrasonic motion-capture system. Proceedings of the 2011 International Conference on Indoor Positioning and Indoor Navigation (IPIN), Guimaraes, Portugal, 21–23 September 2011.
- Incorporated, P.T. High Performance Real-Time 3D motion Capture System for Professionals, Available online: http://www.ptiphoenix.com/ (accessed on 18 February 2012).
- Optotrak Certus Motion Capture System; Northern Digital Inc: Waterloo, Canada, 2012.
- Moeslund, T.B.; Granum, E. A survey of computer vision-based human motion capture. Comput. Vis. Image Underst 2001, 81, 231–268. [Google Scholar]
- Six-Axis (Gyro + Accelerometer) MEMS MotionTracking™ Devices; InvenSense: Sunnyvale, CA, USA, 2012.
- ADIS16375 Data Sheet (Rev. A); Analog Devices: San Jose, CA, USA, 2010.
- iNEMO: iNErtial Module V2 Demonstration Board Based on MEMS Sensors and the STM32F103RE; ST Microelectronics: Santa Clara, CA, USA, 2010.
- MTx—3DOF Orientation Tracker; NexGen Ergonomics Inc: Pointe Claire, Canada, 2010.
- Bancroft, J.B.; Lachapelle, G. Data fusion algorithms for multiple inertial measurement unit. Sensors 2011, 11, 6771–6798. [Google Scholar]
- Yuksel, Y.; El-Sheimy, N. An optimal sensor fusion method for skew-redundant inertial measurement units. J. Appl. Geod 2011, 5, 99–115. [Google Scholar]
- Susi, M.; Renaudin, V.; Lachapelle, G. Detection of quasi-static instants from handheld MEMS devices. Proceedings of the International Conference on Indoor Positioning and Indoor Navigation (IPIN), Guimaraes, Portugal, 21–23 September 2011.
- Bancroft, J.B.; Afzal, M.H.; Lachapelle, G. High performance GNSS augmented pedestrian navigation in signal degraded environments. Proceedings of the International Global Navigation Satellite Systems Society (IGNSS) Symposium 2011, Sydney, Australia, 15–17 November 2011; p. 14.
- Bancroft, J.B. Multiple Inertial Measurement Unit Integration for Pedestrian Navigation. Ph.D. Dissertation,. Department of Geomatics Engineering, The University of Calgary, Calgary, Canada, 2010. [Google Scholar]
- Afzal, H.; Renaudin, V.; Lachapelle, G. Use of earth’s magnetic field for mitigating gyroscope errors regardless of magnetic perturbation. Sensors 2011, 11, 11390–11414. [Google Scholar]
- Renaudin, V.; Afzal, H.; Lachapelle, G. Complete tri-axis magnetometer calibration in the magnetic domain. J. Sens. Hindawi 2010. [Google Scholar] [CrossRef]
- Waegli, A.; Skaloud, J. Optimization of two GPS/MEMS-IMU integration strategies with application to sports. GPS Solut 2009, 13, 315–326. [Google Scholar]
- Lachapelle, G.; Morrison, A.; Ong, R.; Cole, G. A high performance GNSS-based sensor for elite skier training. GPS World 2009, 20, 2–30. [Google Scholar]
- Waegli, A.; Guerrier, S.; Skaloud, J. Redundant MEMS-IMU integrated with GPS for performance assessment in sports. Proceedings of the IEEE Position Location and Navigation Symposium 2008, Monterey, CA, USA, 5–8 May 2008; pp. 1260–1268.
- Kwakkel, S.P. Human Lower Limb Kinematics Using GPS/INS. M.Sc. Thesis,. Department of Geomatics Engineering, University of Calgary, Calgary, Canada, 2008. [Google Scholar]
- Zhang, K.; Deakin, R.; Grenfell, R.; Li, Y.; Zhang, J.; Camerson, W.N.; Silcock, D.M. GNSS for sports—Sailing and rowing perspectives. J. Glob. Position. Syst 2004, 3, 280–289. [Google Scholar]
- Renaudin, V.; Afzal, H.; Lachapelle, G. New method for magnetometers based orientation estimation. Proceedings of the 2010 IEEE/ION Position Location and Navigation Symposium (PLANS), Palm Springs, CA, USA, 4–6 May 2010.


| Receiver | Application | Signals Supported | Update Rate |
|---|---|---|---|
| OEM628 | Survey, Machine Control, Timing, Real-Time Kinematic Positioning | L1/L2 GPS/GLONASS (L5 with firmware change) | 100 Hz |
| u-blox 6T | High Sensitivity, Timing | L1 GPS | 5 Hz |
| SiRF IV | High Sensitivity | L1 GPS | 1 Hz |
| Teseo II | High Sensitivity GNSS | L1 GPS/GLONASS | 1 Hz |
| Sensor | Sensor Application | Key Parameters | Update Rate |
|---|---|---|---|
| ADIS16375 | State of the art < $1,000 MEMS IMU | Gyros:
| 100 Hz |
| HMC5883L | Embedded compassing | 2 mg resolution 3 axis measurement | 100 Hz |
| BMP085 | Embedded altimeter | 3 Pa RMS noise | 25 Hz |
| Component | Voltage Rail Utilized (V) | Net Usage (W) |
|---|---|---|
| OEM6 − Digital + Antenna | 3.3 | 1.8 |
| File System | 3.3 | 0.33 |
| SiRF IV | 3.3 | 0.10 |
| u-blox 6T | 3.3 | 0.15 |
| Graphical LCD | 5.0 | 0.85 |
| Core Controller | 3.3 | 0.35 |
| Serial Port Replicators | 3.3 | 0.45 |
| Serial Level Shifters | 3.3 | 0.35 |
| Indicator LEDs | 3.3 | 0.2 |
| XBee Link | 3.3 | 1.0 |
| Adaptable Sensor Pod (Internal) | 5.0 | 1.0 |
| Adaptable Sensor Pod (External) | 5.0 | 1.0/unit |
| Total System Power | 7.58 W or 9.3 h | |
| Sensor | Approximate Data Rate | Maximum Observation Frequency (Hz) | |
|---|---|---|---|
| KB/s | MB/Hour | ||
| Novatel OEM6 | 60 | 211 | 100 |
| ASP (Int. or Ext.) | 6.0 | 21 | 100 |
| u-blox 6T | 4.5 | 16 | 5 |
| Sirf IV | 3.0 | 11 | 1 |
| Teseo II | 2.5 | 9 | 1 |
| XBee Link | 11 | 39 | N/A |
| 1 External Sensor | 6.0 | 21 | 100 |
| TOTAL | 93 | 328 | |
© 2012 by the authors; licensee MDPI, Basel, Switzerland This article is an open access article distributed under the terms and conditions of the Creative Commons Attribution license (http://creativecommons.org/licenses/by/3.0/).
Share and Cite
Morrison, A.; Renaudin, V.; Bancroft, J.B.; Lachapelle, G. Design and Testing of a Multi-Sensor Pedestrian Location and Navigation Platform. Sensors 2012, 12, 3720-3738. https://doi.org/10.3390/s120303720
Morrison A, Renaudin V, Bancroft JB, Lachapelle G. Design and Testing of a Multi-Sensor Pedestrian Location and Navigation Platform. Sensors. 2012; 12(3):3720-3738. https://doi.org/10.3390/s120303720
Chicago/Turabian StyleMorrison, Aiden, Valérie Renaudin, Jared B. Bancroft, and Gérard Lachapelle. 2012. "Design and Testing of a Multi-Sensor Pedestrian Location and Navigation Platform" Sensors 12, no. 3: 3720-3738. https://doi.org/10.3390/s120303720