Resonant Frequency Characteristics of a SAW Device Attached to Resonating Micropillars

Abstract
: Recently we reported experimental and simulation results on an increase in resonance frequency of a SAW resonator caused by mass loading of micropillars made of SU-8, attached normal to the surface of the resonator. We concluded that SAW resonator and the SU-8 micropillars in unison form a system of coupled resonators. We have now extended this work and performed a finite element method simulation to study the resonance frequency characteristics of the SAW-based coupled resonator. In this paper we report the effect of the resonance frequency of the micropillars on the resonance frequency of the system of coupled resonators, and observe the coupling of micropillar resonance and the propagating SAW as described in the well known Dybwad system of coupled resonators.1. Introduction
Surface acoustic wave (SAW) devices are widely used in sensor applications. The mass loading effect in SAW devices is one of the prime sensing principles in these types of sensors [1]. In our earlier work, we studied the mass loading effects of resonant structures such as high aspect ratio nanopillars attached to a SAW resonator and reported their application in designing highly sensitive SAW sensors [2,3]. More recently, we reported an increase in the resonance frequency of a SAW resonator caused by mass loading of SU-8 micropillars attached to the resonator [4]. We concluded that the SU-8 micropillars and the SAW resonator in unison form a coupled resonator system and for high values of contact stiffness the resonance frequency (f0) increases [4]. We have now extended our work on this SAW based coupled resonator to study the f0 of the system with pillars of different resonant frequency (fr) through finite element method (FEM) simulation. In this paper, we present the simulation results and discuss the coupled resonance between the SAW and the attached pillars with the help of Dybwad's explanation for systems of coupled resonators. Dybwad [5] was the first to report on coupled resonators consisting of gold particles of 10–50 μm diameter suspended on piezoelectric transducers and he observed an increase in resonance frequency of the resonator (ω0). Dybwad [5] concluded that the second resonator (gold particle) offers “inertial loading” to the quartz resonator when its resonance frequency is larger than the resonator's original resonance frequency ω0 and this results in a decrease in resonance frequency of the coupled resonator, while a weakly bonded particle offers “elastic loading” to the quartz resonator when the resonance frequency of the particles is smaller than ω0 and results in an increase in the resonance frequency of the coupled resonator [5,6]. The simulation methodology, observation on the resonance frequency shift caused by the SU-8 micropillar and discussions related to Dybwad's coupled resonance model are presented in the sections that follow.
2. Simulation Settings
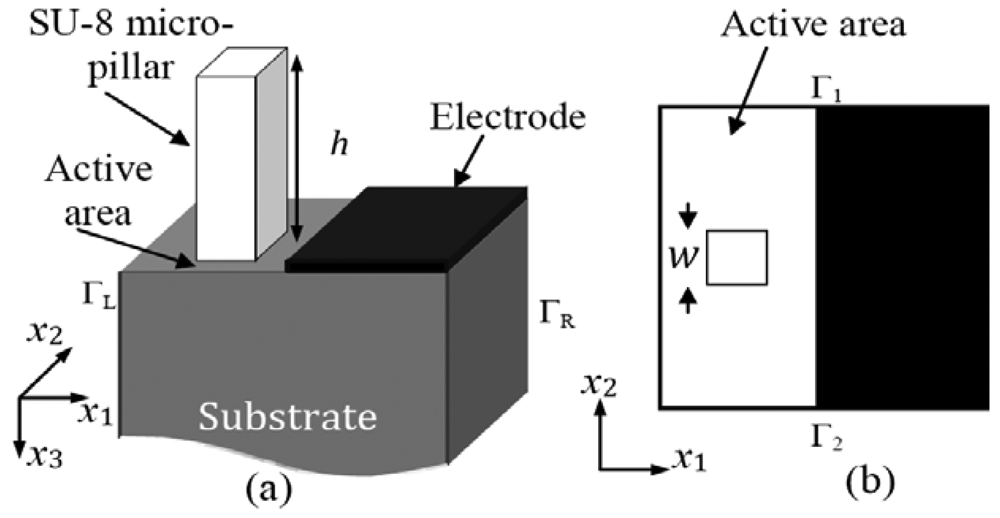
A one port SAW resonator consisting of a long interdigital transducer (IDT) with infinite number of fingers is considered for the simulation. The FEM model of piezoelectric material is explained in [7,8] and FEM simulations of SAW sensors are reported in [9–11]. The simulation of the SAW resonator is carried out using the piezoelectric module and SPOOLES solver of the commercial FEM software package COMSOL Multiphysics [8]. The substrate material and boundary conditions to model the SAW resonator are adapted from our earlier work [2–4]. By considering the periodic nature of the electrodes in an IDT, the SAW resonator is modeled as a segment of one pitch length (p) as shown in Figure 1 and the degrees of freedom (the displacement amplitude in all directions and voltage) of the right periodic boundary (ΓR) are set to be negative of those from the left periodic boundary (ΓL; see Figure 1). 3D simulations are performed with plane strain conditions and zero displacement constraint is provided along x2 direction to the boundaries Γ1 and Γ2. The bottom surface is fixed. The geometry of the segment (Figure 1) considered for the simulation is chosen to simulate a 39 MHz SAW resonator. Its dimensions are as follows: electrode width 21.5 μm, pitch (p) 43 μm, height of the substrate 430 μm, and thickness in x2 direction (aperture) 43 μm, leading to an active area of 21.5 μm × 21.5 μm. Triangular mesh is applied to the upper part of the substrate with minimum mesh size of 1 μm and rest of the SAW resonator is meshed with square mesh with dimension in the order of 4 μm. Initially eigen frequency analysis of the SAW resonator is performed and the resonance frequency without pillars (f0∣h = 0) of the SAW resonator is found to be 39.52702 MHz. Later a suitable resonant micropillar (in the shape of a square prism) made of SU-8 material of 8.6 μm × 8.6 μm cross-section is placed in the active area of the substrate (see Figure 1). Eigenfrequency analysis is performed for different values on height (h) of the micropillar varying from 0 to 50 μm and resonance frequency (f0) of the SAW resonator is recorded. SU-8 is a negative photoresist hard polymer. The SU-8 material properties such as Young's modulus of 4.02 GPa, density of 1,190 Kg/m3, and Poisson ratio of 0.22 are provided to the pillar in the simulation model. Further resonance frequency (fr) of the SU-8 micro pillar of different heights (h) is calculated from eigenfrequency analysis of the pillar alone. In the simulation model SU-8 has been chosen as a sample material for the micropillar to perform a general study on the resonance frequency characteristics of the SAW device attached with a resonant structure, however, it can be replaced with any suitable material of interest while designing a SAW based coupled resonator. It should be noted that we fabricated SU-8 micropillars on SAW resonators and studied their mass loading effect. We could observe coupled resonance phenomenon in the experiment and simulation results, and there was good agreement between them [2].
3. Results and Discussion
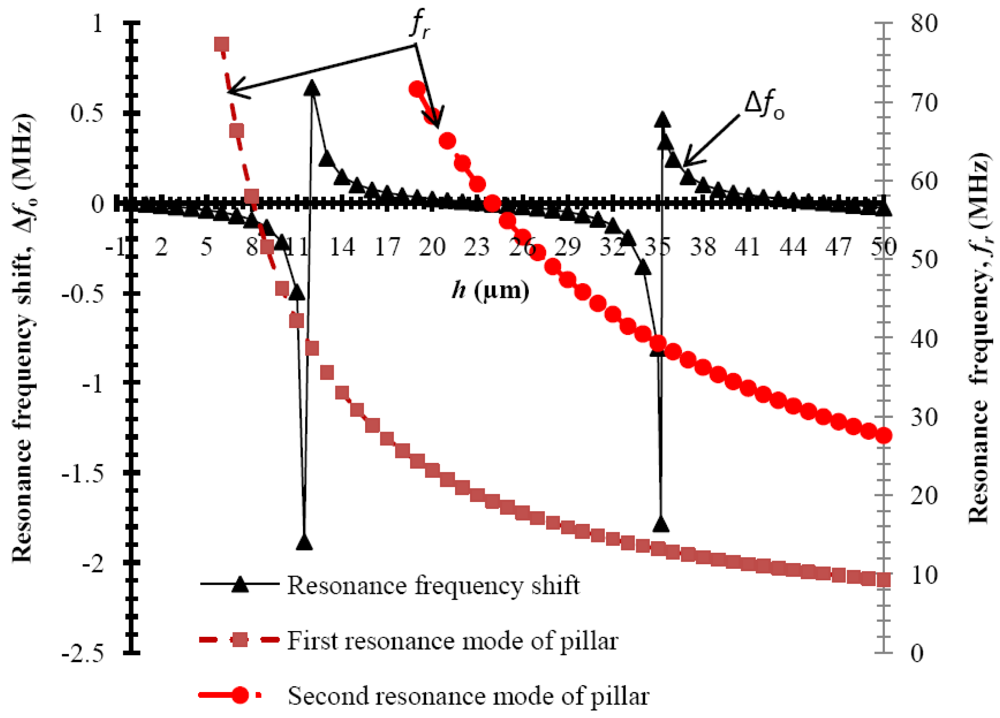
Figure 2 shows the plot of resonance frequency shift (Δf0) of the SAW resonator for an increase in mass loading caused by SU-8 pillars of dimensions 8.6 μm × 8.6 μm × h. The Δf0 is calculated by subtracting f0 from f0∣h = 0. It can be seen from the figure that as the pillar height is increased, the Δf0 decreases and reaches a minimum value of −1.8 MHz at h = 11.5 MHz, however for h = 12 μm and h = 36 μm Δfo increases, and reaches a value of 0.7 MHz and 0.5 MHz, respectively. As a whole, Δfo is positive (increase in f0 from f0∣h = 0) for heights 12 μm < h < 23.4 μm, and 35 μm < h < 47 μm and Δf0 is negative (decrease in f0 from f0∣h = 0) for heights 23. 4 μm < h < 35 μm, and for h > 47 μm. Figure 2 also includes the plot of resonance frequency (fr) of the pillar alone for different heights. The first two longitudinal vibration resonance modes of the micro pillar are shown. It can be seen that fr is between 10 MHz to 70 MHz for values of h ranging between 8 μm to 50 μm and 19 μm to 50 μm for the first and second resonance modes of the pillar respectively. Further comparing the fr and Δf0 curves in Figure 2, when the resonance frequency of the pillar (fr) is closer to f0∣h = 0 the pillar offers negligible mass loading to the SAW device and resonance frequency shift tends to zero and reaches a positive value. This is a similar situation as reported in our earlier work [2,3]. The frequency characteristics of the SAW resonator upon mass loading by SU-8 micro pillar can be explained as follows by the coupling between the resonances of SU-8 micropillar and propagating SAW as pointed out by Dbywad [5]. The SU-8 micropillars resonate at their own resonance frequency and their vibrations couple to the acoustic mode of the SAW resonator. The SAW resonator and the SU-8 micro pillar together form a system of coupled resonators. It can be noted from Figure 2 that when the resonance frequency of the pillar fr is greater than f0∣h = 0 (that is fr > f0∣h = 0), Δfo is negative and the pillars introduce inertial loading to the SAW resonator. When the resonance frequency of the pillar fr is less than f0∣ h = 0 (that is fr < f0∣h = 0), Δfo is positive and the pillars introduce elastic loading to the SAW resonator. Further to visualize the resonance mode of the pillar and their effect on substrate surface, total displacement of the SAW resonator substrate with pillar and surface stress(σx3) at the surface (x3 = 0, see Figure 1) of the substrate are recorded.
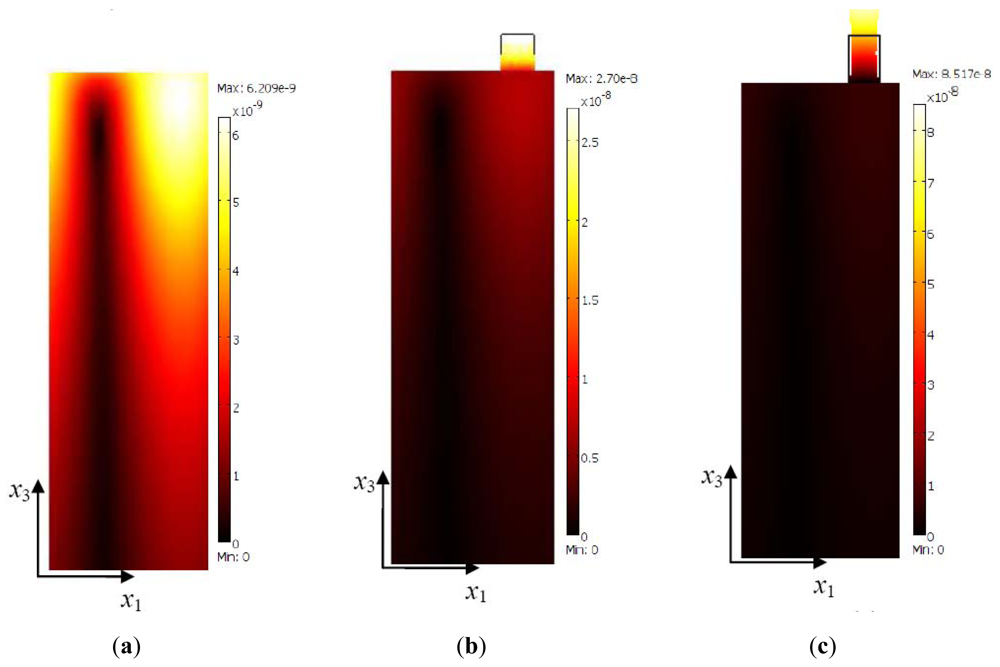
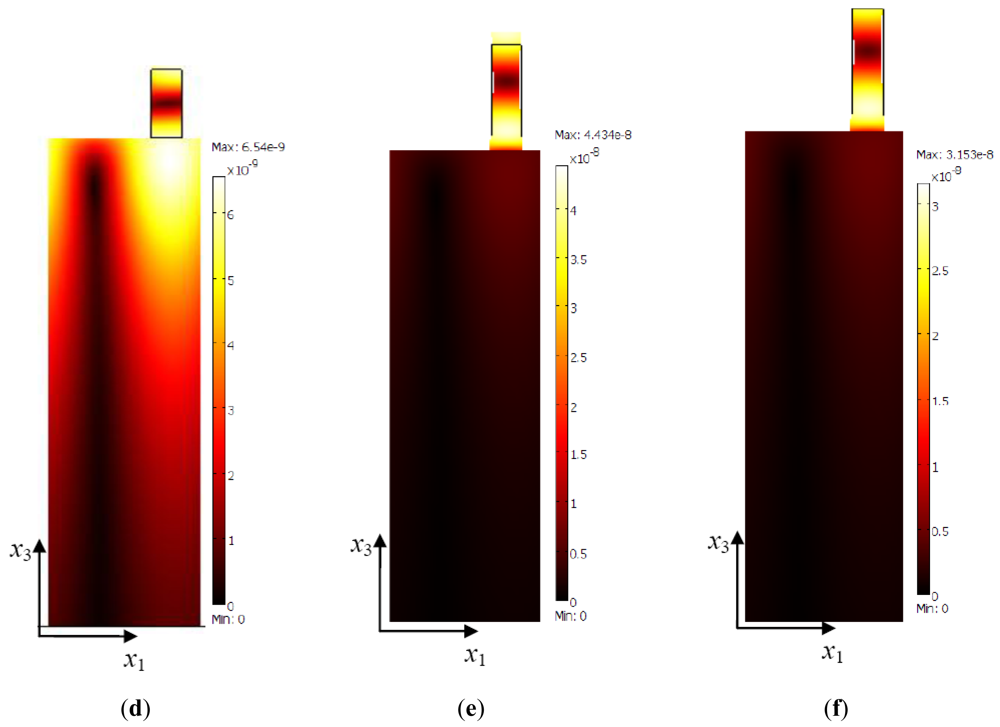
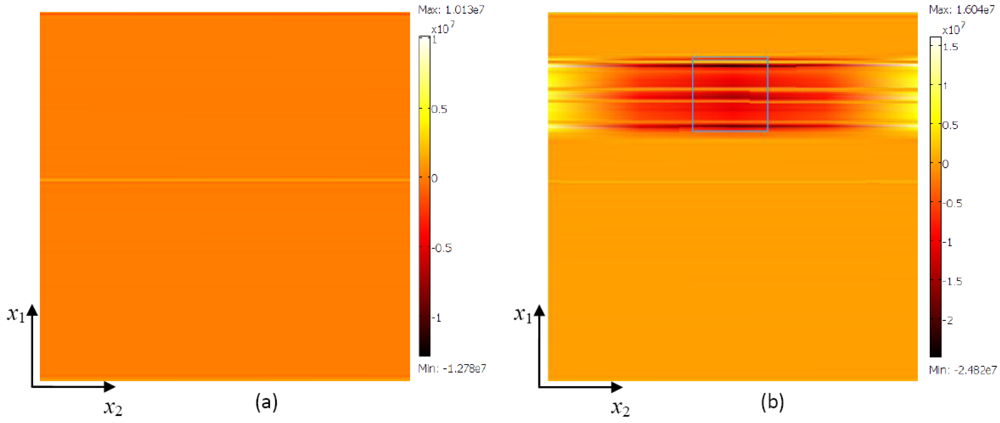
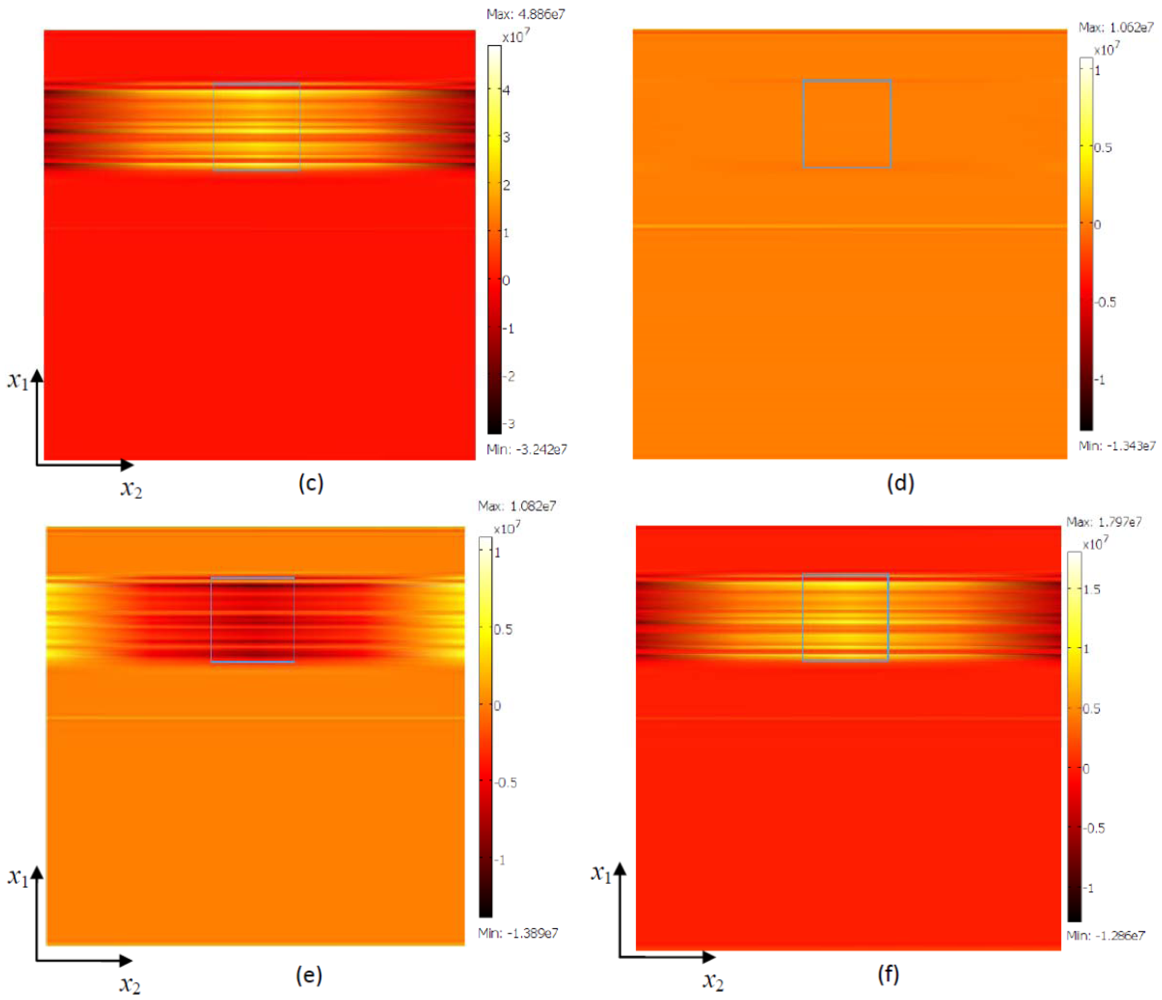
Total displacements of SAW is calculated by equation, , where u1, u2, and u3 are the particle displacement in x1, x2, and x3 directions (see Figure 1), respectively. Total displacement of SAW substrate with pillars and corresponding σx3 at surface x3 = 0 plane (see Figure 1) of a SAW resonator with pillars of typical heights h = 0 μm, 10 μm, 12 μm, 23 μm, 34 μm, and 36 μm are shown in Figure 3(a–f) and Figure 4 (a–f), respectively. Figure 3(b,c) shows the total displacement profiles of the pillars of resonance frequency in their first resonance mode and pillars offering inertial and elastic loading, respectively. Figure 3(d–f) shows the total displacement profile with typical heights of pillar of resonance frequency in their second resonance mode, where Figure 3(d,f) is a typical case of pillars offering elastic loading and Figure 3(e) is a typical case of pillars offering inertial loading to the SAW resonator. It can be seen from Figure 4, that the σx3 value at the pillar contact surface (the pillar footprint is indicated by a square geometry) is negative when the pillar offers inertial loading and positive when the pillar offers elastic loading. It should be noted that darker color indicates minimum stress value and lighter color indicates maximum stress value. For a typical case of inertial loading height of h = 10 μm, as seen from Figure 4(b) the surface stress profile is darker (reddish to reddish brown) within the pillar contact area and σx3 has a minimum value of −2.48 MPa, indicating a compressive stress at the pillar contact surface. On a contrary, for a typical case of elastic loading (h = 36 μm, Figure 4(f)) the stress profile is lighter (yellowish-whitish) within the square box area and σx3 value is at maximum of 1.79 MPa, indicating tensile stress at the pillar contact surface. It should be noted that the displacement profile of SAW resonator with SU-8 pillar of height h = 23 μm (Figure 3(d)) is more or less similar to the displacement profile obtained for a SAW resonator without a pillar (Figure 3(a)), further the σs profile for the case of SAW resonator without the pillar and SAW resonator with a pillar of h = 23 μm is almost similar and the value of σs is approximately zero. It can be seen also be seen from Figure 2 that Δf0 ∣h = 23μm is 16 Hz, which is a negligible resonance frequency shift. Thus one can conclude that at h = 23 μm the SU-8 micropillars offer almost zero mass loading to the SAW resonator.
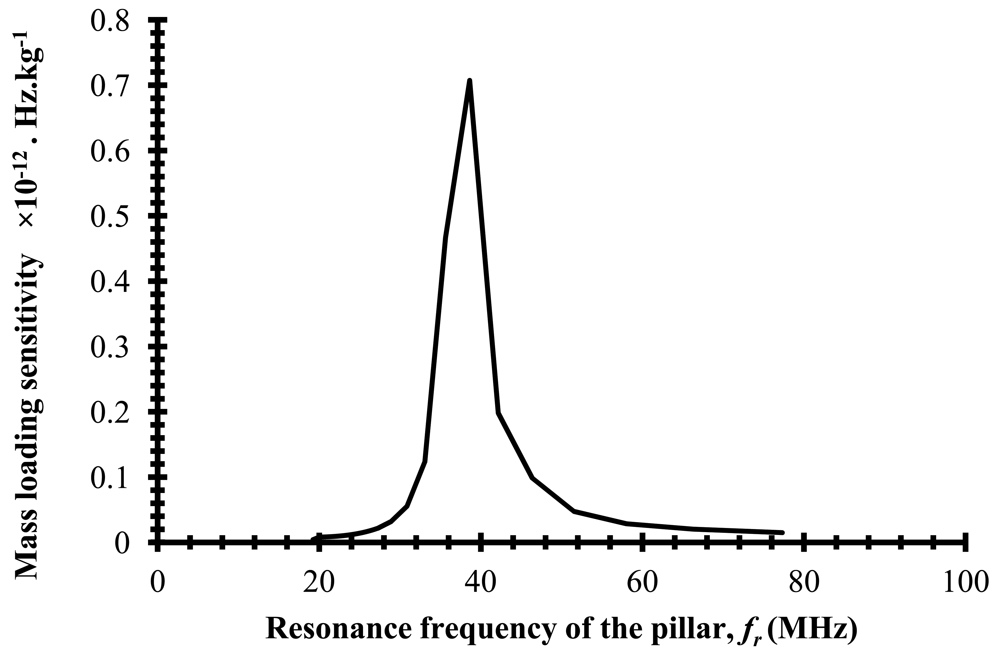
The present work will be of interest to sensor community readers in designing highly sensitve SAW sensors using resonant structures as sensing medium. In our earlier study we observed that the sensitivity with the resonant pillars is at least 10 times that obtained by using a thin film as the sensing medium [2,3]. Figure 5 shows the plot of mass loading sensitivity versus resonance frequency of the micropillar. Mass loading sensitivity is calculated as change in Δf0 per μm increase in h. It can be seen from Figure 5 that the maximum sensitivity is obtained when fr = 38.6 MHz, which is closer to f0∣h=0. Thus highly sensitive SAW sensors based on coupled resonance can be designed by choosing a sensing medium made of a resonant structure that has a resonance frequency close to the resonance frequency of the SAW resonator.
4. Conclusions
FEM simulation of a system of coupled resonators made of a SAW resonator and aspect ratio micropillars is performed and the resonance frequency characteristics of the coupled resonator are studied for different values of pillar resonance frequencies. The micropillars offer inertial loading to the SAW resonator when fr > f0∣h = 0 and elastic loading to the SAW resonator when fr < f0∣h = 0. The resonance frequency characteristics observed in the simulation were in agreement with Dybwad's coupled resonance model. The SU-8 pillars used in the study can be replaced with a suitable sensing medium of resonant structures and can be used in sensing applications.
Acknowledgments
The authors thank the Monash University Sunway Campus, PSCT research strength 2011–2012 fund, Monash University Sunway Campus internal seed grant E-15-12, and Indian Institute of Technology Guwahati, India for supporting and publishing the work. The authors also acknowledge Indian Nanoelectronics User Program for providing facilities to conduct the experiments related to research in SAW based coupled resonators.
References
- Gardner, J.W.; Varadan, V.K.; Awadelkarim, O.O. Microsensors MEMS and Smart Devices, 1st ed.; John Wiley & Sons: Chichester, West Sussex, UK, 2002; pp. 303–316. [Google Scholar]
- Ramkrishnan, N.; Nemade, H.B.; Palathinkal, R.P. Mass loading in coupled resonators consisting of SU-8 micropillars fabricated over SAW devices. IEEE Sens. J. 2011, 11, 430–431. [Google Scholar]
- Ramkrishnan, N.; Nemade, H.B.; Palathinkal, R.P. Mass loading effects of high aspect ratio structures grown over SAW resonators. Sens. Lett. 2010, 8, 253–257. [Google Scholar]
- Ramkrishnan, N.; Nemade, H.B.; Palathinkal, R.P. Finite element simulation of a surface acoustic wave hydrogen sensor with palladium nano-pillars as sensing medium. Sens. Lett. 2010, 8, 824–828. [Google Scholar]
- Dybwad, G.L. A sensitive new method for determination of adhesive bonding between a particle and a substrate. J. Appl. Phys. 1985, 58, 2789–2790. [Google Scholar]
- Pomorska, A.; Shchukin, D.; Hammond, R.; Cooper, M.A.; Grundmeier, G.; Johannsmann, D. Positive frequency shifts observed upon adsorbing micron-sized solid objects to a quartz crystal microbalance from the liquid phase. Anal. Chem. 2010, 82, 2237–2242. [Google Scholar]
- Lerch, R. Simulation of piezoelectric devices by two-and-three-dimensional finite elements. IEEE T Ultrason. Ferroelectr. 1990, 37, 233–247. [Google Scholar]
- COMSOL Multiphysics. Version 3.4 Documentation; COMSOL AB: Stockholm, Sweden, 2007. [Google Scholar]
- Powell, D.A.; Kalantar-zadeh, K.; Wlodarski, W. Numerical calculation of SAW sensitivity: Application to ZnO/LiTaO3 Transducers. Sens. Actuat. A 2004, 115, 456–461. [Google Scholar]
- Atashbar, M.Z.; Bazuin, B.J.; Simpeh, M.; Krishnamurthy, S. 3D FE simulation of H2 SAW gas sensor. Sens. Actuat. B 2005, 111-112, 213–218. [Google Scholar]
- Ippolito, S.J.; Kalantar-zadeh, K.; Powell, D.A.; Wlodarski, W. A 3-Dimensional finite element approach for simulating acoustic wave propagation in layered SAW devices. IEEE Symp. Ultrason. 2003, 1, 303–306. [Google Scholar]


© 2012 by the authors; licensee MDPI, Basel, Switzerland This article is an open access article distributed under the terms and conditions of the Creative Commons Attribution license (http://creativecommons.org/licenses/by/3.0/).
Share and Cite
Ramakrishnan, N.; Nemade, H.B.; Palathinkal, R.P. Resonant Frequency Characteristics of a SAW Device Attached to Resonating Micropillars. Sensors 2012, 12, 3789-3797. https://doi.org/10.3390/s120403789
Ramakrishnan N, Nemade HB, Palathinkal RP. Resonant Frequency Characteristics of a SAW Device Attached to Resonating Micropillars. Sensors. 2012; 12(4):3789-3797. https://doi.org/10.3390/s120403789
Chicago/Turabian StyleRamakrishnan, N., Harshal B. Nemade, and Roy Paily Palathinkal. 2012. "Resonant Frequency Characteristics of a SAW Device Attached to Resonating Micropillars" Sensors 12, no. 4: 3789-3797. https://doi.org/10.3390/s120403789