Redox Potential as a Means to Control the Treatment of Slurry to Lower H2S Emissions

Abstract
: Slurry can be oxidized to eliminate undesirable emissions, including malodorous hydrogen sulfide (H2S). However, it is difficult to assess the optimal amount of oxidizing agent required. In this study, one cow and one pig manure, each in three particle size ranges were oxidized with 0–350 mg ozone/L manure. Redox and H2S concentration were measured continuously. During ozonation the manures gave equivalent redox potential curves. A relatively rapid rise in redox potential was observed within a range of −275 mV to −10 mV, with all manures changing as a minimum from −200 mV to −80 mV. The gaseous H2S emissions were decreased by 99.5% during the redox increase (−200 mV to −80 mV). This is attributed to H2S oxidation by ozone and oxygen, and is not due to H2S deprotonation or gas flushing. By identifying the initiation of the final redox level following the rise, the amount of ozone required to remove H2S from the manure samples was estimated to be in the range of 6–24 mg O3/L manure, depending on the type of manure. Hence, continuous monitoring of redox potential (termination of the redox rise) during the oxidation treatment is a simple method of achieving cost-effective minimization of H2S emissions from slurry.
1. Introduction
Malodorous emissions from liquid wastes such as animal manure and wastewater are a nuisance to the nearby communities. Oxidation can be carried out to lower the odor emissions [1,2]. Hydrogen sulfide (H2S) is a major contributor to odor from slurry, e.g., during agitation and field application [3,4] and pig production facilities [5–7]. Additionally, H2S poses a health risk to animals and people. H2S can be converted to less volatile and odorous sulfur compounds by oxidation, and the emissions of H2S are therefore minimized [8–10].
To remove odor from animal manure, ozone has previously been added as an oxidizing agent [5,11,12]. Due to the high reactivity of ozone [13], it can be expected to be very effective for the H2S oxidation compared to other oxidizing agents. Ozone is also added for other reasons including antibacterial treatment and removal of other odorous compounds [11], hence ozone treatment is an appealing process for several reasons. A broad range of ozone doses has previously been applied; from 250 to 3,000 mg O3/L manure [1,8,11,12]. However, overdosing must be avoided for economic reasons and additionally for safety reasons. Little information on the optimal dose of oxidizing agent for obtaining the most cost-effective treatment is available, and it is not easy to assess. Hence, to enable more cost-effective treatments and concurrently guaranteeing abatement of malodourous H2S emissions, a sensor for process control is required.
Analytical methods used to observe the required ozone dose have included olfactometry, quantification of the emitted odorous compounds, quantification of precursors of odorous gases in the slurry, the predominant microbial population, and redox potential [1,9,14,15]. Of these, redox potential is the simplest measurement, performed with an electrode.
In effluents such as wastewater and animal manure [10,16], many components can be oxidized, including H2S, NH4+, carboxylic acids, phenols, and larger organic components. The different chemical components have different standard electrode potentials, different reaction rates and different reactions with the oxidizing agents. Hence, the components may be oxidized in a specific order, and this may result in an oxidation curve (amount of oxidizing agent vs. redox potential) consisting of different levels. The concentrations of the chemical components affect the amount of oxidizing agent required to obtain a specific redox potential. Previous studies have observed a cessation of H2S emissions: (i) between −100 mV and 0 mV in manure, (ii) between −100 mV and −50 mV in sediment, and (iii) at −208 mV in wastewater [9,17,18]. Thus, if the cessation of H2S emissions have a specific relationship with a quantifiable level of the oxidation curve, a redox electrode could be a suitable sensor for process control.
The aim of this study was therefore to explore: (i) the general oxidation curve (amount of oxidizing agent vs. redox potential), (ii) the amount of H2S emissions in relation to the oxidation level, (iii) the chemical reactions and (iv) the possibility of using redox measurement as a simple method for assessing the required amount of oxidizing agent. Six different batches of animal manure were oxidized with ozone and oxygen. The redox potential and the amount of H2S emissions were measured continuously.
2. Experimental Section
2.1. Manure Samples
One batch of sow manure and one batch of dairy cattle manure were collected from two commercial farms. To obtain three manure samples per animal type with different amounts of potentially ozone reactive compounds, two separation techniques were applied to both manures.
One part of each manure was separated on-site with a commercial farm-scale screw press (SB Engineering, Aalestrup, Denmark) using a 250 µm filter.
One part of the sow manure was separated in a commercial farm-scale unit (AL-2 Teknik, Hovborg, Denmark) using polymer flocculation and filtration. One part of the cattle manure was separated in 0.6-L batches in the laboratory using polymer flocculation and filtration. Cationic, high molecular weight, linear polyacrylamide was used in both treatments. The optimal polymer charge density and dosage were determined based on floc size, dewaterability, volume separation, liquid turbidity, and solid dry matter content [19]. For the sow and cattle manures, 0.45 mL of 50% Superfloc c-2260 emulsion (40 mol% charge density) and 1.7 mL of 50% Superfloc c-2240 (20 mol% charge density) emulsion (Cytec, NJ, USA) were used per liter of manure, respectively. The sow manure was sieved on a 250 µm roller belt filter, and pressure was applied using a drum roller. The cattle manure was sieved through a 200µm filter, and no pressure was applied.
Six samples were therefore obtained: one raw sow manure (s1), one screw-pressed liquid from the sow manure (s2), one flocculated liquid from the sow manure (s3), one raw cattle manure (c1), one screw-pressed liquid from the cattle manure (c2), and one flocculated liquid from the cattle manure (c3).
2.2. Oxidation Treatment
Vessels (5 L, Ø 170 mm) were filled with 2.5 L batches of manure, and the manure was continuously stirred. Two different stirring methods were used. Tests proved that they resulted in equal effects on redox potential and H2S emissions. The sow manure was stirred with an overhead stirrer (RZR 2041; Heidolph, Schwabach, Germany) and an impeller (BR 13; Heidolph) at 180 rpm. The cattle manure was stirred manually by spinning the gas inlet diffuser at ∼85 rpm.
An ozone-enriched oxygen stream was generated by passing pure oxygen through an electrical discharge ozone generator (Ozonia LAB2B; Degrémont Technologies–Triogen, East Kilbride, Scotland). The ozone generator was fed oxygen from a gas cylinder at a flow of 2 L/min at a pressure of 1.5 bar. The generator was set to its maximum output level, resulting in a gas containing 1.5–2.2% O3 and 97.8–98.5% O2. The ozone concentration was measured before each experiment with an ozone analyzer (UV-100; Eco Sensors, Fresno, CA, USA), using pre-dilution in order to be within the analytical range. The ozone-enriched oxygen stream was led through Teflon tubes, and injected at the bottom of the manure-filled vessel through a stainless steel solvent filter (A-230A; Upchurch Scientific, Oak Harbor, WA, USA, pore size 20 µm) used as a diffuser for dispersion of the added gas. The O2/O3 mixture was added continuously at a constant rate, for the various experiments at 0.075–0.18 L/min. Depending on outlet ozone concentration measured before each experiment, the addition rate was 2.5–5.5 mg O3/min. The maximum ozone addition was 350 mg O3/L manure and 17,000 mg O2/L manure. To apply different ozone doses, the treatment time of the 2.5-L sample was varied between 10 and 160 min. The ozone was fully dissolved and consumed in the manure for all treatments. This was ensured through continuous measurement of the ozone level above the surface of the manure.
Additionally, two control treatments were performed on another pig manure by adding N2 and O2. For the N2 treatment, pure nitrogen was added at 0.06 L/min for 80 min, and for the O2 treatment pure oxygen was added at 0.07 L/min.
2.3. Chemical Analyses
The analyses performed on the non-ozonated manure samples were: pH, particle sizes, total dry matter, total chemical oxygen demand (COD), volatile fatty acids, total NH3/NH4+ concentration and total H2S/HS−/S2- concentration. Particle size range was analyzed using laser diffraction (Master Sizer 2000; Malvern Instruments Ltd, Worcestershire, UK). pH was measured using a pH electrode (InPro450IVP/PT100 SG; Mettler-Toledo, Zurich, Switzerland). Total dry matter was determined gravimetrically as the weight loss upon heating the sample to 105 °C (APHA, 1992). The total COD concentration was determined by performing destruction, color reaction, and spectrometric quantification using the Spectroquant Kit 114555 (Merck KGaA, Darmstadt, Germany). The total NH3/NH4+ concentration were measured by performing color reaction and spectrometric quantification using the Spectroquant Kit 100683 (Merck KGaA). The volatile fatty acids, including butanoic acid, were measured on a gas chromatograph [20] The total H2S/HS−/S2− concentration was measured by precipitating with zinc, capture of the H2S gas, color reaction and spectrometric quantification using the method described by Eriksen et al. [21].
The continuous analyses performed during treatment were: manure pH, manure redox, gaseous H2S concentration, and gaseous ozone concentration. The pH and redox electrodes were submerged 5 cm below the surface of the stirred manure. To measure the pH and redox of the manure continuously, the pH electrode and an oxidation reduction potential (ORP) electrode (Pt4805-DXK-S8/120; Mettler-Toledo/Thornton, Switzerland) was used. The inlet tubes for the gaseous ozone and H2S concentration analyses were placed 10cm above the manure surface and 10 cm below the vessel top. Ozone and H2S emissions were measured continuously using the ozone analyzer and a gold film detector (Jerome 631x; Arizone Instruments LLC, Chandler, AZ, USA), respectively. The detection limits of the apparatus used for the H2S emissions analyses were >0.001 ppm and <45 ppm. When lower and higher levels were detected, the values of 0.001 ppm and 45 ppm, respectively, were logged.
2.4. Data Analysis
In total, 29 experiments with additions of ozone enriched oxygen were performed. The number of treatment replicates for the individual manure samples s1, s2, s3, c1, c2, and c3 were 5, 4, 4, 6, 6, and 4, respectively. Measurement of H2S was performed on 25 treatments. The number of treatment replicates for the individual manure samples s1, s2, s3, c1, c2, and c3 were 4, 4, 4, 5, 5, and 3, respectively.
Mean curves of “ozone amount versus redox potential” and “redox potential versus gaseous H2S concentration” were plotted using a moving average trendline with the number of points being equal to the number of replicates.
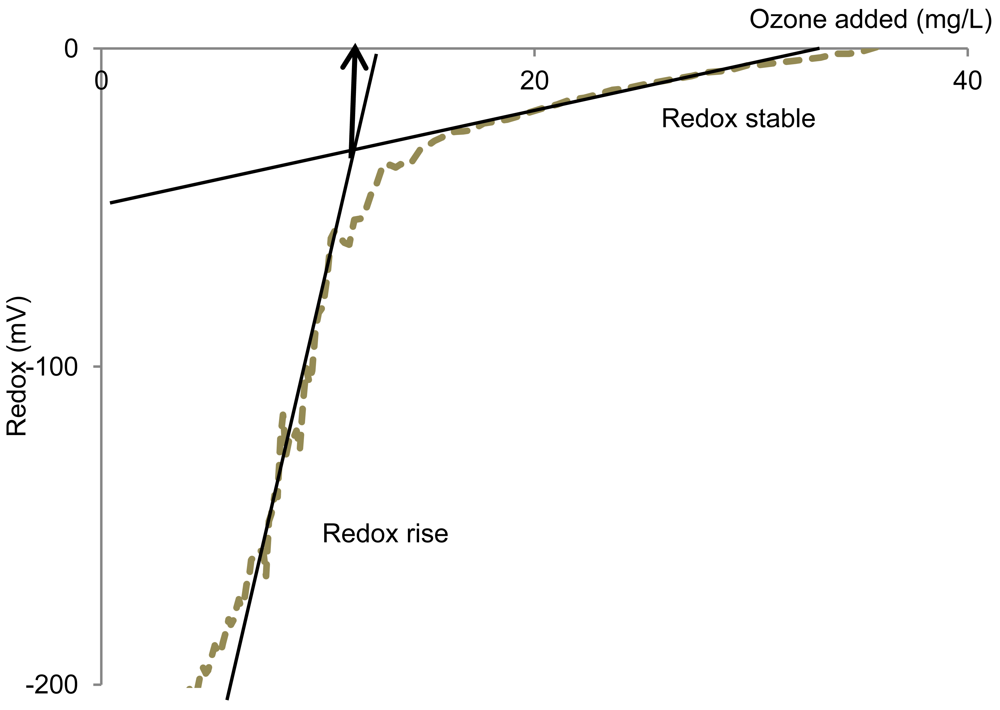
The amount of ozone required to minimize H2S emissions was calculated as the intercept of the linear regression for two of the observed redox phases: the redox rise and the final stable redox phase (Figure 1). The ozone amounts were compared by applying Student's t-test (2-sided, α = 0.05).
3. Results and Discussion
3.1. Oxidation Levels
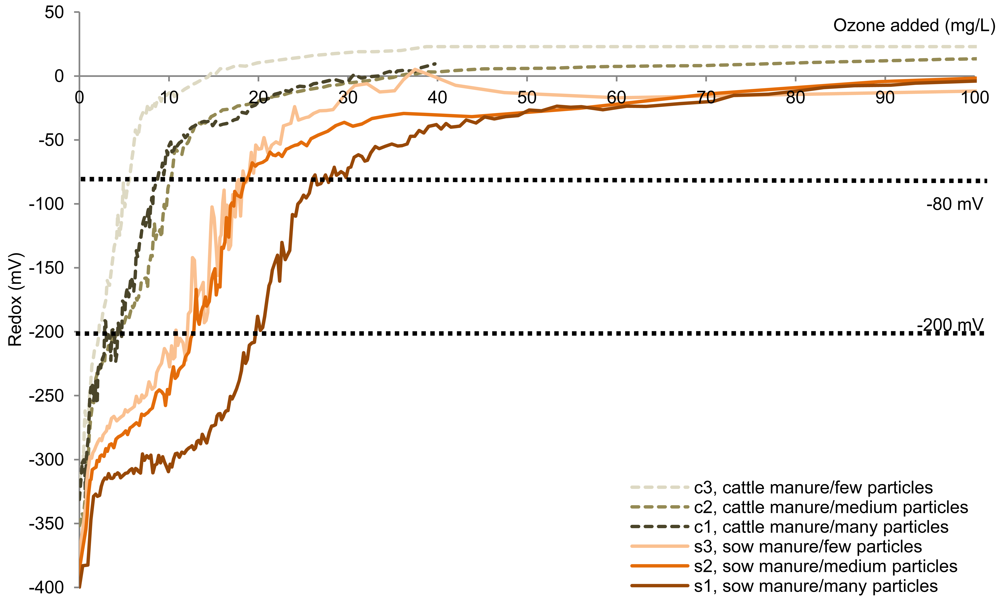
Six animal slurry batches in three particle size ranges (Table 1) were oxidized using ozone enriched oxygen in order to remove malodorous H2S emissions. The two full slurries (s1 and c1) were different in the composition. Separation caused the particle ranges to change, as did also the content of particulate compounds. The content of soluble compounds such as H2S/HS− were also affected, as these can be adsorbed to the negative particles, acting as particle counterions, adsorbed to their cationic polymer or dissolved in the water retained in the solid fraction. Hence, the batches contained different amounts of potentially ozone reactive compounds. Despite the differences between the batches, the oxidation profiles exhibited similar rises in redox potential (Figure 2).
A relatively rapid rise in redox potential was observed approximately from −275 mV to −10 mV (Figure 2). Although the specific redox potential profiles varied, all exhibited as a minimum a rapid rise from −200 mV to −80 mV. Hence, similar reactions occur in the manure samples. The amount of ozone enriched oxygen added during this rise differed between the six manure batches. The redox potential increase was followed by a phase with relatively constant redox potential, which was observed to continue until the experimental maximum additions, i.e., up to 350 mg O3/L manure.
3.2. Gaseous H2S Decrease
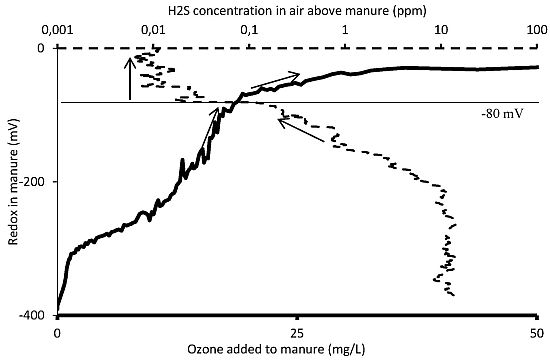
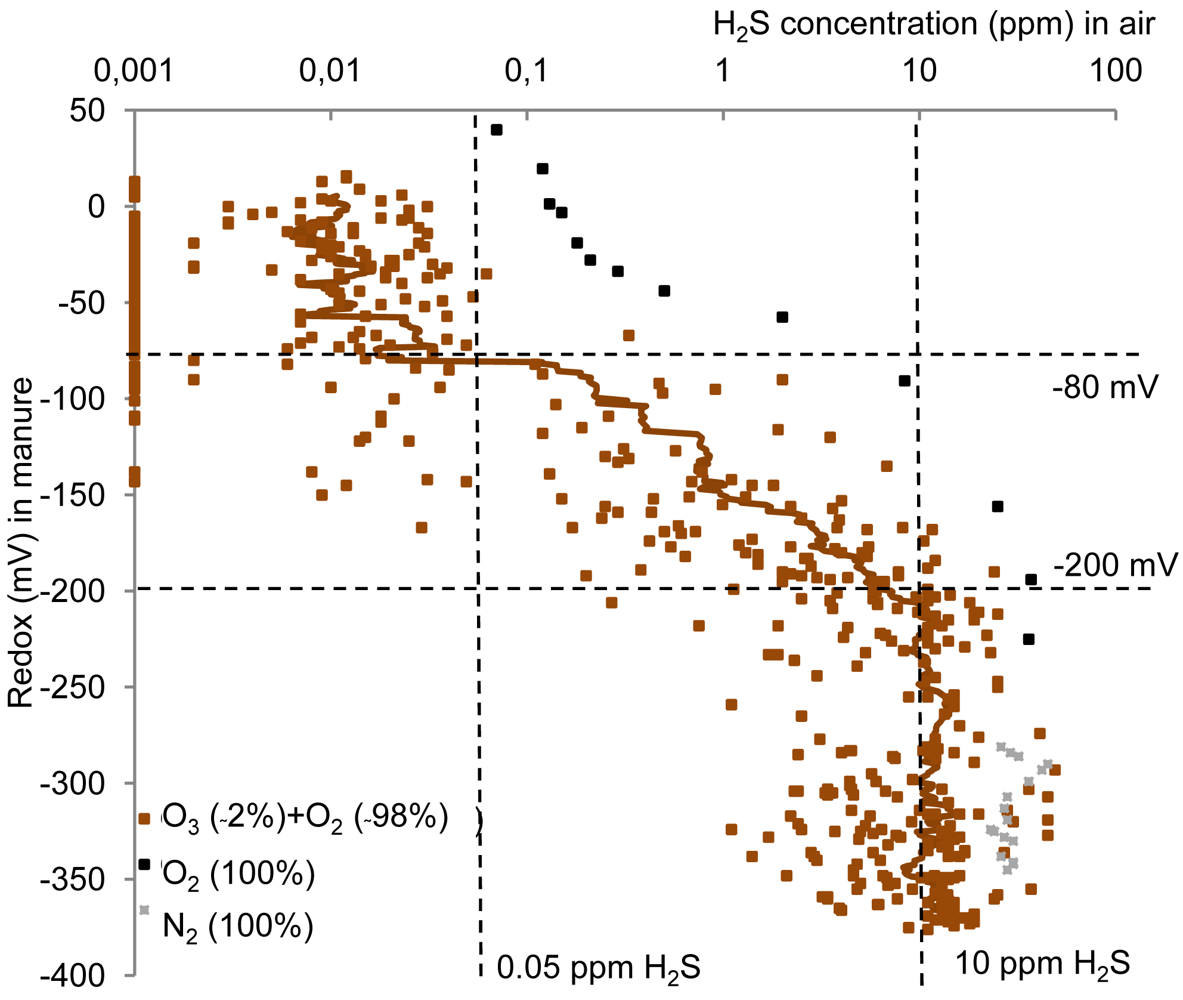
The gaseous concentration of H2S above the manure changed as a function of addition of the ozone enriched oxygen along with the change in redox potential (Figure 3). Reductions in concentration were also observed upon addition of pure oxygen, whereas N2 addition did not cause reductions in the H2S emissions.
The measured H2S emissions upon the treatment with ozone enriched oxygen remained constant at approximately 10 ppm from −400 mV until −200 mV; however the measurements were limited by the upper detection limit of the analysis equipment of 45 ppm. The H2S concentration in general decreased from this level to <0.05 ppm at around −80 mV (Figure 3). This is equivalent to a decrease in H2S emissions of more than 99%.
Previous studies have indicated that the H2S emissions were depleted between −208 mV and 0 mV [9,17,18]. This is largely in agreement with the present findings of reductions in H2S emissions around −80 mV upon ozone addition.
The decrease in H2S emissions upon addition of ozone enriched oxygen (Figure 3) occurred simultaneously with the observed redox potential rise (Figure 2), which for all samples was observed from −200 mV to −80 mV. The ozone amount that had been added when this change took place differed between the six manure samples. For all samples, however, the amount of ozone needed for reducing gaseous H2S concentration (corresponding to a rise in redox potential from −200 mV to −80 mV) was low compared with the total amount of ozone added when the minimum H2S emissions were obtained (25–65%).
3.3. H2S Reactions
The observed decrease in the gaseous concentration of H2S above the manure is ascribed to removal of H2S in the manure. This could be through oxidation by ozone, but it may also occur by oxidation by molecular oxygen, microbial oxidation, acid-base reaction and volatilization during gas addition.
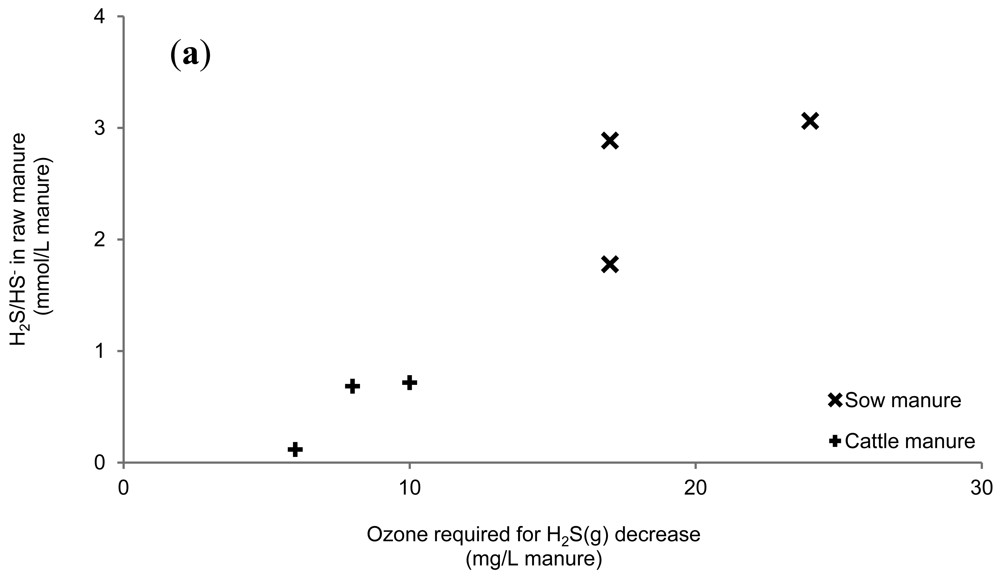
The total ozone requirement for minimizing the H2S emissions (Figure 4) increased as the total H2S/HS− concentrations in the non-ozonated manure (Table 1) was increased (R2 = 0.89) (Figure 5(a)). Hence, ozone's initial reaction may be a reaction with reduced dissolved sulphur.
The very initial reactivity of ozone towards H2S and HS− compared to the reactivity towards other dissolved species can be assessed based on existing kinetic data from the literature [13,22]. The time for reduction of the ozone concentration to 1/e (Eulers number) times the initial concentration, i.e., the lifetime of ozone τO3, with respect to dissolved species, can be estimated if the initial concentration of the dissolved species is known:
The calculated lifetimes are only approximations of the very initial reactivity, i.e., until the reactions leads to reductions in concentrations of the species reactive towards O3. Despite this, it is however possible to assess the relative importance of various compounds for consumption of ozone.
The calculated initial ozone lifetime with respect to manure relevant species are the lowest for HS− (Table 2). This supports the observed increase in the total ozone requirement at increasing H2S/HS− concentration in the non-ozonated manures (Figure 5(a)). Consequently, it is assessed that only when the concentration of H2S/HS− is lowered several orders of magnitude will ozone be available for degradation of other compounds. Non-dissociated phenols are, despite the low concentration, the largest competitor with HS− for reaction with ozone, which in particular would be the case if the pH was higher. The calculated ozone lifetimes, however, indicate that it is very likely, that the added ozone oxidizes HS− in the manure.
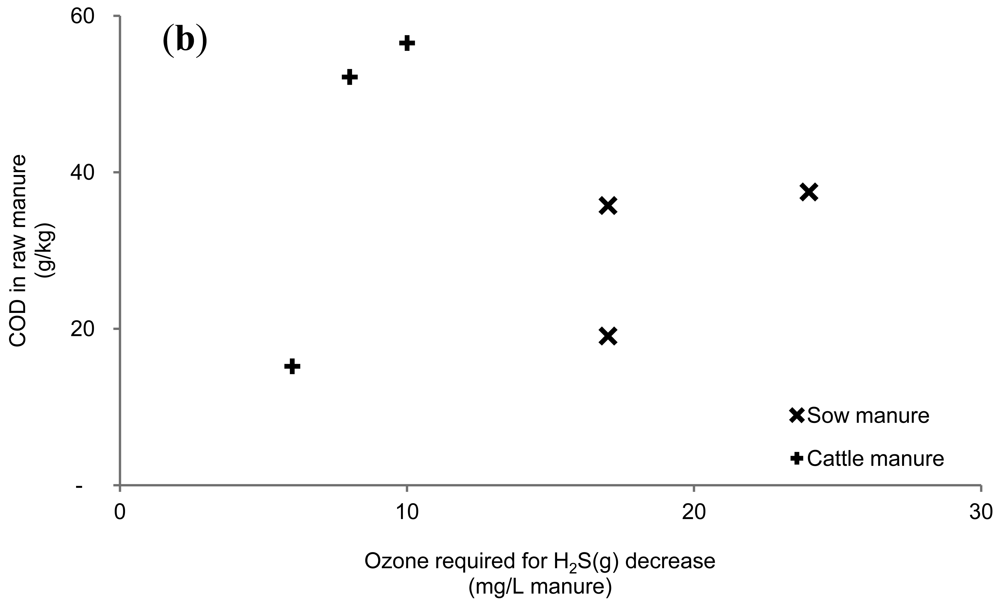
The calculated lifetime of ozone upon reaction with carboxylic acids, 4-methylphenol, other phenols and anions of phenols are high compared to the lifetime upon reaction with HS– (Table 2). Hence, the main ozone consumption is not indicated to be caused by dissolved organic compounds. No relationship between ozone requirement and dry matter content or total chemical oxygen demand (COD) was observed (Figure 5(a), Table 1, Figure 4). Neither were dry matter and total COD entirely responsible for the ozone requirements within the manure types. This is in agreement with previous studies, in which only weak correlations were found between dry matter content and the oxidation level [23,24] and corroborates that ozone predominantly is consumed by H2S/HS− as long as it is present.
If ozonation was the only reaction responsible for the H2S removal and if competing ozone reactions are assumed to be insignificant, the initial amount of the reduced sulphide (Table 1) should approximately be equal to the amount of ozone required to minimize H2S emissions (Figure 4). The molar ratio of ozone required for H2S elimination relative to the initial amount of total reduced sulphide were calculated to be in the range of 0.1 to 1.1 for the six batches of manures. Assuming a 1:1 stoichiometry of the reaction and no secondary reactions of importance, only in one batch (c3; molar ratio = 1.1) is the amount of ozone added sufficient to explain the removal of the reduced sulphide. Hence, the reduced sulphide is also removed by other mechanisms than ozonation.
Chemical or microbial oxidation by co-added oxygen (the ozone-enriched oxygen stream contained 1.5–2.2% O3 and 97.8–98.5% O2) may cause the additional decrease in the H2S emissions [25–28]. Based on a previous study [28] it is estimated that <3% of the added O2 is consumed by the slurry. Oxygen oxidation is observed in the control experiment in this study upon addition of pure oxygen (Figure 3). However, reaching the low H2S emission level required 0.2–0.7 L gas per L manure upon addition of the O3 and O2 gas, while it required approximately 1.4 L gas per L manure upon addition of pure O2. That is the approximately 2% O3 in the added gas causes the reaction rate per gas volume to increase 2–7 times. Hence, chemical or biological oxidation by O2 also contributes to reducing H2S concentration, but the reaction rate with O2 is much lower than O3.
The total experimental treatment time was 10 to 160 min. The significant decrease of 99.5% in gaseous H2S concentration, however, occurred within 3–6 min. The short experimental duration and the peak in the removal rate are atypical for microbial oxidations. Hence, microbial oxidation is not likely to have caused the decrease in gaseous H2S concentration. Hence, the observed oxidation by O2 were due to chemical oxidation.
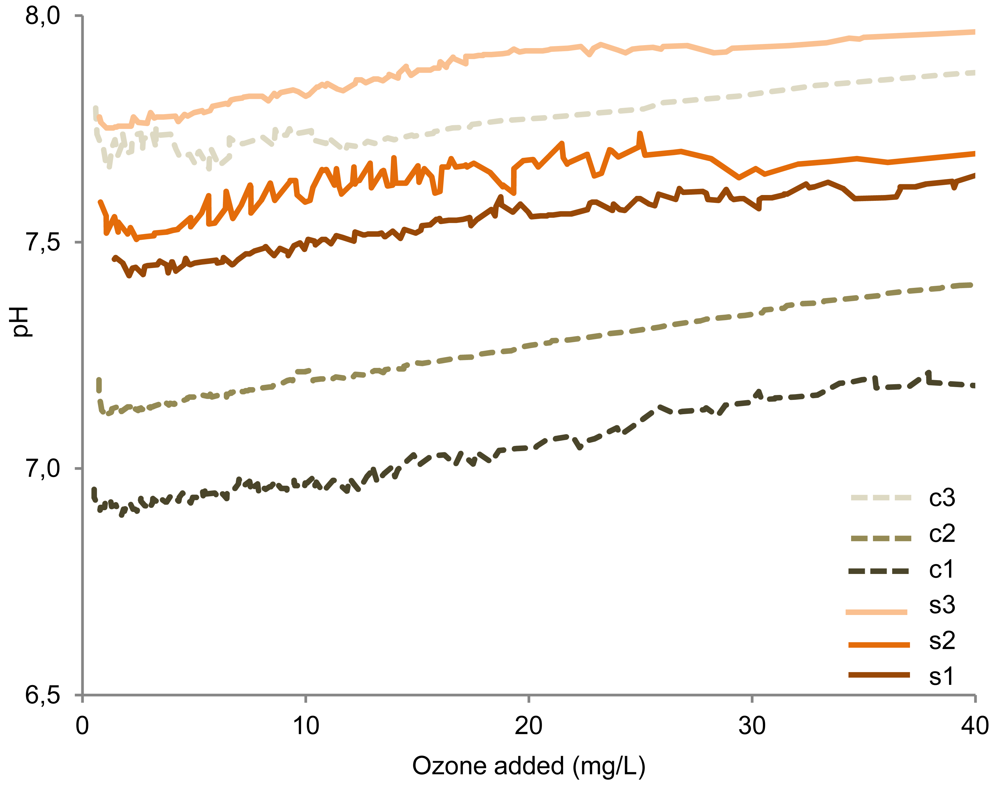
An increase in pH and hence a decrease of dissolved H2S relative to HS– would also lead to lower gaseous emissions of H2S. A continuous pH increase, due to the emission of e.g., H2S and CO2, was in fact observed during addition of the ozone enriched oxygen (Figure 6), with the average pH increase being 1 pH unit per 230 mg O3 added per L manure. However, the pH increase observed simultaneously with the decrease in the H2S emissions (–200 mV to −80 mV) was only 0.01–0.05 pH units. Based on calculations of the H2S/HS–/S2– distribution from pKa-values and observed pH, it is estimated that the pH increase could only result in a reduction of the emissions by ∼0–7%. Hence, the pH increase cannot account for the observed decrease of the H2S emissions.
Volatilization of the H2S when adding gas (flushing) could cause the additional decrease in the gaseous concentration of H2S above the manure. This is observed not to be the case, as the control treatment with N2 addition did not change the H2S emission (Figure 3). This can also be estimated from the volume of added O2 gas, the Henry's law constant, pKa of H2S and pH. In all cases, the relative amount of total reduced sulphide removed by gas flushing is estimated to be <5%. Hence, the flushing cannot account for additional removal of H2S.
In conclusion, it is ozone and oxygen as oxidizing agents that causes the minimization of H2S emissions. This is well aligned with the observed correlation between increase in redox potential and decrease in H2S emissions.
3.4. Assessment of Required Dose of Oxidizing Agent
It has previously been difficult to accurately calculate the exact amount of oxidizing agent required to minimize H2S emissions from manures [1,9,14,15]. The present study indicates some useful methods for determining the optimal amount of oxidation agent needed.
The amount of ozone required for H2S removal was observed to correlate with the H2S/HS− content of the non-ozonated manure. Thus, as an alternative to monitoring the actual H2S emissions continuously, the H2S/HS− concentration of the raw slurry may be analyzed.
The decrease in H2S emissions was observed to occur simultaneously with a rise in redox potential from ‐200 mV to ‐80 mV (Figures 2 and 3). Hence, in batch oxidation operations, it should be possible to apply the redox potential at termination of the rapidly changing redox phase and initiation of the stable redox phase (approximately −10 mV) in order to adjust the dose of oxidizing agent. This can be calculated as the intercept of the linear regression for the two redox potential phases (Figure 1).
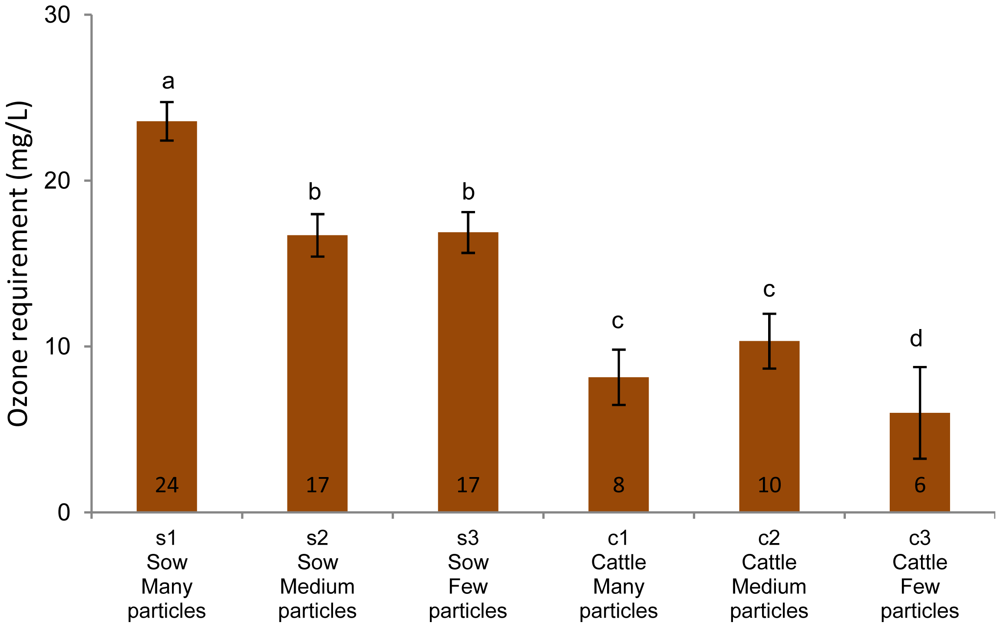
For the six manure batches in this study, the required amount of ozone is estimated to be 6–24 mg O3/L manure (Figure 4). In previous studies of manure, amounts of 250–3,000 mg O3/L have been added to eliminate emissions of odorous compounds by ozonation [1,8,11,12]. These studies focused on compounds other than H2S, but the present study demonstrates that if the main objective of oxidation is to eliminate H2S emissions instantaneously, much lower doses can be used when applied with proper process control.
Monitoring redox continuously to assess the appropriate dose of oxidizing agent has been demonstrated to be applicable to two manures in three particle size ranges (Table 1), which covered different manure characteristics: both cattle and pig manure, and both high and low dry matter contents, total COD contents, redox potentials, H2S/HS− concentrations, and H2S− to-HS− ratios, and different particle size ranges. Hence, the control method is robust with respect to different manure characteristics. It is therefore applicable independently of farm operation and the continuously varying manure characteristics. This indicates that similar relations may be expected in other media than manure, such as drinking water and wastewater [16,29]. However, it is possible that these media contains oxidizable compounds competing with H2S/HS− in terms of O3 and O2 reactivity, resulting in less distinct changes in redox. Analogous relations between redox potential and reduction in H2S emissions may also be expected with respect to oxidation using other oxidizing agents than ozone and oxygen, such as aeration, hydrogen peroxide treatment, permanganate treatment, Fenton's process, photo-oxidation, and anodic oxidation [2,10,24,30–32].
4. Conclusions
The oxidation curves (amount of oxidizing agent vs. redox potential) of the tested animal manures exhibited similar rises in redox potential upon addition of ozone enriched oxygen. A rapid increase in redox potential was observed at −200 mV to −80 mV. Simultaneously, the concentration of H2S above the manure decreased by 99.5%. The H2S removal was caused by ozone and oxygen oxidation.
Continuous redox potential measurement, i.e., termination of the rapid redox potential rise, has proved applicable for process control upon oxidation of manure. The application is robust with respect to different manure characteristics. It may also by applicable for other combinations of media and oxidizing agents. Hence, applying continuous monitoring of redox potential for process control of oxidation treatment is predicted to enable more cost-effective treatments and increased guarantee of malodourous H2S emissions abatement.
Acknowledgments
The work was financially supported by the Danish Strategic Research Council as part of the project ‘Cleanwaste’. It was also financially supported by the Ministry of Food, Agriculture and Fisheries as part of the Law of Innovation as part of the projects ‘Low emission cattle barns’ and ‘Ozone system for reduction of odor and retention of nitrogen in the manure’. The authors wish to thank Claudia Nagy for technical support.
References
- Wu, J.J.; Park, S.H.; Hengemuehle, S.M.; Yokoyama, M.T.; Person, H.L.; Gerrish, J.B.; Masten, S.J. The use of ozone to reduce the concentration of malodorous metabolites in swine manure slurry. J. Agr. Eng. Res. 1999, 72, 317–327. [Google Scholar]
- Domeno, C.; Rodriguez-Lafuente, A.; Martos, J.M.; Bilbao, R.; Nerin, C. VOC removal and deodorization of effluent gases from an industrial plant by photo-oxidation, chemical oxidation, and ozonization. Environ. Sci. Technol. 2010, 44, 2585–2591. [Google Scholar]
- Blanes-Vidal, V.; Hansen, M.N.; Adamsen, A.P.S.; Feilberg, A.; Petersen, S.O.; Jensen, B.B. Characterization of odor released during handling of swine slurry: Part I. Relationship between odorants and perceived odor concentrations. Atmos. Environ. 2009, 43, 2997–3005. [Google Scholar]
- Feilberg, A.; Nyord, T.; Hansen, M.N.; Lindholst, S. Chemical evaluation of odor reduction by soil injection of animal manure. J. Environ. Qual. 2011, 40, 1674–1682. [Google Scholar]
- Liu, D.; Feilberg, A.; Adamsen, A.P.; Jonassen, K.E.N. The effect of slurry treatment including ozonation on odorant reductions measured by in-situ PTR-MS. Atmos. Environ. 2011, 45, 3786–3793. [Google Scholar]
- Feilberg, F.; Liu, D.; Adamsen, A.P.S.; Hansen, M.J.; Jonassen, K.E.N. Odorant emissions from intensive pig production measured by online proton-transfer-reaction mass spectrometry. Eviron. Sci. Technol. 2010, 44, 5894–5900. [Google Scholar]
- Hansen, M.J.; Adamsen, A.P.S.; Pedersen, P.; Feilberg, A. Prediction of odor from pig production based on chemical odorants. J. Environ. Qual. 2012, 41, 436–443. [Google Scholar]
- Wu, J.J.; Park, S.H.; Hengemuehle, S.M.; Yokoyama, M.T.; Person, H.L.; Masten, S.J. The effect of storage and ozonation on the physical, chemical, and biological characteristics of swine manure slurries. Ozone Sci. Eng 1998, 20, 35–50. [Google Scholar]
- Beard, W.E.; Guenzi, W.D. Volatile sulfur-compounds from a redox-controlled cattle-manure slurry. J. Environ. Qual 1983, 12, 113–116. [Google Scholar]
- Xue, S.K.; Chen, S.L. Surface oxidation for reducing ammonia and hydrogen sulfide emissions from dairy manure storage. Transact. ASAE 1999, 42, 1401–1408. [Google Scholar]
- Watkins, B.D.; Hengemuehle, S.M.; Person, H.L.; Yokoyama, M.T.; Masten, S.J. Ozonation of swine manure wastes to control odors and reduce the concentrations of pathogens and toxic fermentation metabolites. Ozone Sci. Eng 1997, 19, 425–437. [Google Scholar]
- Wu, J.J.; Masten, S.J. Oxidation kinetics of phenolic and indolic compounds by ozone: Applications to synthetic and real swine manure slurry. Water Res 2002, 36, 1513–1526. [Google Scholar]
- Hoigne, J.; Bader, H. Rate constants of reactions of ozone with organic and inorganic-compounds in water. 2. Dissociating organic-compounds. Water Res 1983, 17, 185–194. [Google Scholar]
- Ndegwa, P.M.; Zhu, J.; Luo, A. Effects of bioreactor temperature and time on odor-related parameters in aerated swine manure slurries. Environ. Technol 2003, 24, 1007–1016. [Google Scholar]
- Parker, D.B. Reduction of odor and VOC emissions from a dairy Lagoon. Appl. Eng. Agr 2008, 24, 647–655. [Google Scholar]
- Ksibi, M. Chemical oxidation with hydrogen peroxide for domestic wastewater treatment. Chem. Eng. J 2006, 119, 161–165. [Google Scholar]
- Devai, I.; Delaune, R.D. Formation of volatile sulfur-compounds in salt-marsh sediment as influenced by soil redox condition. Org. Geochem 1995, 23, 283–287. [Google Scholar]
- Delgado, S.; Alvarez, M.; Rodriguez-Gomez, L.E.; Aguiar, E. H2S generation in a reclaimed urban wastewater pipe. Case study: Tenerife (Spain). Water Res 1999, 33, 539–547. [Google Scholar]
- Hjorth, M.; Christensen, M.L. Evaluation of methods to determine the flocculation optimum at manure separation. Transact. ASABE 2008, 51, 2093–2103. [Google Scholar]
- Moller, H.B.; Ward, A. Modeling volatile fatty acid concentration in livestock manure-based anaerobic digesters by simple titration. Environ. Eng. Sci 2011, 28, 507–513. [Google Scholar]
- Eriksen, J.; Adamsen, A.P.S.; Norgaard, J.V.; Poulsen, H.D.; Jensen, B.B.; Petersen, S.O. Emissions of sulfur-containing odorants, ammonia, and methane from pig slurry: Effects of dietary methionine and benzoic acid. J. Environ. Qual 2010, 39, 1097–1107. [Google Scholar]
- Hoigne, J.; Bader, H.; Haag, W.R.; Staehelin, J. Rate constants of reactions of ozone with organic and inorganic-compounds in Water. 3. Inorganic-compounds and radicals. Water Res 1985, 19, 993–1004. [Google Scholar]
- Zhu, J.; Zhang, Z.; Miller, C. Odor and aeration efficiency affected by solids in swine manure during post-aeration storage. Transact. ASABE 2008, 51, 293–300. [Google Scholar]
- Ndegwa, P.M. Solids separation coupled with batch-aeration treatment for odor control from liquid swine manure. J. Environ. Sci. Health B 2003, 38, 631–643. [Google Scholar]
- Gutierrez, O.; Mohanakrishnan, J.; Sharma, K.R.; Meyer, R.L.; Keller, J.; Yuan, Z.G. Evaluation of oxygen injection as a means of controlling sulfide production in a sewer system. Water Res 2008, 42, 4549–4561. [Google Scholar]
- Nielsen, A.H.; Vollertsen, J.; Hvitved-Jacobsen, T. Determination of kinetics and stoichiometry of chemical sulfide oxidation in wastewater of sewer networks. Environ. Sci. Technol 2003, 37, 3853–3858. [Google Scholar]
- Kuhl, M.; Jorgensen, B.B. Microsensor measurements of sulfate reduction and sulfide oxidation in compact microbial communities of aerobic biofilms. Appl. Environ. Microbiol 1992, 58, 1164–1174. [Google Scholar]
- Ottosen, L.D.M.; Poulsen, H.V.; Nielsen, D.A.; Finster, K.; Nielsen, L.P.; Revsbech, N.P. Observations on microbial activity in acidified pig slurry. Biosyst. Eng 2009, 102, 291–297. [Google Scholar]
- Peter, A.; von Gunten, U. Oxidation kinetics of selected taste and odor compounds during ozonation of drinking water. Environ. Sci. Technol 2007, 41, 626–631. [Google Scholar]
- Dietrich, A.M.; Hoehn, R.C.; Dufresne, L.C.; Buffin, L.W.; Rashash, D.M.C.; Parker, B.C. Oxidation of odorous and nonodorous algal metabolites by permanganate, chlorine, and chlorine dioxide. Water Sci. Technol 1995, 31, 223–228. [Google Scholar]
- Pillai, K.C.; Raju, T.; Chung, S.J.; Moon, I.S. Removal of H2S using a new Ce(IV) redox mediator by a mediated electrochemical oxidation process. J. Chem. Technol. Biotechnol. 2009, 84, 447–453. [Google Scholar]
- Uslu, M.O.; Balcioglu, I.A. Comparison of the ozonation and Fenton process performances for the treatment of antibiotic containing manure. Sci. Total Environ 2009, 407, 3450–3458. [Google Scholar]


| Manure ID | Animal origin | pH | Particle sizes [mm] | Dry matter [g/kg] | COD [g/kg] | H2S/HS− [mM] 1 |
|---|---|---|---|---|---|---|
| s1 | Sow | 7.4 | <5 | 58 (0) | 38 (1) | 3.1 (0.1) |
| s2 | Sow | 7.5 | <0.3 | 30 (0) | 36 (1) | 2.9 (0.1) |
| s3 | Sow | 7.7 | <0.2 | 19 (0) | 19 (1) | 1.8 (0.1) |
| c1 | Dairy cattle | 6.9 | <5 | 74 (0) | 52 (7) | 0.69 (0.03) |
| c2 | Dairy cattle | 7.1 | <0.06 | 49 (0) | 57 (1) | 0.72 (0.01) |
| c3 | Dairy cattle | 7.7 | <0.035 | 16 (0) | 15 (0) | 0.12 (0.01) |
1S2− are assumed absent, because pKa(HS−/S2)− is 13.8, and because the rate constant(HS−/S2−) is ∼10 times lower than expected for a diffusion controlled reaction.
| Compound | Rate constant 1 [M–1s–1] | pKa2 | Concentration3 [mM] | τO34 [s] |
|---|---|---|---|---|
| H2S | 3 × 10⁴ | 7.00 | 0.02–0.91 | 0.4–1.6 × 10⁻¹ |
| HS− | 3 × 10⁹ | 7.00 | 0.1–2.2 | 0.2–3.4 × 10⁻⁶ |
| NH3 | 2 × 101 | 9.25 | 0.7–5.3 | 0.9–6.9 × 101 |
| 4-methylphenol | 3 × 10⁴ | 10.2 | 1 | 3 × 10⁻² |
| 4-methylphenolate | ∼1 × 10⁹ | 10.2 | 0.0005 | 2.3 × 10⁻⁴ |
| Butanoate | <4 × 10⁻² | 4.8 | 1.5–9.8 | 0.3–1.6 × 10⁴ |
1Source: [13,22]. For 4-methylphenolate, the value for phenolate has been used;2pKa-values for corresponding acids are shown;3Concentration [X] range based on measured sum of acid and base concentration, the pKa value and the measured pH (Table 1) in the six batches. The presented 4-methylphenol and 4-methylphenolate concentrations were the maximum in [21];4Ozone's lifetime upon reaction with the compound is calculated with Equation (1).
© 2012 by the authors; licensee MDPI, Basel, Switzerland This article is an open access article distributed under the terms and conditions of the Creative Commons Attribution license (http://creativecommons.org/licenses/by/3.0/).
Share and Cite
Hjorth, M.; Pedersen, C.Ø.; Feilberg, A. Redox Potential as a Means to Control the Treatment of Slurry to Lower H2S Emissions. Sensors 2012, 12, 5349-5362. https://doi.org/10.3390/s120505349
Hjorth M, Pedersen CØ, Feilberg A. Redox Potential as a Means to Control the Treatment of Slurry to Lower H2S Emissions. Sensors. 2012; 12(5):5349-5362. https://doi.org/10.3390/s120505349
Chicago/Turabian StyleHjorth, Maibritt, Christina Ø. Pedersen, and Anders Feilberg. 2012. "Redox Potential as a Means to Control the Treatment of Slurry to Lower H2S Emissions" Sensors 12, no. 5: 5349-5362. https://doi.org/10.3390/s120505349