On Cup Anemometer Rotor Aerodynamics


Abstract
: The influence of anemometer rotor shape parameters, such as the cups' front area or their center rotation radius on the anemometer's performance was analyzed. This analysis was based on calibrations performed on two different anemometers (one based on magnet system output signal, and the other one based on an opto-electronic system output signal), tested with 21 different rotors. The results were compared to the ones resulting from classical analytical models. The results clearly showed a linear dependency of both calibration constants, the slope and the offset, on the cups' center rotation radius, the influence of the front area of the cups also being observed. The analytical model of Kondo et al. was proved to be accurate if it is based on precise data related to the aerodynamic behavior of a rotor's cup.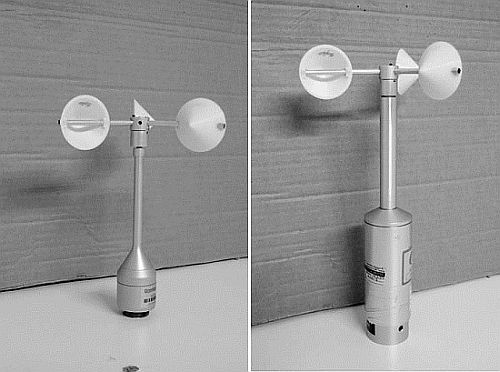
1. Introduction
Rotation anemometers, such as cup and propeller anemometers, are the most commonly used instruments for wind speed measurements. Thanks to their linearity and accuracy they are optimal for a large number of applications in the wind energy sector, from routine observations to field measurements. Cup anemometers have been widely studied since the first half of the twentieth century, with the early works devoted to studying the optimal number of cups and arm length [1,2]. Additionally, the cups' rotor aerodynamics and its behavior, especially in turbulent wind, was the subject of great interest throughout the twentieth century. Wyngaard [3] used a 2-cup model to illustrate the “overspeeding” effect of the anemometer, that is, the cup anemometer responds quicker to wind accelerations than to wind decelerations. Other interesting models were developed by Ramachandran [4] and Kondo et al. [5], to analyze the cups' rotor dynamics as a function of the aerodynamic drag of the cups. Both authors referred to the research by Brevoort and Joyner [6,7] for this cup aerodynamic drag.
In a previous study at the IDR/UPM Institute [8] large series of calibrations were analyzed, the calibration coefficients of the anemometers' transfer function being studied as a function of the anemometers' shape. The transfer function of an anemometer is represented by the following expression:
This research, performed on more than 20 models of commercial cup anemometers, showed a linear correlation between the coefficients Ar and the cups' center rotation radius (defined in Figure 1), Rrc, Ar = 0.012Rrc + 0.546 (Rrc expressed in mm). However, this linear fitting changed to Ar = 0.019Rrc + 0.196, with a better regression coefficient (R2 = 0.753 instead of R2 = 0.485, in the previous fitting) leaving aside some anemometers, those that have very different shape from the others, when calculating the linear fitting. Finally, a brief calculation using the 2-cup analytical method showed a very close result to the mentioned fitting, Ar = 20.7Rrc (Rrc expressed in meters). On the other hand, based on the analysis, B calibration coefficients of the studied anemometer models did not seem to correlate to the cups' center rotation radius, Rrc, nor to the cups' front area, Sc.
1.1. The 2-Cup Model
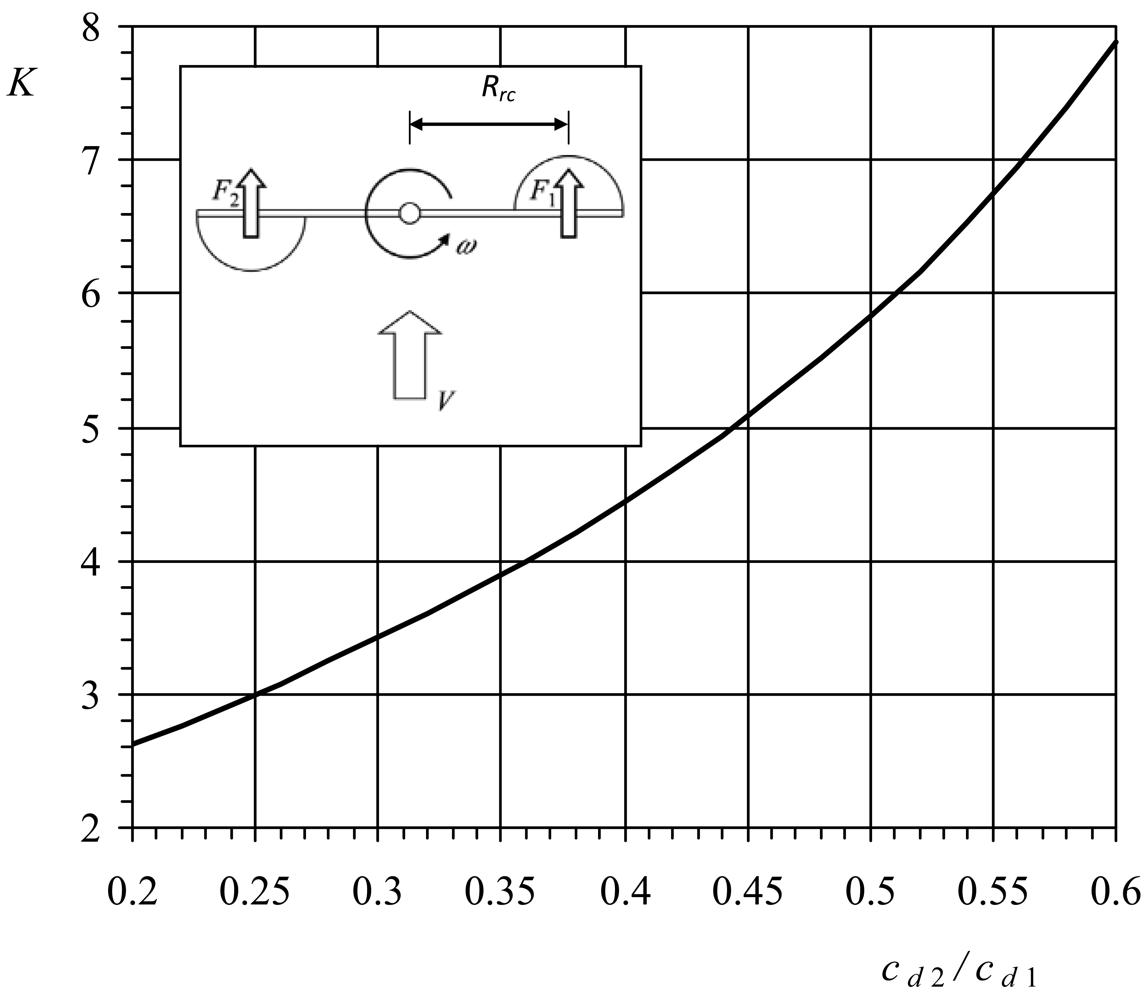
This simple model was used in the past to study the aerodynamics of the cup anemometers' rotor (see a sketch of the model in the Figure 1). This model is based on the perfect rotor equilibrium assumption, that is, the aerodynamic torque is neglected (see [1,3]). The response of a cup anemometer can be derived from the following expression [10]:
The ratio between the wind speed, V, and the rotation speed of the cups' center, ωRrc, is called the anemometer factor, K:
From an early study by Patterson, this factor was found to be between 2.5 and 3.5 [9]. Based on the data from [8], most common commercial anemometers have factors between 2.97 and 3.54 (calculated leaving aside the offset of the transfer function). In Figure 1, the K factor estimated with this 2-cup model is shown as a function of the ratio cd2/cd1.
1.2. The Ramachandran Model
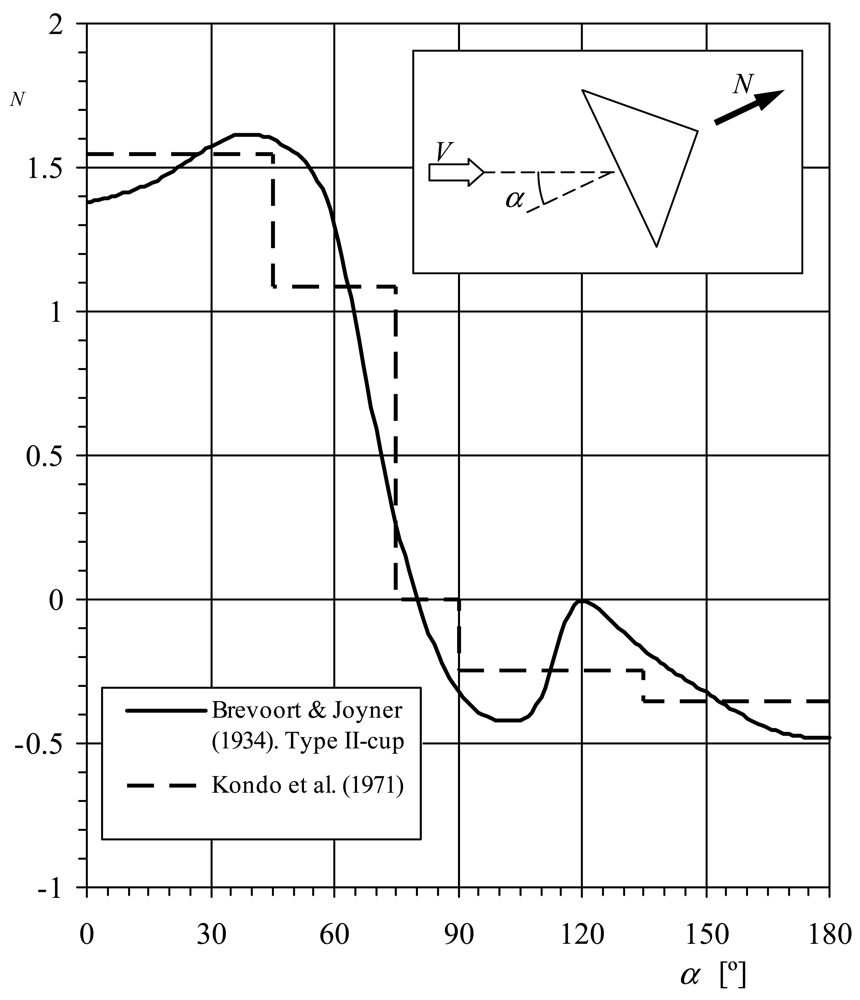
Ramachandran [4] derived the rotor's behavior from the normal aerodynamic force coefficient of a single cup, cN, (see in Figure 2, a sketch regarding the aerodynamic normal force on a cup in relation to the wind speed direction). Taking into account the three cups of a rotor, the Equation (3) can be rewritten as:
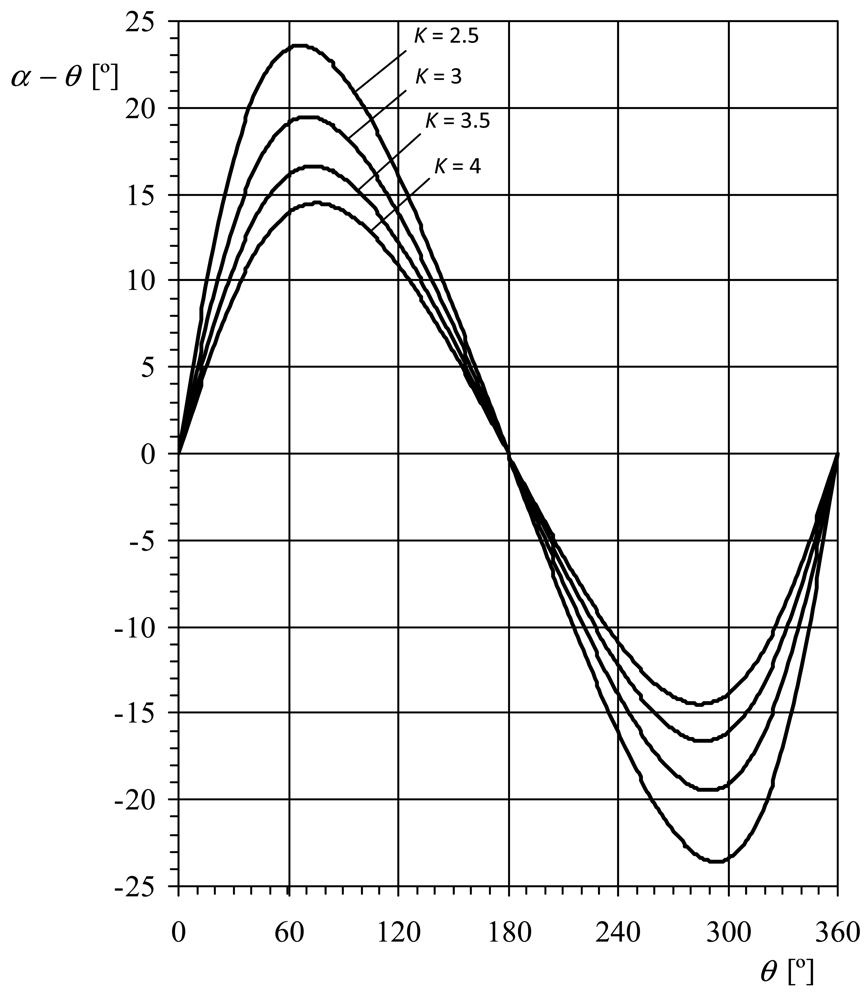
Ramachandran made two important assumptions in his calculations:
Taking into account the aforementioned ratios between the wind speed and the rotation speed (that is, the anemometer factor, K), it can be observed that Equation (12) does not deviate excessively from the exact Equation (8) (up to 8.3%, 5.7% and 4.2%, respectively for factors K = 2.5, 3 and 3.5). However, the second assumption, indicated with the Equation (13), involves more important deviations (up to 23.6°, 19.5° and 16.6° for the mentioned values of K, see Figure 3).
The anemometer's behavior in steady state can be obtained from Equation (7) by making its average value equal to zero in one turn, that is:
As mentioned, in order to calculate the last expression Ramachandran suggested the use of Brevoort and Joyner results [6,7]. These authors measured the normal aerodynamic force coefficient of anemometer cups, cN, as a function of the wind angle, α, for five cup shapes (named in the referred reports: Type I-hemispherical, without bead, 4.03 in diameter-, Type II-conical, without bead, 4.56 in diameter-, Type III-hemispherical, with bead, 2.03 in diameter-, Type IV-conical, with bead, 4.70 in diameter-, and Type V-hemispherical, without bead, 6.00 in diameter-). In Figure 2, the normal force coefficient, cN, related to the Type II cup, is shown as a function of the wind direction with respect to the cup, α. Solving Equations (14) and (15) with this normal force coefficient distribution, the anemometer's factor becomes K = 2.64, and the calibration coefficient Ar = 16.6Rrc (Rrc expressed in meters). This value of the calibration coefficient is lower than the one resulting from the previous research (Ar = 19·Rrc) [8].
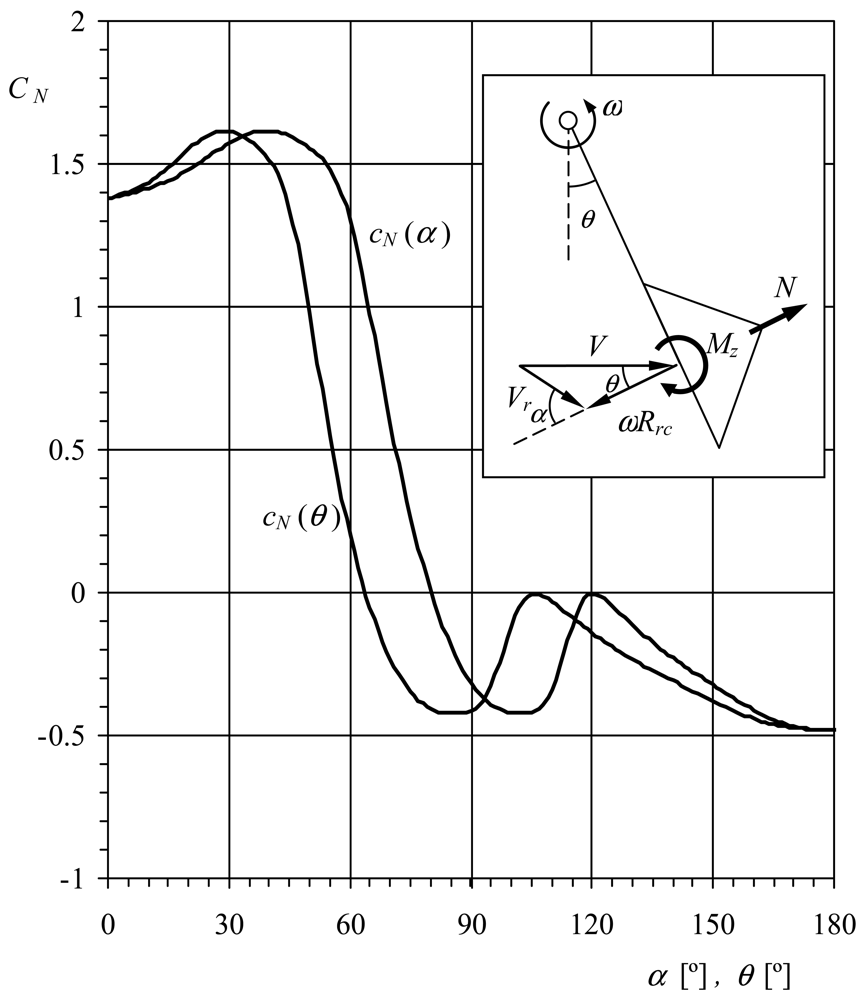
Kondo et al. [5] proposed a solution to the problem considering the anemometer's rotor position, θ, different from the local wind angle with respect to the cup, α. See in Figure 4, the normal aerodynamic force coefficient of the Brevoort and Joyner Type-II cup plotted as a function of both angles, α and θ, together with a sketch regarding the geometric relations between V, ωRrc, α, and θ. Again, averaging Equation (7) and making the result equal to zero, it is possible to obtain the following equation:
Kondo et al. simplified the calculations by using a stepwise line for the coefficient cN(α) (see Figure 2). However, it is possible to express this coefficient as a function of θ using the Equation (11) together with a reasonable value of the factor K, and then solve Equations (17) and (18) in order to obtain a more accurate value of this factor. Using this method it is possible to get the solution in a few iterations. In the present case K = 3.5, and the calibration coefficient Ar = 22.02Rrc (Rrc expressed in meters).
The aim of the present work is to analyze the correlation between the cups' rotor dynamics in steady state (that is, the anemometer's transfer function) and the rotor's shape (more specifically, the cups center rotation radius, Rrc, and the cups' front area, Sc), by means of a specific testing research. Other effects such as the cups' aerodynamic drag coefficient measured both on one isolated cup and on one cup surrounded by the other two inside the rotor, are also taken into account. The testing campaign was divided into two parts, the first one included calibrations performed on two different anemometers with 21 different rotors (varying both the cups' size and the rotation radius), whereas the second one included the aerodynamic forces measurements on a cup, isolated and in a rotor (that is, surrounded by the other two). In order to have a better understanding of the anemometers' rotor dynamics, the results were compared to the aforementioned classic analytical models.
2. Testing Configuration and Cases Studied
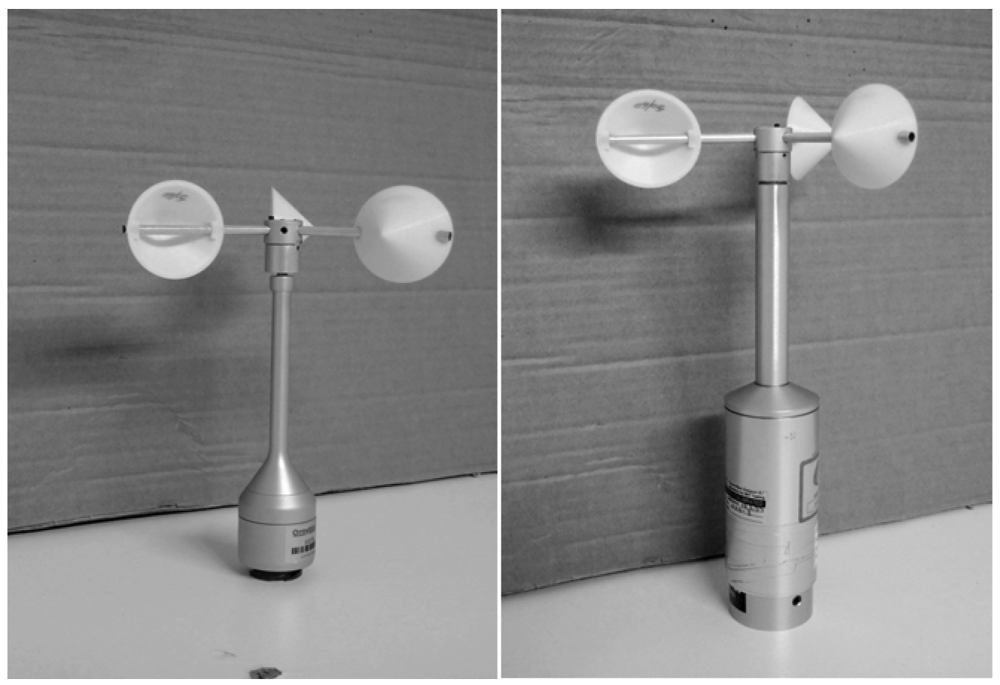
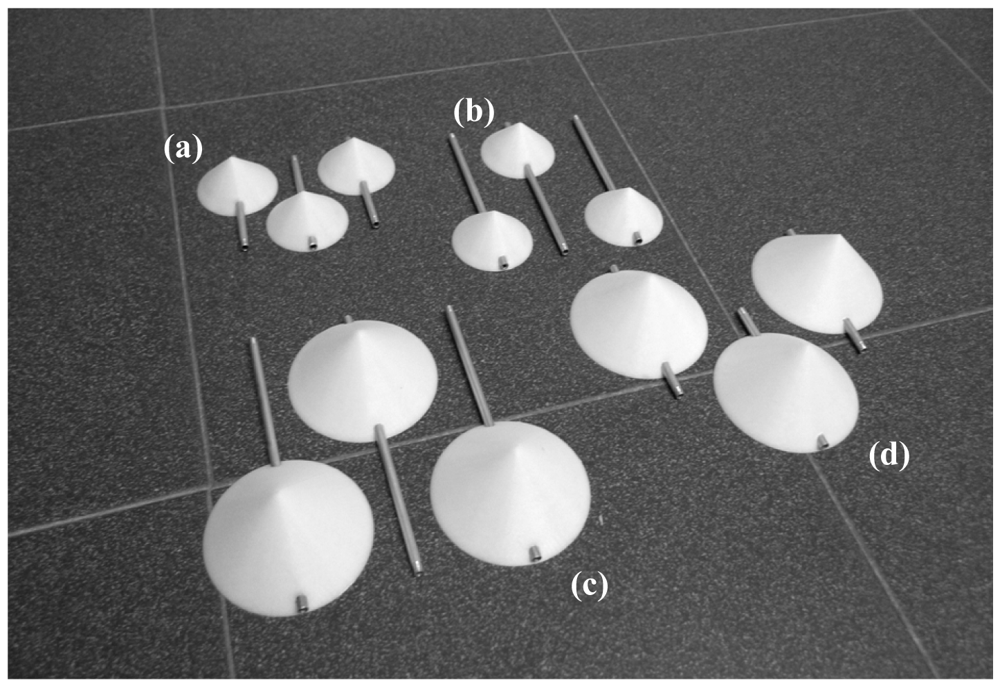
Two anemometers, Climatronics 100075 (also known as F460 model, by Climatronics Corp.: Bohemia, New York, USA), and Ornytion 107A (Ornytion: Bergondo, A Coruña, Spain) were used in the testing campaign (see Figure 5). These anemometers will be referred hereinafter in the text as Cl-100075 and Ory-107 respectively. As said, 21 different rotors were tested on both anemometers (see Figure 6), varying the cups' front section, Sc, and the cups' center rotation radius, Rrc, from one another (see Table1). All cups tested were conical (90° cone-angle). The cups were made in a 3D printer of ABS plastic, and the arm of each cup was made of 5 mm diameter aluminum tube. Each set of three cups were attached to the Cl-100075 anemometer rotor's head. In order to use this head with the Ory-107 anemometer, a special piece had to be designed and manufactured as an interface to the Ory-107 shaft. These anemometers have different electronic systems, the Cl-100075 is equipped with an opto-electronic system that gives 30 squared pulses per rotation, while the Ory-107 has a magnets-based system that gives two harmonic pulses per rotation.
The calibrations were carried out at the IDR/UPM Institute, in the S4 wind tunnel. This facility is an open-circuit wind tunnel with a closed test section measuring 0.9 by 0.9 m. It is served by four 7.5 kW fans with a flow uniformity under 0.2% in the testing area. More details concerning the facility and the calibration process are included in references [8,13]. The calibrations analyzed in the present paper were performed following the MEASNET [14,15] recommendations (over 13 points and from 4 to 16 m·s−1 wind speed).
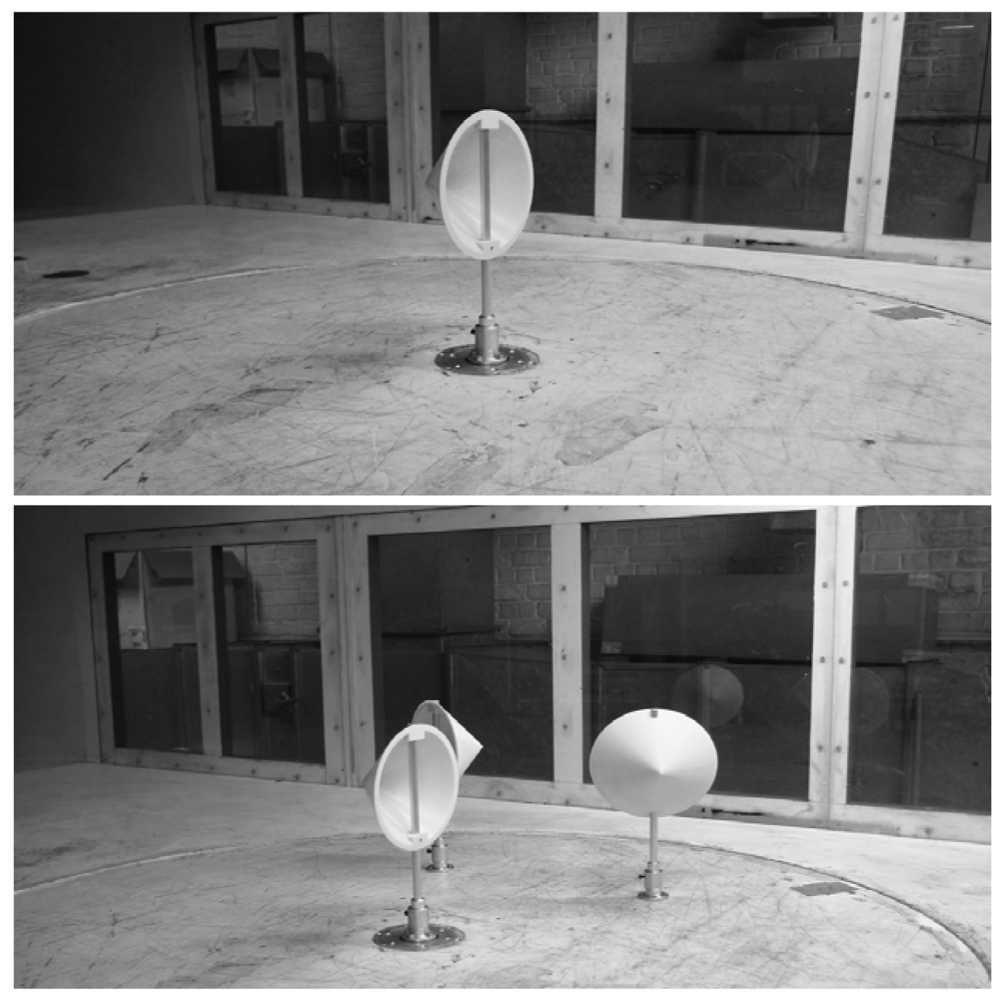
The aerodynamic forces on the cups were measured in the wind tunnel of the Department of Mechanical Engineering of the Vrije Universiteit Brussel (Belgium). This facility is also an open-circuit wind tunnel with a 2 by 1 m closed test section. The facility is served by a 55 kW centrifugal fan. The testing section is equipped with a 6-component balance made by TEM Engineering Limited (Sussex, UK). Three larger-scale cups (0.2 m diameter) were manufactured to measure the aerodynamic forces. These cups were also made in a 3D printer of ABS plastic, and they are an exact scale-replica of the rotors' ones. As stated in the introduction, two different tests were carried out. In the first one, the forces on an isolated cup were measured by varying the wind direction, whereas in the second one the cup was surrounded by the other two in order to better simulate the anemometer's rotor (see Figure 7). These tests were carried out in smooth flow (with low turbulence, 1–1.5%), with around 15 m·s−1 wind speed. 12,000 samples were taken at 50 Hz in each measurement. The forces were made non dimensional with the dynamic pressure directly measured by a BnC-Lambrecht 630a (Goettingen, Germany) pitot tube located at the ceiling of the testing chamber, upstream to the point where the models are allocated, and connected to a SETRA Model 239 (Boxborough, MA, USA) differential pressure sensor.
3. Results and Discussion
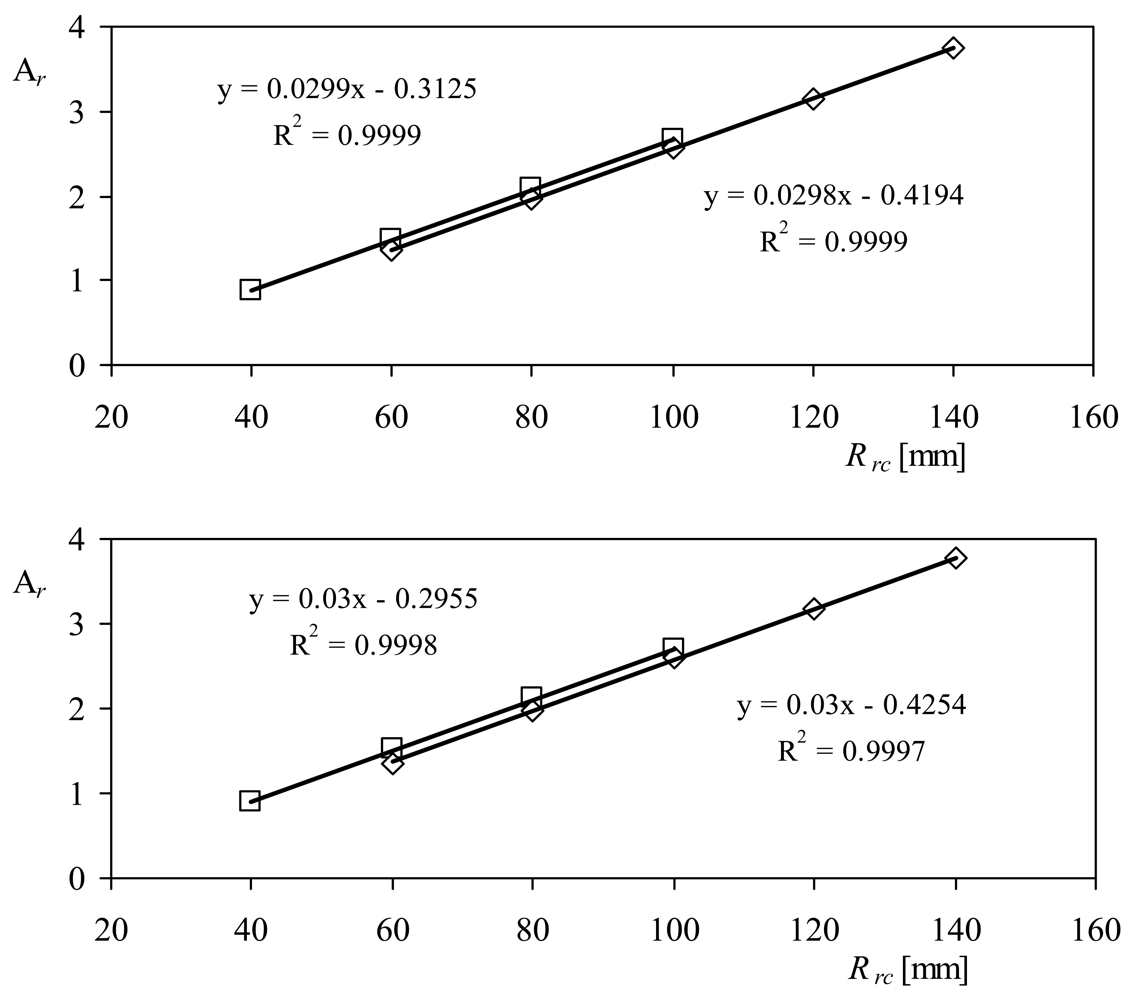
The calibration results, together with the characteristics of each tested rotor, are included in Table 1. The calibration constants Ar, that is, the anemometers' transfer function slopes, are plotted in Figure 8 as a function of the cups' center rotation radius, Rrc, for the two anemometers tested. A linear fit has been added to both graphs included in the figure. The results seem to be identical for both anemometers, although there is some dispersion due to the different front areas of the cups. In Figure 9, the calibration constants Ar measured in both anemometers equipped with 50 mm and 80 mm diameter cup rotors, are shown as a function of the cups' center rotation radius. The same linear tendency is observed, with better correlation coefficients to the data, R2. In Table 2, the linear fittings of Ar:
The same analysis can be performed on the anemometers' transfer function offset, B. Let's assume that this coefficient has a linear behavior with Rrc as the transfer function slopes:
In Figure 11 the behavior of this coefficient is shown as a function of the cups' center rotation radius, Rrc, for the two anemometers equipped with the rotors of 50 mm and 80 mm diameter cups. It can be observed in the figure that the linear fitting is confirmed as quite accurate for describing the coefficient's behavior, despite the fact that some fittings are better than the others (see in Table 3 the linear fittings correspondent to this coefficient). Unlike what happened with the constant, Ar, both the slope, dB/dRrc, and the offset, B0, are quite different from one fitting to the other one. Nonetheless, it is possible to find some fitting to describe them as a function of the other important parameter of the rotors' shape, the cups' front area, Sc. In Figure 12, the power fittings to the data concerning the slope and offset of Equation (21) are shown. It can be observed that the power fittings represent the behavior of the aforementioned slope and offset quite well. Based on this fact, Equation (21) can be rewritten as:
The previous analysis illustrates the relation between both calibration constants, Ar and B, and the two most important shape parameters of the anemometers, the cups' center rotation radius, Rrc, and the cups' front area, Sc. The comparison between the calibration results and the constants estimated with Equations (20) and (22), together with the measured wind speed percentage deviation at V = 7 m·s−1, is shown in Table 4. The variations with regard to the slope of the transfer function, Ar, are up to 4.9% (Cl-100075) and 2% (Ory-107), whereas with regard to the offset, B, they are larger, up to 43% (Cl-100075) and 211% (Ory-107). These large differences, also between both anemometers, are explained as the offset is mainly produced by the friction [16,17]. It should also be said that the friction term in the expression that describes the anemometer's behavior (3) is affected by changes in the temperature [10]. Therefore, changes in the air temperature during the calibration, together with the different bearings systems of both anemometers can explain the aforementioned differences.
To compare these results with the ones from the classical models it must be taken into account that the anemometer's factor depends on both calibration constants:
However, it can be accurate enough to leave aside the second term of this expression, assuming an average deviation up to 8.6% (based on the calibration results in Table 1, the average deviations are 7.4%, 4.1% and 2.8% -Cl-100075-, and 8.6%, 4.7% and 3.2% -Ory-107-, respectively for V = 4, 7, and 10 m·s−1 wind speed). The results are then K = 4.77 and dAr/dRrc = 0.03, which are a bit far from the results of the 2-cup model (K = 3.88 and dAr/dRrc = 0.0244), Ramachandran model (K = 2.64 and dAr/dRrc = 0.0166), Kondo et al. model (K = 3.50 and dAr/dRrc = 0.022), and the previous research [8] (K = 3.02 and dAr/dRrc = 0.019).
The results of the normal aerodynamic force coefficient measured on a cup are included in Figure 13. In this figure the two cases are included, one isolated cup and the measurement cup surrounded by other ones simulating a 3-cup rotor. In this last case, the scaled cup's center rotation radius corresponds to a rotor with Rrc = 60 mm. In the figure, the yawing moment coefficient, cmz, multiplied by the ratio Dc/Rrc has also been included (see the sketch in Figure 4). As can be observed, the effect of the aerodynamic moment in terms of torque, is much less important than the normal aerodynamic force on the cup. Except for angles between α = 120° and α = 240°, the experimental results follow the Brevoort & Joyner early results quite well. Nevertheless, a quite large discrepancy is found in that bracket. This can be explained due to the cups' geometries, as the Type II-cup tested by Brevoort and Joyner has rounded edges instead of the sharp edges from the cups tested, and a lower cone-angle (80° instead of 90°).
The use of these experimental results in combination with the described analytical models gives more accurate values of K and dAr/dRrc, when compared to the ones calculated with the Brevoort & Joyner measurements. The results are summarized in Table 5. Notwithstanding, it is possible to go one step further.
In Figure 14, the standard deviation of the normal force on the cup divided by the mean value of this force, σN/N, is shown as a function of the wind angle with respect to the cup, for the two cases tested (the isolated cup, and the cup in a 3-cup rotor). In this graph the effect of the wake produced by the upstream cups can be observed. Between α = 70° and α = 130° the cup in which the forces are measured is clearly in the wake of another, the effect being a dispersion up to 22 times the average force measured. Furthermore, the same effect can be observed between α = 255° and α = 280°, although in this last case the effect of the non steady aerodynamic effects is less important. It is well known from basic aerodynamics that when a body is in the wake of another, the aerodynamic forces are highly affected. Supposing that in the mentioned intervals the cup is affected by a sudden loss of drag (so the normal force is neglected), the calculations of the anemometer's factor give a quite good result, K = 4.75 (dAr/dRrc = 0.0298), when compared to the result from the calibrations.
4. Conclusions
In the present study, the influence of the rotor's shape (cups' front area, Sc, and cups' center rotation radius, Rrc) on the anemometers' performance, has been analyzed by wind tunnel calibrations performed on two different anemometers, tested with 21 different rotors. The results have been compared to those from analytical models improved with data from specific cup aerodynamics wind tunnel testing.
The major conclusions resulting from this work are:
Both calibration constants, Ar and B, of a cup anemometer depend on the aforementioned shape parameters. Both constants show a linear relationship with the cups' center rotation radius, Rrc. In the case of constant Ar, the slope of this linear behavior, dAr/dRrc, only depends on the cups' aerodynamics (and does not depend on any rotor shape parameter), whereas the offset, Ar0, seems to depend only on the cups' front area, Sc. In case of constant B, both the slope, dBr/dRrc, and the offset, Br0, seem to depend only on the cups' front area.
The slope of an anemometer's transfer function, that is, the calibration constant Ar, can be accurately estimated with Kondo et al. analytical model if it is based on precise aerodynamic data related to the aerodynamics of the rotor cups.
Acknowledgments
The authors are indebted to Enrique Vega, Alejandro Martínez, Pedro López, Luis García and Eduardo Cortés, from the IDR/UPM Institute for their friendly help and support in the present research. This work was done in collaboration with the Department of Mechanical Engineering of the Vrije Universiteit Brussel. In this sense, the authors are truly indebted to Chris Lacor and Alain Wery, for the opportunity to carry out part of the testing campaign in Brussels, and also for their friendly support. The authors would also like to thank Angel Sanz for sharing his ideas and giving his encouraging support. The authors are indebted to Alfonso Rosende from Ornytion for his constant and kind support for the authors' research. Finally, the authors are grateful to Brian Elder and Tania Tate for their kind help in improving the style of the text.
References
- Sanz, A.A. Trabajo de Investigación; Research Report; Competitive Exam for Head of Department Position at the Polytechnic University of Madrid: Madrid, Spain, 2001. [Google Scholar]
- Kristensen, L.; Jensen, G.; Hansen, A.; Kirkegaard, P. Field Calibration of Cup Anemometers; Risø–R–1218(EN); Risø National Laboratory: Roskilde, Denmark; January; 2001. [Google Scholar]
- Wyngaard, J.C. Cup, propeller, vane, and sonic anemometers in turbulence research. Ann. Rev. Fluid Mech. 1981, 13, 399–423. [Google Scholar]
- Ramachandran, S.A. Theoretical study of cup and vane anemometers. Quart. J. Roy. Meteorol. Soc. 1969, 95, 163–180. [Google Scholar]
- Kondo, J.; Naito, G.; Fujinawa, Y. Response of cup anemometer in turbulence. J. Meteorol. Soc. Jpn. 1971, 49, 63–74. [Google Scholar]
- Brevoort, M.J.; Joyner, U.T. Aerodynamic Characteristics of Anemometer Cups; NACA Technical Note 489; Washington, DC, USA, 1934. [Google Scholar]
- Brevoort, M.J.; Joyner, U.T. Experimental Investigation of the Robinson-Type Cup Anemometer; NACA Technical Note 513; Washington, DC, USA, 1935. [Google Scholar]
- Pindado, S.; Vega, E.; Martínez, A.; Meseguer, E.; Franchini, S.; Sarasola, I. Analysis of calibration results from cup and propeller anemometers. Influence on wind turbine Annual Energy Production (AEP) calculations. Wind Energy 2011, 14, 119–132. [Google Scholar]
- Kristensen, L. Cup anemometer behavior in turbulent environments. J. Atmos. Ocean. Technol. 1998, 15, 5–17. [Google Scholar]
- Wind Turbines. Part 12-1: Power Performance Measurements of Electricity Producing Wind Turbines, 1st ed.; International Standard IEC-61400-12-1; International Electrotechnical Comission: Geneva, Switzerland, 2005. [Google Scholar]
- Solov'ev, Y.P.; Korovushkin, A.I.; Toloknov, Y.N. Characteristics of a cup anemometer and a procedure of measuring the wind velocity. Phys. Oceanogr. 2004, 14, 173–186. [Google Scholar]
- Kaganov, E.I.; Yaglom, A.M. Errors in wind speed measurements by rotation anemometers. Bound.-Lay. Meteorol. 1976, 10, 1–11. [Google Scholar]
- Pindado, S.; Sanz, A.; Wery, A. Deviation of cup and propeller anemometer calibration results with air density. Energies 2012, 5, 683–701. [Google Scholar]
- Cup Anemometer Calibration Procedure, Version 1; Measuring Network of Wind Energy Institutes (MEASNET): Madrid, Spain; September; 1997.
- Anemometer Calibration Procedure, Version 2; Measuring Network of Wind Energy Institutes (MEASNET): Madrid, Spain; October; 2009.
- Wind speed measurement and use of cup anemometry. In International Energy Agency Programme for Research and Development on Wind Energy Conversion Systems. Recommended Practices for Wind Turbine Testing and Evaluation, 1st ed.; Renewable Energy Systems Ltd.: Glasgow, UK, 2003.
- Lockhart, T.J. Some cup anemometer testing methods. J. Atmos. Ocean. Technol. 1985, 2, 680–683. [Google Scholar]


| Climatronics 100075 | |||||
|---|---|---|---|---|---|
| Rotor | Dc [mm] | Rrc [mm] | A | B | Ar |
| 40/40 | 40 | 40 | 0.0310 | 0.2593 | 0.9295 |
| 40/50 | 40 | 50 | 0.0420 | 0.3010 | 1.2592 |
| 40/60 | 40 | 60 | 0.0518 | 0.3562 | 1.5526 |
| 50/40 | 50 | 40 | 0.0293 | 0.2867 | 0.8777 |
| 50/60 | 50 | 60 | 0.0495 | 0.2567 | 1.4850 |
| 50/80 | 50 | 80 | 0.0697 | 0.3387 | 2.0909 |
| 50/100 | 50 | 100 | 0.0890 | 0.5447 | 2.6692 |
| 60/40 | 60 | 40 | 0.0279 | 0.1900 | 0.8361 |
| 60/60 | 60 | 60 | 0.0481 | 0.1559 | 1.4425 |
| 60/80 | 60 | 80 | 0.0682 | 0.2167 | 2.0464 |
| 60/100 | 60 | 100 | 0.0866 | 0.3731 | 2.5991 |
| 60/120 | 60 | 120 | 0.1064 | 0.4731 | 3.1922 |
| 70/60 | 70 | 60 | 0.0461 | 0.1642 | 1.3833 |
| 70/80 | 70 | 80 | 0.0674 | 0.1754 | 2.0210 |
| 70/100 | 70 | 100 | 0.0873 | 0.2003 | 2.6200 |
| 70/120 | 70 | 120 | 0.1067 | 0.2997 | 3.1997 |
| 80/60 | 80 | 60 | 0.0454 | 0.1376 | 1.3633 |
| 80/80 | 80 | 80 | 0.0653 | 0.1864 | 1.9601 |
| 80/100 | 80 | 100 | 0.0859 | 0.2221 | 2.5781 |
| 80/120 | 80 | 120 | 0.1052 | 0.2539 | 3.1557 |
| 80/140 | 80 | 140 | 0.1248 | 0.3040 | 3.7455 |
| Ornytion 107A | |||||
| Rotor | Dc [mm] | Rrc [mm] | A | B | Ar |
| 40/40 | 40 | 40 | 0.4809 | 0.2739 | 0.9617 |
| 40/50 | 40 | 50 | 0.6396 | 0.3707 | 1.2792 |
| 40/60 | 40 | 60 | 0.7827 | 0.5387 | 1.5654 |
| 50/40 | 50 | 40 | 0.4477 | 0.1479 | 0.8954 |
| 50/60 | 50 | 60 | 0.7584 | 0.3513 | 1.5168 |
| 50/80 | 50 | 80 | 1.0571 | 0.5058 | 2.1141 |
| 50/100 | 50 | 100 | 1.3489 | 0.6509 | 2.6978 |
| 60/40 | 60 | 40 | 0.4313 | 0.0702 | 0.8625 |
| 60/60 | 60 | 60 | 0.7363 | 0.1824 | 1.4727 |
| 60/80 | 60 | 80 | 1.0397 | 0.2957 | 2.0795 |
| 60/100 | 60 | 100 | 1.3143 | 0.4646 | 2.6285 |
| 60/120 | 60 | 120 | 1.6139 | 0.5543 | 3.2278 |
| 70/60 | 70 | 60 | 0.7074 | 0.1848 | 1.4148 |
| 70/80 | 70 | 80 | 1.0275 | 0.2796 | 2.0549 |
| 70/100 | 70 | 100 | 1.3173 | 0.2182 | 2.6347 |
| 70/120 | 70 | 120 | 1.6022 | 0.3444 | 3.2044 |
| 80/60 | 80 | 60 | 0.6794 | 0.1500 | 1.3588 |
| 80/80 | 80 | 80 | 0.9936 | 0.1902 | 1.9873 |
| 80/100 | 80 | 100 | 1.3001 | 0.2174 | 2.6003 |
| 80/120 | 80 | 120 | 1.5906 | 0.2359 | 3.1812 |
| 80/140 | 80 | 140 | 1.8830 | 0.3191 | 3.7659 |
| Climatronics 100075 | |||||
|---|---|---|---|---|---|
| Rotors tested | Dc [mm] | Sc [mm2] | dAr/dRrc | Ar0 | R2 |
| 40/40, 40/50, 40/60 | 40 | 1,256.6 | 3.116E–02 | –3.107E–01 | 0.99888 |
| 50/40, 50/60, 50/80, 50/100 | 50 | 1,963.5 | 2.990E–02 | –3.125E–01 | 0.99986 |
| 60/40, 60/60, 60/80, 60/100, 60/120 | 60 | 2,827.4 | 2.934E–02 | –3.243E–01 | 0.99974 |
| 70/60, 70/80, 70/100, 70/120 | 70 | 3,848.5 | 3.024E–02 | –4.157E–01 | 0.99953 |
| 80/60, 80/80, 80/100, 80/120, 80/140 | 80 | 5,026.5 | 2.980E–02 | –4.194E–01 | 0.99989 |
| Ornytion 107A | |||||
| Rotors tested | Dc [mm] | Rrc [mm] | dAr/dRrc | Ar0 | R2 |
| 40/40, 40/50, 40/60 | 40 | 1,256.6 | 3.019E–02 | –2.406E–01 | 0.99911 |
| 50/40, 50/60, 50/80, 50/100 | 50 | 1,963.5 | 3.002E–02 | –2.955E–01 | 0.99980 |
| 60/40, 60/60, 60/80, 60/100, 60/120 | 60 | 2,827.4 | 2.943E–02 | –3.003E–01 | 0.99968 |
| 70/60, 70/80, 70/100, 70/120 | 70 | 3,848.5 | 2.974E–02 | –3.497E–01 | 0.99923 |
| 80/60, 80/80, 80/100, 80/120, 80/140 | 80 | 5,026.5 | 3.004E–02 | –4.254E–01 | 0.99970 |
| Climatronics 100075 | |||||
|---|---|---|---|---|---|
| Rotors tested | Dc [mm] | Sc [mm2] | dB/dRrc | B0 | R2 |
| 40/40, 40/50, 40/60 | 40 | 1,256.6 | 4.8445E–03 | 6.3273E–02 | 0.99370 |
| 50/40, 50/60, 50/80, 50/100 | 50 | 1,963.5 | 4.2794E–03 | 5.7171E–02 | 0.72444 |
| 60/40, 60/60, 60/80, 60/100, 60/120 | 60 | 2,827.4 | 3.9178E–03 | 2.0341E–02 | 0.83575 |
| 70/60, 70/80, 70/100, 70/120 | 70 | 3,848.5 | 2.1567E–03 | 1.5786E–02 | 0.81394 |
| 80/60, 80/80, 80/100, 80/120, 80/140 | 80 | 5,026.5 | 2.0019E–03 | 2.0607E–02 | 0.99374 |
| Ornytion 107A | |||||
| Rotors tested | Dc [mm] | Rrc [mm] | dB/dRrc | B0 | R2 |
| 40/40, 40/50, 40/60 | 40 | 1,256.6 | 1.3239E–02 | –2.6754E–01 | 0.97653 |
| 50/40, 50/60, 50/80, 50/100 | 50 | 1,963.5 | 8.3167E–03 | –1.6821E-01 | 0.99334 |
| 60/40, 60/60, 60/80, 60/100, 60/120 | 60 | 2,827.4 | 6.2523E–03 | –1.8674E–01 | 0.99262 |
| 70/60, 70/80, 70/100, 70/120 | 70 | 3,848.5 | 2.0861E–03 | 6.9016E-02 | 0.58547 |
| 80/60, 80/80, 80/100, 80/120, 80/140 | 80 | 5,026.5 | 1.9197E–03 | 3.0577E–02 | 0.93054 |
| Rotor | Climatronics 100075 | Ornytion 107A | ||||
|---|---|---|---|---|---|---|
| ΔAr [%] | ΔB [%] | ΔV [%] | ΔAr [%] | ΔB [%] | ΔV [%] | |
| 40/40 | −3.47% | 4.93% | −3.16% | −0.83% | 92.54% | 2.82% |
| 40/50 | −4.92% | 7.59% | −4.38% | −1.99% | 77.80% | 2.24% |
| 40/60 | −3.57% | 5.49% | −3.11% | −0.75% | 46.84% | 2.91% |
| 50/40 | −0.72% | −29.27% | −1.89% | 1.46% | 132.63% | 4.23% |
| 50/60 | −0.92% | 10.13% | −0.51% | −0.55% | 46.92% | 1.83% |
| 50/80 | −0.93% | 7.08% | −0.55% | −0.27% | 36.06% | 2.36% |
| 50/100 | 0.08% | −18.74% | −1.38% | 0.40% | 32.16% | 3.35% |
| 60/40 | 1.21% | −16.50% | 0.73% | 0.31% | 211.19% | 2.43% |
| 60/60 | 0.25% | 42.76% | 1.20% | −0.50% | 79.73% | 1.59% |
| 60/80 | −0.01% | 32.19% | 0.98% | −0.68% | 47.77% | 1.36% |
| 60/100 | 1.81% | −6.06% | 1.39% | 1.40% | 17.58% | 2.47% |
| 60/120 | 1.69% | −12.41% | 0.74% | 1.16% | 18.25% | 2.51% |
| 70/60 | 2.72% | 9.90% | 2.89% | 0.61% | 2.86% | 0.67% |
| 70/80 | 0.00% | 32.78% | 0.82% | −1.53% | −9.35% | −1.84% |
| 70/100 | 0.03% | 42.43% | 1.25% | −0.43% | 45.23% | 1.00% |
| 70/120 | 0.66% | 12.71% | 1.18% | 0.59% | 10.40% | 1.08% |
| 80/60 | 2.35% | 8.49% | 2.47% | 1.76% | −43.43% | 0.80% |
| 80/80 | 1.80% | 3.59% | 1.85% | −0.23% | −40.53% | −1.32% |
| 80/100 | 0.67% | 6.60% | 0.86% | −0.67% | −34.94% | −1.74% |
| 80/120 | 1.26% | 10.49% | 1.59% | 0.05% | −28.06% | −0.90% |
| 80/140 | 1.33% | 6.65% | 1.56% | 0.45% | −37.96% | −1.30% |
| Analytical models based on Brevoort & Joyner results [6,7] | ||
|---|---|---|
| Model | K | dAr/dRrc |
| 2-cup model [3] | 3.88 | 0.0244 |
| Ramachandran [4] | 2.64 | 0.0166 |
| Kondo et al. [5] | 3.5 | 0.022 |
| Analytical models based on drag force measured on one isolated cup | ||
| Model | K | dAr/dRrc |
| 2-cup model | 8.39 | 0.0527 |
| Ramachandran | 3.37 | 0.0212 |
| Kondo et al. | 4.8 | 0.0302 |
| Analytical models based on drag force measured on one cup in a 3-cup rotor | ||
| Model | K | dAr/dRrc |
| 2-cup model | 9.51 | 0.0598 |
| Ramachandran | 3.46 | 0.0218 |
| Kondo et al. | 4.98 | 0.0313 |
| Kondo et al. with shielding effects | 4.75 | 0.0298 |
| Experimental results | ||
| Testing campaign | K | dAr/dRrc |
| Based on calibrations on commercial anemometers [8] | 3.02 | 0.019 |
| Present research | 4.77 | 0.03 |
© 2012 by the authors; licensee MDPI, Basel, Switzerland. This article is an open access article distributed under the terms and conditions of the Creative Commons Attribution license (http://creativecommons.org/licenses/by/3.0/).
Share and Cite
Pindado, S.; Pérez, J.; Avila-Sanchez, S. On Cup Anemometer Rotor Aerodynamics. Sensors 2012, 12, 6198-6217. https://doi.org/10.3390/s120506198
Pindado S, Pérez J, Avila-Sanchez S. On Cup Anemometer Rotor Aerodynamics. Sensors. 2012; 12(5):6198-6217. https://doi.org/10.3390/s120506198
Chicago/Turabian StylePindado, Santiago, Javier Pérez, and Sergio Avila-Sanchez. 2012. "On Cup Anemometer Rotor Aerodynamics" Sensors 12, no. 5: 6198-6217. https://doi.org/10.3390/s120506198