Selective Detection of NO2 Using Cr-Doped CuO Nanorods

Abstract
: CuO nanosheets, Cr-doped CuO nanosheets, and Cr-doped CuO nanorods were prepared by heating a slurry containing Cu-hydroxide/Cr-hydroxide. Their responses to 100 ppm NO2, C2H5OH, NH3, trimethylamine, C3H8, and CO were measured. For 2.2 at% Cr-doped CuO nanorods, the response (Ra/Rg, Ra: resistance in air, Rg: resistance in gas) to 100 ppm NO2 was 134.2 at 250 °C, which was significantly higher than that of pure CuO nano-sheets (Ra/Rg = 7.5) and 0.76 at% Cr-doped CuO nanosheets (Ra/Rg = 19.9). In addition, the sensitivity for NO2 was also markedly enhanced by Cr doping. Highly sensitive and selective detection of NO2 in 2.2 at% Cr-doped CuO nanorods is explained in relation to Cr-doping induced changes in donor density, morphology, and catalytic effects.1. Introduction
Oxide semiconductors have been used to detect oxidizing and reducing gases in a simple and cost-effective manner [1–3]. Their chemiresistive variation emanates from the oxidative or reductive interaction of the analyte gas with the oxide semiconductor surface and the consequent change in the charge carrier concentration. In n-type oxide semiconductor gas sensors such as those comprising SnO2, ZnO, TiO2, WO3, and In2O3, the electron depletion layer is formed by the adsorption of negatively charged oxygen, which dominates the overall conduction process [4]. In contrast, for p-type oxide semiconductor gas sensors such as those comprising CuO, NiO, Co3O4, and Cr2O3, the adsorption of negatively charged oxygen forms a hole accumulation layer near the surface. Thus, conduction occurs along the conductive hole accumulation layer [5].
Various strategies aimed at enhancing gas sensing characteristics such as gas response and selectivity have been reported for n-type oxide semiconductors, which include control of the grain size [6,7], morphologies [8], charge carrier concentration [9], catalytic additive(s) [10], and inter-nanostructure contacts [11] of the sensing materials. The results of these studies suggest that selecting additives that can change the charge carrier concentration, catalytic function, and morphology is very advantageous for enhancing or modifying their gas sensing characteristics. However, studies on the gas sensing characteristics of p-type oxide semiconductors are in their early stages, and most researchers have reported on the gas sensing characteristics of pure p-type oxide semiconductors without additives. For example, the design of highly sensitive and selective CuO sensors using oxide additives has barely been investigated. In contrast, the gas sensing characteristics of various undoped CuO nanostructures including thin films [12,13], nanoparticles [14–16], nanowires [17–19], nanorods [20], nanoribbons [21], nanosheets [15], worm-like structures [22], and hierarchical structures [23] have been studied extensively.
In this study, highly crystalline CuO nanosheets, Cr-doped CuO nanosheets, and Cr-doped CuO nanorods were prepared by a facile chemical route without using a surfactant or capping agent, and their gas sensing characteristics were studied. The doping of CuO nanostructures with Cr significantly enhanced their response and selectivity toward NO2. The main focus of this study was investigating the reasons for the enhanced response and selectivity toward NO2 in relation to the Cr-doping-induced changes in the morphology, surface area, resistance in air, and catalytic property.
2. Experimental Section
2.1. Preparation of CuO and Cr-Doped CuO Nanostructures
CuO nanosheets were prepared by the following procedure: CuCl2·2H2O (17.05 g, >99%, Kanto Chemical, Japan) was dissolved in deionized water (100 mL). Then, 50% NaOH aqueous solution (32 g, Samchun Chemical, Korea) was instantaneously poured into the solution, which caused the precipitation of bright blue Cu hydroxide. The precipitate slurry was heated to 100 °C at a heating rate of 1.67 °C/min. Then, the temperature of the slurry solution was maintained at 100 °C for 30 min. During the reaction, the bright blue Cu-hydroxide precipitate was converted into dark brown CuO nanosheets. CuO nanostructures doped with Cr were prepared by the following procedure: CuCl2·2H2O (17.05 g) and CrCl3·6H2O (0.267 g or 0.799 g, >98%, Aldrich, USA) were dissolved in deionized water (100 mL). 50% NaOH aqueous solution (32 g) was instantaneously poured into the solution. The hydroxide precursors were converted into dark brown Cr-doped CuO nanostructures by heating the precipitate slurry solution at 100 °C for 30 min. Cr-doped CuO nanosheets and nanorods were prepared from solutions containing low and high concentrations of CrCl3·6H2O ([Cr3+]/([Cu2+]+ [Cr3+]) = 0.99 at% and 2.9 at%), respectively. The Cr concentrations of the Cr-doped CuO nanosheets and nanorods were determined by inductively coupled plasma mass spectroscopy to be 0.76 at% and 2.2 at%, respectively. For simplicity, herein the two Cr-doped nanostructures will be referred to as 0.76Cr-CuO and 2.2Cr-CuO specimens.
2.2. Characterization
The phase and crystallinity of the powders were analyzed by X-ray diffraction (XRD, Rigaku D/MAX-2500 V/PC, Rigaku, Japan). The morphology of the powders was investigated by field-emission scanning electron microscopy (FE-SEM, S-4800, Hitachi Co. Ltd., Japan). High resolution transmission electron microscopy (HR-TEM, JEM-2100F, JEOL Co. Ltd., Japan) was used to examine the microstructure of the CuO nanostructures. The surface areas were measured by the Brunauer-Emmett-Teller method (Tristar 3000, Micromeritics Co. Ltd., USA).
2.3. Gas Sensing Characteristics
The as-prepared CuO and Cr-doped nanostructures were heated at 500 °C for 1 h in order to dehydrate the residual hydroxide and to increase the thermal stability of each sensing material at the sensor temperature (250–400 °C). The CuO and Cr-doped nanostructures were dispersed in distilled water (nanosturctures: water = 1:9 by weight) and the slurry was applied to an alumina substrate (size: 1.5 mm × 1.5 mm, thickness: 0.25 mm) using micro-pipette. The alumina substrate was comprised of two Au electrodes (electrode width: 1 mm, electrode spacing: 0.2 mm). After drying, the sensor element was heated-treated again at 500 °C for 1 h to remove the solvent. The sensor was then placed in a quartz tube and the temperature of the furnace was stabilized at 400 °C. A flow-through technique with a constant flow rate of 500 cm3/min was used and a 4-way valve was employed to switch the gas atmospheres. The gas responses (S = Ra/Rg for oxidizing gas or Rg/Ra for reducing gas, Ra: resistance in dry air, Rg: resistance in gas) to 100 ppm NO2, C2H5OH, NH3, trimethylamine(TMA), C3H8, and CO were measured over the range 250–400 °C. Gases at 100 ppm NO2, C2H5OH, NH3, TMA, C3H8, and CO all on a dry air balance were used as parent gases for the measurements. The reproducibilities in sensor resistance and gas response were confirmed by measuring the sensing characteristics of 2–3 sensors for each sensor condition. The concentration of NO2 was controlled from 5–100 ppm by changing the mixing ratio of the parent gases (100 ppm NO2, dry air balance) and dry synthetic air. The dc 2-probe resistance of each sensor was measured using an electrometer that was interfaced with a computer.
3. Results and Discussion
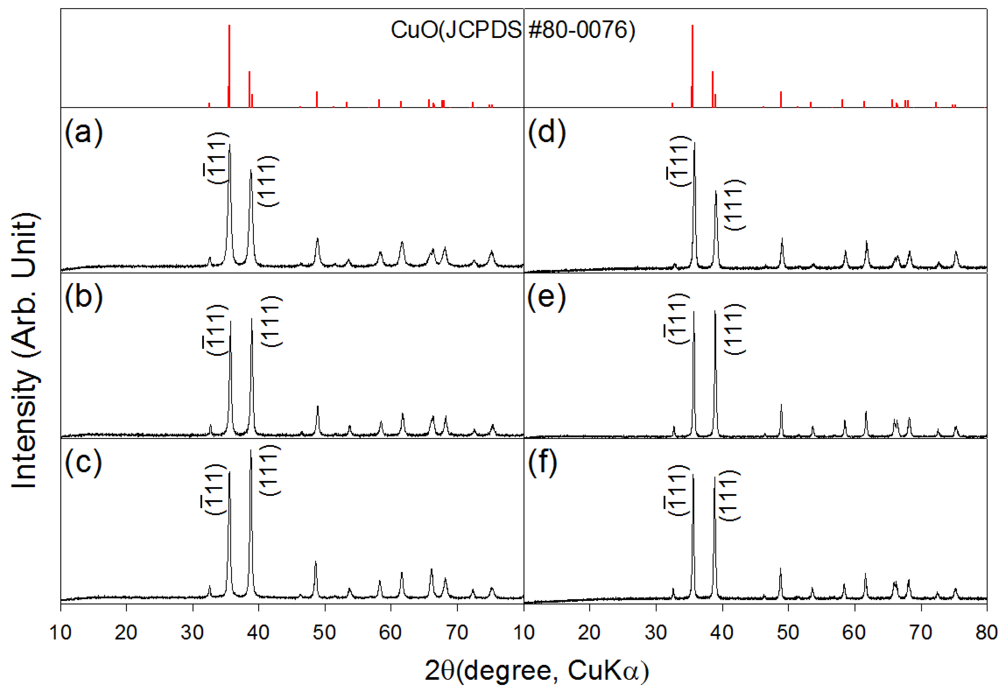
XRD patterns of the as-prepared and heat treated CuO nanostructures are shown in Figure 1. The CuO nanosheets, 0.76Cr-CuO nanosheets, and 2.2Cr-CuO nanorods showed monoclinic CuO phases (JCPDS #80-0076), indicating that the undoped or Cr-doped Cu-hydroxide slurry solutions were completely dehydrated into CuO by heating at 100 °C (Figure 1(a–c)). Regardless of the sample type, the CuO phase remained unchanged after heat treatment at 500 °C (Figure 1(d–f)). No Cr2O3 phase was found both in the 0.76Cr-CuO nanosheets, and 2.2Cr-CuO nanorods. Note that the relative intensities of the (ī11) and (111) peaks depended on the degree of Cr doping. After heat treatment at 500 °C for 1 h, the intensity ratios between the (111) peak at 2θ = 38.8° and the (ī11) peak at 2θ = 35.5° were 0.64, 0.98, and 0.99 for the CuO nanosheets, 0.76Cr-CuO nanosheets, and 2.2Cr-CuO nanorods, respectively. The morphological change from CuO nanosheets to 2.2Cr-CuO nanorods seems to relate to the Cr-doping-induced change of preferred orientation although its origin remains unclear.
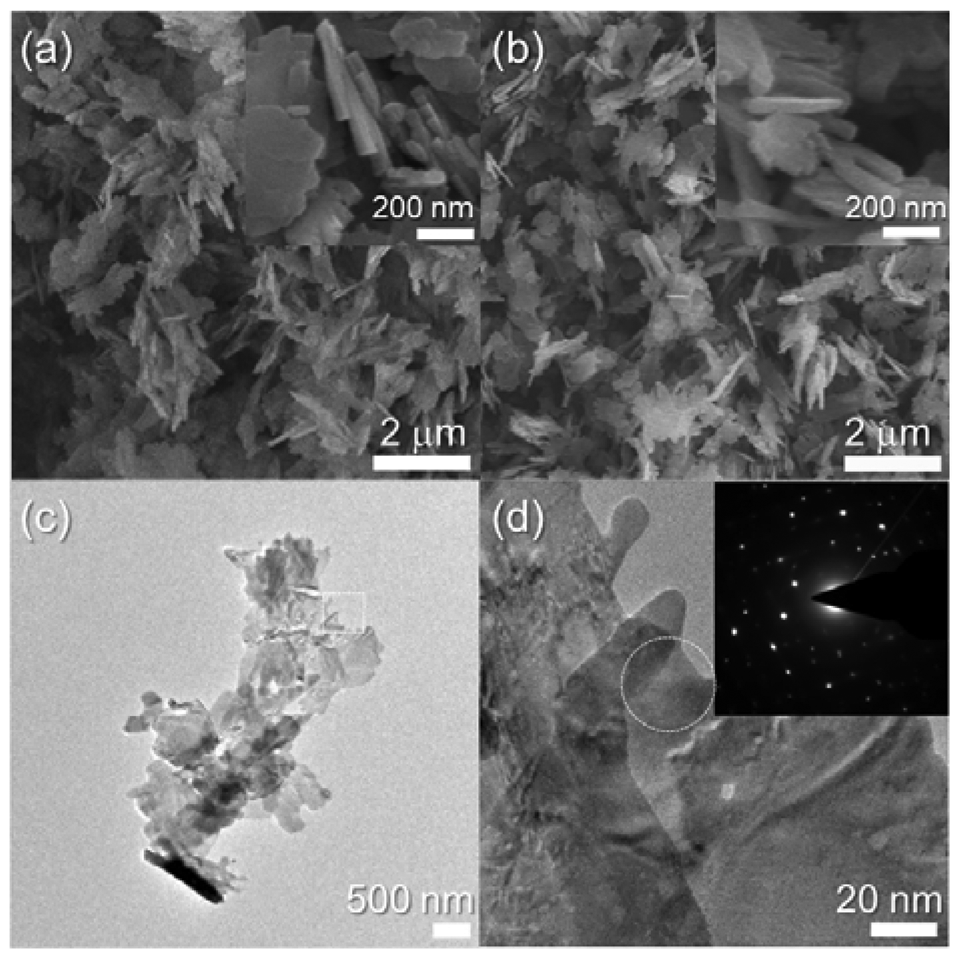
Dehydration of the Cu-hydroxide precipitate solution led to the formation of CuO nanosheets. The nanosheets were 2–3 μm long, 150–250 nm wide, and ∼20 nm thick (inset, Figure 2(a)). The morphology and size of the nanosheets remained similar after heat treatment at 500 °C (Figure 2(b)). The sheet-like morphology was confirmed again using TEM analysis (Figure 2(c)). Selected area electron diffraction in the circled region in Figure 2(d) clearly indicates the presence of a highly crystalline CuO structure.
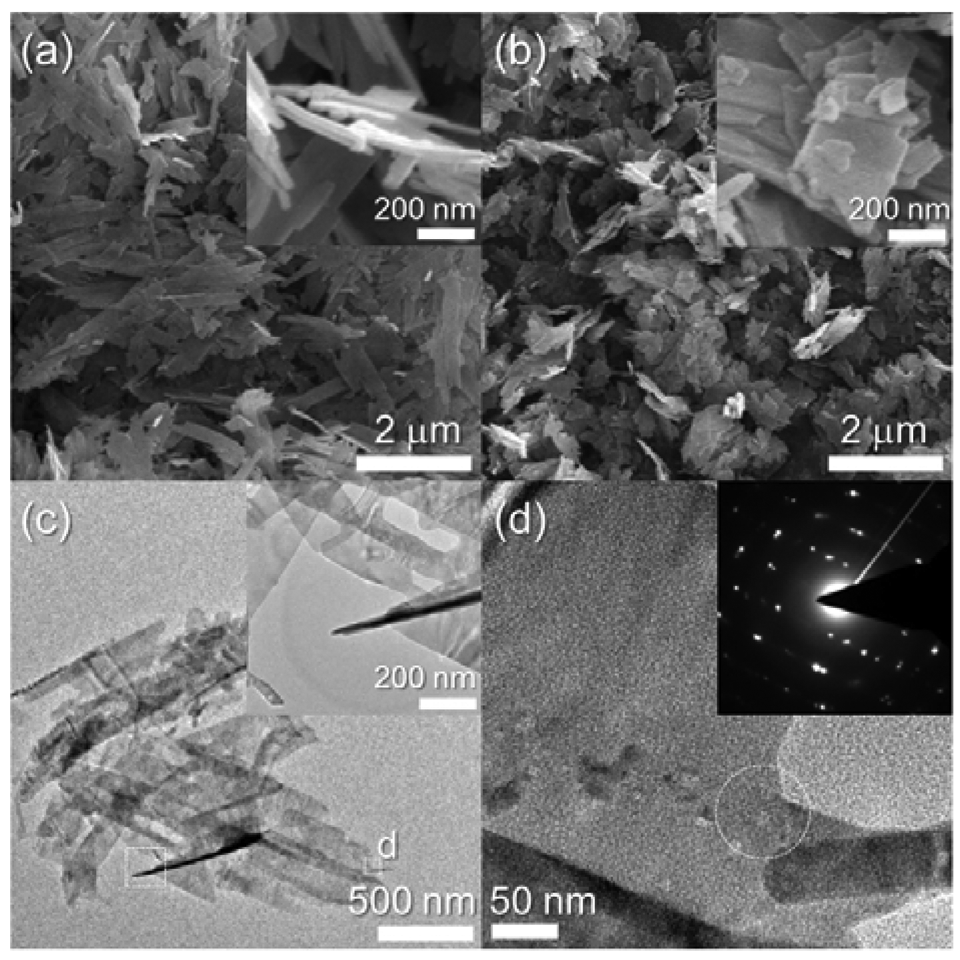
Nanosheets were also obtained in the 0.76 at% Cr-doped CuO specimen (Figure 3(a)). The edge width of the as-prepared 0.76Cr-CuO nanosheets was similar to that of the CuO nanosheets (cf. Figures 2(a) and 3(a)). In comparison, the morphologies of the nanosheets became more irregular and slightly thicker upon Cr doping (insets in Figures 2(a) and 3(a)). The morphology of the 0.76Cr-CuO nanosheets remained similar after heat treatment at 500 °C (Figure 3(b)) and the nanosheets were identified as being crystalline by TEM analyses (Figure 3(c,d)).
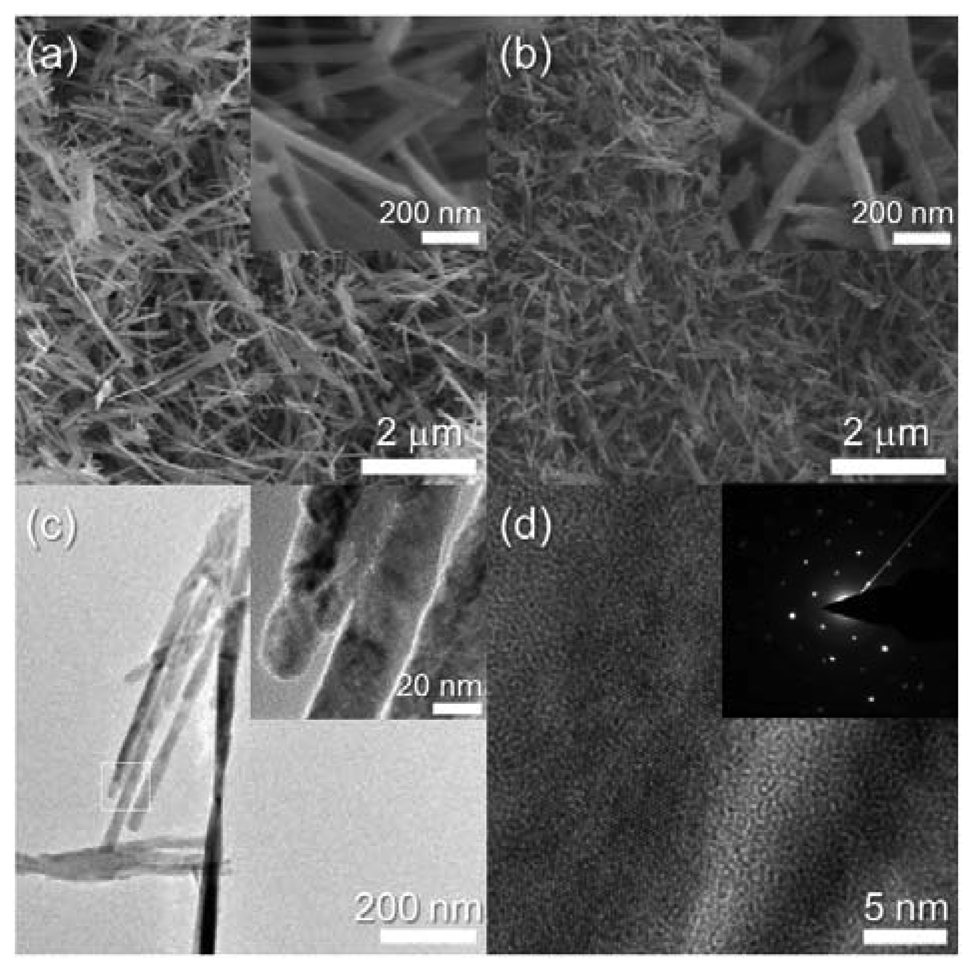
Different morphologies of the CuO nanostructures occurred in the 2.2Cr-CuO specimen (Figure 4(a)). The 2.2Cr-CuO nanorods were 2–3 μm long, 30 nm thick and the morphology did not change after heat treatment at 500 °C (Figure 4(b)). The 2.2Cr-CuO nanorods after heat treatment were also identified as being highly crystalline ones by their TEM images and selected area electron diffraction patterns (Figure 4(c,d)).
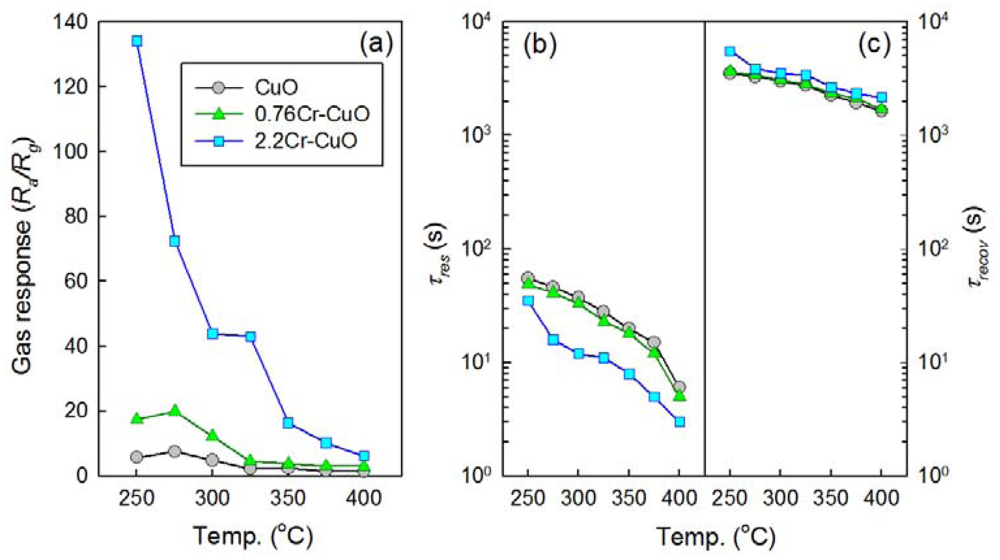
The gas sensing characteristics of the CuO nanosheets, 0.76Cr-CuO nanosheets, and 2.2Cr-CuO nanorods showed decreases in resistance upon exposure to oxidizing gases such as NO2 and increases in resistance upon exposure to reducing gases such as C2H5OH, NH3, TMA, C3H8, and CO. This is consistent with the gas sensing characteristics of p-type oxide semiconductors. Thus, the Ra/Rg (Ra: resistance in air; Rg: resistance in gas) and Rg/Ra were defined as the gas responses to oxidizing and reducing gases, respectively. Below the sensor temperature of 250 °C, it was difficult to measure gas sensing characteristics due to the sluggish recovery kinetics. Thus, the gas responses (Ra/Rg) to 100 ppm NO2 were measured at sensor temperatures over the range 250–400 °C (Figure 5(a)). The responses of the CuO nanosheets to 100 ppm NO2 exhibited a maximum value (Ra/Rg = 7.5) at 275 °C and decreased to 1.4 as the sensor temperature increased. The doping of 0.76 at% Cr enhanced the maximum NO2 responses to 19.9 at 275 °C. This corresponded to a 2.65-fold increase in sensitivity. The NO2 responses of the 2.2Cr-CuO nanorods were significantly higher than those of CuO and the 0.76Cr-CuO nanosheets over the entire sensor temperature range. The NO2 response of the 2.2Cr-CuO nanorods was as high as 134.2 at 250 °C and decreased monotonically to 6.2 as the sensor temperature increased up to 400 °C. The times to reach 90% variation of resistance upon exposure to gas and air, the 90% response and recovery times (τres and τrecov), were determined from the sensing transients (Figure 5(b,c)). The τres values of CuO sensors decreased from 55 s to 6 s as the sensor temperature increases (Figure 5(b)). Note that the τres values tend to decrease as increasing Cr doping concentration at the same sensor temperature. This indicates that the reaction kinetics can be enhanced either by thermal activation of sensing reaction or by the catalytic promotion. In contrast, very long recovery times (1,642–5,536 s) were required (Figure 5(c)).
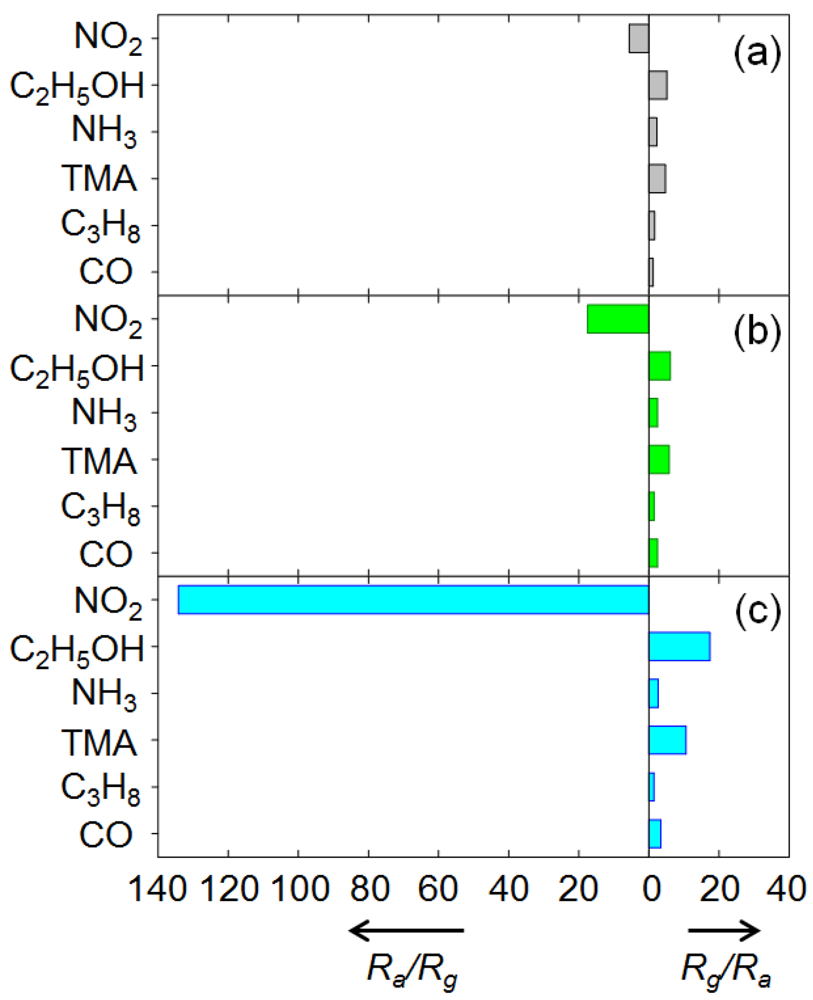
The responses to 100 ppm NO2, C2H5OH, NH3, TMA, C3H8, and CO at 250 °C are shown in Figure 6. For the CuO nanosheets, the response (Ra/Rg) to 100 ppm NO2 was 5.6, while the responses (Rg/Ra) to other gases ranged from 1.2–5.1 (Figure 6(a)). In particular, the responses to 100 ppm C2H5OH (Rg/Ra = 5.1) and TMA (Rg/Ra = 4.7) were comparable to that for 100 ppm NO2 although the resistance of the sensors varied in the opposite direction. By doping with 0.76 at% Cr, the response (Ra/Rg) to 100 ppm NO2 increased to 17.5, while the responses to the other gases remained similar (Rg/Ra = 1.5–6.1) (Figure 6(b)). This suggests that NO2 can be detected in a more selective manner using 0.76Cr-CuO nanosheets.
The response (Ra/Rg) to 100 ppm NO2 was markedly enhanced to 134.2. The responses to other gases except C2H5OH, TMA, and CO remained similar (Rg/Ra = 1.5–2.7). Although the responses to 100 ppm C2H5OH, TMA, and CO were also increased, the 3.4-fold enhancement of the C2H5OH response (17.4/5.1 = 3.4), the 2.3-fold enhancement of the TMA response (10.6/4.7 = 2.3), and the 2.8-fold enhancement of the CO response (3.4/1.2 = 2.8) were negligibly small compared to the 24.1-fold enhancement of the NO2 response (134.2/5.6 = 24.1). This clearly verifies that 2.2 at% Cr doping of the CuO nanostructures resulted in highly selective and sensitive detection of NO2 in the presence of interfering gases.
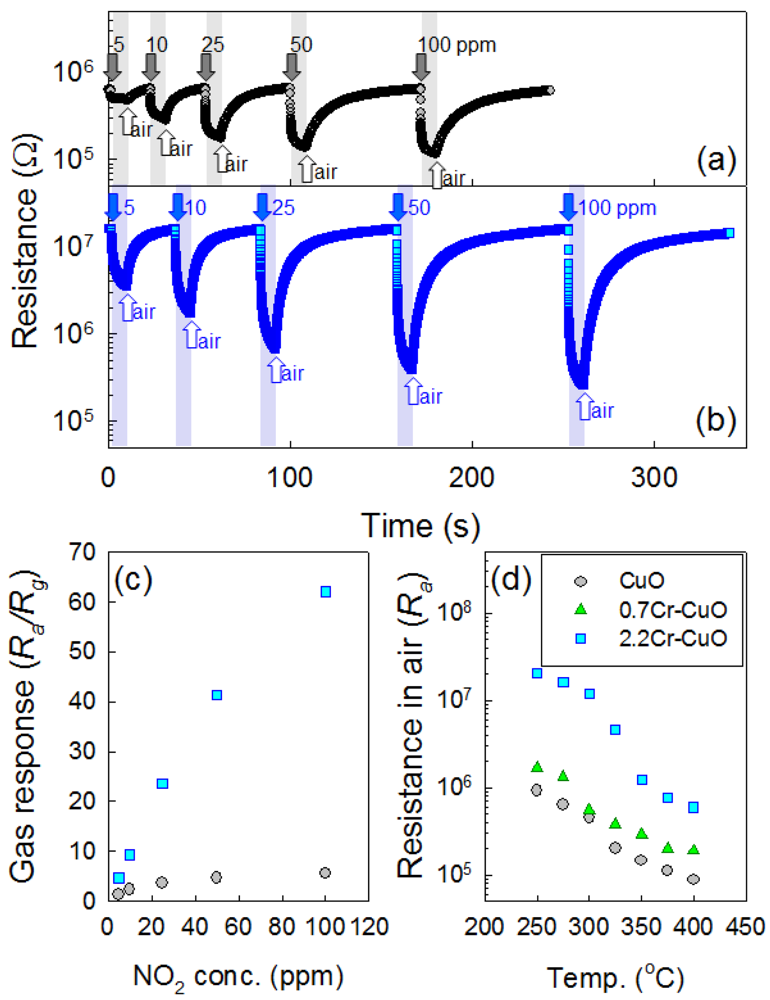
Although the 2.2Cr-CuO nanorods showed the highest response to NO2 at 250 °C, the responses and recoveries of the sensors were sluggish. For example, the 90% response time upon exposure to 100 ppm NO2 at 250 °C was ∼10 min. Accordingly, the operation temperature of the sensor was elevated slightly to 275 °C to enhance the sensing speed without significantly sacrificing the NO2 response. The dynamic sensing transients of the CuO nanosheets and 2.2Cr-CuO nanorods over the range 5–100 ppm NO2 at 275 °C (Figure 7(a,b)) showed decreases in their resistances and recoveries upon exposure to NO2 and air, respectively. The responses over the range 5–100 ppm NO2 of the 2.2Cr-CuO nanorods were in the range 4.6–62.1, while those of the undoped CuO nanosheets were in the range of 1.3–5.5. The NO2 response values of the 2.2Cr-CuO nanorods in the present study were among the highest values reported in the literature for CuO nanostructures [15,18,19]. This confirms again that Cr doping is very effective for enhancing the NO2 response of CuO (Figure 7(c)).
The gas response and selectivity of oxide semiconductors are related to various parameters such as their dimensions [6,7], morphologies of the oxide nanostructures [8], donor concentrations [9], charge carrier depletion/accumulation near the surface [4,5], sensing material composition [24,25], and catalyst loading [10]. In the present study, the variations in morphology, charge carrier concentrations, and catalytic effects due to Cr doping were found to change the gas sensing characteristics of the CuO nanostructures.
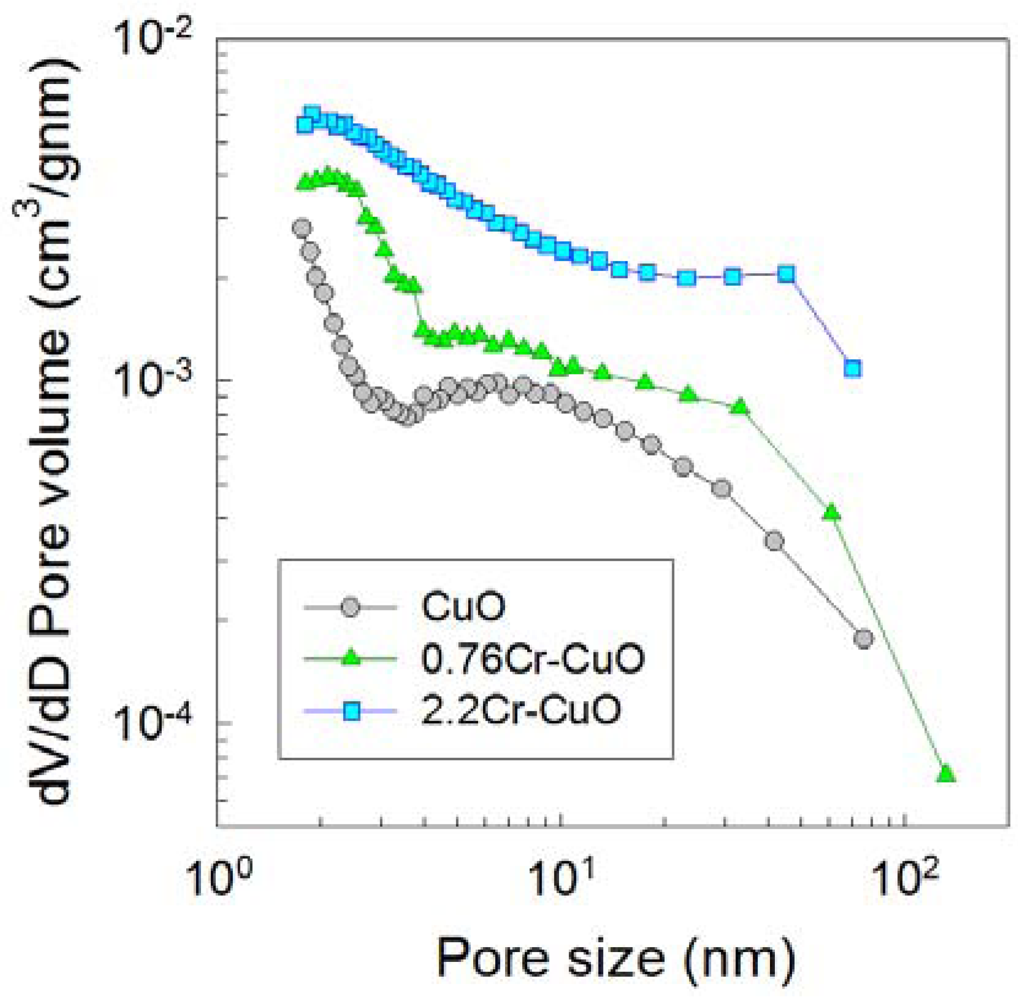
The pore sizes, volume distributions, and surface areas were analyzed by measuring nitrogen adsorption-desorption isotherms (Figure 8). The surface areas of the CuO, 0.76Cr-CuO, and 2.2Cr-CuO nanostructures after heat treatment at 500 °C for 1 h were 19.8, 22.3, and 42.3 m2/g, respectively. Note that the pore volumes over the entire pore size range increased with an increase in the Cr doping concentration, indicating that the increase in both the surface area to volume ratio and gas accessibility due to Cr doping can be considered as one of the important reasons to enhance the gas response of the CuO nanostructures.
In order to investigate the incorporation of Cr into the CuO nanostructures and its consequent effect on the charge carrier concentrations, the resistances in air (Ra) of the sensors were measured as a function of sensor temperature (Figure 7(d)). The Ra values of all three sensors showed monotonic decreases with increasing temperature, indicating that the thermally activated generation of holes occurred. At the constant sensing temperature, the Ra values increased with increased doping concentration of Cr (Figure 7(d)) and these tendencies were reproducible even when considering the fluctuation in the resistances of the sensors. The ionic radius of Cu2+ at the coordination numbers (CN) of 4 and 6 are 0.71 Å and 0.87 Å, respectively [26]. Although the ionic radius Cr3+ at CN = 4 in not available in the literature, it is likely to be smaller than Cu2+ at CN = 4 considering the ionic radius of Cr3+ at CN = 6 (0.755 Å) [26]. High Ra values and the absence of Cr2O3 peak in the 2.2Cr-CuO nanorods strongly suggests the incorporation of Cr into the CuO lattice, although further study is necessary to confirm this. However, the possibility for the presence of small concentration of Cr2O3 or Cr-containing second phase below the detection limit of X-ray diffraction cannot be excluded. In p-type oxide semiconductors, the adsorption of negatively charged oxygen results in the formation of a hole accumulation layer near the surface [5]. The reaction between reducing gases and negatively charged surface oxygen releases the electrons, which thins the hole accumulation layer via electron-hole recombination and increases the resistance of the sensor. In contrast, the resistance of the sensor becomes lower upon exposure to oxidizing gas due to the thickening of the hole accumulation layer. If the hole accumulation layer in air is relatively thick, the variation in resistance of the sensor upon exposure to oxidizing gas or reducing gas should not be high because the thicker or less thick charge accumulation layers near the surface do not cause significant changes in conduction. In contrast, if the charge accumulation layer in air is very thin, thickening or further thinning of the hole accumulation layer upon exposure to oxidizing and reducing gases will lead to relatively high variation in the–resistance of the sensor. From this viewpoint, the enhancement of responses to NO2 and reducing gases by Cr doping as shown in Figure 5 can be explained in part by the incorporation of Cr3+ into the CuO lattice and the consequent decrease in its charge carrier (hole) concentration.
The effect of Cr doping on the selectivity of NO2 detection was also assessed. From the results shown in Figure 5, the ratio between the response to 100 ppm NO2 and that to other gases (SNO2/Sgas = (Ra/RNO2)/(Rgas/Ra)) was calculated as a measure of NO2 selectivity. The SNO2/Sgas values (gases: 100 ppm C2H5OH, NH3, TMA, C3H8, and CO) of the 2.2Cr-CuO nanorods ranged from 7.7 to 91.3, which were significantly higher than those of the pure CuO nanosheets (1.1–4.7) and the pure CuO nanosheets (2.9–7.0). This strongly indicates that Cr oxide acts as a catalyst to promote the NO2 sensing reaction. NO2 is known to adsorb onto the surface of Cr2O3, and it dissociates into NO and oxygen [27]. Considering that the adsorption of NO2 in the form of NO− or NO2− leads to chemiresistive variation in oxide semiconductors [28–30], the promotion of NO2 sensing reaction can be explained in part by the enhanced NO2 dissociation reaction due to the catalytic function of the Cr-component or Cr-containing second phase below the detection limit of X-ray diffraction. When a single component gas is measured using semiconductor gas sensors, the oxidizing gas such as NO2 and other reducing gases can be easily discriminated due to their opposite direction of chemiresistive variation. However, when the mixture between oxidizing and reducing gases should be measured, the situation becomes more complex. As a representative example for this issue will be ‘air quality sensor’ to control air intake from outside to the automotive cabin in an automatic manner. In general, CO and NO2 are measured to determine the presence of pollutant emitting gasoline and diesel vehicles, respectively [31]. In p-type oxide semiconductors, when both of diesel and gasoline engines emit NO2 and CO, the decrease of sensor resistance by NO2 can be nullified by the increase of sensor resistance by CO, which can lead to the malfunction of the sensor. Accordingly, the 24.1-fold enhancement of the NO2 response by Cr-doping in the present study, which is significantly higher than the 2.8-fold enhancement of the CO, can be used to detect the presence of pollutant emitting diesel vehicles with the minimum disturbance by CO emitted from gasoline vehicles. The increase in the SNO2/Sgas values due to Cr doping in the present study, accordingly, can enable the selective detection of NO2 with minimum cross-responses from reducing gases.
Finally, the long-term stability of sensor is very important for the real applications. Sysoev et al. [32] reported that SnO2 nanowires prepared at 950 °C by vapor-solid method are more stable during long-term sensor operation at 300 °C than SnO2 nanoparticles (diameter: ∼4 nm) heat treated at 400 °C. Considering the small size of SnO2 nanoparticles and low heat treatment temperature, the degradation of sensing characteristics in SnO2 nanoparticles can be attributed to the sintering and aggregation between primary particles. In the present study, the morphologies of nanosheets or nanorods in Cr-doped CuO nanorods remained similar even after heat treatment at 500 °C. Moreover, taking into account that the optimum sensor temperature for NO2 detection (250–275 °C) is significantly lower than the temperature for heat treatment (500 °C), the present sensor can be regarded as thermally stable although the degradation of sensor by long-term exposure to NO2 should be examined further.
4. Conclusions
Various morphologies of highly crystalline pure and Cr-doped CuO nanostructures such as CuO nanosheets, Cr-doped CuO nanosheets, and Cr-doped CuO nanorods were prepared by heating slurry solutions containing Cu-hydroxide/Cr-hydroxide, and their gas sensing characteristics were investigated. Doping CuO nanostructures with 2.2 at% Cr enhanced the NO2 response to 24.1 times and significantly increased the NO2 selectivity. Enhancement of the NO2 response and selectivity of 2.2 at% Cr-doped CuO nanorods was attributed to increase in surface area and pore volume, the electronic sensitization due to the incorporation of Cr into the CuO lattice, and the catalytic function of Cr. Cr-doped CuO nanorods are an effective solution to detect NO2 in a selective manner with minimum cross-responses to C2H5OH, NH3, trimethylamine, C3H8 and CO.
Acknowledgments
This work was supported by KOSEF NRL program grant funded by the Korean government (MEST) (No.R0A-2008-000-20032-0) and the Fundamental R&D program for Core Technology of Materials (M2008010013) funded by Ministry of Knowledge Economy.
References
- Yamazoe, N. Toward innovations of gas sensor technology. Sens. Actuators B Chem. 2005, 108, 2–14. [Google Scholar]
- Franke, M.E.; Koplin, T.J.; Simon, U. Metal and metal oxide nanoparticles in chemiresistors: Does the nanoscale matter? Small 2006, 2, 36–50. [Google Scholar]
- Shimizu, Y.; Egashira, M. Basic aspects and challenges of semiconductor gas sensors. MRS Bull. 1999, 24, 18–24. [Google Scholar]
- Barsan, N.; Weimar, N. Conduction model of metal oxide gas sensors. J. Electroceram. 2001, 7, 143–167. [Google Scholar]
- Pokhrel, S.; Simon, C.E.; Quemener, V.; Barsan, N.; Weimar, U. Investigation of conduction mechanism in Cr2O3 gas sensing thick films by ac impedance spectroscopy and work function changes measurement. Sens. Actuators B Chem. 2008, 133, 78–83. [Google Scholar]
- Xu, C.N.; Tamaki, J.; Miura, N.; Yamazoe, N. Grain size effects on gas sensitivity of porous SnO2-based elements. Sens. Actuators B Chem. 1991, 3, 147–155. [Google Scholar]
- Rothschild, A. The effect of grain size on the sensitivity of nanocrystalline metal-oxide gas sensors. J. Appl. Phys. 2004, 95, 6374–6380. [Google Scholar]
- Lee, J.-H. Gas sensors using hierarchical and hollow oxide nanostructures: Overview. Sens. Actuators B Chem. 2009, 140, 319–336. [Google Scholar]
- Yamazoe, N.; Shimanoe, K. New perspective of gas sensor technology. Sens. Actuators B Chem. 2009, 138, 100–107. [Google Scholar]
- Kim, S.-J.; Hwang, I.-S.; Na, C.W.; Kim, I.-D.; Kang, Y.C.; Lee, J.-H. Ultrasensitive and selective C2H5OH sensors using Rh-loaded In2O3 hollow spheres. J. Mater. Chem. 2011, 21, 18560–18567. [Google Scholar]
- Hwang, I.-S.; Kim, Y.-S.; Kim, S.-J.; Ju, B.-K.; Lee, J.-H. A facile fabrication of semiconductor nanowires gas sensor using PDMS patterning and solution deposition. Sens. Actuators B Chem. 2009, 136, 224–229. [Google Scholar]
- Singh, I.; Bedi, R.K. Studies and correlation among the structural, electrical and gas response properties of aerosol spray deposited self-assembled nanocrystalline CuO. Appl. Surf. Sci. 2011, 257, 7592–7599. [Google Scholar]
- Barreca, D.; Comini, E.; Gasparotto, A.; Maccato, C.; Sada, C.; Sberveglieri, G.; Tondello, E. Chemical vapor deposition of copper oxide films and entangled quasi-1D nanoarchitectures as innovative gas sensors. Sens. Actuators B Chem. 2009, 141, 270–275. [Google Scholar]
- Singh, I.; Bedi, R.K. Surfactant-assisted synthesis, characterizations, and room temperature ammonia sensing mechanism of nanocrystalline CuO. Solid State Sci. 2011, 13, 2011–2018. [Google Scholar]
- Li, Y.; Liang, J.; Tao, Z.; Chen, J. CuO particles and plates: Synthesis and gas-sensor application. Mater. Res. Bull. 2008, 43, 2380–2385. [Google Scholar]
- Aslani, A.; Oroojpour, V. CO gas sensing of CuO nanostructures, synthesized by an assisted solvothermal wet chemical route. Physica B 2011, 406, 144–149. [Google Scholar]
- Li, X.; Wang, Y.; Lei, Y.; Gu, Z. Highly sensitive H2S sensor based on template-synthesized CuO nanowires. RSC Adv. 2012, 2, 2302–2307. [Google Scholar]
- Li, D.; Hu, J.; Wu, R.; Lu, J.G. Conductometric chemical sensor based on individual CuO nanowires. Nanotechnology 2010, 21, 485–502. [Google Scholar]
- Kim, Y.-S.; Hwang, I.-S.; Kim, S.-J.; Lee, C.-Y.; Lee, J.-H. CuO nanowire gas sensors for air quality control in automotive cabin. Sens. Actuators B Chem. 2008, 135, 298–303. [Google Scholar]
- Yang, C.; Su, X.; Xiao, F.; Jian, J.; Wang, J. Gas sensing properties of CuO nanorods synthesized by a microwave-assisted hydrothermal method. Sens. Actuators B Chem. 2011, 158, 299–303. [Google Scholar]
- Gou, X.; Wang, G.; Yang, J.; Park, J.; Wexler, D. Chemical synthesis, characterization, and gas sensing performance of copper oxide nanoribbons. J. Mater. Chem. 2008, 18, 965–969. [Google Scholar]
- Liu, X.; Zhang, J.; Kang, Y.; Wu, S.; Wang, S. Brochantite tabular microspindles and their conversion to wormlike CuO structures for gas sensing. CrystEngComm 2012, 14, 620–625. [Google Scholar]
- Zhu, G.; Xu, H.; Xiao, Y.; Liu, Y.; Yuan, A.; Shen, X. Facile fabrication and enhanced sensing properties of hierarchically porous CuO architectures. ACS Appl. Mater. Eng. 2012, 4, 744–751. [Google Scholar]
- Kim, K.-W.; Cho, P.-S.; Kim, S.-J.; Lee, J.-H.; Kang, C.-Y.; Kim, J.-S.; Yoon, S.-J. The selective detection of C2H5OH using SnO2-ZnO thin film gas sensors prepared by combinatorial solution deposition. Sens. Actuators B Chem. 2007, 123, 318–324. [Google Scholar]
- Kim, S.-J.; Hwang, I.-S.; Kang, Y.C.; Lee, J.-H. Design of selective gas sensors using additive-loaded In2O3 hollow spheres prepared by combinatorial hydrothermal reactions. Sensors 2011, 11, 10603–10614. [Google Scholar]
- Lide, D.R. References. In Handbook of Chemistry and Physics, 86th ed.; Taylor & Francis: New York, NY, USA, 2005; p. 12. [Google Scholar]
- Xu, C.; Hassel, M.; Kuhlenbeck, H.; Freund, H.-J. Adsorption and reaction on oxide surfaces: NO, NO2 on Cr2O3 (111)/Cr(110). Surf. Sci. 1991, 258, 23–24. [Google Scholar]
- Baratto, C.; Comini, E.; Faglia, G.; Sberveglieri, G.; Zha, M.; Zappettini, A. Metal oxide nano-crystals for gas sensing. Sens. Actuators B Chem. 2005, 109, 2–6. [Google Scholar]
- Yamazoe, N.; Shimanoe, K. Theory of power laws for semiconductor gas sensors. Sens. Actuators B Chem. 2008, 128, 566–573. [Google Scholar]
- Epifani, M.; Prades, J.D.; Comini, E.; Pellicer, E.; Avella, M.; Sicilliano, P.; Faglia, G.; Cirera, A.; Scotti, R.; Morazzoni, F.; Morante, J.R. The role of surface oxygen vacancies in the NO2 sensing properties of SnO2 nanocrystals. J. Phys. Chem. 2008, 112, 19540–19546. [Google Scholar]
- Nakagawa, H.; Okazaki, S.; Asakura, S.; Fukuda, F.; Akimoto, H.; Takahashi, S.; Shigemori, A. An automated car ventilation system. Sens. Actuators B Chem. 2008, 65, 133–137. [Google Scholar]
- Sysoev, V.V.; Schneider, T.; Goschnick, J.; Kiselev, I.; Habicht, W.; Hahn, H.; Strelcov, E.; Kolmakov, A. Percolating SnO2 nanowire network as a stable gas sensor: Direct comparison of long-term performance versus SnO2 nanoparticle films. Sens. Actuators B Chem. 2009, 139, 609–703. [Google Scholar]


© 2012 by the authors; licensee MDPI, Basel, Switzerland. This article is an open access article distributed under the terms and conditions of the Creative Commons Attribution license (http://creativecommons.org/licenses/by/3.0/).
Share and Cite
Kim, K.-M.; Jeong, H.-M.; Kim, H.-R.; Choi, K.-I.; Kim, H.-J.; Lee, J.-H. Selective Detection of NO2 Using Cr-Doped CuO Nanorods. Sensors 2012, 12, 8013-8025. https://doi.org/10.3390/s120608013
Kim K-M, Jeong H-M, Kim H-R, Choi K-I, Kim H-J, Lee J-H. Selective Detection of NO2 Using Cr-Doped CuO Nanorods. Sensors. 2012; 12(6):8013-8025. https://doi.org/10.3390/s120608013
Chicago/Turabian StyleKim, Kang-Min, Hyun-Mook Jeong, Hae-Ryong Kim, Kwon-Il Choi, Hyo-Joong Kim, and Jong-Heun Lee. 2012. "Selective Detection of NO2 Using Cr-Doped CuO Nanorods" Sensors 12, no. 6: 8013-8025. https://doi.org/10.3390/s120608013