Contactless Impedance Sensors and Their Application to Flow Measurements

Abstract
: The paper provides a critical discussion of the present state of the theory of high-frequency impedance sensors (now mostly called contactless impedance or conductivity sensors), the principal approaches employed in designing impedance flow-through cells and their operational parameters. In addition to characterization of traditional types of impedance sensors, the article is concerned with the use of less common sensors, such as cells with wire electrodes or planar cells. There is a detailed discussion of the effect of the individual operational parameters (width and shape of the electrodes, detection gap, frequency and amplitude of the input signal) on the response of the detector. The most important problems to be resolved in coupling these devices with flow-through measurements in the liquid phase are also discussed. Examples are given of cell designs for continuous flow and flow-injection analyses and of detection systems for miniaturized liquid chromatography and capillary electrophoresis. New directions for the use of these sensors in molecular biology and chemical reactors and some directions for future development are outlined.1. Introduction
The rapidly growing demands on sensing, detection, and determination of a vast variety of compounds in wide ranges of test systems under very different conditions emphasize the need for intense methodological research. To meet these requirements, all imaginable measuring principles are being tested and, where possible, developed and applied. A good example is the revitalization of high-frequency measurement of the electrical impedance of test systems. This principle is, in fact, rather old; for reviews see, e.g., references [1,2]. However, its analytical application was rare and mostly limited to high-frequency titrations and to some determinations of water in non-aqueous samples. Renewed interest in these measurements emerged quite recently (during the nineteen nineties), primarily for several reasons:
Technical developments have made measurements simple, flexible and cheap;
The use of substantially lower frequencies of the applied signal has led to better definition of the output, which is more easily interpreted;
Rapidly developing high-performance separations in the liquid phase, especially those on a microscale or on chips, require appropriate detection techniques;
The universal detection character and the separation of the sensing elements from the test medium make the technique attractive for analyses of complex mixtures of similar analytes.
High-frequency impedance detection, now mostly called “capacitively coupled contactless conductivity detection”, abbreviated as C4D, is mostly employed for detection in capillary zone electrophoresis (CE); reviews of recent developments in this field can be found, e.g., in references [3–8]. The present paper deals with less traditional geometric arrangements of the detection cells and applications of contactless impedance detectors. The results obtained primarily in the authors' laboratories are critically discussed and assessed in the context of global research. Some tentative directions for the future are also outlined.
2. Basic Theoretical Considerations
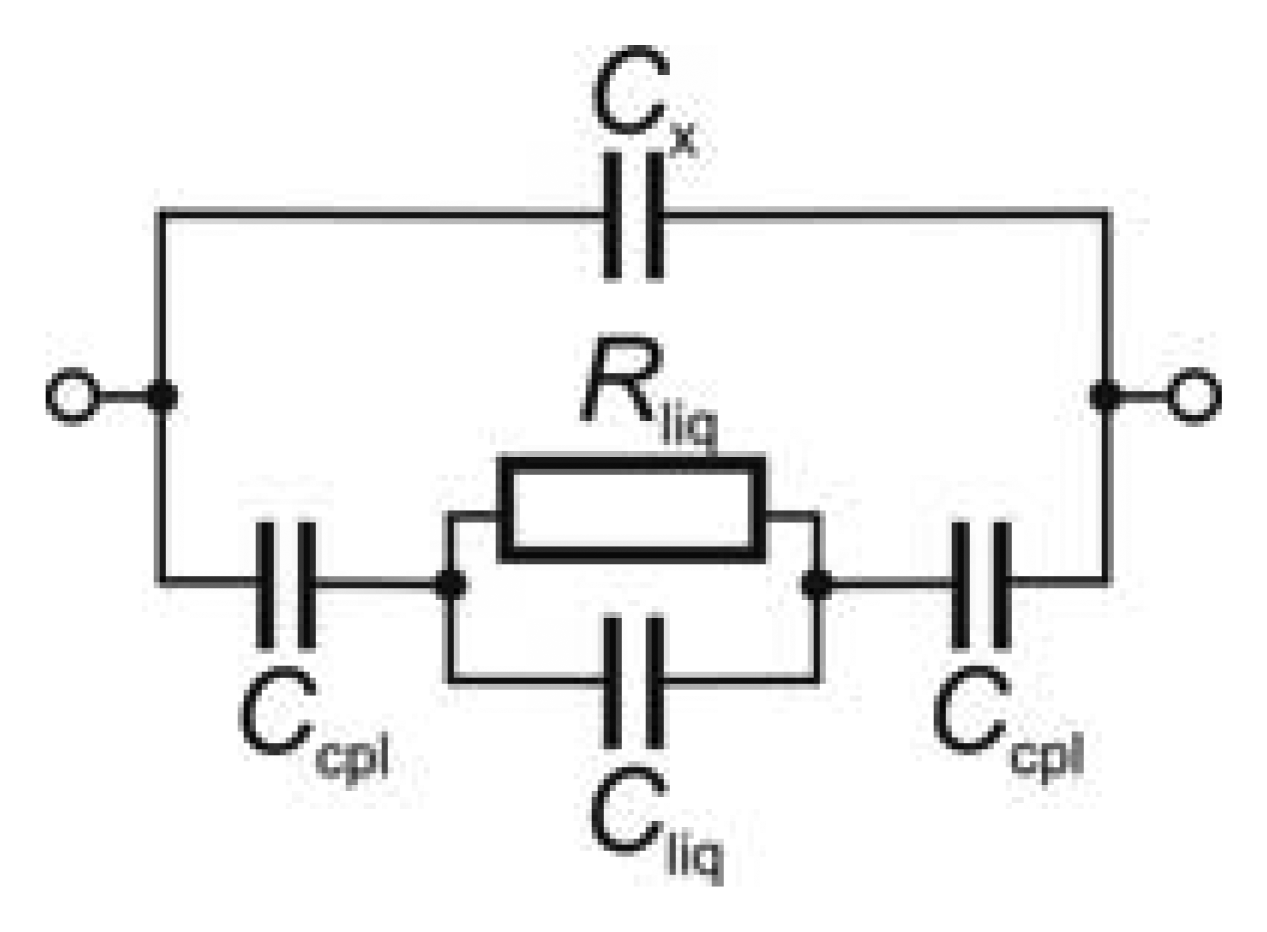
A simplified electric equivalent circuit of a contactless impedance cell, permitting sufficiently detailed theoretical description of the cell operation, is depicted in Figure 1. A high-frequency alternating (usually sine-wave) voltage is applied to one electrode and the interaction of the alternating electrical field with the test medium is monitored at the other electrode, usually in the form of an alternating current signal. The two electrodes are separated from the test medium (usually liquid) by a dielectric layer and represent two capacitors characterized by coupling capacitance Ccpl; Ccpl depends predominantly on the thickness and permittivity of the dielectric layer. The electrical behaviour of the test medium appears as a parallel combination of the liquid resistance (Rliq) and the liquid capacitance (Cliq). Part of the electrical energy applied always strays from the test medium, passes along the surface of the dielectric or through its interior and appears as stray (parasitic) capacitance Cx, parallel to the main passageway. The parasitic effect of the stray capacitance is sometimes eliminated by placing a shielding foil between the electrodes [9,10].
The analytical signal is given by the cell impedance, Z, defined by the familiar general equation:
It can be seen that the cell behavior depends on a number of experimental parameters and it should be emphasized that all these parameters affect one another, so that they must be considered together when studying the behavior of a particular cell under particular conditions. It is also evident that the set of experimental conditions determines whether the resistance term of Equation (1) predominates—this is the case of the contactless conductivity detection which is mostly used at present, or the capacitance is more important (dielectrometry).
The impedance of the electric equivalent circuit in Figure 1 can be calculated from Equation (2):
If Rliq ≪ (−i/ωCliq), the effect of the solution capacitance can be neglected, Equation (3) is simplified to Z1 = Rliq − 2i/ωCcpl and the sensor works primarily as a conductivity detector. If Rliq ≫ (−i/ωCliq), the effect of the solution resistivity can be neglected, Equation (3) is simplified to Z1 = −i/Cliq − 2i/ωCcpl and the sensor works primarily as a dielectrometric detector.
Z2 is the impedance determined by stray capacitance Cx (upper branch of equivalent circuit):
The analytical signal is given by the difference, ΔZ, between the impedance obtained in the presence of the analyte within the cell, ZA, and that of the cell containing only a carrier medium, ZE:
The measured quantity is usually the alternating current:
3. Design of Impedance Cells
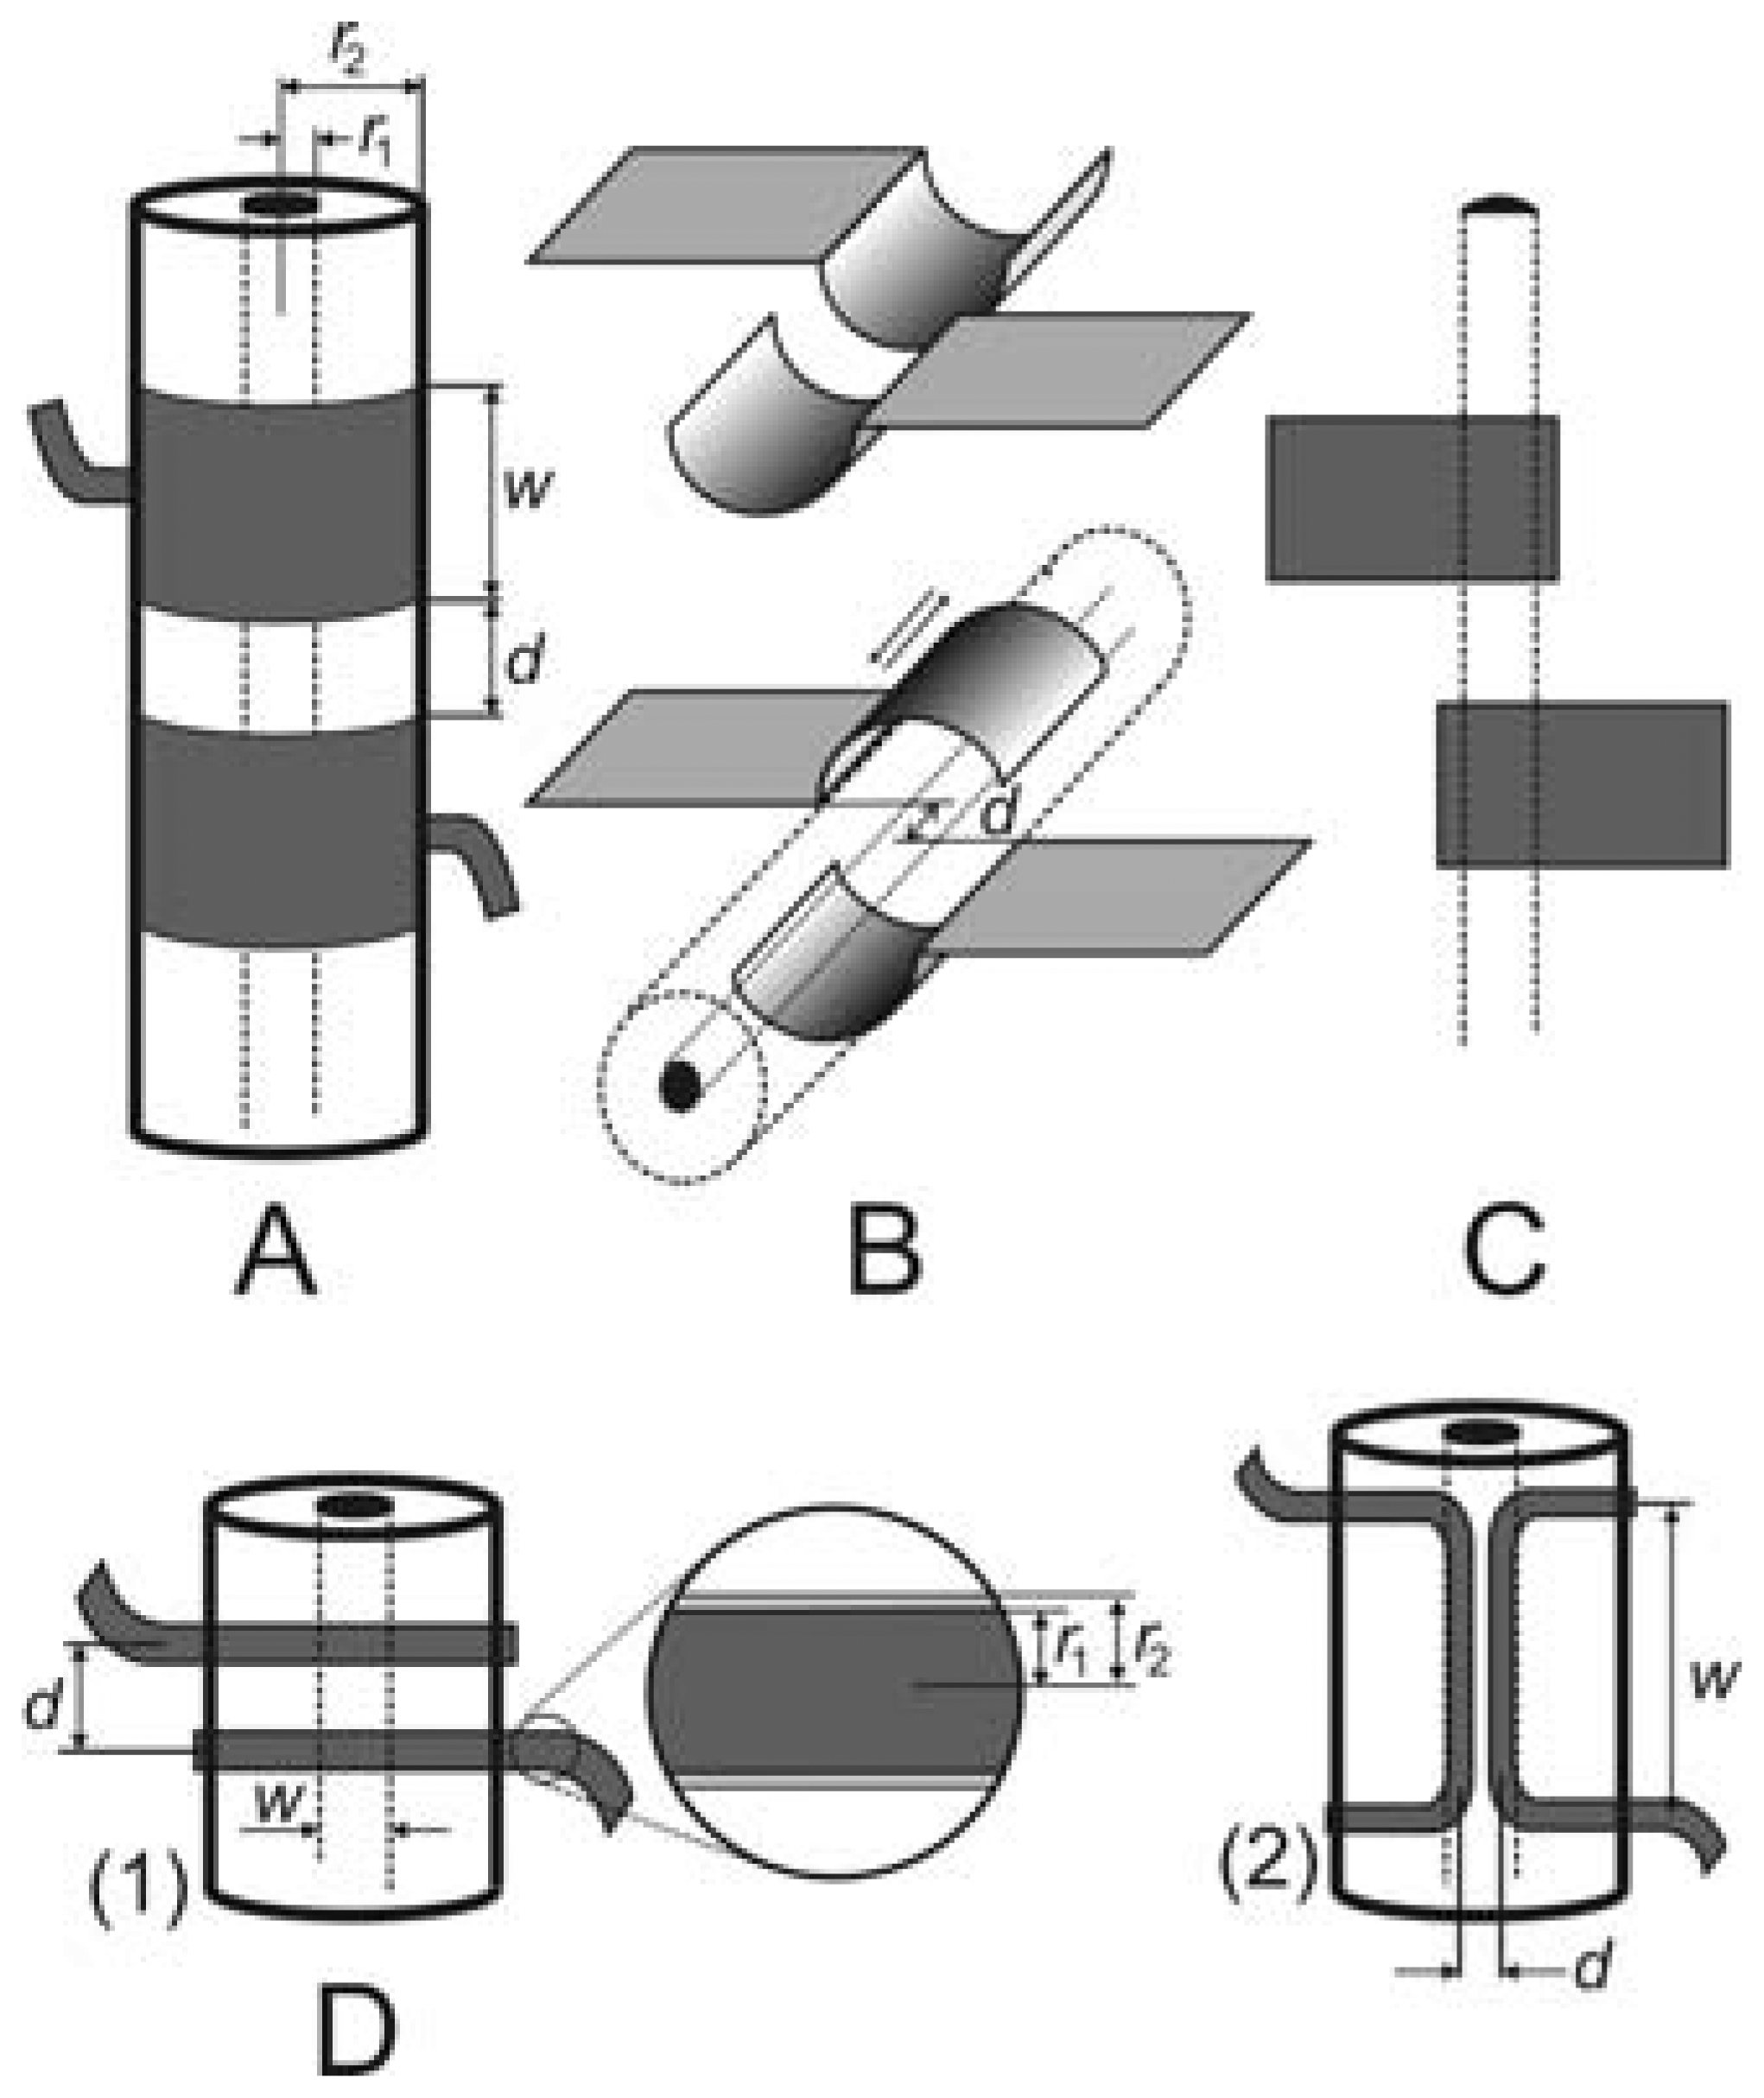
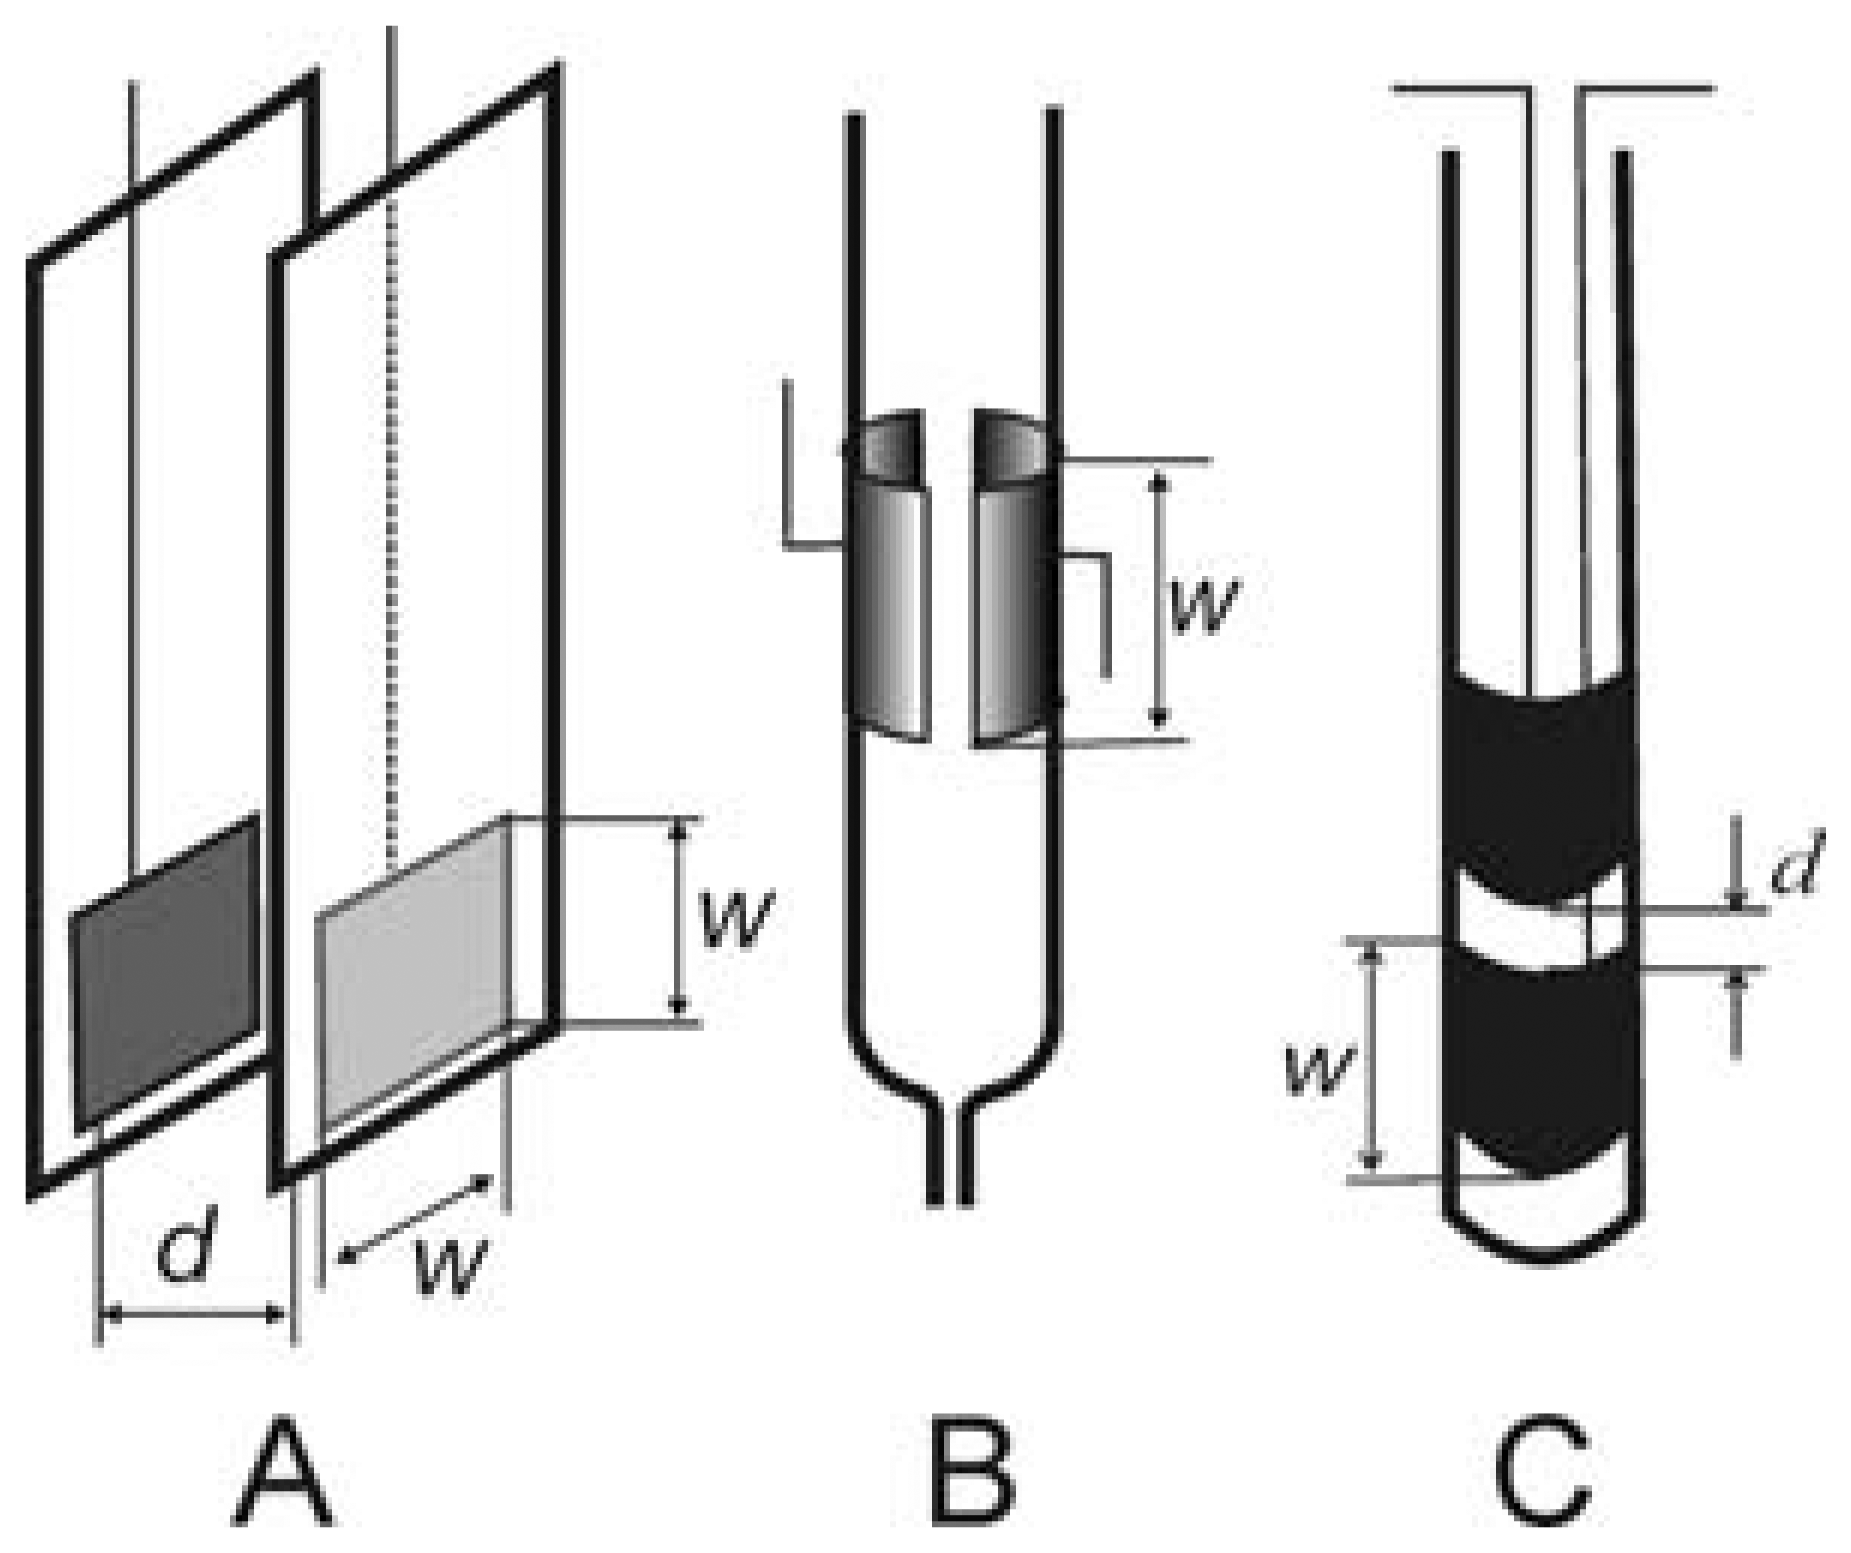
Typical examples of the cell geometries discussed in this paper can be seen in Figures 2 and 3; the test solution either flows through the cell (Figures 2 and 3B) or the cell is immersed in the solution (Figure 3A,C). Tubular systems (Figure 2A) are common in flow-through applications, primarily liquid chromatography and capillary electrophoresis. Semitubular electrodes (Figure 2B) can also be used with advantage in these methods (see Section 4.1). Planar geometries (Figure 2C) are useful in microfluidic systems, e.g., chip electrophoresis, or lab-on-the-chip systems. Further geometric arrangements have also been studied, e.g., a pair of thin insulated wires placed inside tubing containing the test solution (Figure 2D).
The cell geometric arrangements mentioned above are primarily employed in conductometric detection. The cells in Figure 3 are predominantly used for dielectrometric detection: a pair of insulated planar electrodes placed opposite one another at a short distance (Figure 3A), tubular flow-through cell with electrodes placed on the outside wall of the tube (Figure 3B) or cylindrical dipping cell with electrodes protected from direct contact with the test environment by plastic foil (Figure 3C). It should be added that the separation of the detection cells into conductometric a dielectrometric is only illustrative. The conductivity or dielectrometric behavior of the detector depends on the geometry of the cell employed and also on a number of other parameters, such as the thickness and permittivity of the dielectric employed, the specific conductivity and the permittivity of the measured solution and the frequency of the input signal.
The detector electronics used is mostly based on the measuring principle described in one of the first papers at the beginning of the renaissance of contactless conductivity detection in capillary electrophoresis [11]. An alternating voltage produced by a function generator is fed to one of the detection cell electrodes and the electric current passing through the cell is monitored at the other electrode, using a current-voltage converter. The analytical signal—a voltage dependent on the cell impedance—is displayed after processing and amplification. The electronic circuitry is mostly assembled using operational amplifiers. The electronic circuit has recently been improved using modern electronic components [12].
The other approach to the monitoring of the cell signal was described in reference [13]. An un-modulated or an amplitude-modulated alternating voltage was applied to the tubular cell, and the AC current passing through the cell was treated by a TDA 1072A integrated circuit originally designed for application to medium-wave AM (amplitude modulated) radio receivers. The obtained signal depended on the conductivity of the solution inside the cell. Under optimum conditions, the solution conductance was measured in a range from ca. 10 to 700 μs cm−1. This detector was used to measure the conductivities of various drinking waters and the values obtained were in a good agreement with those obtained from a commercial contact conductometer.
Tubular geometries (Figure 2A) have so far been studied most thoroughly; the Rliq and Ccpl values in Equation (3) can be expressed as:
4. Operational Parameters of Impedance Cells
4.1. The Effect of the Electrode Shape on the Signal Measured
As mentioned above, tubular cell geometries are mostly used for detection in flowing liquids. Our measurements [14,15] have demonstrated that the replacement of classical tubular electrodes (Figure 2A) by semitubular ones (Figure 2B) leads to negligible changes in the detector parameters and offers certain advantages. The metal foil semitubular electrodes were cemented in a groove made in a plexiglass plate. The groove dimension exactly matched the outer diameter of the analytical separation capillary, which was tightly pressed into the channel by an auxiliary plate. This arrangement enables ready replacement of the capillary if necessary. There is no air gap between the capillary surface and the electrodes that would contribute to the detector noise [10]. Tight coupling between the electrodes and the capillary surface can also be achieved in the tubular arrangement if the electrodes are made of conducting lacquer which is painted around the capillary [11,16]; in this case, the electrodes become a non-detachable part of the capillary.
It has also been shown that even planar electrodes can be used, with the separation capillary pressed onto them [15]. The design is so simple that the electrodes can be created directly on the printed board containing the detector electronics. The detector sensitivity is not decreased substantially and amounts to approximately one half that obtained with tubular electrodes. A thin aluminum foil can be used to advantage to prepare the electrodes for these detectors. These electrodes, similar to those prepared on the capillary surface using conductive lacquers, are very thin and thus the parasitic signal transfer between them outside the test solution is small. Therefore, there is no need to place a shielding foil between the electrodes, which is often necessary when using thicker tubular electrodes. Shielding foil minimizes the stray capacitance but does not eliminate it completely [10]. Moreover, it makes the cells more complicated and makes it difficult to implement simultaneous optical detection between the electrodes.
These aluminium foil electrodes have also been successfully used for detection in electrophoretic separations on a chip [17,18]. In this case, two planar electrodes are placed side by side on the outer wall of the chip lid, close to the output end of the separation channel (similar to the arrangement depicted in Figure 2C).
4.2. The Effect of the Electrode Width
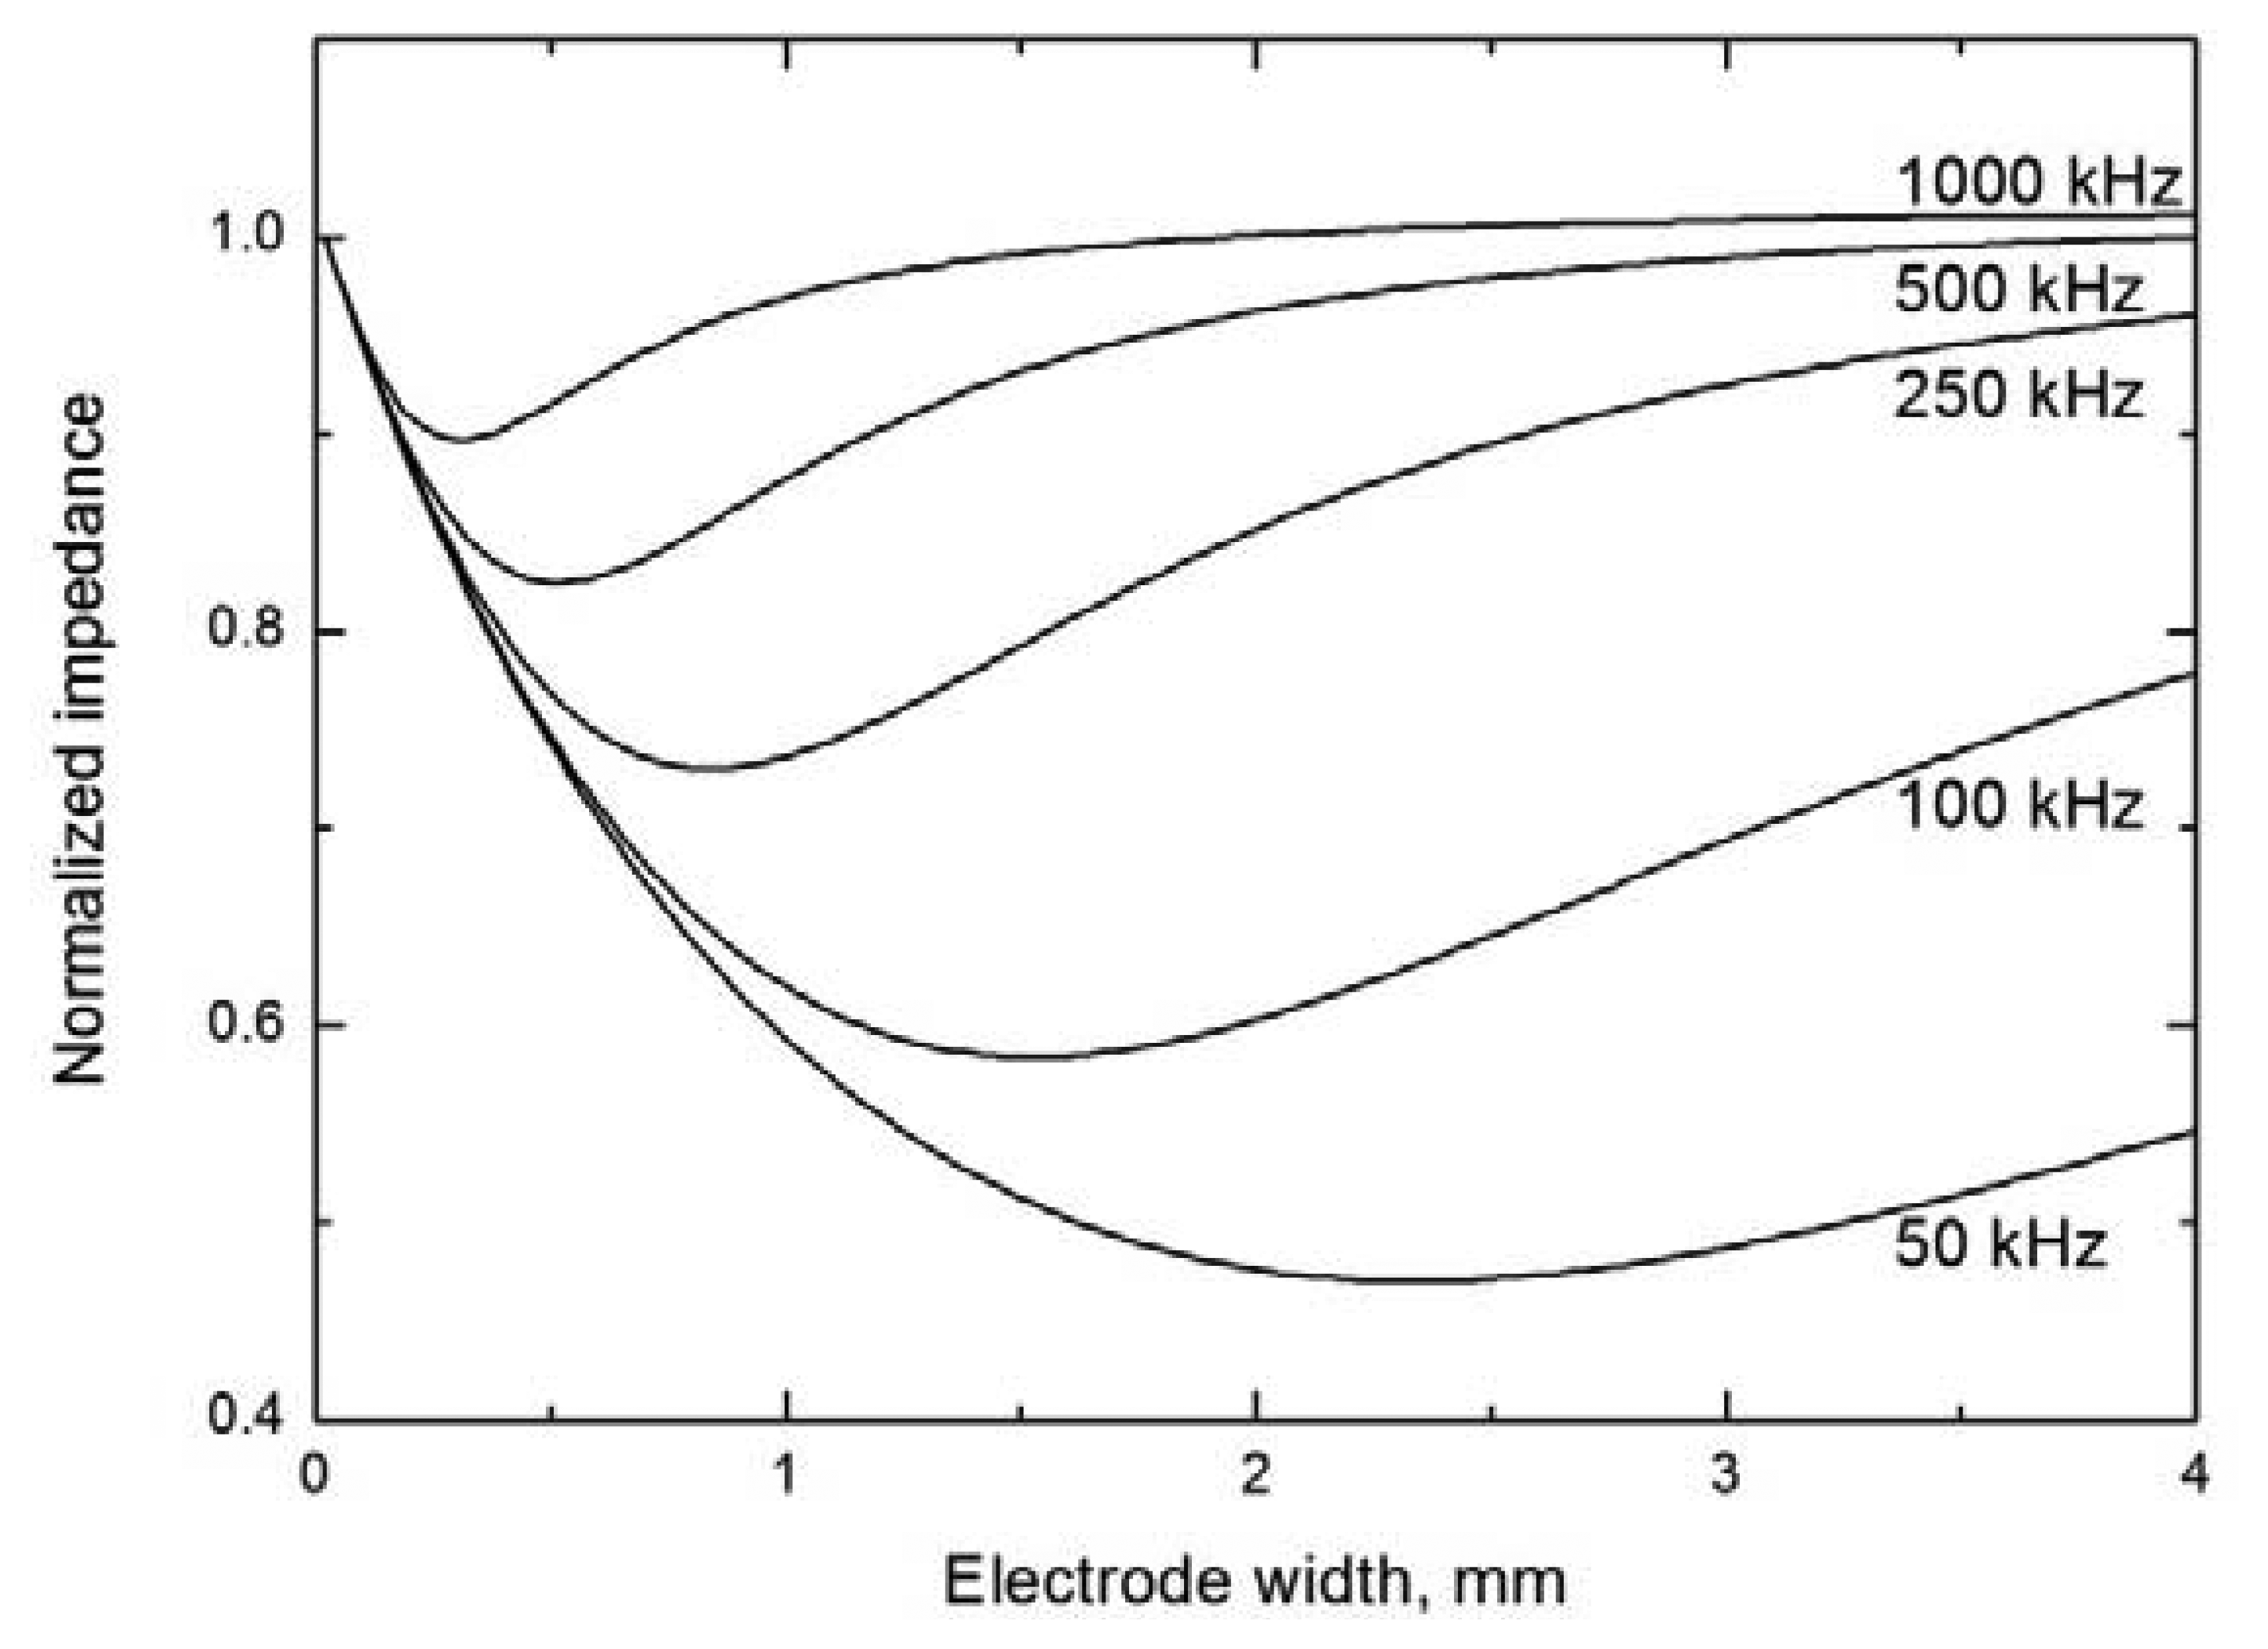
It has been found [16] that the width of tubular electrodes (Figure 2A) has a small effect on the magnitude of the measured signal. On the other hand, the optimum applied voltage frequency strongly depends on the electrode width and equals from about 400 to 600 kHz for narrow (2 mm) electrodes [11,19] and is substantially lower for wider ones, 20 to 40 kHz [16] or 40 to 100 kHz [20] for electrodes 15 to 50 mm wide, respectively. These observations should be explained by theoretical model based on the solution of the equivalent circuit (Figure 1) with the electrode width as a variable. The performed simulation (see Figure 4) indicates that the dependence of the cell impedance on the electrode width passes through a minimum and the current signal follows a trajectory characterized by the lowest impedance on passage through the cell. Consequently, the signal does not pass through the whole electrode width, w, but only through a small part called the effective width, weff[21]. It can be seen in Figure 4 that the effective electrode width significantly varies with varying signal frequency, decreasing with increasing frequency. Its value is smaller than 1 mm for frequencies above 200 kHz and reaches only tenths of a millimetre at frequencies around 1 MHz. For this reason, the effective width is often neglected and the only gap is considered in expression of the cell resistance Rliq. The overall length of the detection space equals 2 weff + d and determines the effective detector volume, which depends on the signal frequency. Cells with narrow electrodes can be used at high frequencies without decreasing the detection sensitivity; wide electrodes permit the use of lower frequencies. These conclusions are confirmed by the results published in reference [22].
4.3. The Effect of the Gap between the Electrodes
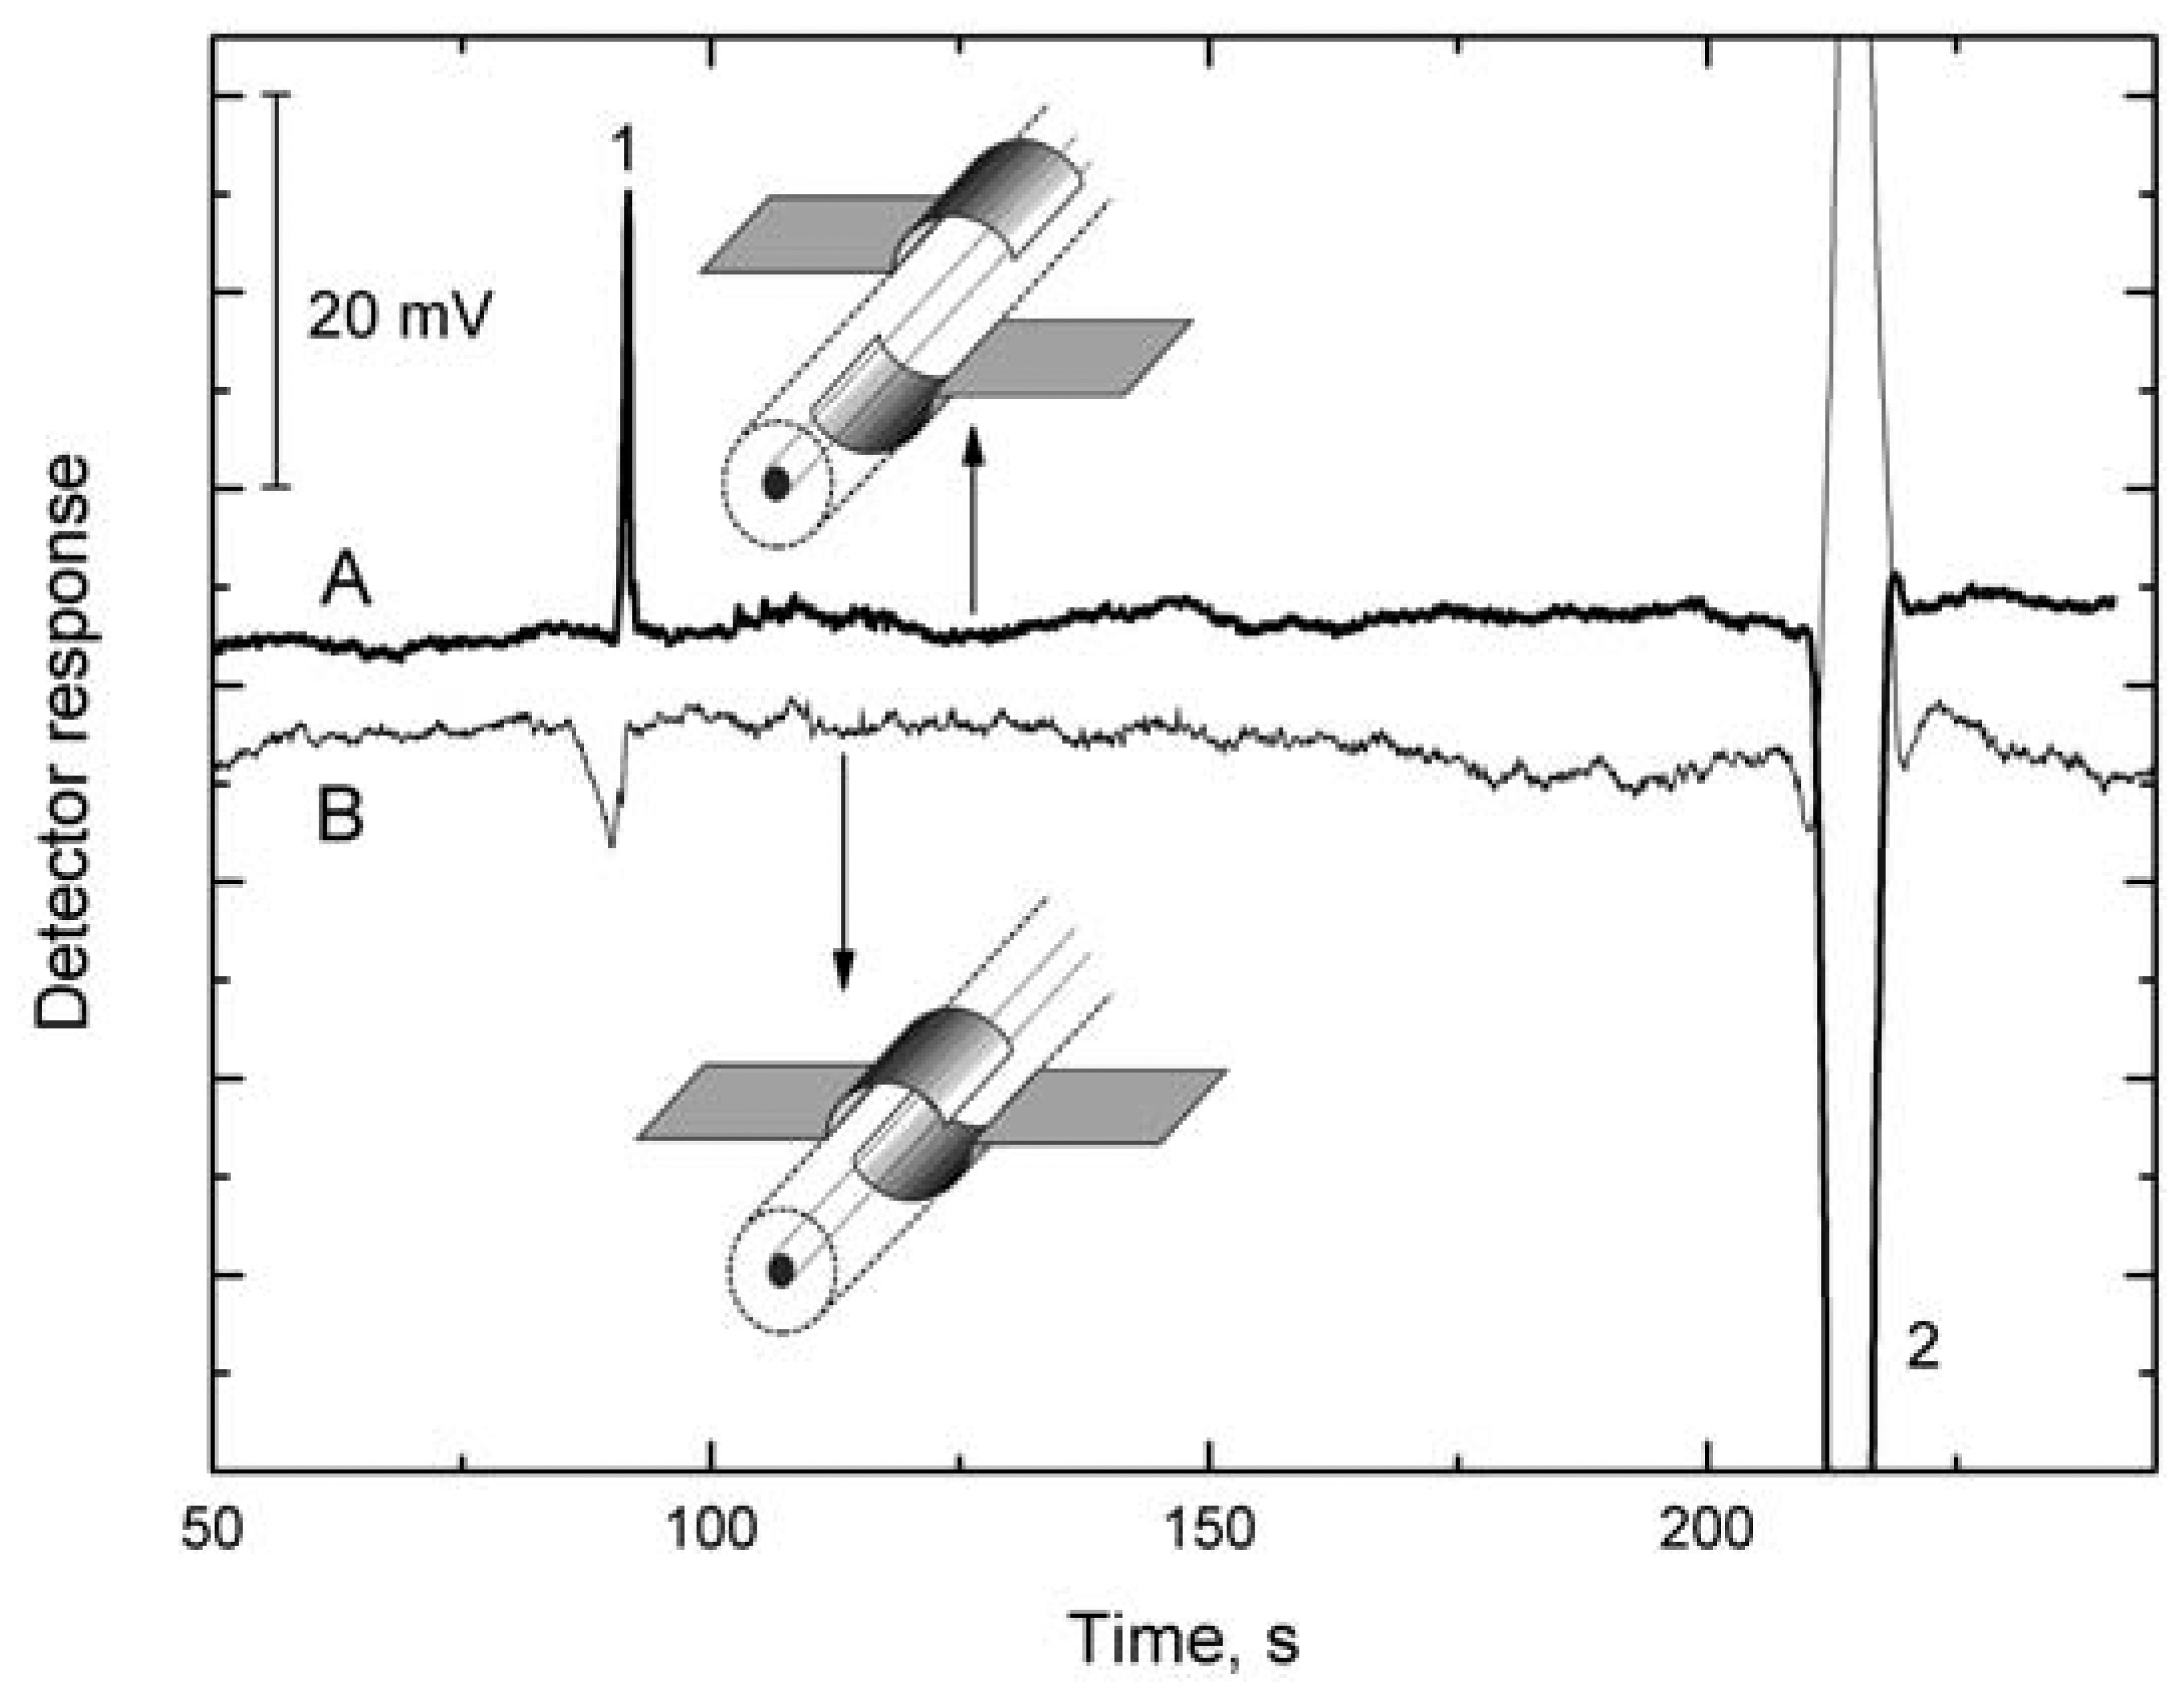
The effect of the width of the gap between the electrodes has been studied [15] on a cell with semitubular electrodes (Figure 2B), one electrode being fixed and the other, opposite, electrode being shifted along the capillary surface. The detection sensitivity, defined as the ratio of the electric current flowing through the cell and specific conductance of solution, I/κ, increases with decreasing gap width, d, between the electrodes [I/κ is proportional to 1/d as follows from Equations (6) and (7)]. The detection sensitivity increases with decreasing d from 3 mm up to 0.5 mm. There is a negligible change in the detection sensitivity within the gap width interval from 1 to 0 mm but the sensitivity begins to decrease rapidly when the electrodes gradually become superimposed. This decrease is due to the change in the cell response character—the effect of the capacitance component of solution on the impedance Z1 increases and that of the resistance component decreases. When the electrodes are placed opposite one another, the cell becomes a virtually pure permittivity detector whose signal is determined predominantly by the change in the test solution permittivity and substantially less by the change in its conductivity. The change in the character of the detector is clearly demonstrated on the electropherogram of the potassium ion and water gap in Figure 5. The response to passage of the potassium ion is high in the conductivity arrangement of the detection cell, because the zone has higher conductivity than conductivity of background electrolyte and the passage of the low-conductivity water gap is registered as a substantial reduction in the response. In the permittivity arrangement of the detection cell, the potassium ion reduces the permittivity of the zone, leading to a reduction in the response, but the response on passage of the water zone is high because the permittivity is higher than permittivity of background electrolyte.
4.4. The Effect of the Thickness of the Dielectric Layer
The coupling capacitance Ccpl in the electric equivalent circuit increases with decreasing thickness of the dielectric; consequently, the capacitance component contributes less to the cell impedance and the current signal increases. The wall thickness of common capillaries for capillary electrophoresis (CE) is approx. 150 μm. When it was decreased by ca. 30% by careful filing, then the detection sensitivity was increased by more than 120% in measurements with planar electrodes (Figure 2C) [15]. The filing down is an awkward operation and the capillaries become very fragile; therefore, this is not a potential approach for sensitivity improvement. On the other hand, planar electrodes used in chip electrophoresis can easily be placed very close to the separation channel and the detection sensitivity can be increased substantially [23]. Planar electrodes insulated from the solution by a thin plastic foil have also been used in the thin-layer format of the contactless conductivity detector. The detector was applied to the detection of ionic compounds such as benzoic, lactic and octanesulfonic acids, and sodium capronate, after their separation by high performance liquid chromatography (HPLC) [24]. The properties of the thin-layer detector were compared with those obtained by the standard contactless conductivity detector equipped with tubular electrodes [25]. As compared to the thin-layer cell, the tubular cell was substantially simpler and its fabrication was much easier. In addition, it was found that the tubular cell outperformed the thin-layer cell in the main analytical parameters. A survey of other applications of C4D in liquid chromatography is given in reference [24].
A completely different way of obtaining a contactless conductivity cell with a very thin dielectric layer is based on the use of thin insulated wires placed directly in the test liquid stream [26] (see Figure 2D). The lacquer insulation layer has a thickness of ca. 1 μm. This approach cannot, of course, be employed with silica capillaries, but it is readily used in classical HPLC or flow-injection analysis (FIA) systems. This cell design has also been used for detection in the gaseous phase [27]. It has been found that the measurement is sufficiently sensitive and reliable for determinations of common concentrations of water in the air. The dynamic characteristics and the signal stability demonstrate that the cell will be suitable for long-term continuous monitoring of the air humidity. Qualitative tests indicate that vapours of organic solvents can also be monitored.
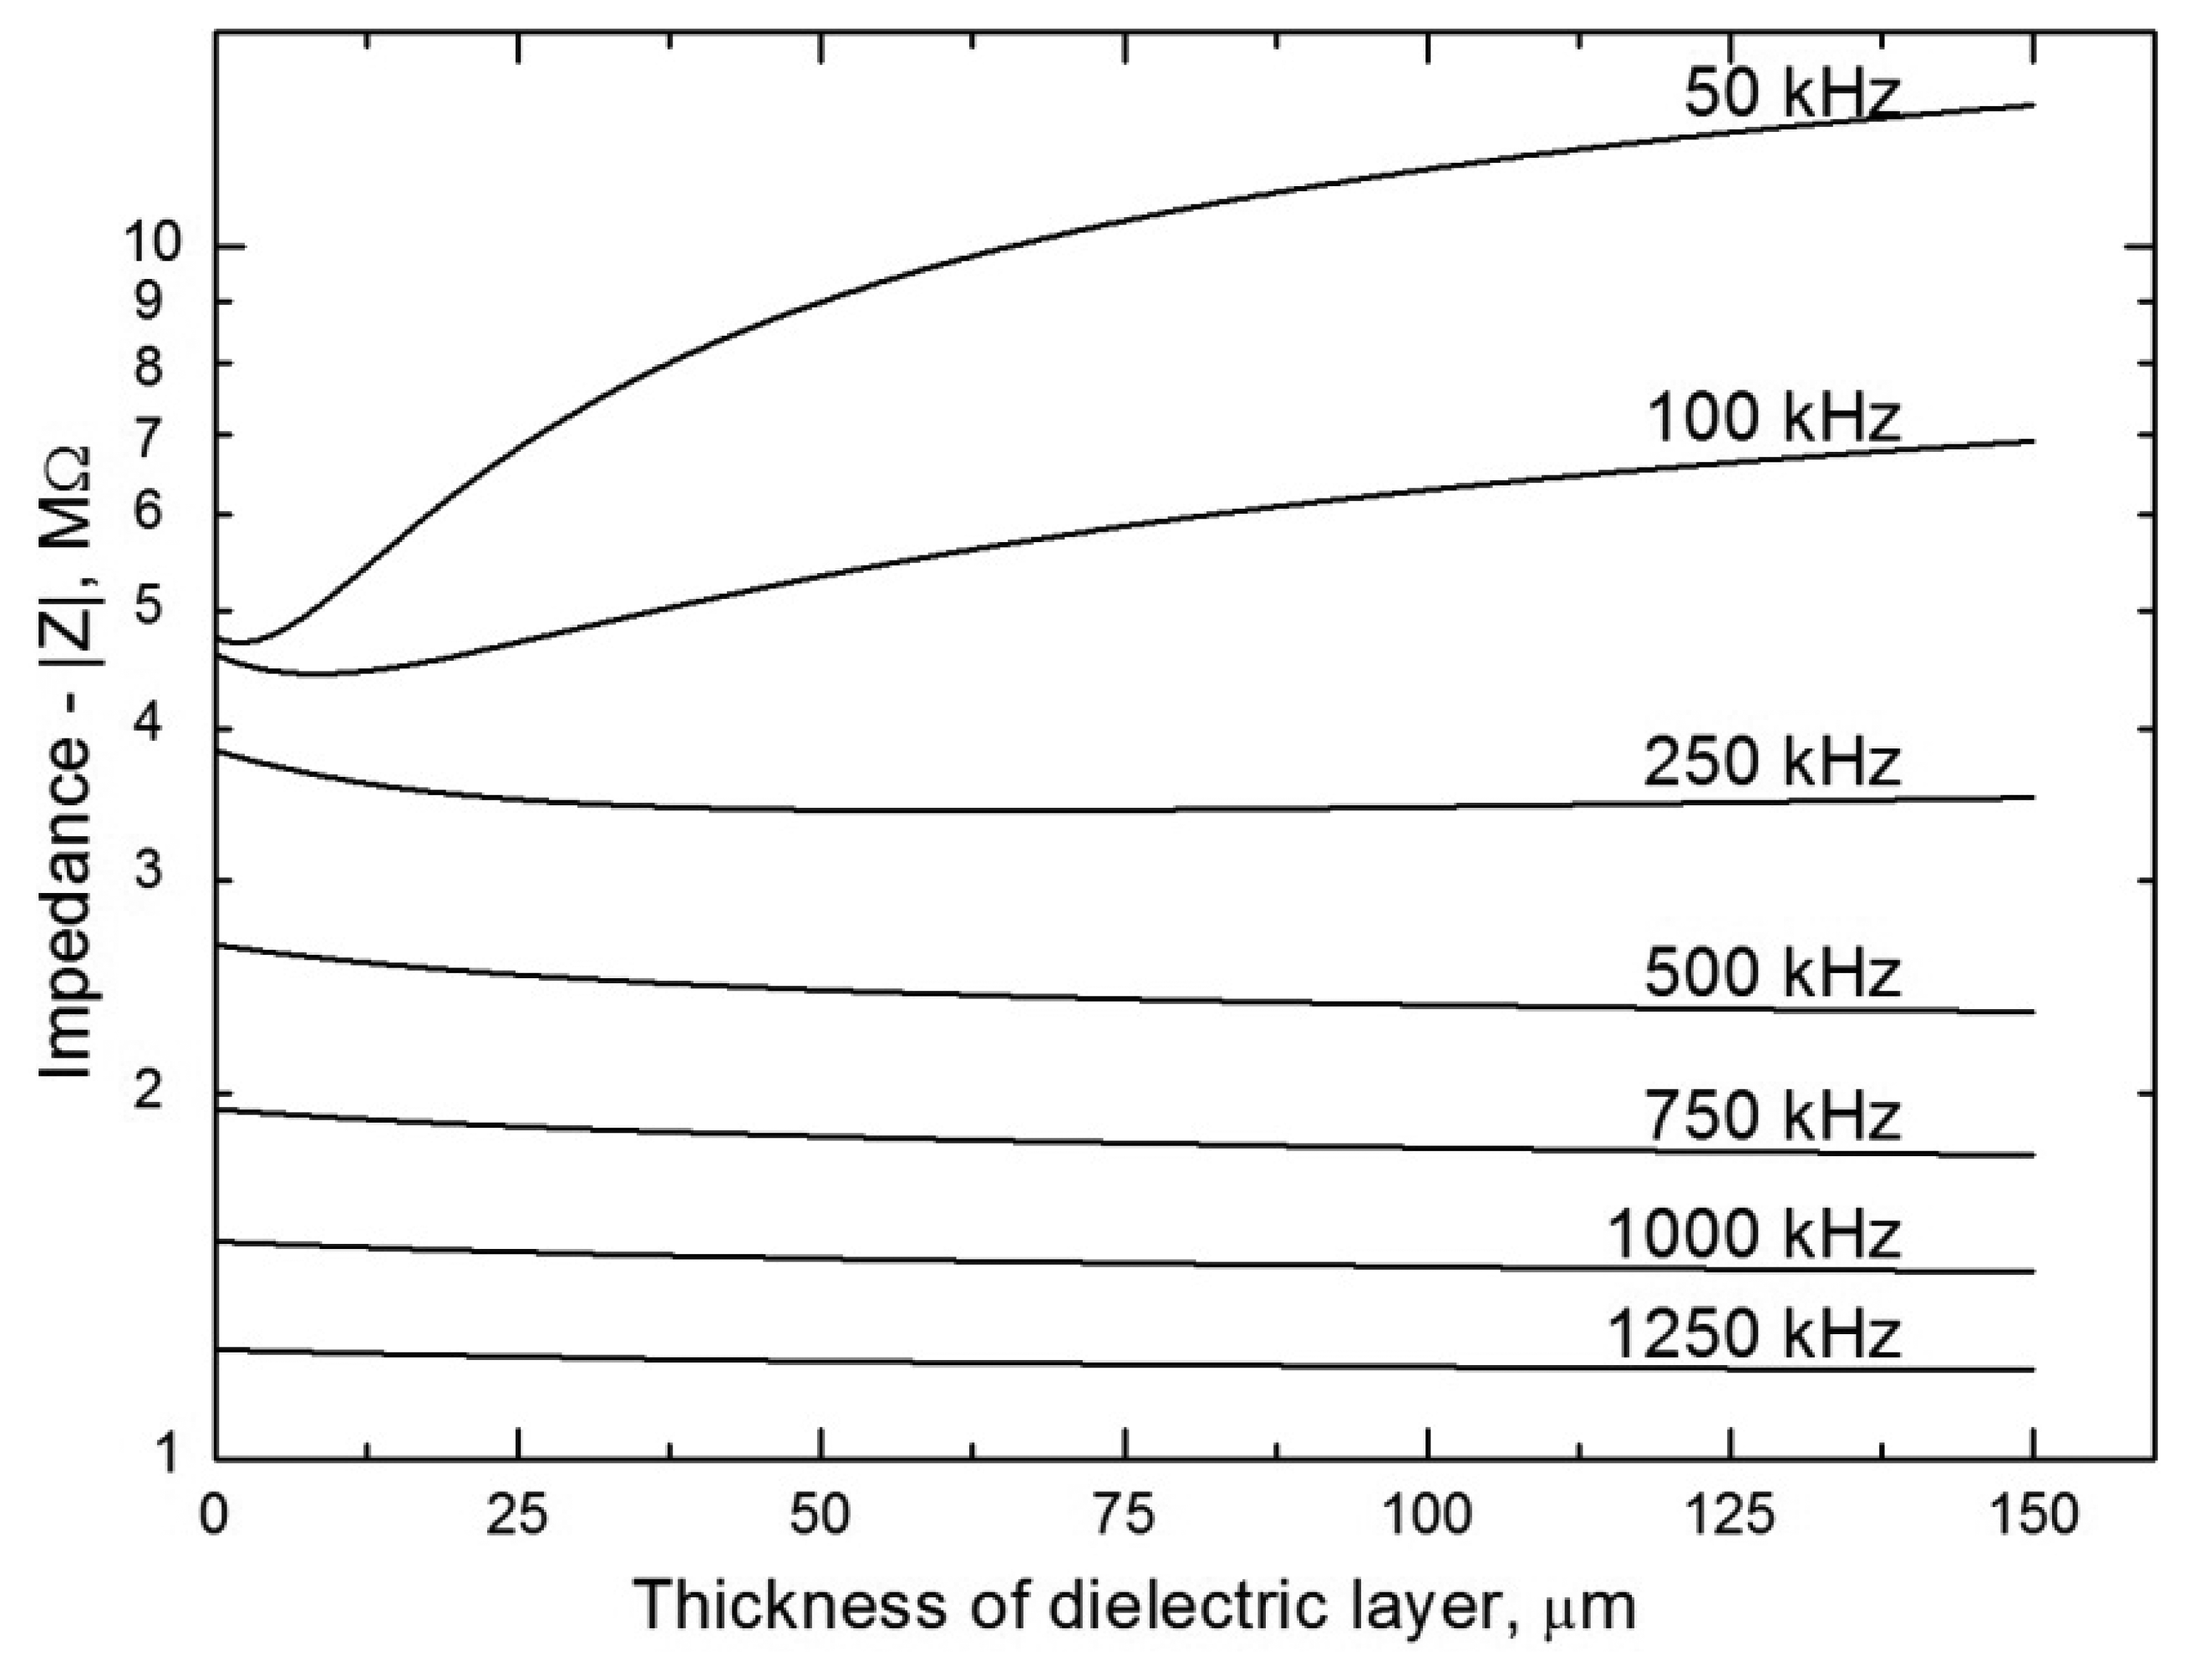
The effect of the thickness of the dielectric on the impedance of contactless detectors can be modeled, see Figure 6. It follows from the model based on an equivalent circuit applied to a tubular cell (Figure 2A) that the impedance of the sensor increases substantially with the thickness of the dielectric only at low alternating signal frequencies. At high frequencies, the impedance is practically independent of the thickness of the dielectric (with increasing frequency, the resistance of the condenser, Zc = −i/2πfCcpl, decreases and the dominant component contributing to the total impedance is then the ohmic resistance of the solution in the capillary, which is not dependent on the frequency). It thus unambiguously follows that impedance measurements can be successfully performed even in thick-walled capillaries assuming that strong capacitive coupling is ensured (high Ccpl), with simultaneous use of a high-frequency alternating signal. It should also be pointed out that the frequency from which the impedance ceases to depend on the thickness of the dielectric also varies substantially with the magnitude of the stray capacitance, Cx.
4.5. The Effect of the Input Alternating Voltage Parameters on the Detector Properties
These effects have been studied quite frequently because the investigation is simple experimentally. It should be pointed out that the detection cell performance is also affected by the character and type of the electronic circuitry employed; see, e.g., references [22,28]. In general, the simultaneous effects of all the experimental parameters mentioned in Section 2 should always be kept in mind.
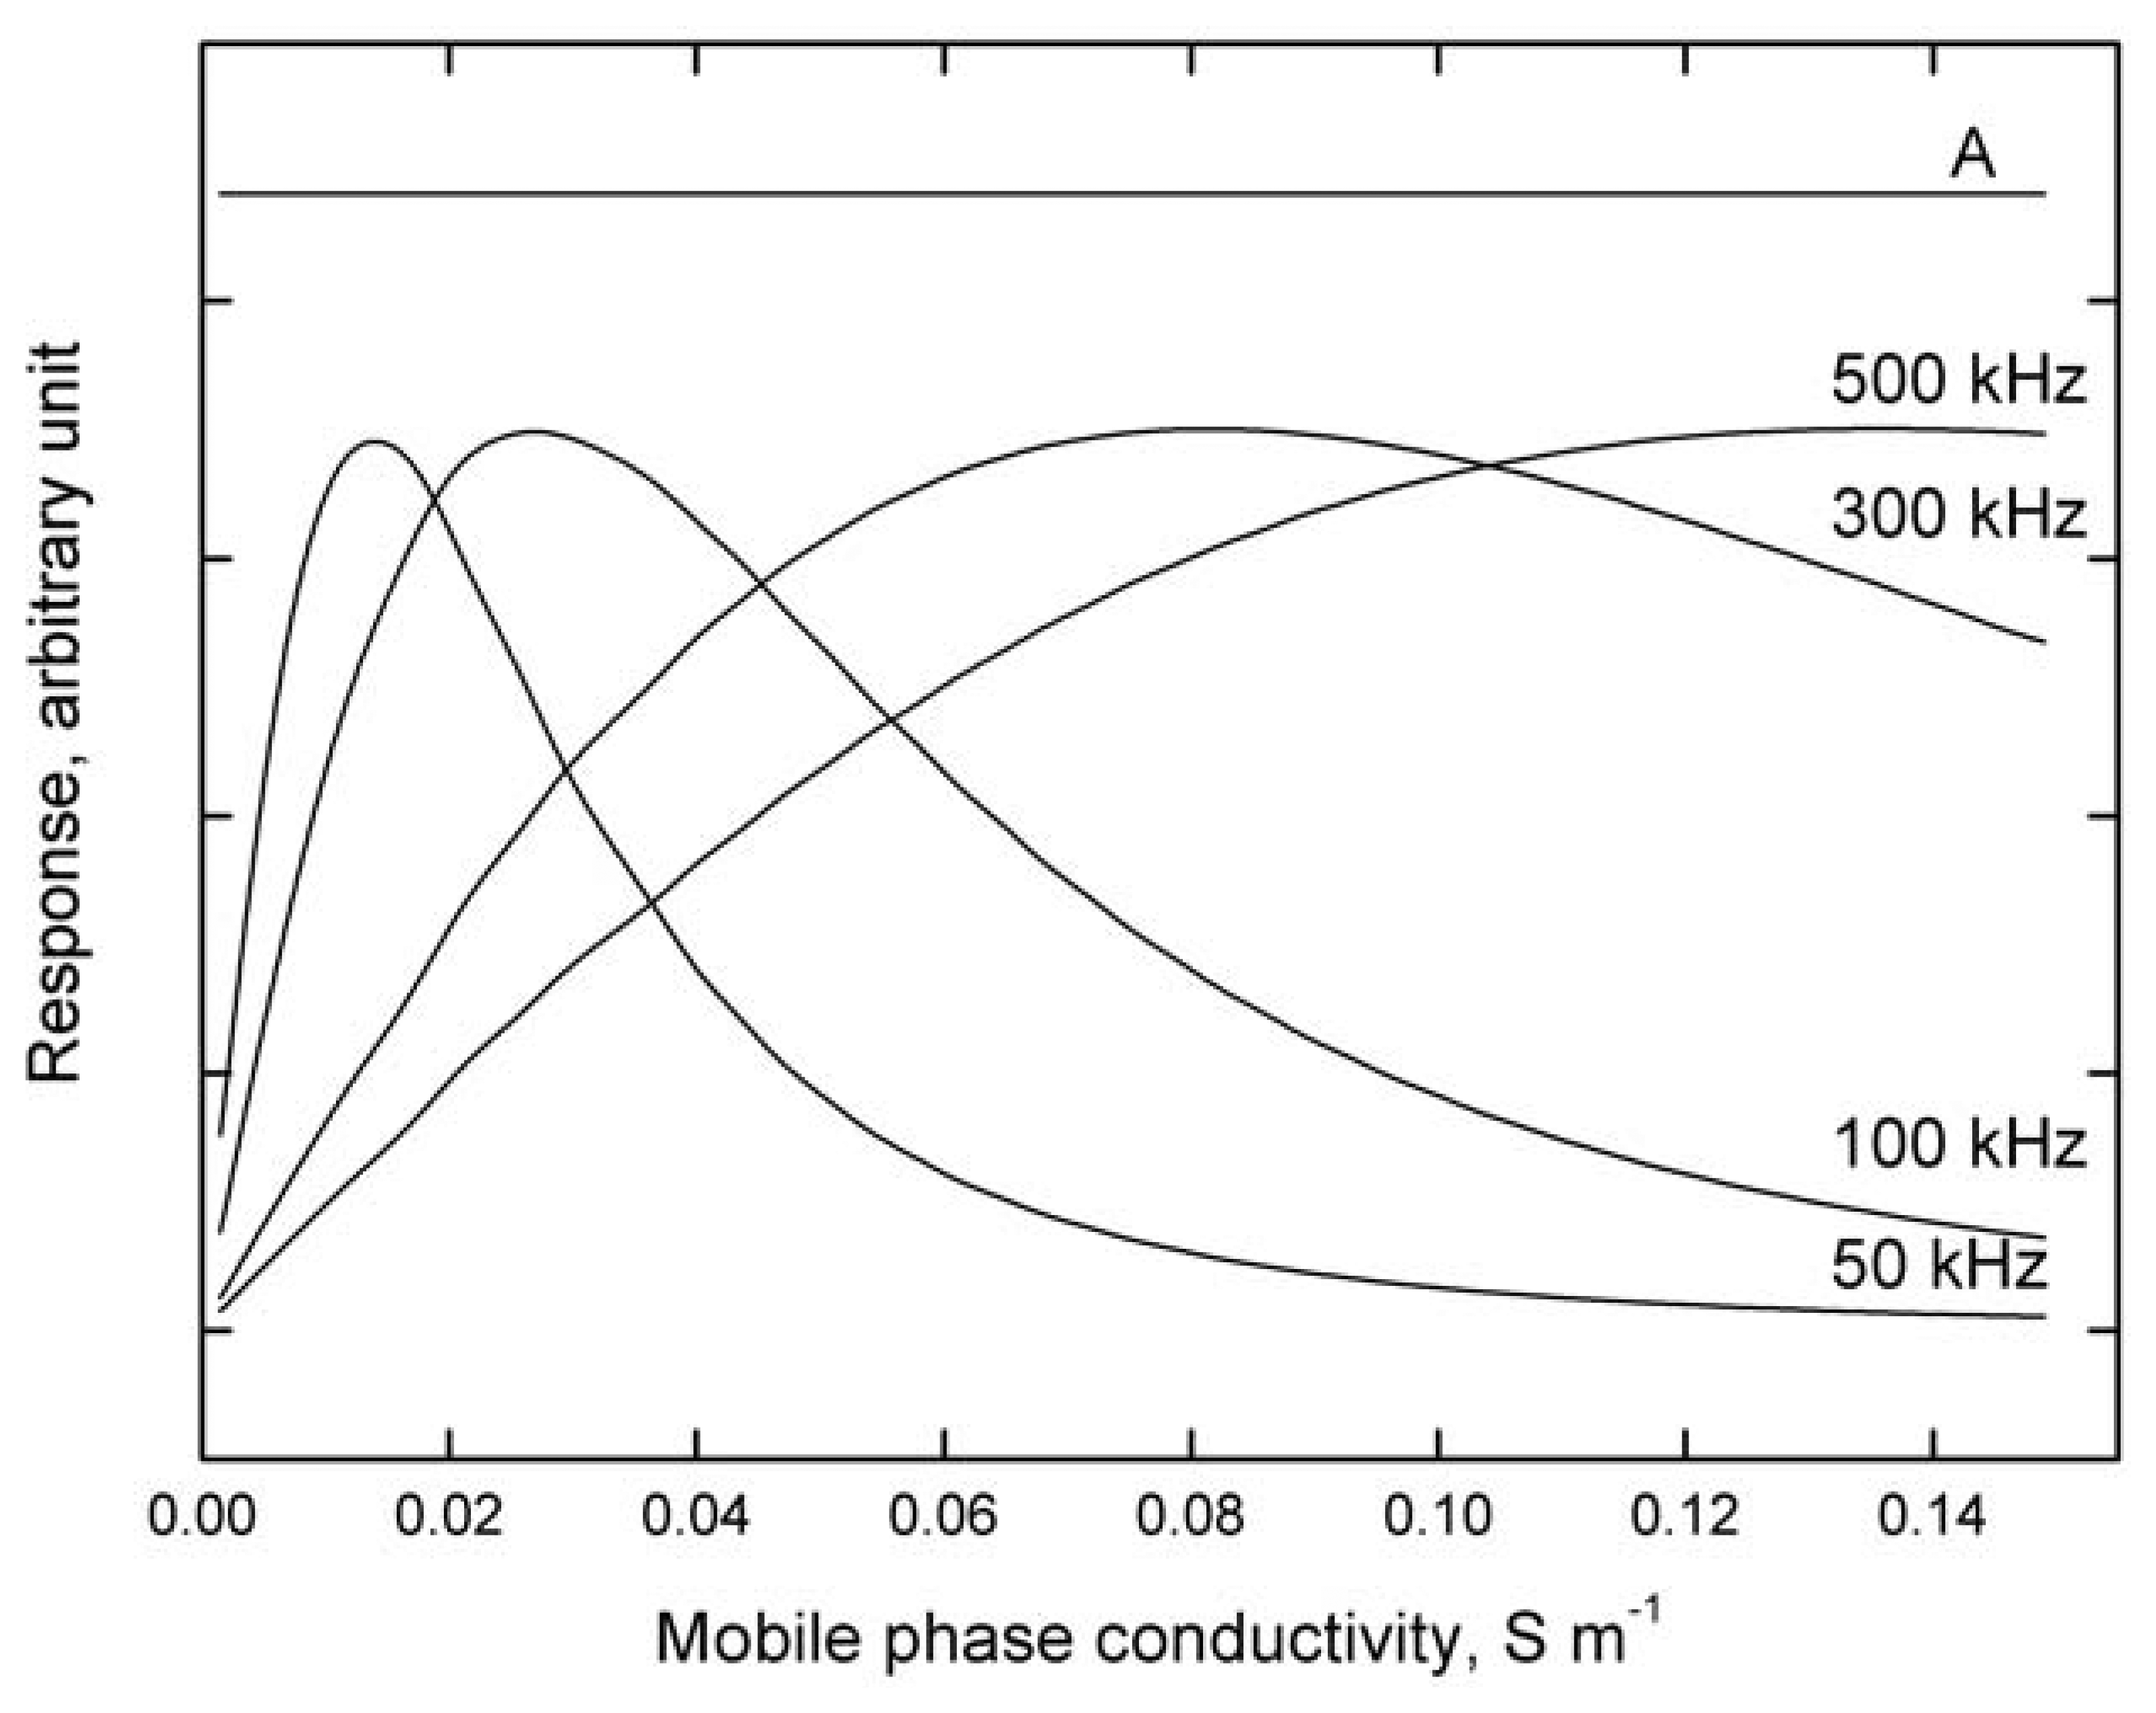
Figure 7 depicts the results of modeling the detector response dependence, i.e., electric current flowing through the cell, see Equation (6), on addition of a sample with constant conductivity to carrier liquids with various conductivities at various frequencies of the input alternating voltage. It follows that:
The optimum frequency, at which the response is largest, increases with increasing conductivity of the test solution; this dependence becomes progressively more pronounced with decreasing conductivity of the test solution.
The calibration dependences obtained at constant frequency are non-linear and may even be non-monotonous, especially at lower frequencies.
For analogous modeling results, see reference [29].
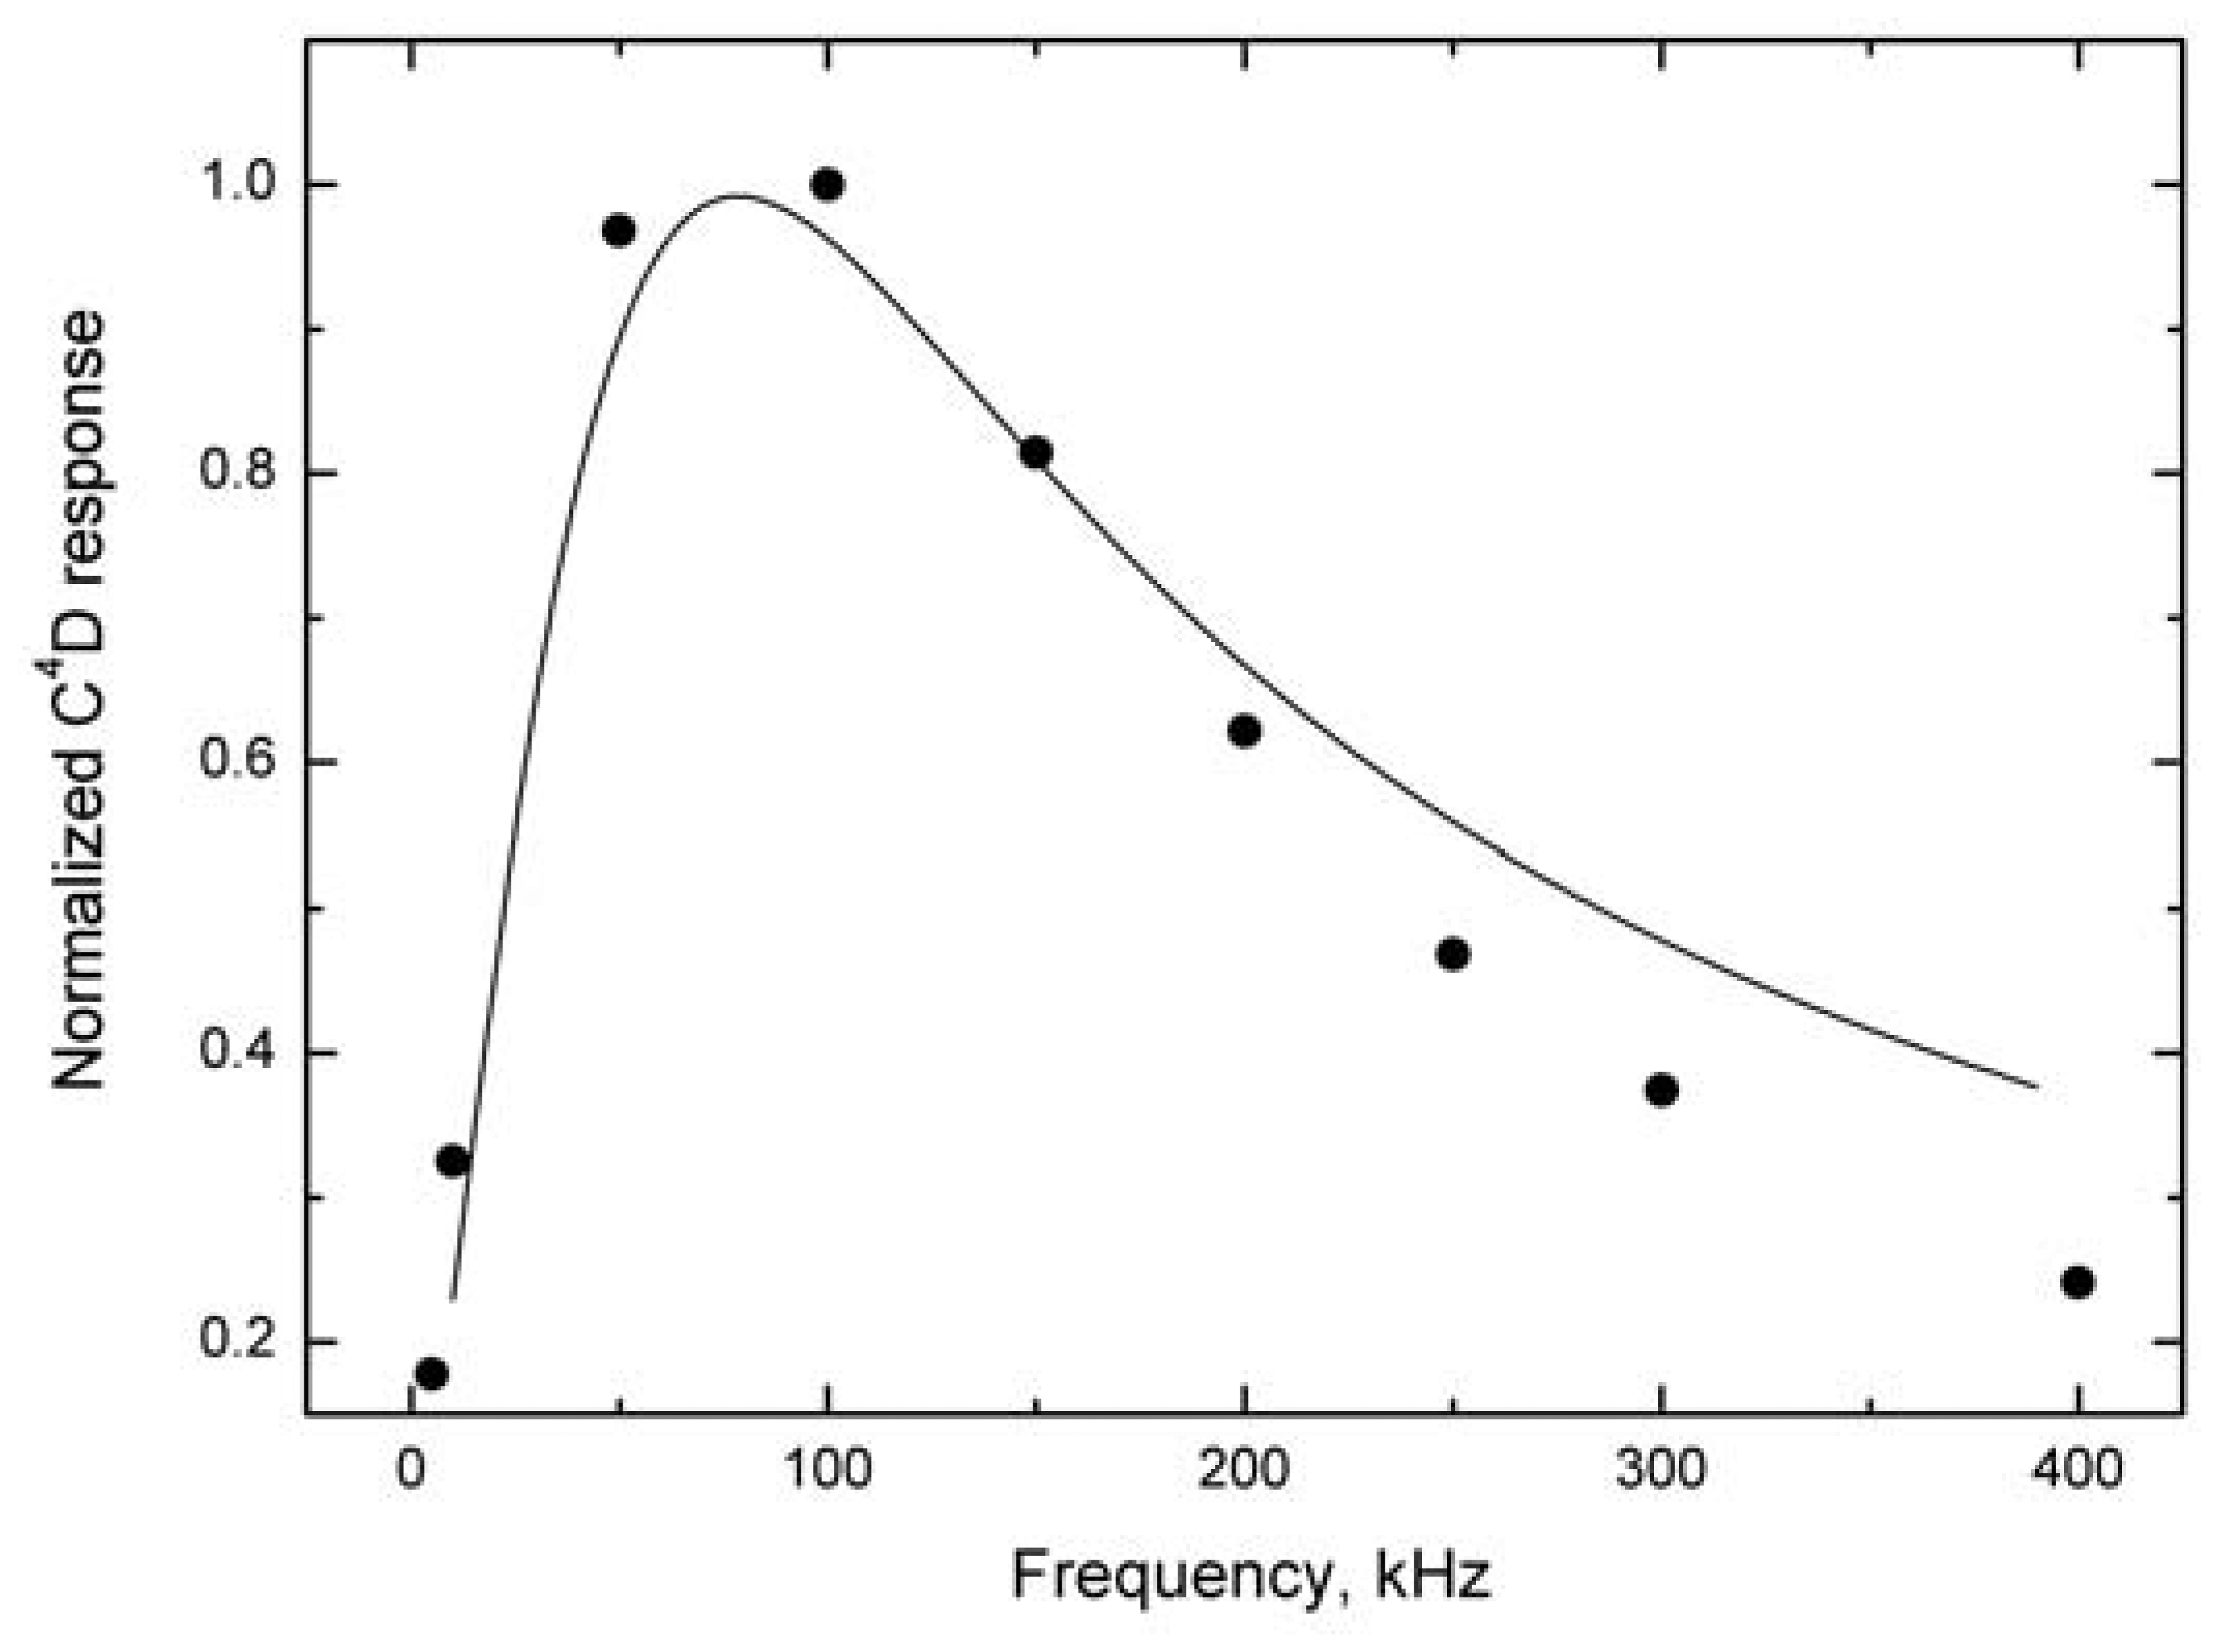
Our measurements indicate that the model employed for tubular cells is also applicable without substantial limitations to cells with insulated wire electrodes [26] oriented across the tube, see Figure 2D (1). For illustration, the model and experimental response—frequency dependences for a cell with wire electrodes placed at right angles for constant Δκ of the solution are compared in Figure 8. The decrease in the cell response at high frequencies is caused by the increasing influence of the stray capacitance; the operational characteristics of the electronic components used in the detector electronics can also influence the response as mentioned above (the limited bandwidth of operational amplifier). These cells have also been employed for FIA determination of total inorganic carbon in aqueous solutions [30].
The input voltage amplitude has a minor effect. Generally, the greater the amplitude, the higher is the measured signal. The literature records an amplitude range from 0.5 V [19] to 450 V [31], but the most common values are 10 to 20 V, provided by standard AC signal generators. The amplitudes of the input alternating voltage can be an order of magnitude lower if a commercial instrument is used for impedance spectrometry, see references [32,33].
4.6. The Cells Designed for Dielectrometric Measurements
The detection cells discussed so far were designed for measurement of the alternating current determined primarily by the resistance component of the cell impedance. Certain cell geometry and properties of the test solution can enhance the cell capacitance component. In the low conductivity solutions for which it holds that Rliq ≫ (−i/ωCliq), the effect of Rliq on Z can be neglected and the detection cell acts primarily like a condenser. An example is the cell with wire electrodes placed in parallel with the test liquid stream, Figure 2D (2). This cell was connected as an input capacitor in a differentiating circuit, whose output voltage, U0, is given by:
Another capacitance cell with two planar electrodes placed opposite each other, Figure 3A, can be connected as a capacitor which determines the frequency of an integrated stable multivibrator (e.g., common type, 4047); the detection cell capacitance can be calculated from the relationship for the board capacitor:
The detection cells with tubular electrodes, Figure 3B,C, connected with an astable multivibrator have also been tested for determination of the ethanol content in automotive fuel [37]; the ethanol concentrations determined using the impedance cell agree, within the reliability interval, with those obtained by gas chromatography-mass spectrometry (GC-MS) measurements and fall within the limits recommended by the relevant European Standard.
5. Conclusions and Outlook for the Future
Contactless impedance detection has already become a standard part of sensor and detector science. The theoretical background is reasonably well understood, even if modeling and prediction of the cell behavior is satisfactory only for the shapes of dependences and trends, whereas the absolute signal values can be predicted only with difficulties.
The main area of application will definitely remain in the fields of HPLC and CE separations, where C4Ds are commercially available [38,39], with emphasis on miniaturized systems, primary in the form of lab-on-the chip designs. Further progress can be expected in the area of instrumental design; an example can be found in reference [40], in which end-to-end differential C4D is tested for electrophoresis on a chip. The detection is based on recording the difference in the signals from two identical detectors with planar electrodes, of which one is located at the beginning and the other at the end of the separation channel. This arrangement has the advantage that it increases the signal/noise ratio and minimizes the baseline drift. This leads to a lower detection limit compared to the normal end-column location of the detector. Another promising area lies in the development of new types of combined detectors [41]. A typical arrangement combines C4D with optical detection; detectors based on quite different detection principles provide more complex information on the studied system [42–44].
The newest applications demonstrate that the use of impedance detection extends beyond the area of separation techniques. A simple disposable polydimethylsiloxane chip [32] has been developed for contactless impedance flow-through cytometry. In the measurement, the chip is placed on a printed circuit board with electrodes and, as required, the necessary electronics. The equipment enables detection of the passage of individual cells through the chip channel and is intended for the diagnosis of infectious diseases. The development of the chip was motivated by attempts to decrease the cost of individual examinations; a new chip is used for each examination, while the printed circuit board can be used repeatedly. The standard experimental arrangement with cylindrical electrodes (unconventionally made of conductive silicone) located on the outside of a thin-walled glass capillary was used for the detection and measurement of the conductivity of drops of an aqueous salt solution (KCl) generated in a stream of liquid immiscible with water (tetradecane) [45]; the method can be employed in digital microfluidics.
Other measuring techniques in which conductometric electrodes are placed at the outside walls of the detection cell are perspective, e.g., for studying reaction mechanisms in hermetically closed reaction vessels or tubes. The method has already been used to evidence whether the allylation mechanisms of aldehydes proceed via an ionic or neutral pathway [46].
Acknowledgments
Financial support from Charles University in Prague, Projects PRVOUK P31 and UNCE 204015/2012; the Ministry of Education, Youth and Sports, Czech Republic, Research Project No. MSM0021620857, and the Grant Agency of the Czech Republic, Grant No. P206/10/1231, is gratefully acknowledged.
References
- Reilley, C.N. High frequency methods. In New Instrumental Methods in Electrochemistry; Delahay, P., Ed.; Interscience: New York, NY, USA, 1954. [Google Scholar]
- Pungor, E. Oscillometry and Conductometry; Pergamon Press: Oxford, UK, 1965. [Google Scholar]
- Kuban, P.; Timerbaev, A.R. Ce of inorganic species—A review of methodological advancements over 2009–2010. Electrophoresis 2012, 33, 196–210. [Google Scholar]
- Kuban, P.; Hauser, P.C. Capacitively coupled contactless conductivity detection for microseparation techniques—Recent developments. Electrophoresis 2011, 32, 30–42. [Google Scholar]
- Solinova, V.; Kasicka, V. Recent applications of conductivity detection in capillary and chip electrophoresis. J. Sep. Sci. 2006, 29, 1743–1762. [Google Scholar]
- Kuban, P.; Hauser, P.C. A review of the recent achievements in capacitively coupled contactless conductivity detection. Anal. Chim. Acta. 2008, 607, 15–29. [Google Scholar]
- Wang, J. Electrochemical detection for capillary electrophoresis microchips: A review. Electroanalysis 2005, 17, 1133–1140. [Google Scholar]
- Pumera, M. Contactless conductivity detection for microfluidics: Designs and applications. Talanta 2007, 74, 358–364. [Google Scholar]
- Gas, B.; Zuska, J.; Coufal, P.; van de Goor, T. Optimization of the high-frequency contactless conductivity detector for capillary electrophoresis. Electrophoresis 2002, 23, 3520–3527. [Google Scholar]
- Brito-Neto, J.G.A.; da Silva, J.A.F.; Blanes, L.; do Lago, C.L. Understanding capacitively coupled contactless conductivity detection in capillary and microchip electrophoresis. Part 2. Peak shape, stray capacitance, noise, and actual electronics. Electroanalysis 2005, 17, 1207–1214. [Google Scholar]
- da Silva, J.A.F.; do Lago, C.L. An oscillometric detector for capillary electrophoresis. Anal. Chem. 1998, 70, 4339–4343. [Google Scholar]
- Francisco, K.J.M.; do Lago, C.L. A compact and high-resolution version of a capacitively coupled contactless conductivity detector. Electrophoresis 2009, 30, 3458–3464. [Google Scholar]
- Opekar, F.; Stulik, K.; Fenclova, K. A simple contactless conductivity detector employing a medium wave radio integrated circuit for the signal treatment. Electroanalysis 2010, 22, 161–167. [Google Scholar]
- Tuma, P.; Opekar, F.; Jelinek, I. A contactless conductometric detector with easily exchangeable capillary for capillary electrophoresis. Electroanalysis 2001, 13, 989–992. [Google Scholar]
- Novotny, M.; Opekar, F.E.; Stulik, K. The effects of the electrode system geometry on the properties of contactless conductivity detectors for capillary electrophoresis. Electroanalysis 2005, 17, 1181–1186. [Google Scholar]
- Zemann, A.J.; Schnell, E.; Volgger, D.; Bonn, G.K. Contactless conductivity detection for capillary electrophoresis. Anal. Chem. 1998, 70, 563–567. [Google Scholar]
- Pumera, M.; Wang, J.; Opekar, F.; Jelinek, I.; Feldman, J.; Lowe, H.; Hardt, S. Contactless conductivity detector for microchip capillary electrophoresis. Anal. Chem. 2002, 74, 1968–1971. [Google Scholar]
- Wang, J.; Pumera, M.; Collins, G.; Opekar, F.; Jelinek, I. A chip-based capillary electrophoresis-contactless conductivity microsystem for fast measurements of low-explosive ionic components. Analyst. 2002, 127, 719–723. [Google Scholar]
- da Silva, J.A.F.; Guzman, N.; do Lago, C.L. Contactless conductivity detection for capillary electrophoresis—Hardware improvements and optimization of the input-signal amplitude and frequency. J. Chromatogr. A. 2002, 942, 249–258. [Google Scholar]
- Mayrhofer, K.; Zemann, A.J.; Schnell, E.; Bonn, G.K. Capillary electrophoresis and contactless conductivity detection of ions in narrow inner diameter capillaries. Anal. Chem. 1999, 71, 3828–3833. [Google Scholar]
- Tuma, P.; Opekar, F.; Stulik, K. A contactless conductivity detector for capillary electrophoresis: Effects of the detection cell geometry on the detector performance. Electrophoresis 2002, 23, 3718–3724. [Google Scholar]
- Kuban, P.; Hauser, P.C. Fundamental aspects of contactless conductivity detection for capillary electrophoresis. Part I: Frequency behavior and cell geometry. Electrophoresis 2004, 25, 3387–3397. [Google Scholar]
- Tanyanyiwa, J.; Hauser, P.C. High-voltage capacitively coupled contactless conductivity detection for microchip capillary electrophoresis. Anal. Chem. 2002, 74, 6378–6382. [Google Scholar]
- Mika, J.; Opekar, F.; Coufal, P.; Stulik, K. A thin-layer contactless conductivity cell for detection in flowing liquids. Anal. Chim. Acta. 2009, 650, 189–194. [Google Scholar]
- Mark, J.J.P.; Coufal, P.; Opekar, F.; Matysik, F.M. Comparison of the performance characteristics of two tubular contactless conductivity detectors with different dimensions and application in conjunction with hplc. Anal. Bioanal. Chem. 2011, 401, 1669–1676. [Google Scholar]
- Hohercakova, Z.; Opekar, F.E.; Stulik, K. Thinly insulated wire cells—A new device for sensitive contactless conductivity detection in flow analyses. Electroanalysis 2005, 17, 1924–1930. [Google Scholar]
- Pavlicek, V.; Opekar, F.; Stulik, K. Application of contactless impedance detection to determination of substances in gaseous phase. Electroanalysis 2011, 23, 1325–1328. [Google Scholar]
- Tanyanyiwa, J.; Hauser, P.C. High-voltage contactless conductivity detection of metal ions in capillary electrophoresis. Electrophoresis 2002, 23, 3781–3786. [Google Scholar]
- Brito-Neto, J.G.A.; da Silva, J.A.F.; Blanes, L.; do Lago, C.L. Understanding capacitively coupled contactless conductivity detection in capillary and microchip electrophoresis. Part 1. Fundamentals. Electroanalysis 2005, 17, 1198–1206. [Google Scholar]
- Hohercakova, Z.; Opekar, F. A contactless conductivity detection cell for flow injection analysis: Determination of total inorganic carbon. Anal. Chim. Acta. 2005, 551, 132–136. [Google Scholar]
- Tanyanyiwa, J.; Schweizer, K.; Hauser, P.C. High-voltage contactless conductivity detection of underivatized amino acids in capillary electrophoresis. Electrophoresis 2003, 24, 2119–2124. [Google Scholar]
- Emaminejad, S.; Javanmard, M.; Dutton, R.W.; Davis, R.W. Microfluidic diagnostic tool for the developing world: Contactless impedance flow cytometry. Lab A Chip. 2012, 12, 4499–4507. [Google Scholar]
- Cahill, B.P.; Land, R.; Nacke, T.; Min, M.; Beckmann, D. Contactless sensing of the conductivity of aqueous droplets in segmented flow. Sens. Actuator B Chem. 2011, 159, 286–293. [Google Scholar]
- Nadherna, M.; Opekar, F.; Stulik, K. Properties of the contactless impedance detector with insulated wire electrodes placed inside the flowing liquid stream. Electroanalysis 2007, 19, 2413–2418. [Google Scholar]
- Opekar, F.; Stulik, K.; Fisarova, M. A contactless impedance probe for simple and rapid determination of the ratio of liquids with different permittivities in binary mixtures. Electroanalysis 2009, 21, 96–100. [Google Scholar]
- Opekar, F.; Stulik, K.; Fisarova, M. Some possibilities and limitations of contactless impedimetric determinations of organic liquids in aqueous solutions. The interference from ionic compounds. Electroanalysis 2010, 22, 2353–2358. [Google Scholar]
- Opekar, F.; Cabala, R.; Kadlecova, T. A simple contactless impedance probe for determination of ethanol in gasoline. Anal. Chim. Acta. 2011, 694, 57–60. [Google Scholar]
- Separation Science: C4D Introduction page. Available online: http://www.edaq.com/C4D_intro.php/ (accessed on 4 February 2013).
- Capillary Electrophoresis. Available online: http://www.istech.at/capillary_electrophoresis.htm/ (accessed on 4 February 2013).
- Fercher, G.; Haller, A.; Smetana, W.; Vellekoopt, M.J. End-to-end differential contact less conductivity sensor for microchip capillary electrophoresis. Anal. Chem. 2010, 82, 3270–3275. [Google Scholar]
- Opekar, F.; Stulik, K. Some important combinations of detection techniques for electrophoresis in capillaries and on chips with emphasis on electrochemical principles. Electrophoresis 2011, 32, 795–810. [Google Scholar]
- Novotny, M.; Opekar, F.; Jelinek, I.; Stulik, K. Improved dual photometric-contactless conductometric detector for capillary electrophoresis. Anal. Chim. Acta. 2004, 525, 17–21. [Google Scholar]
- Zikmundova, J.; Tuma, P.; Opekar, F. A dual spectrophotometric/contactless conductivity detector for ce determination of incompletely separated amino acids. J. Sep. Sci. 2008, 31, 353–355. [Google Scholar]
- Ryvolova, M.; Preisler, J.; Foret, F.; Hauser, P.C.; Krasensky, P.; Paull, B.; Macka, M. Combined contactless conductometric, photometric, and fluorimetric single point detector for capillary separation methods. Anal. Chem. 2010, 82, 129–135. [Google Scholar]
- Lederer, T.; Clara, S.; Jakoby, B.; Hilber, W. Integration of impedance spectroscopy sensors in a digital microfluidic platform. Microsyst. Technol. 2012, 18, 1163–1180. [Google Scholar]
- Hrdina, R.; Opekar, F.; Roithova, J.; Kotora, M. Neutral and ionic reaction mechanisms for the allylation of aldehydes by bipyridine n,n'-dioxides. Chem. Commun. 2009, 2314–2316. [Google Scholar]


© 2013 by the authors; licensee MDPI, Basel, Switzerland. This article is an open access article distributed under the terms and conditions of the Creative Commons Attribution license (http://creativecommons.org/licenses/by/3.0/).
Share and Cite
Opekar, F.; Tůma, P.; Štulík, K. Contactless Impedance Sensors and Their Application to Flow Measurements. Sensors 2013, 13, 2786-2801. https://doi.org/10.3390/s130302786
Opekar F, Tůma P, Štulík K. Contactless Impedance Sensors and Their Application to Flow Measurements. Sensors. 2013; 13(3):2786-2801. https://doi.org/10.3390/s130302786
Chicago/Turabian StyleOpekar, František, Petr Tůma, and Karel Štulík. 2013. "Contactless Impedance Sensors and Their Application to Flow Measurements" Sensors 13, no. 3: 2786-2801. https://doi.org/10.3390/s130302786