Vapor Trace Recognition Using a Single Nonspecific Chemiresistor

Abstract
: An application of spectral analysis to the transient response signals of ALD-fabricated conductometric sensors (chemiresistors) upon exposure to short vapor pulses is discussed. It is based on the representation of a response curve in the frequency domain, followed by the multi-dimensional Quadratic Discriminant Analysis (QDA) for analyte identification. Compared to the standard steady-state amplitude analysis, this technique does not depend on a short-term sensor drift, does not have limitations for the number of extracted features and has a strict physical validation. Effective recognition of some relatively simple combustible analytes (acetone, toluene, ethanol) was demonstrated using a single nonspecific chemiresistor.1. Introduction
Detection and recognition of combustible and explosive vapors remains an important problem for industry and national security. Major efforts in this direction have been concentrated on the development of analytical instruments, such as spectrometers of different kinds that are capable of detecting and analyzing the molecular structure of gaseous species. Currently, analytical tools of this type remain bulky and expensive, require considerable time for analysis, typically under laboratory conditions, and highly-qualified personnel to operate them. The best alternative for replacing the spectroscopy tools is the use of artificial olfactory systems also known as electronic noses [1,2]. An electronic nose is a biologically inspired device that identifies and analyses chemical compounds in gaseous environments. An electronic nose consists of a mechanism for chemical detection, such as an array of electronic sensors, and a mechanism for pattern recognition, such as a neural network [3].
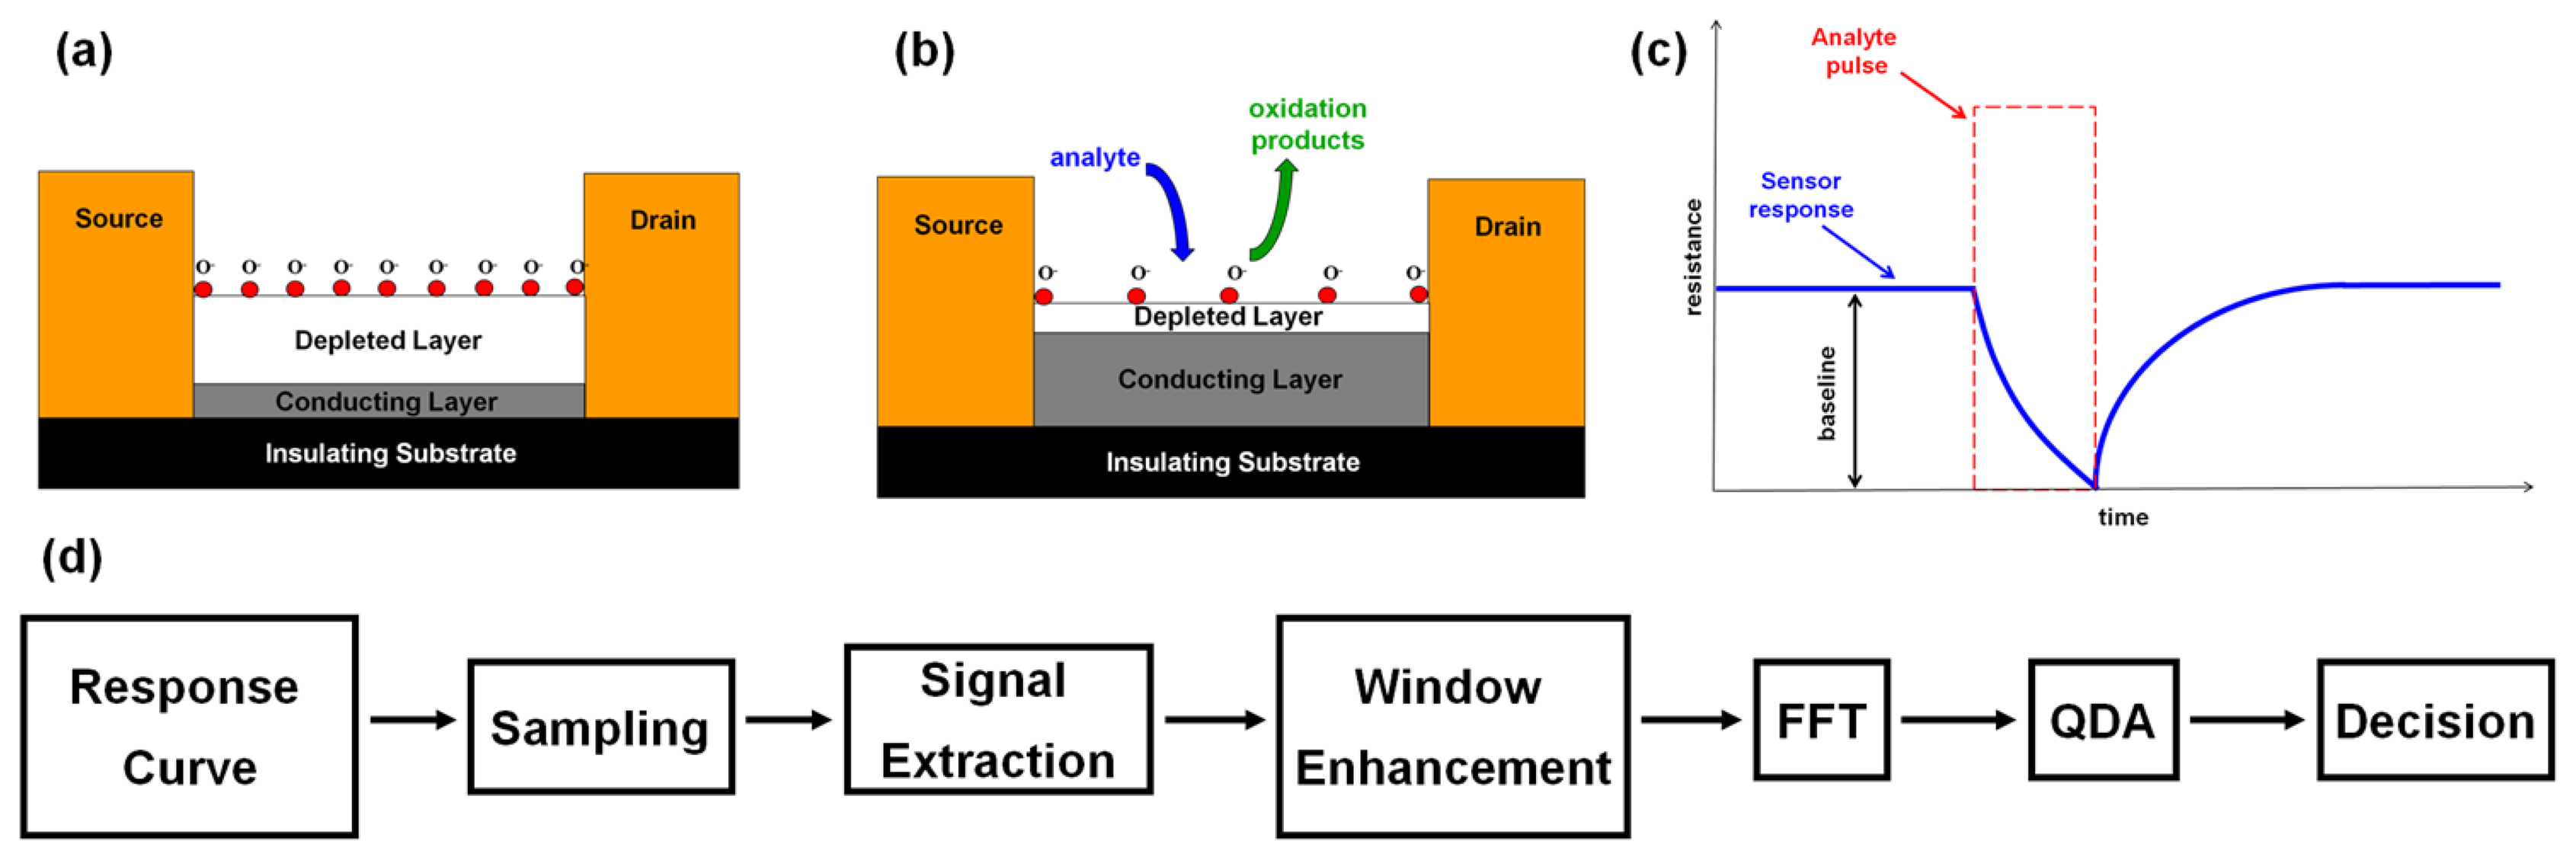
Conductometric sensors (chemiresistors) are traditionally used as the building blocks for electronic noses [1,2]. A chemiresistor is a device whose electrical resistance can be modulated by molecular adsorption on its surface. Typically, the changes in resistance are proportional to the partial vapor pressure of chemicals in the atmosphere; hence a chemiresistor converts the concentration of chemicals in the atmosphere into a measurable electrical signal. Commonly utilized chemically sensitive materials are carbon-black polymer composites, arrays of metal nanoparticles, biological materials and metal oxide films [4–16]. Sensing behavior is one of the most important and well-known properties of metal oxide materials and it was found that metal oxide sensors usually demonstrate much higher sensitivity, selectivity, and stability to their chemical environment than the other materials. The sensing mechanism by metal oxide films is primarily based on high-temperature activation of atmospheric oxygen on the semiconductor surface [4–13]. Consequently, the catalytic reactions of gaseous species with oxygen sites on the surface induce charge transfer from the surface to the bulk, changing the electrical resistance of the device (Figure 1a–c)). In order to generate a comprehensive smell-print, sensors are usually arranged in an integrated array. Individual chemiresistors in the array are nonspecific and vary by physical or chemical parameters, such as: type of oxide, thickness of oxide layer, temperature, n or p-type volume doping, surface doping with catalytic nanoparticles.
Upon the exposure to analyte, the integrated patterns of signals undergo processing by the pattern recognition software. Most feature extraction techniques for recognition software have been based on linear techniques, mainly principal components analysis (PCA) and Fisher's linear discriminant analysis (LDA) [3,17]. PCA is a signal representation technique that generates projections along the directions of maximum variance, which are defined by the eigenvectors of covariance matrix. LDA is a signal classification technique that directly maximizes class separability, generating projections where the examples of each class form compact clusters and the different clusters are far from each other. The LDA algorithm selects features that are most effective for class separability, while PCA selects features important for class representation. Initially, the most common practice for recognition of gaseous analytes was to use the steady state responses of the sensors as a feature vector [1–3,17]. At the same time, the transient response contains sufficient discriminatory information. Later, multiple successful studies have been conducted in order to expand the LDA and PCA for transient response. In these studies, the feature vector was extracted using a variety of methods, such as fast Fourier transform (FFT) [17], Continuous wavelet transform [18], Gardner transform, multi-exponential transient spectroscopy, Pade-Laplace and Pade-Z transforms [19], and dynamic moments [20]. In an earlier work [21] the authors demonstrated the extraction of a transient feature, which is strongly correlated with the steady-state response, but available much earlier than the latter. Once the features are extracted, the back-propagating PCA or LDA-based neural network is typically used for predictive classification.
There is no universal sensor system that can solve all the gas or vapor analysis problems. Instead, there is a need to employ intelligent sensor systems that are appropriate to the application. This means building in intelligence through the development of suitable sensor structures, sensor materials and pattern recognition methods. In this paper we present a technique that allows one to build a simple vapor recognition system based on a single broadly-tuned metal-oxide chemiresistor, fabricated using atomic layer deposition (ALD). This method is based on the combination of fast Fourier transform (FFT) with exponential windowing and Quadratic Discrininant Analysis (QDA). It is specifically designed for rapid delivery of the analyte to the sensor in the form of short 0.1 s bursts and takes advantage of the rising and declining parts of the response curve. In contrast to the traditional analysis of the steady-state responses, the advantage of this method is the ability to analyze the entire catalytic process occurring on the sensor. Sensor calibration was performed via a VaporJet calibrator, which simulates vapor-pulse delivery typical for pre-concentrators of analytes [1,22]. This approach has strict physical validation, since the time-dependent features of the response curve are uniquely determined by a particular catalytic reaction. The number of extracted features in our method does not have limitations and can be adjusted depending on tested analytes.
2. Experimenal Design
Chemiresistors were fabricated using a Beneq atomic layer deposition (ALD) system TFS 500 for deposition of ZnO on the silicon oxide substrates. ALD utilizes a binary reaction sequence of self-saturating chemical reactions between gaseous precursor molecules and a solid surface to deposit films in a monolayer-by-monolayer fashion. ALD of ZnO was conducted at 150 °C using diethyl zinc (DEZ) and deionized water (H2O) as zinc and oxygen sources, respectively [23–26]. During the deposition, the background pressure of 1 Torr in the reaction chamber was maintained by a steady flow (300 sccm) of the process gas nitrogen. Each ALD reaction cycle included a 250 ms DEZ pulse, followed by a 2 s pressurizing with nitrogen purge, a 250 ms H2O pulse and another 2 s nitrogen purge. A complete layer deposition consisted of 375 cycles. Following the above procedure, a uniformly distributed 85 nm polycrystalline ZnO coating was achieved.
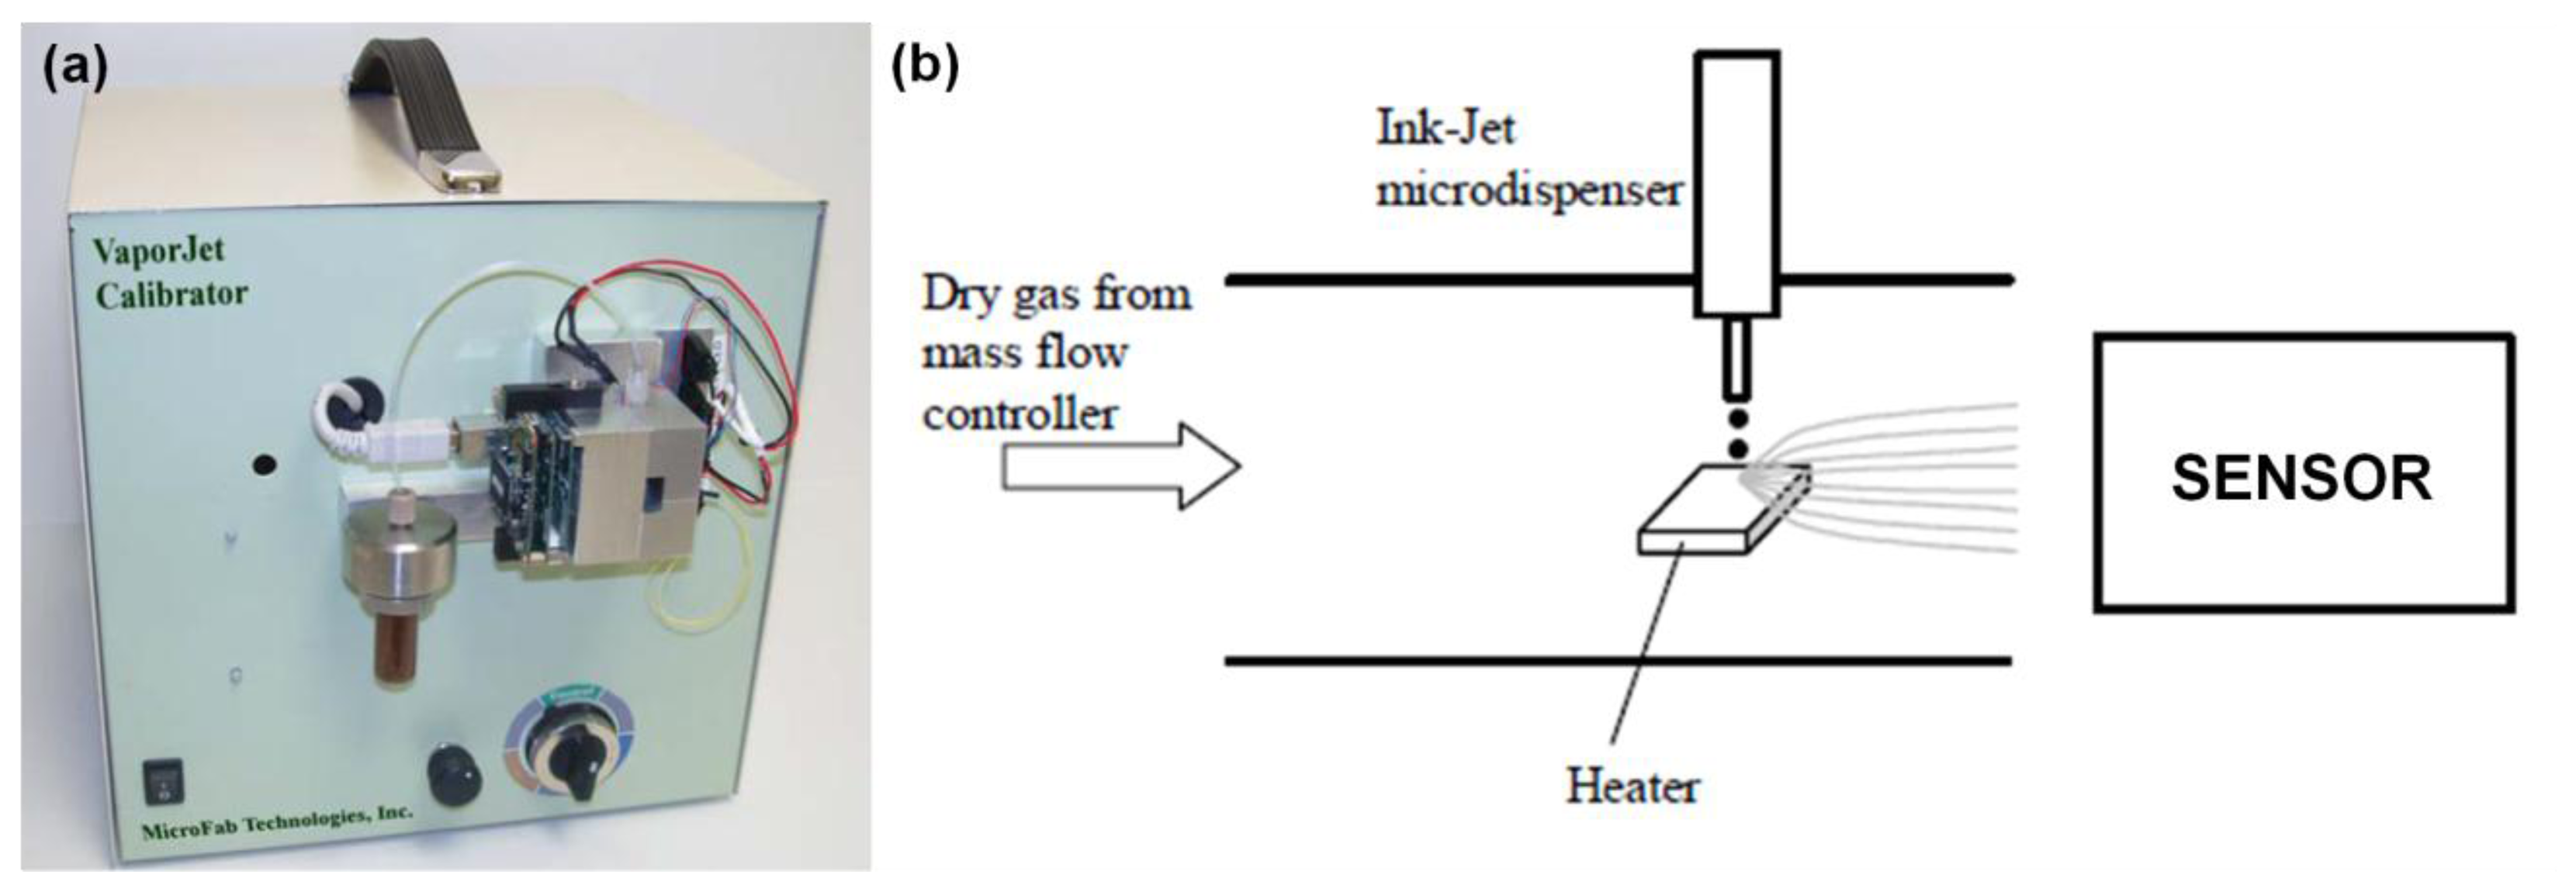
A standard two electrode test geometry was used for measuring the electrical response of chemiresistor to chemical vapors. Electrodes were deposited on the ZnO layer using shadow masking and consisted of the adhesion 50 nm thick nickel layer followed by 250 nm layer of gold. The electrodes were annealed and the ohmic nature of ZnO-metal contacts was verified by I–V characterization. The 5 mm × 5 mm sensor was connected to a thermocouple and placed on a variable temperature platform for temperature control. Sensor responses were acquired with a Keithley 3706 six-slot system switch with a high-speed multiplexer Keithley 3723 card interfaced to a computer via Labview-operated data acquisition software for real time conductance measurements. The sensor's operational temperature range was found to be between 100 °C and 500 °C. The lack of sensitivity below 100 °C is due to a sufficient drop in surface oxygen vacancies below this temperature. The reduction of sensitivity above 500 °C is caused by the activation of surface phonons resulting in a sufficient increase in the oxygen desorption rate. Maximum sensor response was achieved at 400 °C. The sensor was initially heated to 400 °C in synthetic air at ambient pressure to obtain a steady state resistance. Once the steady state resistance was achieved, pulses of vapors were introduced in the air flow by a MicroFab VaporJet calibrator (Figure 2a).
The principle of operation of the VaporJet calibrator is shown in Figure 2b. The ink-jet dispenser that is employed in the VaporJet calibrator is drop-on-demand (DOD), meaning that it can produce a drop only when required. The actuation of the dispenser is done with a piezoelectric element. The dispenser consists of a glass tube having an orifice at one end and being connected by the means of Teflon™ tubing to the reservoir containing the solution to be dispensed. An annular piezoelectric element poled in the radial direction is bonded to the glass using a thin epoxy layer. When voltage is applied to the piezoelectric actuator, the actuator contracts or expands (depending on the direction of the electric field produced in the piezoelectric element relative to the poling direction) and this deformation is transmitted to the glass and then to the fluid. Because the structural response is very fast and the solution to be dispensed is in contact with the glass, the motion of the structure translates in a volumetric change in the solution. The change produces a localized pressure variation that travels as acoustic waves in the solution contained by the glass tube. The details of VaporJet design and operation can be found in [22]. Thanks to the advantages of this technology, short 0.1 s pulses of various analytes were used for sensor exposure in this study.
3. Signal Processing and Pattern Recognition
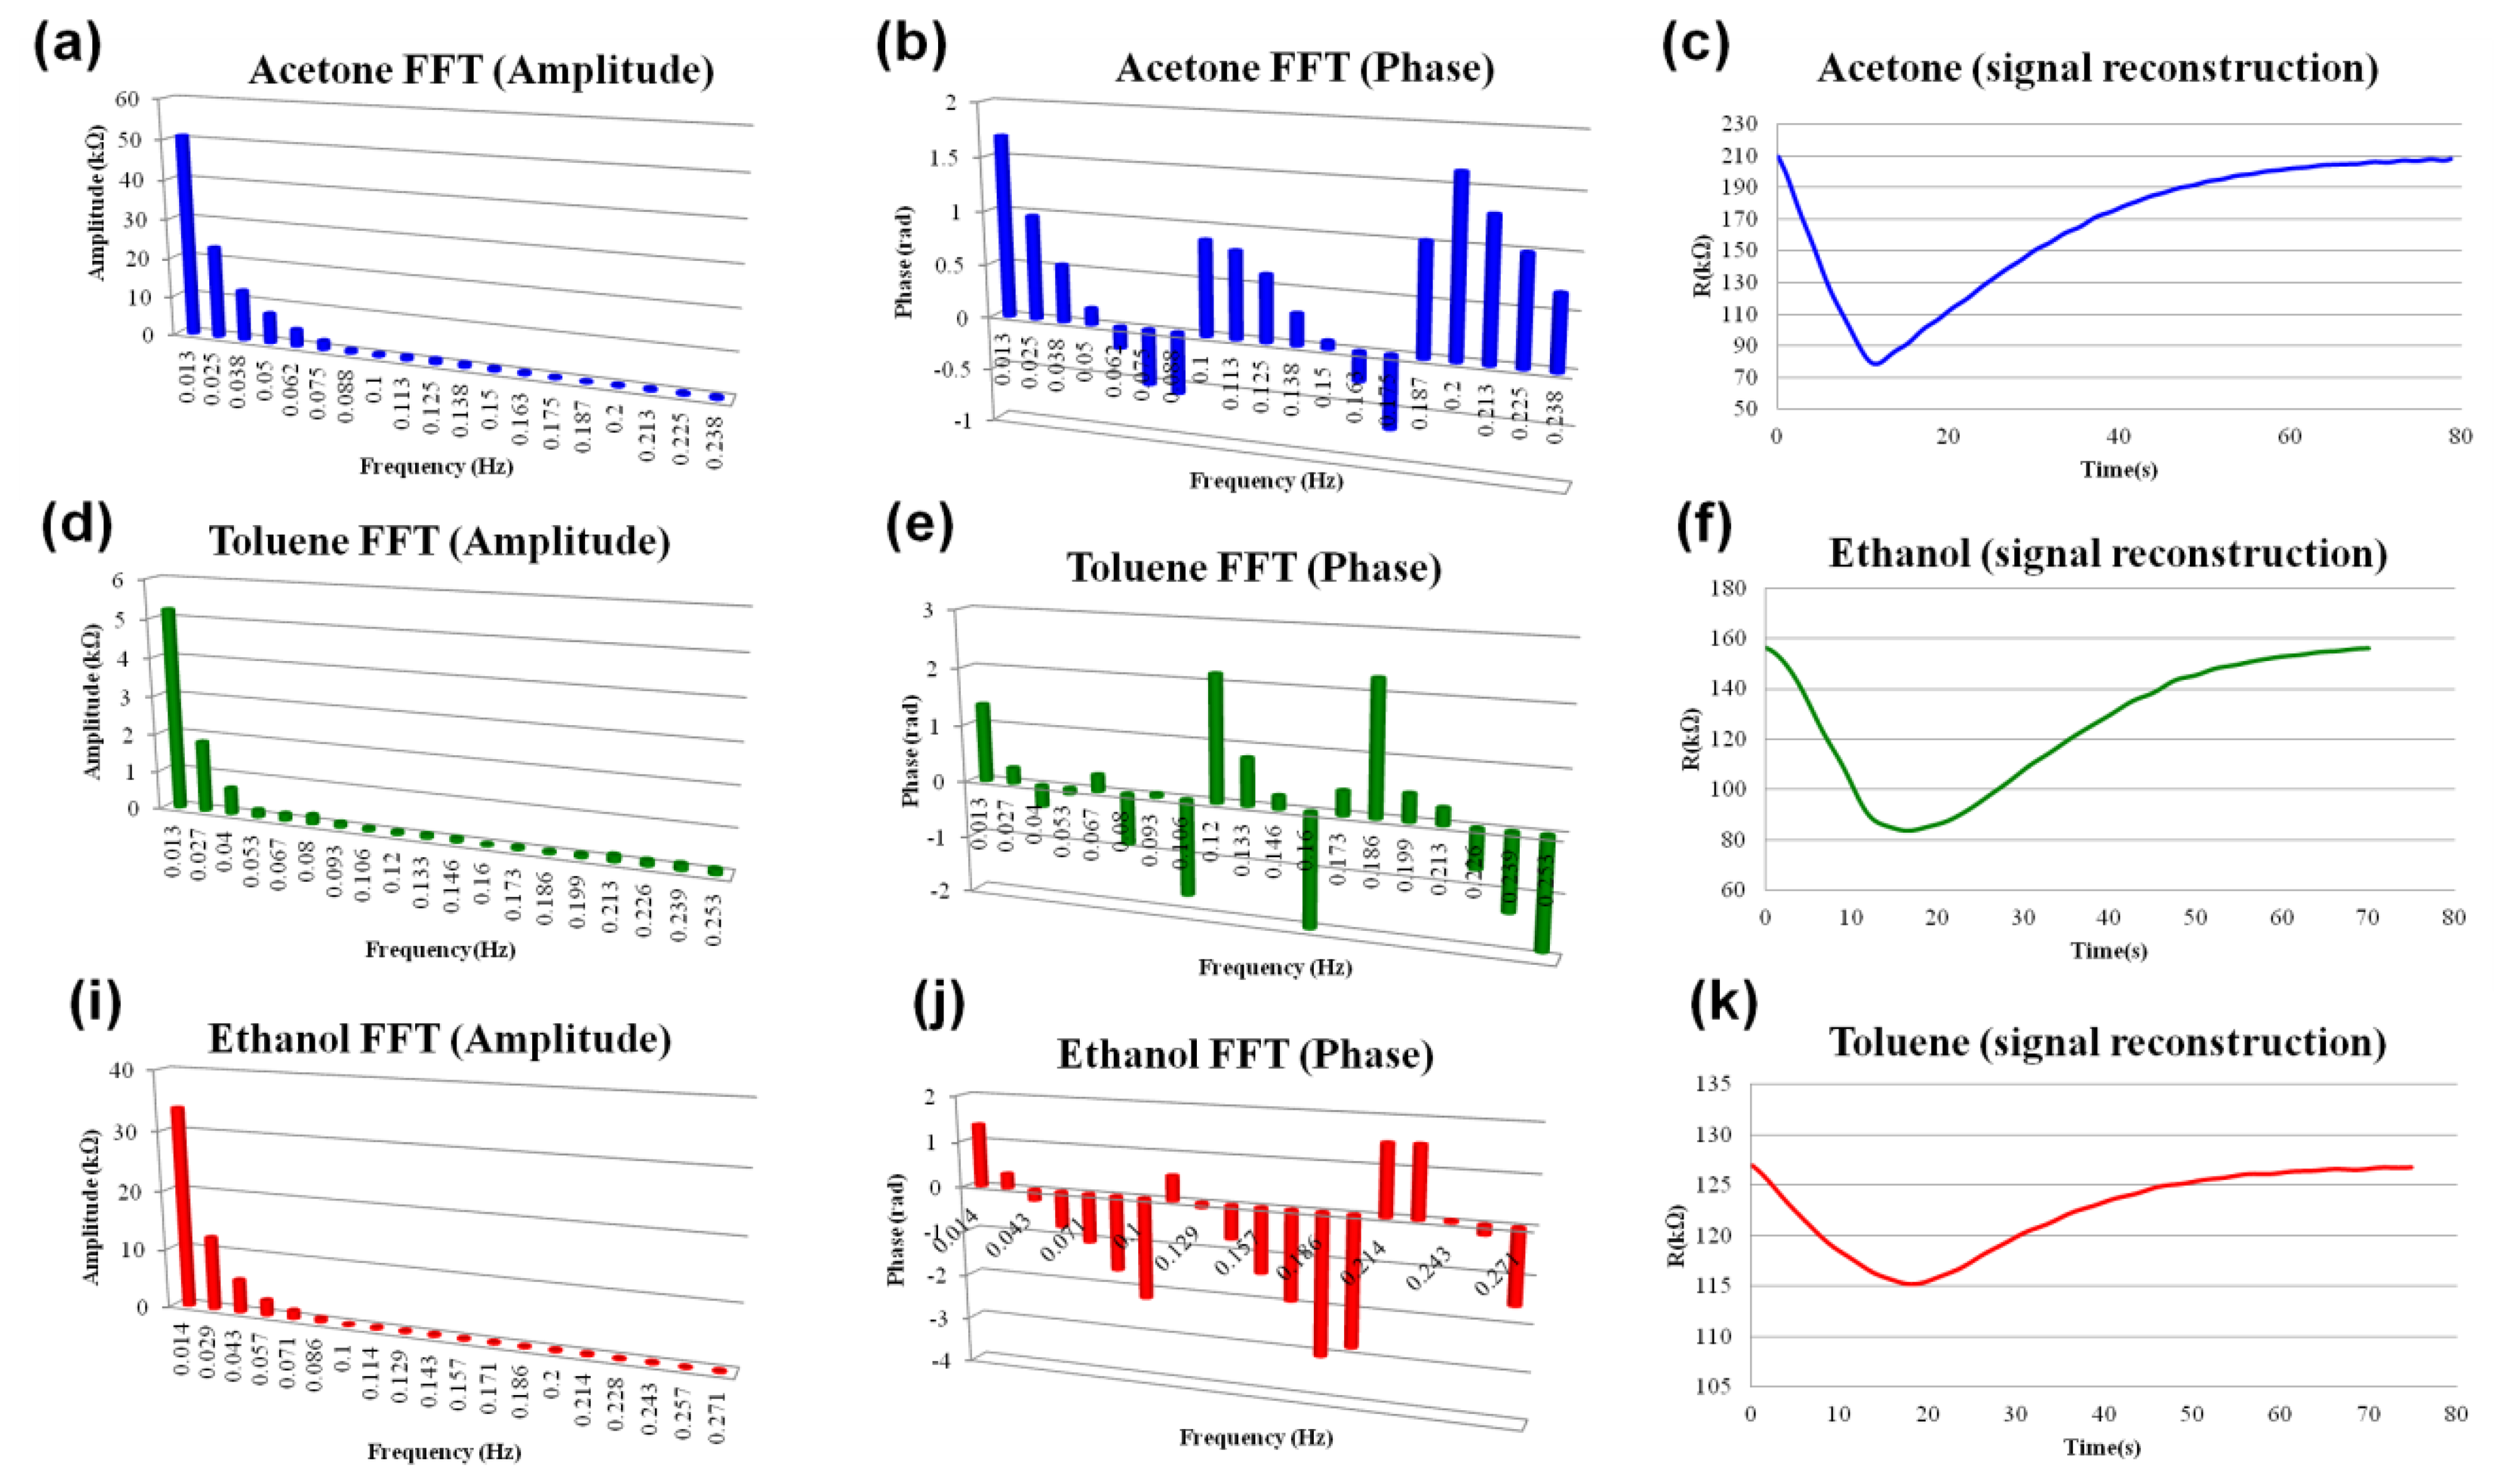
The signal processing and pattern recognition techniques are demonstrated on the example of three combustible substances: ethanol, toluene and acetone. All three of the tested chemicals effectively participate in a rapid catalytic oxidation on the surfaces of metal oxides. In the present study, the partial vapor pressures of the analytes in the ambient atmosphere were between 100 and 150 ppm. The raw data curves obtained from the sensors upon the exposure to 100 ppm of toluene, acetone and ethanol are shown in Figure 3a–c. Typically, the relative change of the sensor resistance in the range 0.1–10 times can only be achieved after a few seconds of exposure [10–16]. A significant change in resistance of the atomically deposited ZnO layer upon the 0.1 s exposure of 100 ppm analyte pulse can be broadly categorized as a finite size effect. Specifically, the diffusion of the molecular species between the neighboring nanocrystals, as opposed to depletion of free carriers over the entire surface of an individual ZnO nanocrystal, creates stochastic contact potentials at grain boundaries (Figure 4). The contact potential can be viewed as a tunneling barrier to electrons, which in our case is modulated by the oxidation of the analyte. It is well known that the surface area and the surface defects are crucial for a high sensitivity given that the ionization happens primarily on the edges and corners of the nanocrystals [4–6]. This explains the superior sensitivity of the ALD fabricated polycrystalline oxide films. The amplitudes of sensor responses are clearly different for different chemicals, which gives a discrimination mechanism for pure analytes having the same vapor pressure; however, the amplitude data can be insufficient if the vapor pressures are different. In addition, a common sensor drift problem makes vapor recognition by amplitude using a single nonspecific chemiresistor impossible.
A more productive approach would be to represent the entire response signal as a mathematical object suitable for processing by the recognition algorithm. The stages of signal processing and pattern recognition are shown in Figure 1d. In order to analyze the sensor response, the meaningful part of the response curve corresponding to the catalytic reaction on the surface has to be extracted. The extraction of meaningful part can be divided in two stages. A drop of resistance, corresponding to vapor exposure, is a relatively fast process compared to the rising part of the curve, corresponding to the recovery of oxygen species on the chemiresistor surface (Figure 1c). By monitoring the time derivative of the curve, the moment of rapid resistance drop can be detected. This moment is a starting point of the extracted signal. The sensor recovery takes longer, compared to the reaction phase. Therefore, the ending point of the extracted signal was determined by the analysis of an autocorrelation coefficient [27]:
The number of classes, as well as the structure of boundaries between the classes, is completely determined by the training data set. Therefore, with an increase in the number of training inputs, the structure of boundaries will evolve and eventually stabilize. For very different chemicals like acetone, ethanol and toluene at 100 ppm levels of concentrations the electronic smell-prints are perfectly separable. However, for similar analytes, like DNT and TNT, at lower levels of concentrations (ppb, ppt), the smell-prints will be less distinguishable and the statistical analysis of an integrated signal from multiple sensors with different catalytic properties will become essential. The extension of this method for multi-sensor detection will be considered in our future publications.
4. Effect of Humidity on Sensor Performance
One of the most complex problems of current sensor technology is the common issue of sensor drift due to the environmental conditions. Because of this, steady-state amplitude analysis has the potential to lead to false positives if the recognition algorithm training was conducted at a different humidity level than field conditions. This effect is especially well pronounced at low analyte concentrations, where drift becomes comparable with the sensor response. In contrast, the spectral analysis of the transient response is significantly more robust. In order to illustrate this point, vapor recognition using a transient response of a single chemiresistor was compared with recognition using the steady-state response of an integrated system of three chemiresistors with different thicknesses of sensing metal oxide layers. The discrimination between the acetone and ethanol at 10 ppm concentration levels was studied at different humidity levels. Water vapor was introduced in the ambient air flow to simulate varying levels of humidity using a standard chemical bubbler. The input for a single-sensor recognition system was in the form of 4 s exposures, while for the multi-sensory system sensors were exposed to analyte until they reached a steady-state.
The extracted features for 16 exposures (eight exposures to acetone and eight to ethanol) for both configurations are shown in Figure 7a,b. For each analyte, the humidity level from exposure to exposure was adjusted by ∼3% in the range between 60% and 85%. Figure 7a shows the amplitude output of a multisensory system, and Figure 7b shows the sub-space of the first harmonic extracted from the transient response. Quantitatively, the harmonic and amplitude recognition techniques can be compared by using probability density functions (PDF). By decreasing the amount of dimensions and projecting the data points into C-1 dimensional space where C is the number of classes, we maximize the separation between classes and minimize the separation within the classes. Figure 7c,d show the probability density for acetone and ethanol as functions of coordinate x that was obtained by transformation of coordinates according to Fisher's criteria of LDA [3,17]. As it can be seen from the figure, the steady-state amplitude analysis leads to wide and overlapping distributions for two classes (Figure 7c), while the harmonic analysis generates well-separated narrow peaks (Figure 7d). The insets in the graphs show the mean values and standard deviations for each of the distributions. Also, in order to provide a quantitative evaluation of the steady-state and harmonic analysis, we compared a parameter:
5. Conclusions
The application of spectral analysis to the response signals of conductometric sensors was discussed. The analysis was demonstrated on the example of an ALD-fabricated ZnO chemiresistor, upon exposure to short 0.1 s pulses of analytes. The techniques of signal extraction, enhancement, spectral analysis and reconstruction were demonstrated. The recognition of analytes was accomplished by separating them in multi-dimentional hyperspace of extracted spectral characteristics using Quadratic Discriminant Analysis. The method helps to overcome common problems like short-term sensor drift and limited amount of the extracted signal features. The presented technique allows one to build a simple vapor recognition system based on a single broadly-tuned metal-oxide chemiresistor. The method can be further developed for the integrated sensor arrays for recognition of more complex analytes.
Acknowledgments
Authors would like to thank the Office of Naval Research (grant # N00014-10-1-0282) for the support of this work.
Conflict of Interest
The authors declare no conflict of interest.
References
- Handbook of Machine Olfaction: Electronic Nose Technology; Pearce, T.C., Schiffman, S.S., Nagle, H.T., Gardner, J.W., Eds.; Wiley-VCH: Weinheim, Germany, 2003.
- Yinon, J. Detection of explosives by electronic noses. Anal. Chem. 2003, 75, 98A–105A. [Google Scholar]
- Pattern Recognition and Machine Learning; Bishop, C.M., Nasrabadi, N.M., Eds.; Springer: New York, NY, USA, 2006.
- Vladimir, D.; Landon, O.; Dewayne, S.; Alexander, L.; Alex, K.; Pavel, B.; Giancarlo, C.; Timothy, C.; Tej, P.; Joseph, W.; et al. ZnO coated nanospring-based chemiresistors. J. Appl. Phys. 2012, 111, 044311. [Google Scholar]
- Vladimir, D.; Landon, O.; Dewayne, S.; Alexander, L.; Alex, K.; Pavel, B.; Giancarlo, C.; Timothy, C.; Tej, P.; Joseph, W.; et al. Towards the nanospring-based artificial olfactory system for trace-detection of flammable and explosive vapors. Sens. Actuators B Chem. 2012, 168, 138–148. [Google Scholar]
- Vladimir, D.; Landon, O.; Dewayne, S.; Alexander, L.; Alex, K.; Pavel, B.; Giancarlo, C.; Timothy, C.; Tej, P.; et al; Joseph, W. Thermal and optical activation mechanisms of the nanospring-based chemiresistors. Sensors 2012, 12, 5608–5622. [Google Scholar]
- Dobrokhotov, V.V.; McIlroy, D.N.; Norton, G.M.; Abdelrahaman, R.; Safir, A.; Berven, C.A. Interaction of hybrid nanowire–nanoparticle structures with carbon monoxide. Nanotechnology 2009, 20, 135504. [Google Scholar]
- Dobrokhotov, V.V.; McIlroy, D.N.; Norton, M.G.; Berven, C.A. Transport properties of hybrid nanoparticle-nanowire systems and their application to gas sensing. Nanotechnology 2006, 17, 4135–4142. [Google Scholar]
- Dobrokhotov, V.; McIlroy, D.N.; Grant Norton, M.; Abuzir, A.; Yeh, W.J.; Stevenson, I.; Pouy, R.; Bochenek, J.; Cartwright, M.; Wang, L.; et al. Principles and mechanisms of gas sensing by Gan-nanowires functionalized with gold nanoparticles. J. Appl. Phys. 2006, 99, 104302. [Google Scholar]
- Kolmakov, A.; Klenov, D.O.; Lilach, Y.; Stemmer, S.; Moskovits, M. Enhanced gas sensing by individual SnO2 nanowires and nanobelts functionalized with Pd catalyst particles. Nano Lett. 2005, 5, 667–673. [Google Scholar]
- Sysoev, V.V.; Joachim, G.; Thomas, S.; Evghenii, S.; Andrei, K. A gradient microarray electronic nose based on percolating SnO2 nanowire sensing elements. Nano Lett. 2007, 7, 3182–3188. [Google Scholar]
- Sysoev, V.V.; Ilya, K.; Markus, F.; Joachim, G. Temperature gradient effect on gas discrimination power of a metal-oxide thin-film sensor microarray. Sensors 2004, 4, 37–46. [Google Scholar]
- Sysoev, V.V.; Bradly, K.; Button, K.W.; Serghei, D.; Andrei, K. Towards the nanoscopic “electronic nose”: Hydrogen versus carbon monoxide discrimination with an array of individual metal oxide nano- and meso-wire sensors. Nano Lett. 2006, 6, 1584–1588. [Google Scholar]
- Doleman, B.J.; Sanner, R.D.; Severin, E.J.; Grubbs, R.H.; Lewis, N.S. Use of compatible polymer blends to fabricate arrays of carbon black–polymer composite vapor detectors. Anal. Chem. 1998, 70, 2560–2564. [Google Scholar]
- Sotzing, G.A.; Briglin, S.M.; Grubbs, R.H.; Lewis, N.S. Preparation and properties of vapor detector arrays formed from poly(3,4-ethylenedioxy)thiophene–Poly(styrene sulfonate)/insulating polymer composites. Anal. Chem. 2000, 72, 3181–3190. [Google Scholar]
- Koscho, M.E.; Grubbs, R.H.; Lewis, N.S. Properties of vapor detector arrays formed through plasticization of carbon black–organic polymer composites. Anal. Chem. 2002, 7, 1307–1315. [Google Scholar]
- Gutierrez-Osuna, R. Pattern analysis for machine olfaction: A review. IEEE Sens. J. 2002, 2, 189–202. [Google Scholar]
- Cosimo, D.; Marco, L.; Pietro, S.; Krishna, C.P. On the study of feature extraction methods for an electronic nose. Sens. Actuators B Chem. 2002, 87, 274–288. [Google Scholar]
- Gutierrez-Osuna, R.; Nagle, H.T.; Schiffman, S.S. Transient response analysis of an electronic nose using multi-exponential models. Sens. Actuators B Chem. 1999, 61, 170–182. [Google Scholar]
- Alexander, V.; Eduard, L.; Eugenio, M.; Corrado, D.N.; Arnaldo, D'A.; Xavier, C. Feature extraction of metal oxide gas sensors using dynamic moments. Sens. Actuators B Chem. 2007, 122, 219–226. [Google Scholar]
- Mehmet, K.; Muezzinoglua, A.V.; Ramon, H.; Nikolai, R.; Mikhail, I.; Rabinovich, A.S.; Henry, D.I.A. Acceleration of chemo-sensory information processing using transient features. Sens. Actuators B Chem. 2009, 137, 507–512. [Google Scholar]
- Antohe, B.V.; Hayes, D.J.; Ayers, S.; Wallace, D.B.; Grove, M.E.; Christison, M. Portable Vapor Generator for the Calibration and Test of Explosive Detectors. Proceedings of the 2009 IEEE International Conference on Technologies for Homeland Security, Boston, MA, USA, 11–12 May 2009.
- Elam, J.W.; Groner, M.D.; George, S.M. Viscous flow reactor with quartz crystal microbalance for thin film growth by atomic layer deposition. Rev. Sci. Instrum. 2002, 73, 2981. [Google Scholar]
- George, S.M.; Ott, A.W.; Klaus, J.W. Surface chemistry for atomic layer growth. J. Phys. Chem. 1996, 100, 13121–13131. [Google Scholar]
- Elam, J.W.; George, S.M. Growth of ZnO/Al2O3 alloy films using atomic layer deposition techniques. Chem. Mater. 2003, 15, 1020–1028. [Google Scholar]
- Guziewicz, E. ZnO by ALD-advantages of the material grown at low temperature. Acta Phys. Polon. A 2009, 116, 814–817. [Google Scholar]
- Peter, B. Fourier Analysis of Time Series: An Introduction; John Wiley and Sons: New York, NY, USA, 2003. [Google Scholar]
- Vergara, A.; Vembu, S.; Ayhan, T.; Ryan, M.A.; Margie, L.H.; Ramón, H. Chemical gas sensor drift compensation using classifier ensembles. Sens. Actuators B Chem. 2012, 166, 320–329. [Google Scholar]


| Method | Distance between the Classes | Sum of Standard Deviations of Classes | J |
|---|---|---|---|
| Harmonic Analysis | 0.0132 | 790 × 10−6 | 16.709 |
| Steady-state Amplitude Analysis | 0.122 | 126 × 10−3 | 0.968 |
© 2013 by the authors; licensee MDPI, Basel, Switzerland. This article is an open access article distributed under the terms and conditions of the Creative Commons Attribution license (http://creativecommons.org/licenses/by/3.0/).
Share and Cite
Dobrokhotov, V.; Larin, A.; Sowell, D. Vapor Trace Recognition Using a Single Nonspecific Chemiresistor. Sensors 2013, 13, 9016-9028. https://doi.org/10.3390/s130709016
Dobrokhotov V, Larin A, Sowell D. Vapor Trace Recognition Using a Single Nonspecific Chemiresistor. Sensors. 2013; 13(7):9016-9028. https://doi.org/10.3390/s130709016
Chicago/Turabian StyleDobrokhotov, Vladimir, Alexander Larin, and Dewayne Sowell. 2013. "Vapor Trace Recognition Using a Single Nonspecific Chemiresistor" Sensors 13, no. 7: 9016-9028. https://doi.org/10.3390/s130709016