Mutational Analysis of a Red Fluorescent Protein-Based Calcium Ion Indicator

Abstract
: As part of an ongoing effort to develop genetically encoded calcium ion (Ca2+) indicators we recently described a new variant, designated CH-GECO2.1, that is a genetic chimera of the red fluorescent protein (FP) mCherry, calmodulin (CaM), and a peptide that binds to Ca2+-bound CaM. In contrast to the closely related Ca2+ indicator R-GECO1, CH-GECO2.1 is characterized by a much higher affinity for Ca2+ and a sensing mechanism that does not involve direct modulation of the chromophore pKa. To probe the structural basis underlying the differences between CH-GECO2.1 and R-GECO1, and to gain a better understanding of the mechanism of CH-GECO2.1, we have constructed, purified, and characterized a large number of variants with strategic amino acid substitutions. This effort led us to identify Gln163 as the key residue involved in the conformational change that transduces the Ca2+ binding event into a change in the chromophore environment. In addition, we demonstrate that many of the substitutions that differentiate CH-GECO2.1 and R-GECO1 have little influence on both the Kd for Ca2+ and the sensing mechanism, and that the interdomain linkers and interfaces play important roles.1. Introduction
Molecular sensors that enable non-invasive fluorescence imaging of intracellular Ca2+ dynamics with high spatial and temporal resolution are powerful tools in modern cell biology and neuroscience research. As the Ca2+ ion is a universal “second messenger”, detection of elevated Ca2+ levels can reveal when an intracellular signaling pathway is being activated [1], or when an excitable cell is experiencing an action potential [2]. While organic dye-based Ca2+ indicators have long been a mainstay of such research [3], over the last decade proteinaceous Ca2+ indicators have emerged as a preferred alternative for many applications. The major advantage of proteinaceous Ca2+ indicators is that they are genetically encodable and thus can be tissue-selectively expressed and imaged in transgenic model organisms [4].
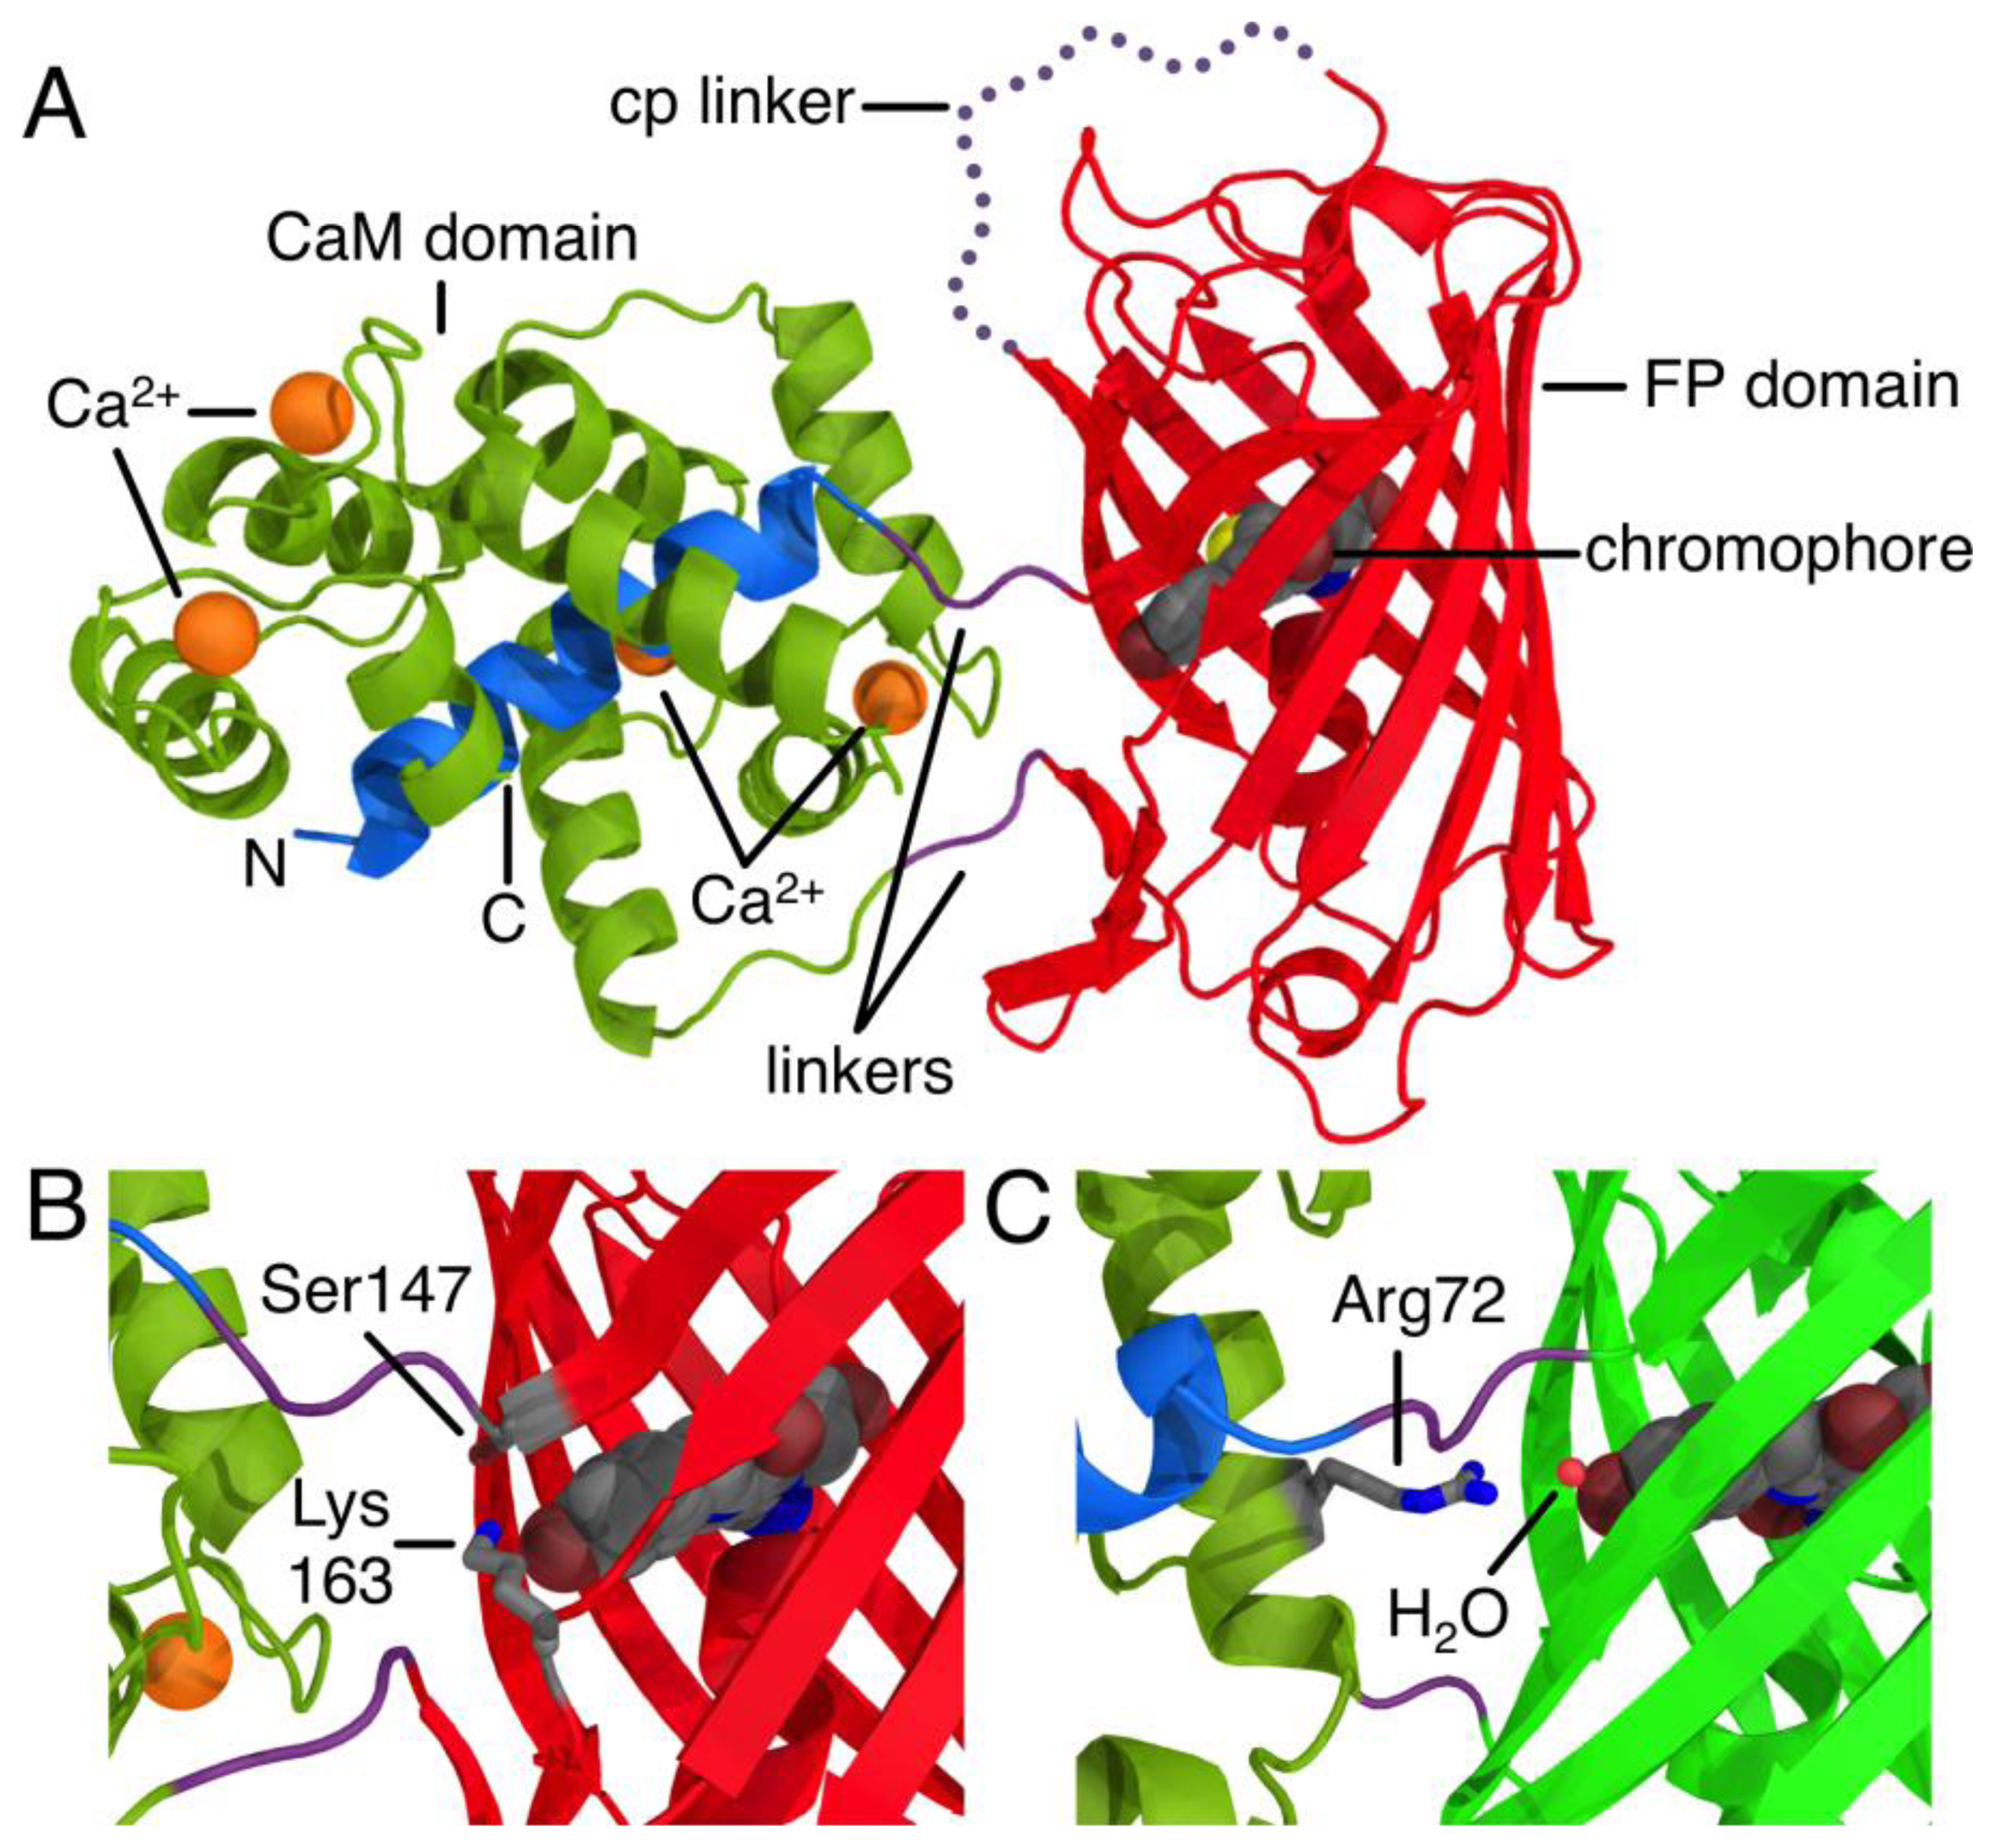
The development of proteinaceous Ca2+ indicators became a possibility only after the discovery, cloning, and subsequent optimization of the Aequorea victoria green FP [5]. Due to its inherent ability to generate a chromophore through an autonomous series of post-translational modifications, the green FP uniquely provides a means of genetically encoding a fluorophore. The first FP-derived Ca2+ indicators were based on the Ca2+-dependent modulation of Förster Resonance Energy Transfer (FRET) efficiency between two FP variants with different hues [1]. Subsequent protein engineering efforts led to the development FP-derived Ca2+ indicators based on a single FP that exhibited an intensiometric response of Ca2+ [6,7]. Such single FP-derived indicators are composed of a circularly permuted FP variant with new termini in close proximity to the centrally located chromophore. Fused to one of these new termini is the Ca2+-binding protein CaM, and fused to the other termini is the M13 peptide that binds to Ca2+-bound CaM (Figure 1A). The generally accepted mechanism of such sensors is that the chromophore is exposed to the solvent and the fluorescence is largely quenched in the absence of Ca2+. Binding of Ca2+ causes an interaction between CaM and its peptide binding partner that stabilizes the chromophore in a conformation and environment where fluorescent brightness is increased due to higher quantum yield and/or extinction coefficient. Such a stabilizing interaction is apparent in the X-ray crystal structure of R-GECO1, where a lysine side chain from a neighboring β-strand is stabilizing the fluorescent phenolate form of the chromophore in the Ca2+-bound state (Figure 1B) [8]. Similarly, in GCaMP2 [9,10], an arginine side chain from CaM bridges the CaM to FP interface and stabilize the phenolate form of the chromophore in the Ca2+-bound state (Figure 1C).
Since 2001 when the single FP Ca2+ indicator design was first reported [6,7], dedicated optimization efforts have produced an ever-improving series of improved GCaMP variants [2,11–13]. Recent years have also seen the introduction of an expanded color palette of Ca2+ indicators based on both engineered versions of Aequorea green FP [8,14] as well as homologous red fluorescent Anthozoan FPs from organisms such as Entacmaea quadricolor sea anemone [8] and Discosoma sp. coral [14,15]. The prototypical red fluorescent indicator is R-GECO1 [14] that was engineered from the Discosoma-derived FP known as mApple [16]. Some of the most recent additions to this growing selection of red fluorescent indicators are CH-GECO2.0 and CH-GECO2.1 [17], which were engineered from the popular Discosoma-derived red FP known as mCherry [18].
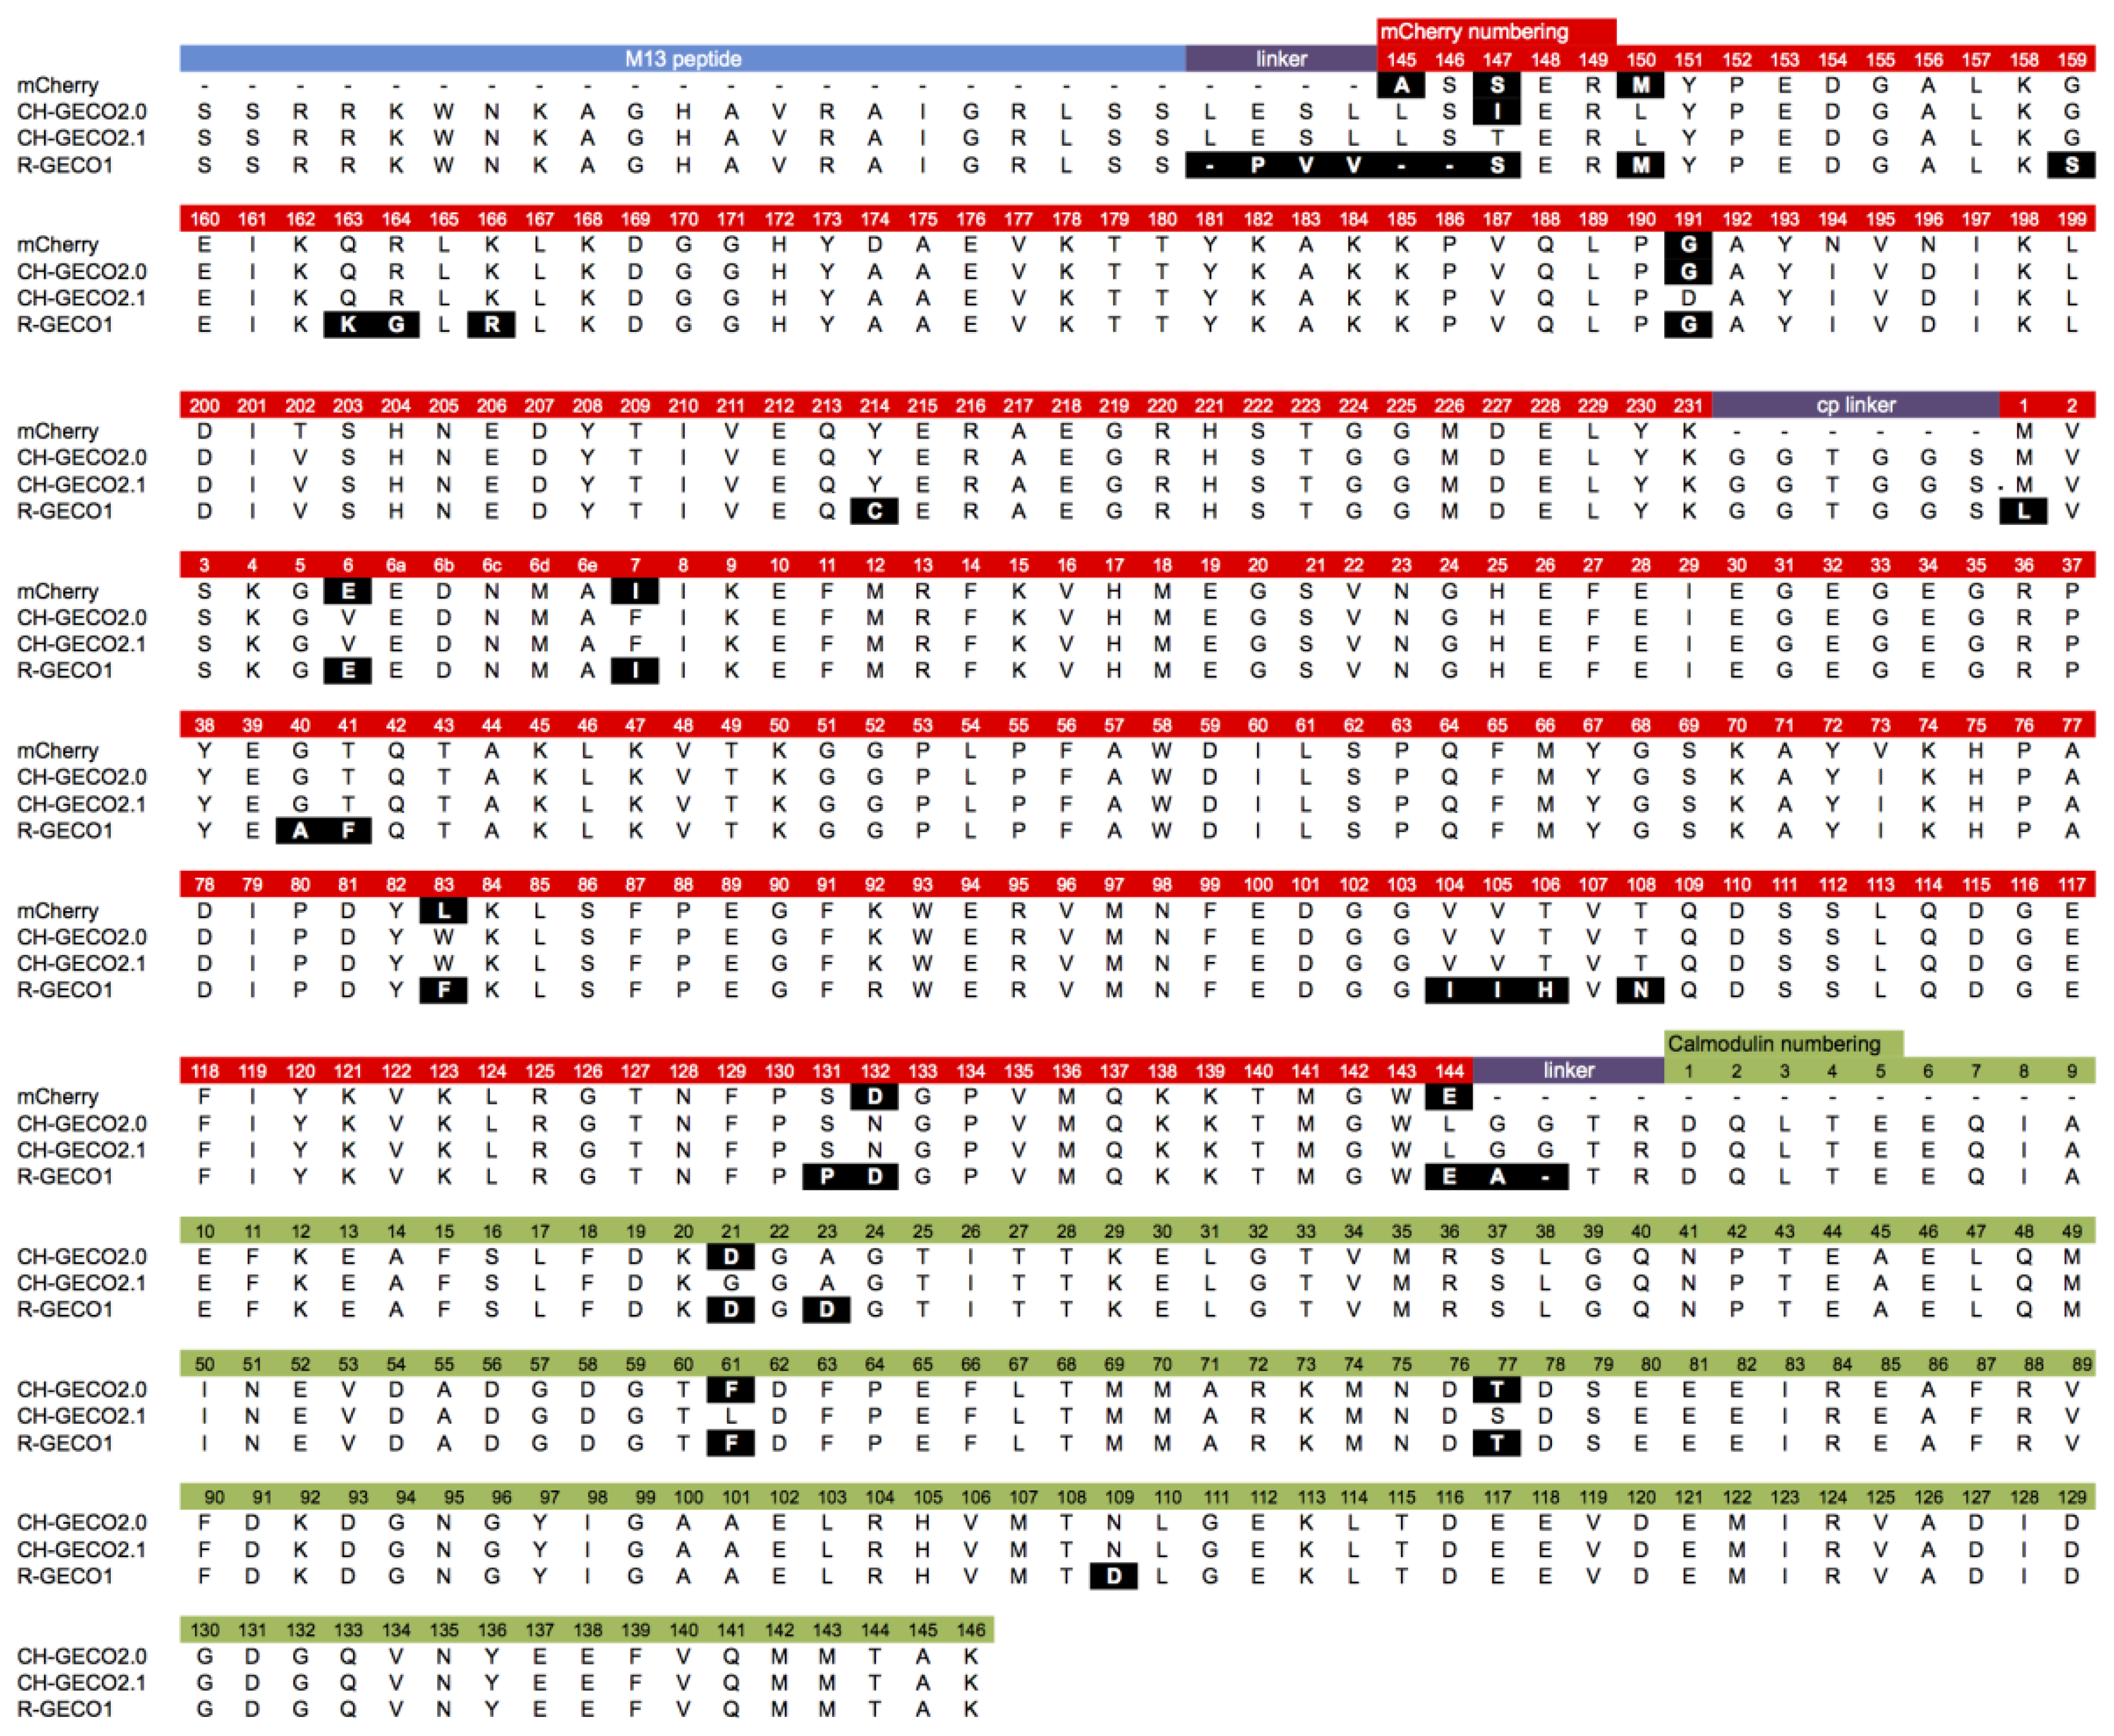
Although they are both ultimately derived from the same wild-type protein, the extensive processes of directed evolution that led to R-GECO1 and CH-GECO2.1 have introduced a considerable number of differences in the amino acid sequences (Figure 2). These differences include 26 amino acid substitutions (Leu1Met, Glu6Val, Ile7Phe, Ala40Gly, Phe41Thr, Phe83Trp, Ile104Val, Ile105Val, His106Thr, Asn108Thr, Pro131Ser, Asp132Asn, Glu144Leu, Ser147Thr, Met150Leu, Ser159Gly, Lys163Gln, Gly164Arg, Arg166Lys, Gly191Asp, Cys214Tyr, Asp21Gly (CaM), Asp23Ala (CaM), Phe61Leu (CaM), Thr77Ser (CaM), and Asp109Asn (CaM), relative to R-GECO1), as well as differences in the interdomain linkers. In addition, they exhibit some quite dramatic differences in their respective Kds for binding to Ca2+ (6 nM for CH-GECO2.1 vs. 480 nM for R-GECO1) and even in the underlying mechanism by which this sensing occurs [17]. Specifically, R-GECO1 operates on the basis of Ca2+-dependent shift in the chromophore pKa [14], whereas the Ca2+ sensing mechanism of CH-GECO2.1 appears to depend on the interaction of the chromophore with a yet unidentified ionizable amino acid side chain with a pKa of ∼6.5 to 7.0 [17].
In an effort to identify which amino acid substitutions are responsible for the differences between CH-GECO2.1 and R-GECO1, and to obtain insight into the mechanism of CH-GECO2.1, we now report the characterization of a barrage of single-site mutants of CH-GECO2.1. Each variant has been characterized in terms of its Ca2+Kd as well as its fluorescence intensity as a function of pH both in the presence and absence of Ca2+. Interpreting the results of these studies in the context of the mCherry and R-GECO1 crystal structures has allowed us to propose a mechanistic basis for the response of CH-GECO2.1 to Ca2+ binding.
2. Materials and Methods
2.1. Mutagenesis
All molecular biology procedures were carried out using genes encoding either CH-GECO2.0, CH-GECO2.1, or R-GECO1 in pBAD/His B, as previously described [17]. All site-directed mutagenesis was performed using the Quikchange lightning mutagenesis kit (Agilent, Santa Clara, CA, USA) and primers designed according to the manufacturers guidelines.
2.2. Plasmid Purification
All plasmid DNA was purified from bacteria using a chloroform extraction protocol. Briefly, 150 μL of solution I (50 mM Tris, 10 mM EDTA, 100 μg/mL RNaseA, pH 8.0) was used to resuspend the bacterial pellet. Then 150 μL of solution II (1% SDS, 0.2 M NaOH) was added and the mixture is gently inverted several times. Solution III (2 M acetic acid, 3 M KOAc, pH 5.5) was added to a total volume of 450 μL and mixed to pellet the non-soluble cell debris. Finally, 150 μL of chloroform was added and mixed several times before being centrifuged at 14,000 rpm, 4 °C for 5 min. The top aqueous layer was separated, mixed with 800 μL of 100% ethanol, and then centrifuged at 4 °C for 5 min. The DNA pellet was washed with 500 μL of 70% ethanol, allowed to air-dry, and then dissolved in distilled water. Coding sequences of all gene variants were sequenced using BigDye Terminator v3.1 Cycle Sequencing Kit (Life Technologies, Carlsbad, CA, USA) and reactions were analyzed by the University of Alberta Molecular Biology Services Unit.
2.3. Protein Expression and Purification
Escherichia coli strain DH10B was transformed with the plasmid of interest by electroporation. Transformed bacteria were grown overnight on solid media containing ampicillin, and then a single colony was picked and grown overnight in 5 mL Luria broth (LB) supplemented with ampicillin at 37 °C. The 5 mL culture was then used to inoculate 250 mL of Terrific broth (TB) and grown to an optical density of 0.6. Protein expression was induced with 0.004% arabinose and the culture was grown overnight at 37 °C or for two nights at 30 °C, depending on the brightness of the protein construct. Bacteria were pelleted at 10,000 rpm, 4 °C for 10 min and the pellet was then resuspended in 10 mM Tris-Cl, 150 mM NaCl pH 7.4 at 4 °C. Cells were lysed using a cell disruptor (Constant Systems Ltd., Daventry, United Kingdom) and the debris pelleted at 14,000 rpm. Protein was purified from the supernatant by Ni-NTA affinity chromatography (Qiagen, Hilden, Germany) according to the manufactures instructions. Briefly, Ni-NTA beads were collected on a column with a vacuum manifold and washed twice with 10 mM Tris-Cl, 30 mM imidazole, 150 mM NaCl pH 8.0. The beads were gravity washed once and then eluted with 300 mM imidazole, 10 mM Tris-Cl pH 8.0. The excess imidazole was removed via buffer exchange with Amicon columns (MWCO 10,000) and 10 mM Tris-Cl, 150 mM NaCl, pH 7.3.
2.4. pH Titrations
Fluorescence intensity as a function of pH was determined by dispensing 5 μL of the protein solution into 50 μL of the desired pH buffer in triplicate into a 396-well clear-bottomed plate (Thermo Fisher Scientific, Waltham, MA, USA). Buffer solutions were prepared by adjusting the pH of a solution of 30 mM trisodium citrate and 30 mM sodium borate to pH 11.5. The pH of the solution was then adjusted with HCl (12 M and 1 M) and 10–15 mL was collected at pH value intervals of 0.5, plus two additional solutions at pH 5.25 and 5.75. Buffers were prepared both without (30 mM MOPS, 100 mM KCl, 10 mM EGTA, pH 7.2) and with (30 mM MOPS, 100 mM KCl, 10 mM CaEGTA, pH 7.2) Ca2+. Fluorescence emission for each solution was recorded using a Tecan (Maennedorf, Switzerland) Safire2 microplate reader.
2.5. Ca2+ Titrations
The apparent Kd for Ca2+ response was determined by mixing the protein solution with buffers containing various amount of Ca2+, prepared as described in the Calcium Calibration Buffer Kit from Life Technologies (Carlsbad, CA, USA). The Ca2+-free buffer (30 mM MOPS, 100 mM KCl, 10 mM EGTA, pH 7.2) and Ca2+-saturated buffer (30 mM MOPS, 100 mM KCl, 10 mM CaEGTA, pH 7.2) were mixed in different ratios to generate buffers with Ca2+ concentrations ranging from zero Ca2+ to 39 μM Ca2+. Similar to the pH titrations, 5–10 μL of the protein was mixed with 150–200 μL of each Ca2+ buffer. 50 μL of each solution was aliquotted in triplicate into a 396-well plate and the fluorescence emission was recorded using the plate reader. Emission peaks were integrated and plotted against the log of the calculated free Ca2+ concentration. Ca2+ titration curves were fit with a sigmoidal curve in order to obtain the Kd and the Hill coefficient.
3. Results and Discussion
3.1. Probing the Determinants of the Ca2+-Binding Affinity
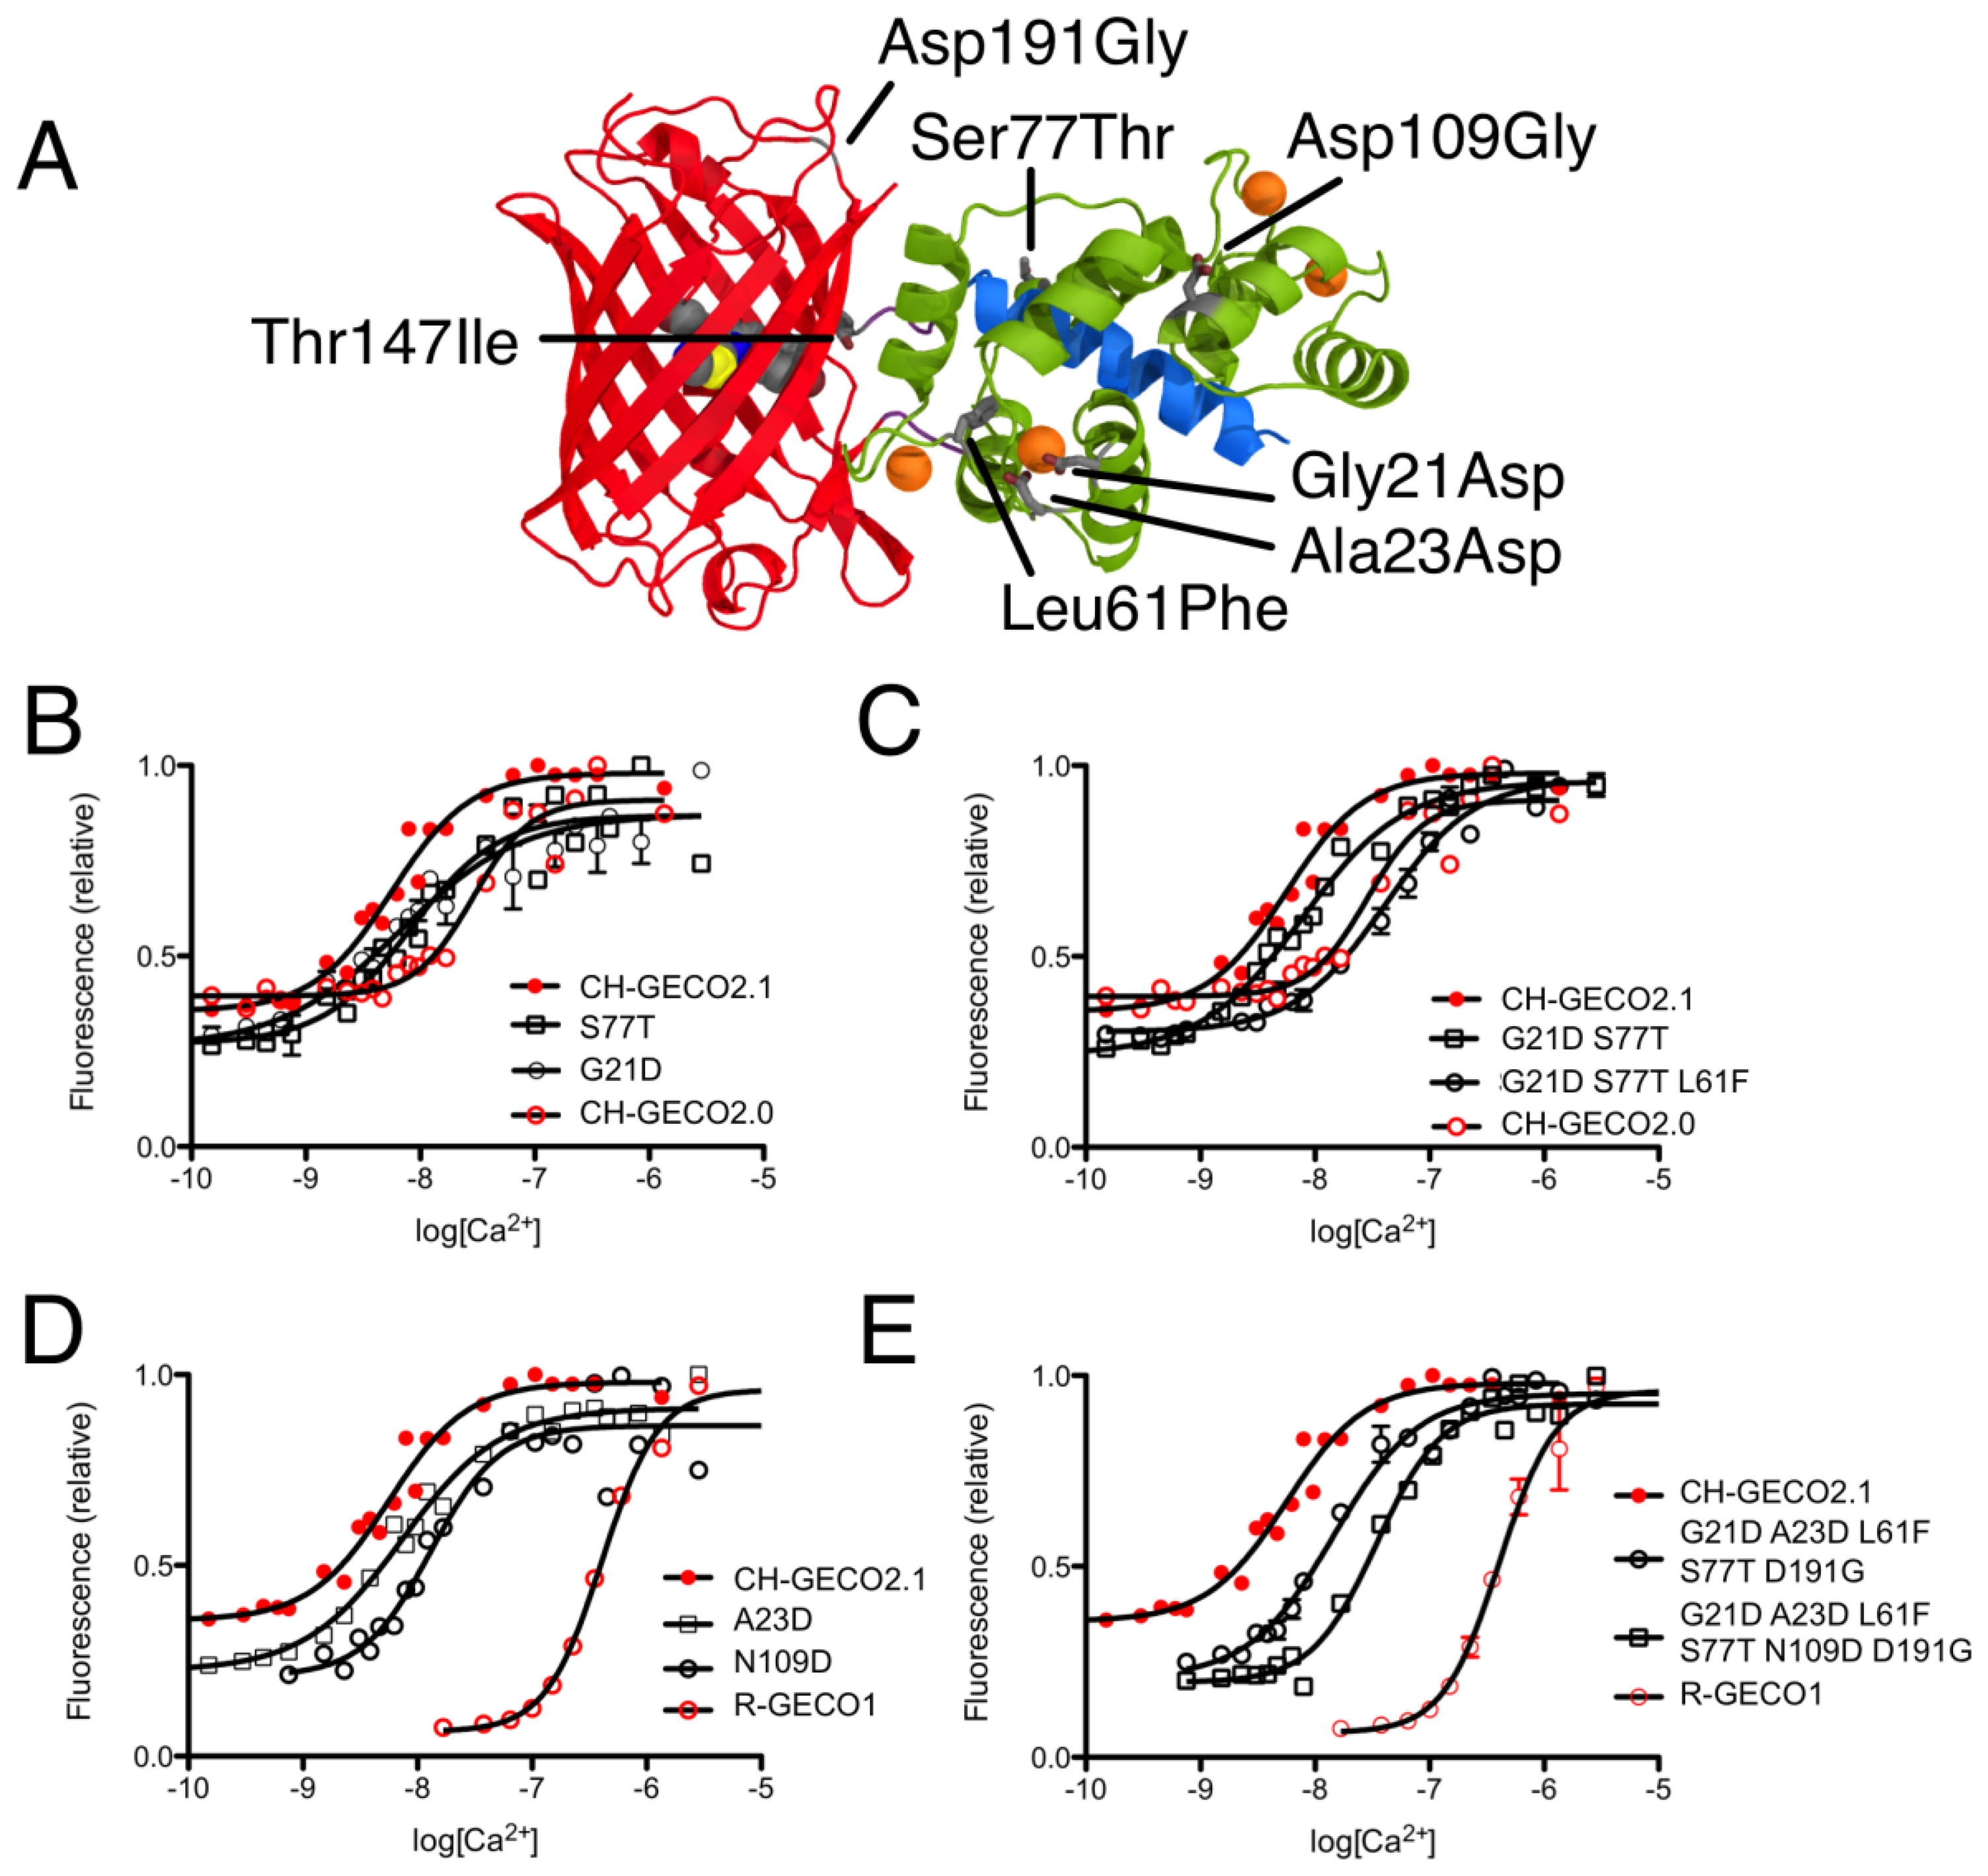
CH-GECO2.0 (Kd = 28 nM) and CH-GECO2.1 (Kd = 6 nM) [17] differ by only 3 substitutions in the CaM domain (Gly21Asp, Leu61Phe, and Ser77Thr, relative to CH-GECO2.1) and 2 substitutions in the FP domain (Thr147Ile and Asp191Gly) (Figures 2 and 3A). However the Kds for Ca2+ of these two proteins differ by a factor of 4.7. Furthermore, CH-GECO2.0 and R-GECO1 (Kd = 480 nM) [14] differ by only 1 substitution in the CaM domain (Ala23Asp, relative to CH-GECO2.0), but have Kds that differ by a factor of 17. The M13 peptide domain of all three proteins is identical. To determine which individual mutations, or combination of mutations, were responsible for the differences in Kd values, we used site directed mutagenesis to systematically revert mutations and then determined the effect on Ca2+ affinity. Notably, in wild-type CaM, Asp21 and Asp23 are two of the key Ca2+ chelating residues of the first EF hand [19].
We first introduced mutations to revert the CaM sequence of CH-GECO2.1 back to CH-GECO2.0. Results for all mutations discussed in this work are summarized in Supplementary Table 1. We determined that CH-GECO2.1 with Gly21Asp or Ser77Thr gave Kd values of 7 nM and 8 nM respectively (Figure 3B). We were unable to purify any soluble protein for CH-GECO2.1 Leu61Phe, which is located near the second EF hand of CaM. Previous studies of CaM have demonstrated that mutations in the second EF hand are more detrimental to the Ca2+ affinity than mutations in the first EF hand [20]. The combination of Gly21Asp and Ser77Thr results in a Kd of 13 nM, which is somewhat higher than either substitution alone. Addition of the Leu61Phe mutation yielded a Kd of 44 nM for the triple mutant (Figure 3C). Overall, this result demonstrates that these three mutations in the CaM domain account for most of the difference between the Kd values of CH-GECO2.0 and CH-GECO2.1. The fact that the Kd values of CH-GECO2.0 (28 nM) and the triple mutant of CH-GECO2.1 (44 nM) are not identical indicates that the two substitutions in the FP domain (Ile147Thr and Gly191Asp) must also have a subtle influence on the Kd, likely through interactions at the interface between CaM and the FP domain.
We next introduced mutations intended to probe the differences between the CaM domain of R-GECO1 (Kd = 480 nM) and CH-GECO2.1 (Kd = 6 nM) variants, which have almost a 2-order of magnitude difference in their Kds for Ca2+. These two proteins differ by a total of 5 substitutions in the CaM domain (Gly21Asp, Ala23Asp, Leu61Phe, Ser77Thr, and Asn109Asp, relative to CH-GECO2.1) (Figures 2 and 3A). Introduction of the single mutations Ala23Asp or Asn109Asp into CH-GECO2.1 gave essentially unchanged Kds of 7 nM and 13 nM, respectively (Figure 3D). To fully convert the CH-GECO2.1 CaM to that of R-GECO1 CaM we proceeded to introduce additional substitutions. As discussed above, CH-GECO2.1 with Gly21Asp, Leu61Phe and Ser77Thr had an increased Kd of 44 nM. The addition of Ala23Asp slightly lowered the Kd to 23 nM. Further reversion of a mutation close to the FP-CaM interface (Asp191Gly) and one final mutation in CaM that is relatively distant from the EF hands (Asn109Asp) produced a protein with a Kd of 35 nM (Figure 3E). These results clearly demonstrate that the dramatic difference in Kd between R-GECO1 and CH-GECO2.1 cannot be fully explained by the mutations within the CaM domain. Rather, these changes must be due to the interactions between the CaM and FP domains, either via the linkers or the domain interface.
3.2. Investigating the Mechanism of CH-GECO Variants
To gain a better understanding of the differences in magnitude and mechanisms of the fluorescent responses of CH-GECO2.0, CH-GECO2.1, and R-GECO1, we created, characterized, and compared a series of protein variants with strategic substitutions at key residues of interest.
3.2.1. CH-GECO2.0 vs. CH-GECO2.1
Just two mutations in the FP domain (Ile147Thr and Gly191Asp, relative to CH-GECO2.0) differentiate CH-GECO2.0 and CH-GECO2.1, but their fluorescent responses to Ca2+ are 150% and 250%, respectively. While the Asp191Gly reversion variant of CH-GECO2.1 variant retained a similar response to CH-GECO2.1, reversion of position 147 to Ile resulted in a decrease in the Ca2+ response to 115%. This result indicates that the Ile147Thr mutation is primarily responsible for the improved performance of CH-GECO2.1, and is consistent with the fact that the side chain of residue 147 is in close proximity to the phenolate moiety of the chromophore (Figure 1B).
3.2.2. R-GECO1 vs. CH-GECO2.1: The Influence of the Linkers
Previous work in our lab with both single FP-based and FRET-based indicators has showed that the length and composition of the linkers between the protein domains can have a substantial effect on the response of the indicator to the analyte of interest [14,21,22]. The sequence alignment between R-GECO1 and CH-GECO2.1 (Figure 2) reveals that the linkers between the three domains are significantly different. Specifically, R-GECO1 has a shorter linker between M13 and the FP (Pro-Val-Val) than does CH-GECO2.1 (Leu-Glu-Ser-Leu) and the first two residues (Leu145 and Ser146) of the FP domain are deleted. R-GECO1 also has a shorter linker between CaM and the FP domain (Ala-Thr-Arg) than does CH-GECO2.1 (Gly-Gly-Thr-Arg). The Thr-Arg residues of both linkers correspond to the translation of a MluI restriction site.
Replacing the Leu-Glu-Ser-Leu linker and residues 145 and 146 of CH-GECO2.1 with Pro-Val-Val resulted in a dim red fluorescent protein (designated CH-GECO2.1-PVV). UV-vis spectroscopy revealed that a large portion of the protein was halted at the blue intermediate species that absorbs at 382 nm (Supplementary Figure 1A) [23]. As shown in Supplementary Figure 1C, the pH dependence of the red fluorescent component of CH-GECO2.1-PVV was quite different from that of CH-GECO2.1 (Figure 4A), and the response to Ca2+ was effectively abolished. Replacing the FP to CaM Gly-Gly-Thr-Arg linker of CH-GECO2.1 with Ala-Thr-Arg and introducing the adjacent Leu144Asp mutation, fully converted the CH-GECO2.1 into a variant with identical linkers to R-GECO1 (designated CH-GECO2.1-PVV-ATA). However, no red fluorescent protein could be recovered from repeated attempts to express this protein. These results indicate that, in addition to their critical role in the Ca2+ response mechanism of single FP indicators, the interdomain linkers can also have an important role in the chromophore maturation.
3.2.3. Attempts to Identify Key Residues Involved in the Ca2+ Response of CH-GECO2.1
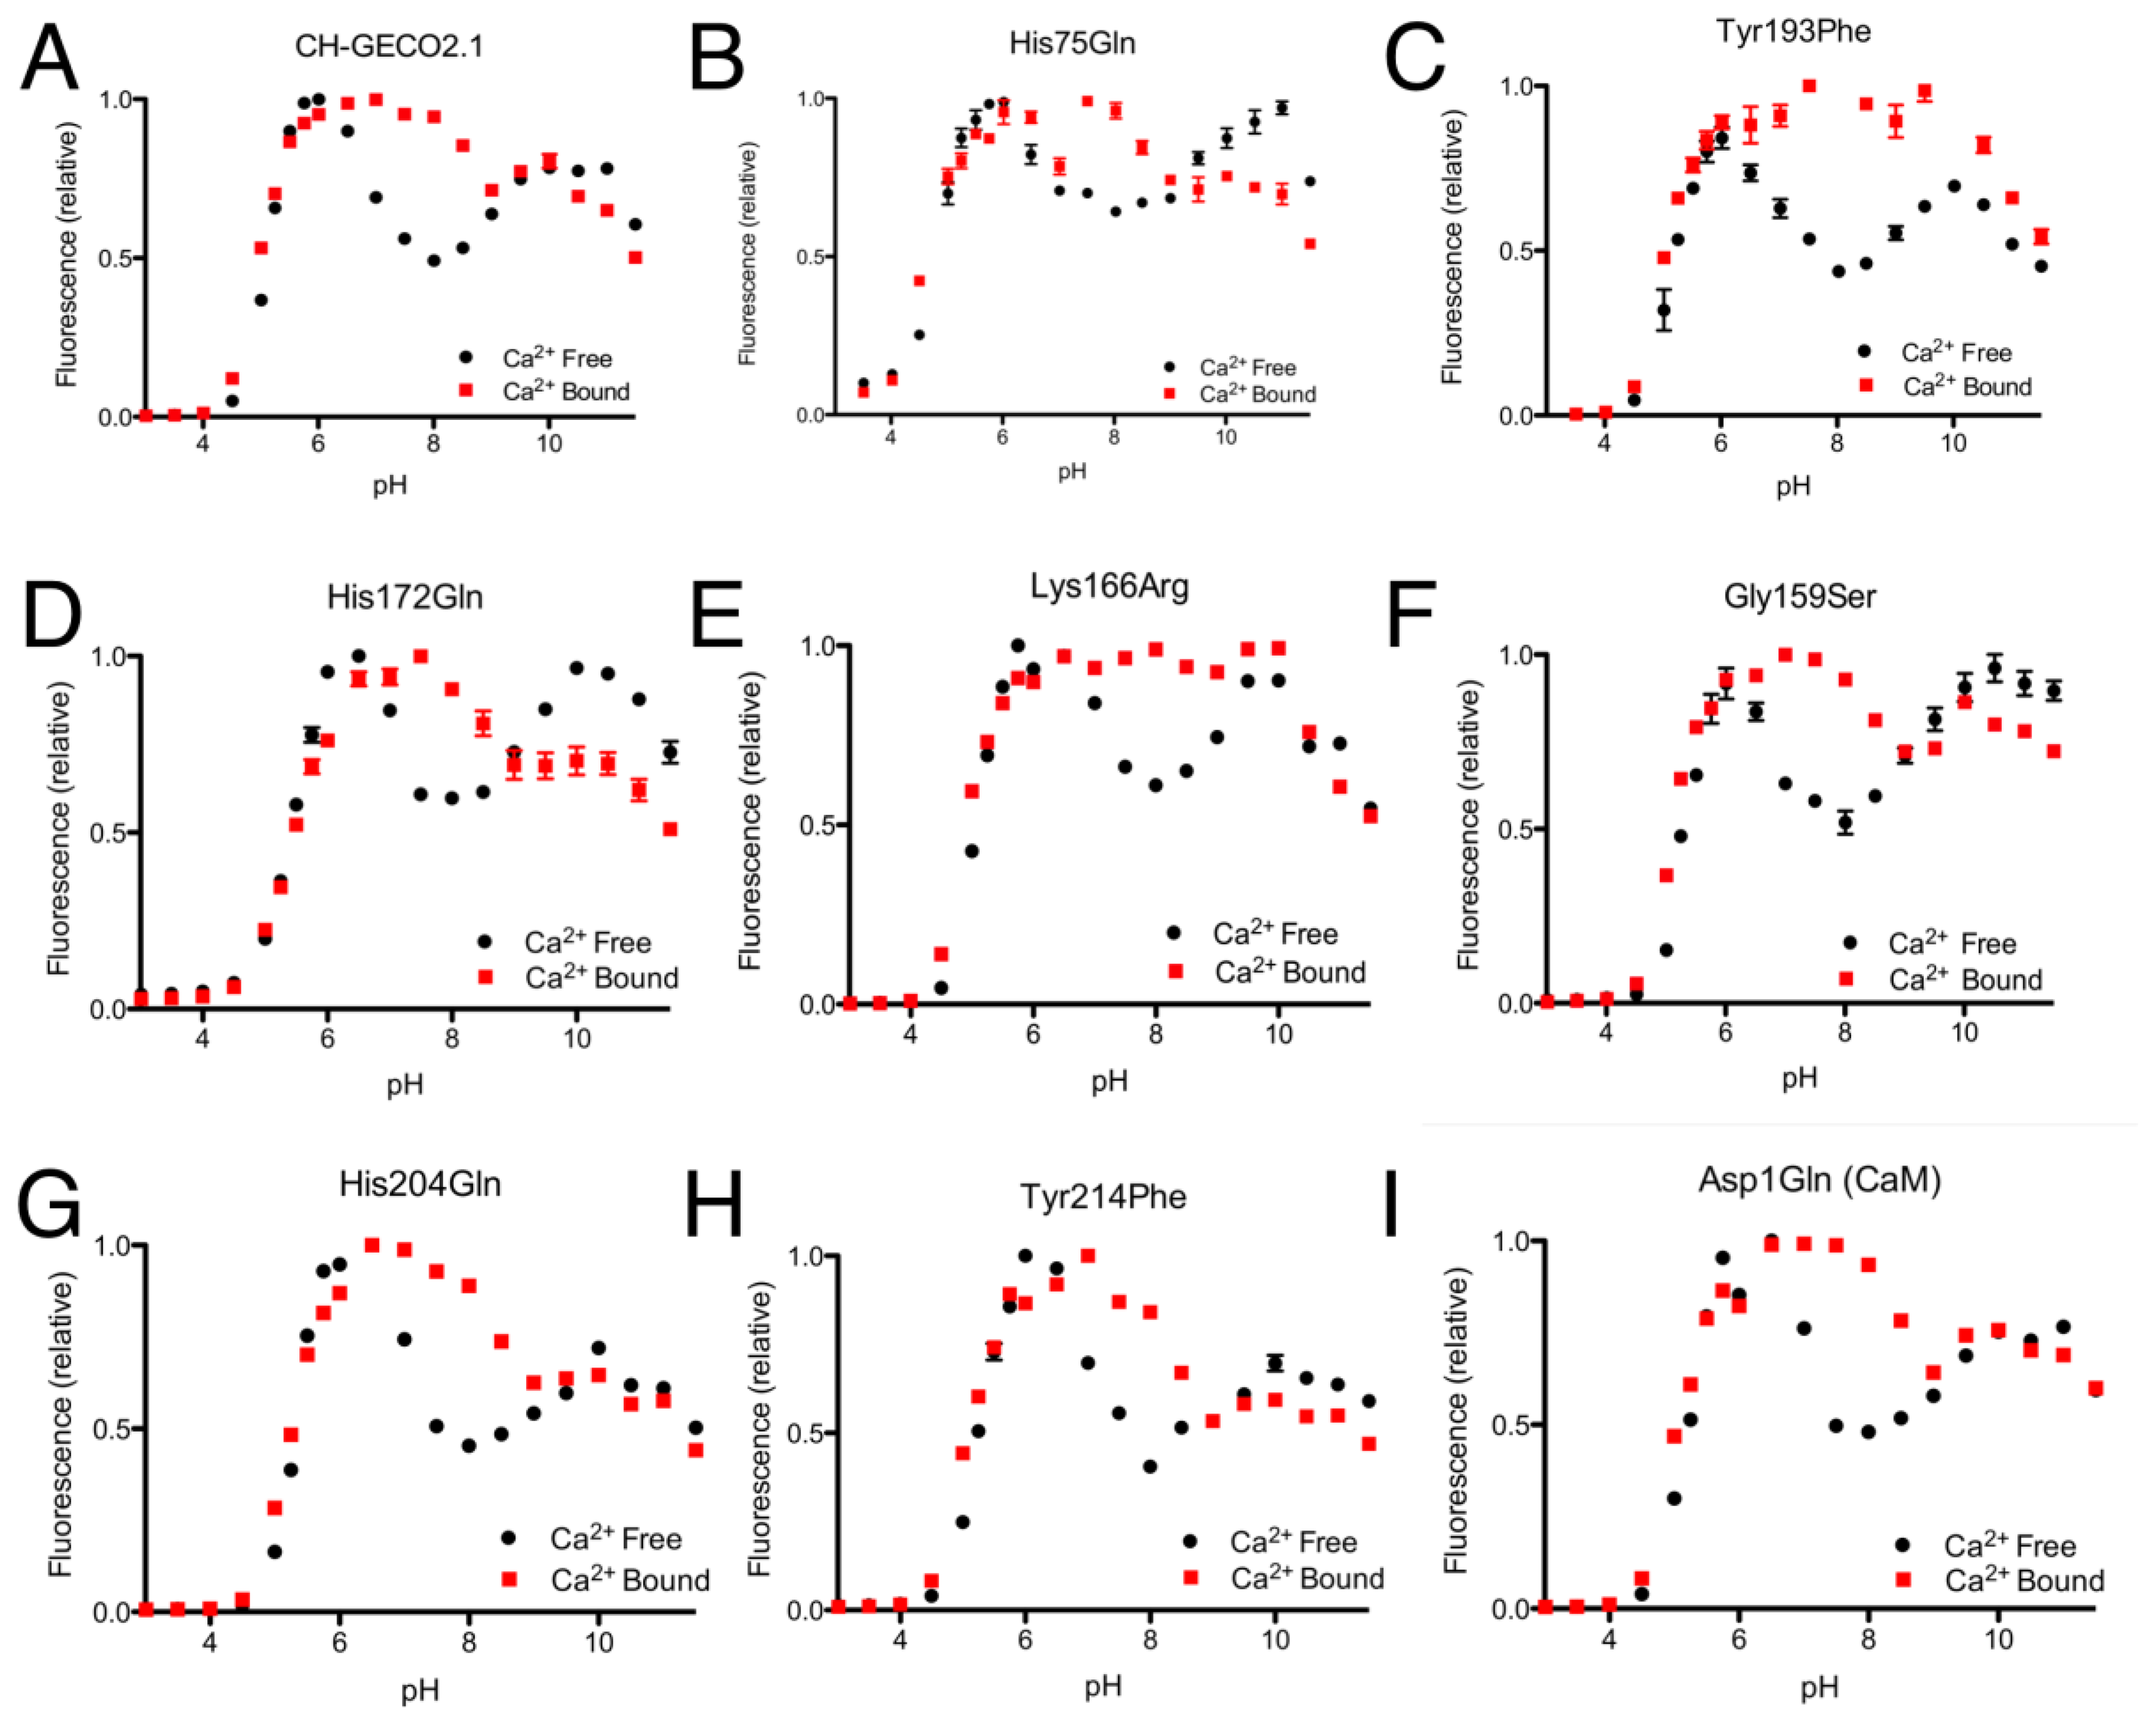
From the CH-GECO2.1 pH titration curve reproduced in Figure 4A, it is apparent that there is a key ionization with a pKa around pH 6.5 to 7.0. We hypothesized that, at physiological pH and in the absence of Ca2+, there is a specific residue (of unknown identity) for which the deprotonated form is quenching the fluorescence of the chromophore [17]. In the presence of Ca2+ either this residue is no longer deprotonated due to a change in pKa, or it is no longer in the right conformation to quench the chromophore fluorescence. In an attempt to determine the identity of the residue that is so critical to the function of the CH-GECO variants, we performed mutagenesis of rationally selected candidate residues.
As the pKa in question is around 6.5 to 7.0, the most likely candidate residue was histidine. However, the X-ray crystal structure of mCherry [24] reveals no histidines in the immediate vicinity of the chromophore, so we looked to histidine residues that could reasonably be interacting with the chromophore by an extended hydrogen bond network. One likely candidate was His75, which appears to participate in a hydrogen bond network with Tyr193, Lys70, Glu148, several water molecules, and the chromophore (Supplementary Figure 2A) in the mCherry crystal structure [24]. We mutated each of these residues individually and characterized the pH profile and Kd for the variants that formed the red fluorescent chromophore. No red fluorescent protein could be obtained for Lys70Gln and Glu148Gln, and absorbance scans of both variants revealed that the chromophore maturation process was stuck at the blue intermediate species similar to CH-GECO2.1-PVV described above [23]. Mutation His75Gln gave a pH profile that was very similar to CH-GECO2.1, albeit with a reduced response of 158% (Figure 4B). The Tyr193Phe mutation yielded similar results with a pH curve (Figure 4C) and Ca2+ affinity that are similar to CH-GECO2.1. We conclude that this hydrogen bond network is not involved in the Ca2+-dependent response of the CH-GECO variants, but does play an important role in the chromophore maturation process.
Having ruled out our original hydrogen-bond network hypothesis, we reexamined the mCherry crystal structure and identified Tyr214, His204, His172, and Asp1 of CaM as ionizable functional group in reasonably close proximity to the chromophore (Supplementary Figure 2B). Each of these residues was mutated to non-ionizable alternatives in the context of CH-GECO2.1, and the pH profiles both with and without Ca2+ were determined (Figure 4F–I). The pH profiles of all four mutants still retained the characteristic fluorescence increase at pH 6.5 to 7.0, indicating that none of these residues played a part in the Ca2+ sensing mechanism. Notably, Asp1 is the first amino acid of CaM and mutation to Gln did not alter the pH dependence, but it did increase the Kd to 53 nM and the fluorescence response to 307%. Due to its improved fluorescence response and a Kd that is very similar to that of the high affinity Ca2+ indictor YC-Nano50 [25], CH-GECO2.1 Asp1Gln may be particularly useful for imaging of transient changes in Ca2+ concentration in cells with low resting concentrations.
Expanding our efforts to include non-ionizable residues close to the chromophore, we decided to target positions 159, 163, and 166, which differ between R-GECO1 and CH-GECO2.1 (Supplementary Figure 2B). Introducing the Gly159Ser (Figure 4D) or Lys166Arg (Figure 4E) substitutions into CH-GECO2.1 resulted in variants where no substantial changes were observed in the Kd or excitation and emission characteristics, and only modest effect on the Ca2+ response in the case of the Gly159Ser variant (Supplementary Table 1). In contrast, the Gln163Lys substitution completely abolished the fluorescent response of CH-GECO2.1. This variant will be discussed in more detail in a following section. From these results it is apparent that, of all the residues targeted in these efforts, only Gln163 plays a critical role in the mechanism of action of CH-GECO2.1.
3.2.4. The Influence of Residue Gln163 on the Ca2+ Response of CH-GECO2.1
Residue 163 of DsRed [26], and its engineered descendants such as mRFP1 [27] and mCherry [18], is in close proximity to the chromophore and thus substitutions at this position can have profound effects on the fluorescent characteristics. In wild-type DsRed, residue 163 is a Lys, which stabilizes the phenolate group of the chromophore in the anionic state by interaction with the protonated terminal amine [26]. During the directed evolution of dimeric and monomeric DsRed variants, favorable substitutions at this position included Lys163Gln in the dimer2 variant and Lys163Met in mRFP1 [27]. During later directed evolution of mRFP1 that ultimately led to the mCherry variant, the Met163Gln mutation was rediscovered and retained since this mutation provided improved chromophore maturation efficiency [18]. In contrast, the Met163Lys reversion was found to be beneficial during the directed evolution that led to the mApple variant [16]. Through the directed evolution process that led to CH-GECO2.1, the Lys163Gln substitution inherited from mCherry was retained. Notably, this residue is found in close proximity to both the chromophore and the circular permutation site, so it is prime candidate for a residue that would play a crucial role in the Ca2+ sensing mechanism.
The X-ray crystal structures of R-GECO1 and RCaMP (engineered from Entacmaea quadricolor-derived mRuby [28]) have recently been reported [8]. In the R-GECO1 structure, Lys163 is interacting directly with the phenolate of the chromophore in the Ca2+ bound state (Figure 1B), which indicates that this residue almost certainly has a critical role in the Ca2+ response, likely lowering the pKa of the chromophore in the presence of Ca2+ by stabilizing the negative charge on the phenolate. The structurally equivalent residue in RCaMP [8] is a methionine that is directed inside the barrel in a conformation that is very similar to that of Lys163Gln in mCherry [24].
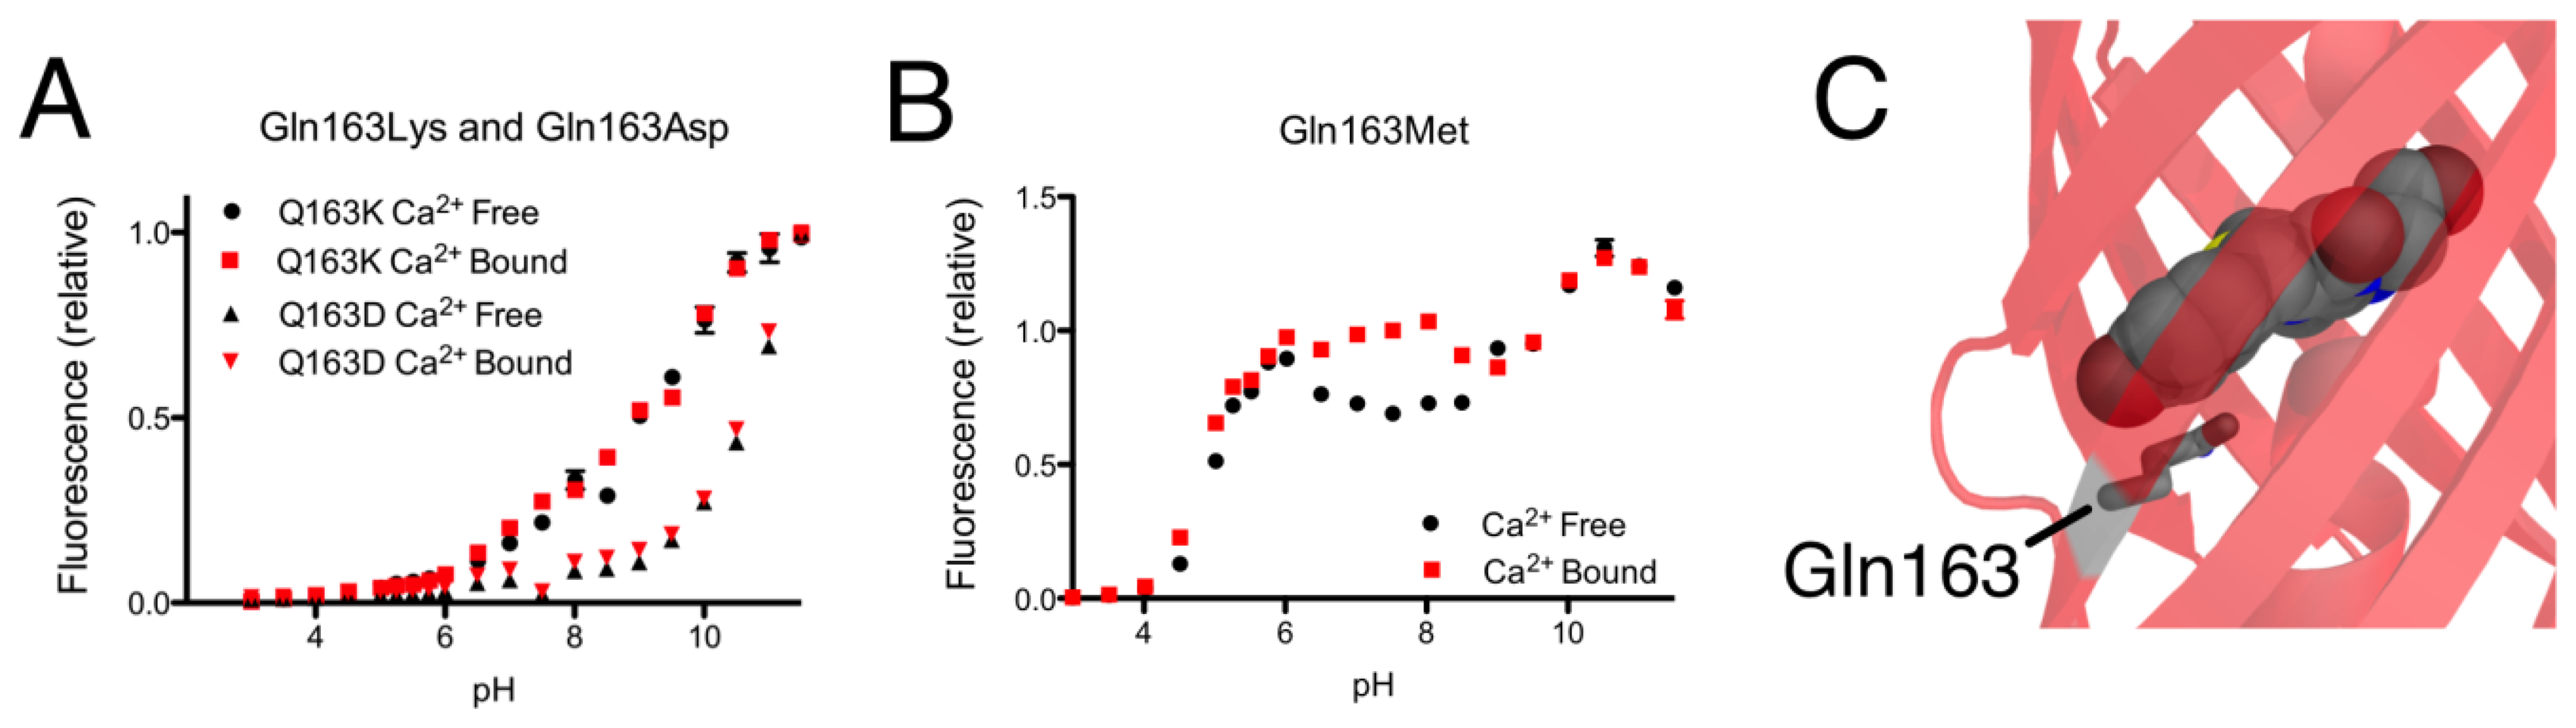
As mentioned in the previous section, introducing the Gln163Lys substitution into CH-GECO2.1 completely abolished the response of CH-GECO2.1 and had a pronounced effect the protonation state of the chromophore as evidenced by the pH titration curve shown in Figure 5A. The absorbance, excitation, and emission wavelengths remain unchanged. To determine if the combination of Gln163Lys and R-GECO1-type linkers would be sufficient for rescuing the Ca2+ responsiveness, the Gln163Lys substitution was introduced into CH-GECO2.1-PVV-ATA. The resulting variant formed the red fluorescent chromophore but did not show a significant fluorescence response to Ca2+ (Supplementary Figure 1B,C).
To further probe the role of Gln163, we created the Gln163Met and Gln163Asp variants of CH-GECO2.1. Intriguingly, the Gln163Met variant behaved very similar to CH-GECO2.1 in terms of its response to Ca2+, though the Ca2+ response decreased to 54% and the Kd decreases to 2 nM (Figure 5B). Much like the Gln163Lys variant, the Gln163Asp variant exhibited no response to Ca2+ (Figure 5A). Based on these results, we concluded that Gln163 plays a critical role in the CH-GECO2.1 sensing mechanism, and that this role is distinct from that played by the equivalent Lys163 residue in R-GECO1.
3.2.5. A Proposed Ca2+ Sensing Mechanism for CH-GECO2.1
The combined use of site directed mutagenesis and detailed in vitro characterization has enabled us to identify Gln163 as one of the key residues in the Ca2+ sensing mechanism of CH-GECO2.1. In the absence of a crystal structure of CH-GECO2.1, it is of course difficult to predict how specific amino acids are oriented near the chromophore, especially given that we expect substantial distortion of the protein (relative to mCherry [24]) in the vicinity of the circular permutation site. Fortunately, the X-ray structures of R-GECO1 and RCaMP are available to aid us in our effort to interpret our results.
We propose that, in the Ca2+ free state, the side chain of Gln163 is directed outside the barrel similar to the orientation of Lys163 in R-GECO1 (Figure 1B). In this orientation the chromophore is less sterically constrained by the surrounding protein environment and thus has more rotational and vibrational freedom, which explains the low quantum yield in the absence of Ca2+. When CaM and M13 interact due to Ca2+ binding, the side chain of Gln163 moves inwards and interacts with the chromophore in a conformation similar to that observed in mCherry (Figure 5C). That is, the side chain of Gln163 is likely oriented below the chromophore and sandwiched between Trp143 and Ile161. Presumably, this interaction leads to a stabilization of the chromophore in a planar conformation that increases the quantum yield. This proposed mechanism is consistent with the results obtained with the Gln163Met, Gln163Asp, and Gln163Lys variants. Mutation to the hydrophobic Met produces a functional protein, since the side chain is still able to undergo the Ca2+-dependent switch from the exterior to the interior of the protein. In contrast, mutation of Gln163 to either Lys or Asp dramatically increases the energetic cost of bringing the charged side chain into the hydrophobic interior, and the Ca2+ sensing mechanism is abolished.
Disappointingly, we were not able to unambiguously identify key residues the contributed to the much higher affinity for Ca2+ of CH-GECO2.1 relative to R-GECO1, nor we were able to identify the key residue that is undergoing an ionization with a pKa ∼6.5 to 7.0. We suspect that, in both cases, the relevant residues are located in the interface between the CaM domain and the FP domain.
4. Conclusions
The goal of this work was to gain insight into the mechanistic details of the recently reported genetically encoded Ca2+ indicator CH-GECO2.1. While we were not able to answer all of the questions that naturally emerged from this effort, we were successful in identifying Gln163 as the most important residue for transducing the conformational change associated with Ca2+ binding into a change in the fluorescence intensity of the FP domain. We expect that this insight will be critical in guiding future efforts to further optimize genetically encoded Ca2+ indicators for improved response. Another important conclusion from this work is that interdomain connections and interactions can have a complex influence on multiple aspects of a genetically encoded biosensor. Specifically, we observed that changes in linker composition and length could effect protein maturation and the sensing mechanism. In addition, our results suggest that interfacial residues play a crucial role in determining the affinity of the indicator for Ca2+. We recommend that future efforts to optimize such indicators should always involve substantial screening of linker libraries that vary in both length and composition. Also, we suggest that, given the complexity of the sensing mechanisms, directed evolution efforts that involve screening of libraries of randomly generated variants will tend to be much more effective than efforts guided by naive mechanistic hypotheses.
Supplementary Material
sensors-13-11507-s001.pdfAcknowledgments
We thank the University of Alberta Molecular Biology Services Unit for analysis of sequencing reactions and the Natural Sciences and Engineering Research Council of Canada (NSERC) for funding support. We are grateful to Eric Schreiter for sharing the atomic coordinates of the R-GECO1 X-ray crystal structure. Haley J. Carlson was supported by postgraduate scholarships from NSERC and Alberta Ingenuity. Robert E. Campbell holds a Tier II Canada Research Chair in Bioanalytical Chemistry.
Conflicts of Interest
The authors declare no conflict of interest.
References
- Miyawaki, A.; Llopis, J.; Heim, R.; McCaffery, J.M.; Adams, J.A.; Ikura, M.; Tsien, R.Y. Fluorescent indicators for Ca2+ based on green fluorescent proteins and calmodulin. Nature 1997, 388, 882–887. [Google Scholar]
- Tian, L.; Hires, S.A.; Mao, T.; Huber, D.; Chiappe, M.E.; Chalasani, S.H.; Petreanu, L.; Akerboom, J.; McKinney, S.A.; Schreiter, E.R.; et al. Imaging neural activity in worms, flies and mice with improved GCaMP calcium indicators. Nat. Methods 2009, 6, 875–881. [Google Scholar]
- Tsien, R.Y. Fluorescent probes of cell signaling. Annu. Rev. Neurosci. 1989, 12, 227–253. [Google Scholar]
- Ahrens, M.B.; Orger, M.B.; Robson, D.N.; Li, J.M.; Keller, P.J. Whole-brain functional imaging at cellular resolution using light-sheet microscopy. Nat. Methods 2013, 10, 413–420. [Google Scholar]
- Tsien, R.Y. The green fluorescent protein. Annu. Rev. Biochem. 1998, 67, 509–544. [Google Scholar]
- Nagai, T.; Sawano, A.; Park, E.S.; Miyawaki, A. Circularly permuted green fluorescent proteins engineered to sense Ca2+. Proc. Natl. Acad. Sci. USA 2001, 98, 3197–3202. [Google Scholar]
- Nakai, J.; Ohkura, M.; Imoto, K. A high signal-to-noise Ca2+ probe composed of a single green fluorescent protein. Nat. Biotechnol. 2001, 19, 137–141. [Google Scholar]
- Akerboom, J.; Calderón, N.C.; Tian, L.; Wabnig, S.; Prigge, M.; Tolö, J.; Gordus, A.; Orger, M.B.; Severi, K.E.; Macklin, J.J.; et al. Genetically encoded calcium indicators for multi-color neural activity imaging and combination with optogenetics. Front. Mol. Neurosci. 2013, 6. [Google Scholar] [CrossRef]
- Wang, Q.; Shui, B.; Kotlikoff, M.I.; Sondermann, H. Structural basis for calcium sensing by GCaMP2. Structure 2008, 16, 1817–1827. [Google Scholar]
- Akerboom, J.; Rivera, J.D.; Guilbe, M.M.; Malavé, E.C.; Hernandez, H.H.; Tian, L.; Hires, S.A.; Marvin, J.S.; Looger, L.L.; Schreiter, E.R. Crystal structures of the GCaMP calcium sensor reveal the mechanism of fluorescence signal change and aid rational design. J. Biol. Chem. 2009, 284, 6455–6464. [Google Scholar]
- Tallini, Y.N.; Ohkura, M.; Choi, B.R.; Ji, G.; Imoto, K.; Doran, R.; Lee, J.; Plan, P.; Wilson, J.; Xin, H.B.; et al. Imaging cellular signals in the heart in vivo: Cardiac expression of the high-signal Ca2+ indicator GCaMP2. Proc. Natl. Acad. Sci. USA 2006, 103, 4753–4758. [Google Scholar]
- Ohkura, M.; Sasaki, T.; Sadakari, J.; Gengyo-Ando, K.; Kagawa-Nagamura, Y.; Kobayashi, C.; Ikegaya, Y.; Nakai, J. Genetically encoded green fluorescent Ca2+ indicators with improved detectability for neuronal Ca2+ signals. PLoS One 2012, 7, e51286. [Google Scholar]
- Akerboom, J.; Chen, T.W.; Wardill, T.J.; Tian, L.; Marvin, J.S.; Mutlu, S.; Calderón, N.C.; Esposti, F.; Borghuis, B.G.; Sun, X.R.; et al. Optimization of a GCaMP calcium indicator for neural activity imaging. J. Neurosci. 2012, 32, 13819–13840. [Google Scholar]
- Zhao, Y.; Araki, S.; Wu, J.; Teramoto, T.; Chang, Y.F.; Nakano, M.; Abdelfattah, A.S.; Fujiwara, M.; Ishihara, T.; Nagai, T.; et al. An expanded palette of genetically encoded Ca2+ indicators. Science 2011, 333, 1888–1891. [Google Scholar]
- Wu, J.; Liu, L.; Matsuda, T.; Zhao, Y.; Rebane, A.; Drobizhev, M.; Chang, Y.F.; Araki, S.; Arai, Y.; March, K.; et al. Improved orange and red Ca2+indicators and photophysical considerations for optogenetic applications. ACS Chem. Neurosci. 2013. [Google Scholar] [CrossRef]
- Shaner, N.C.; Lin, M.Z.; McKeown, M.R.; Steinbach, P.A.; Hazelwood, K.L.; Davidson, M.W.; Tsien, R.Y. Improving the photostability of bright monomeric orange and red fluorescent proteins. Nat. Methods 2008, 5, 545–551. [Google Scholar]
- Carlson, H.J.; Campbell, R.E. Circular permutated red fluorescent proteins and calcium ion indicators based on mCherry. Protein Eng. Des. Sel. 2013. in press. [Google Scholar]
- Shaner, N.C.; Campbell, R.E.; Steinbach, P.A.; Giepmans, B.N.; Palmer, A.E.; Tsien, R.Y. Improved monomeric red, orange and yellow fluorescent proteins derived from Discosoma sp. red fluorescent protein. Nat. Biotechnol. 2004, 22, 1567–1572. [Google Scholar]
- Gifford, J.L.; Walsh, M.P.; Vogel, H.J. Structures and metal-ion-binding properties of the Ca2+-binding helix-loop-helix EF-hand motifs. Biochem. J 2007, 405, 199–221. [Google Scholar]
- Maune, J.F.; Klee, C.B.; Beckingham, K. Ca2+ binding and conformational change in two series of point mutations to the individual Ca(2+)-binding sites of calmodulin. J. Biol. Chem. 1992, 267, 5286–5295. [Google Scholar]
- Ding, Y.; Ai, H.W.; Hoi, H.; Campbell, R.E. FRET-based biosensors for multiparameter ratiometric imaging of Ca2+ dynamics and caspase-3 activity in single cells. Anal. Chem. 2011, 83, 9687–9693. [Google Scholar]
- Ibraheem, A.; Yap, H.; Ding, Y.; Campbell, R.E. A bacteria colony-based screen for optimal linker combinations in genetically encoded biosensors. BMC Biotechnol. 2011, 11. [Google Scholar] [CrossRef]
- Strack, R.L.; Strongin, D.E.; Mets, L.; Glick, B.S.; Keenan, R.J. Chromophore formation in DsRed occurs by a branched pathway. J. Am. Chem. Soc. 2010, 132, 8496–8505. [Google Scholar]
- Shu, X.; Shaner, N.C.; Yarbrough, C.A.; Tsien, R.Y.; Remington, S.J. Novel chromophores and buried charges control color in mFruits. Biochemistry 2006, 45, 9639–9647. [Google Scholar]
- Horikawa, K.; Yamada, Y.; Matsuda, T.; Kobayashi, K.; Hashimoto, M.; Matsu-ura, T.; Miyawaki, A.; Michikawa, T.; Mikoshiba, K.; Nagai, T. Spontaneous network activity visualized by ultrasensitive Ca(2+) indicators, yellow Cameleon-Nano. Nat. Methods 2010, 7, 729–732. [Google Scholar]
- Yarbrough, D.; Wachter, R.M.; Kallio, K.; Matz, M.V.; Remington, S.J. Refined crystal structure of DsRed, a red fluorescent protein from coral, at 2.0-A resolution. Proc. Natl. Acad. Sci. USA 2001, 98, 462–467. [Google Scholar]
- Campbell, R.E.; Tour, O.; Palmer, A.E.; Steinbach, P.A.; Baird, G.S.; Zacharias, D.A.; Tsien, R.Y. A monomeric red fluorescent protein. Proc. Natl. Acad. Sci. USA 2002, 99, 7877–7882. [Google Scholar]
- Kredel, S.; Oswald, F.; Nienhaus, K.; Deuschle, K.; Röcker, C.; Wolff, M.; Heilker, R.; Nienhaus, G.U.; Wiedenmann, J. mRuby, a bright monomeric red fluorescent protein for labeling of subcellular structures. PLoS One 2009, 4, e4391. [Google Scholar]

© 2013 by the authors; licensee MDPI, Basel, Switzerland. This article is an open access article distributed under the terms and conditions of the Creative Commons Attribution license (http://creativecommons.org/licenses/by/3.0/).
Share and Cite
Carlson, H.J.; Campbell, R.E. Mutational Analysis of a Red Fluorescent Protein-Based Calcium Ion Indicator. Sensors 2013, 13, 11507-11521. https://doi.org/10.3390/s130911507
Carlson HJ, Campbell RE. Mutational Analysis of a Red Fluorescent Protein-Based Calcium Ion Indicator. Sensors. 2013; 13(9):11507-11521. https://doi.org/10.3390/s130911507
Chicago/Turabian StyleCarlson, Haley J., and Robert E. Campbell. 2013. "Mutational Analysis of a Red Fluorescent Protein-Based Calcium Ion Indicator" Sensors 13, no. 9: 11507-11521. https://doi.org/10.3390/s130911507