Biosensing Using Microring Resonator Interferograms

Abstract
: Optical low-coherence interferometry (OLCI) takes advantage of the variation in refractive index in silicon-wire microring resonator (MRR) effective lengths to perform glucose biosensing using MRR interferograms. The MRR quality factor (Q), proportional to the effective length, could be improved using the silicon-wire propagation loss and coupling ratio from the MRR coupler. Our study showed that multimode interference (MMI) performed well in broad band response, but the splitting ratio drifted to 75/25 due to the stress issue. The glucose sensing sensitivity demonstrated 0.00279 meter per refractive-index-unit (RIU) with a Q factor of ∼30,000 under transverse electric polarization. The 1,310 nm DFB laser was built in the OLCI system as the optical ruler achieving 655 nm characterization accuracy. The lowest sensing limitation was therefore 2 × 10⁻⁴ RIU. Moreover, the MRR effective length from the glucose sensitivity could be utilized to experimentally demonstrate the silicon wire effective refractive index with a width of 0.45 μm and height of 0.26 μm.1. Introduction
Optical waveguide sensors have attracted considerable attention due to their immunity to electromagnetic interference, good compactness and robustness and high compatibility with fiber networks, while exhibiting shorter response times and higher sensitivities [1]. In just a few years researchers have proposed using microring resonator (MRR) for label-free biosensing applications [2–5]. The high quality factor (Q) caused by the strong electric field enhancement within the ring makes the MRR a good candidate for biomolecule detection under low analyte concentration conditions. A MRR consists of a ring, bus waveguide and optical coupler, that utilize a directional coupler or multimode interference (MMI) for coupling. The operating function allows for light to evanescently couple into the ring through the optical coupler when a phase match occurs between the incident light and resonator whispering galley mode. When resonance forms the wavelength shift can be utilized to quantify target molecule biorecognition. Therefore, most MRRs use the resonating wavelength shift induced by the cladding layer refractive index change in biosensing applications.
The interference fringe patterns (or interferograms) from the Mach-Zehnder (MZ) interferometer will represent the optical path difference in two MZ arms, in which variation causes the fringe position shift [6]. In biosensing approaches there are two main technologies, namely optical phase changes controlled by a high coherence source [7] and interferograms formed by optical low coherence [8–11]. In the typical optical intensity interference with a high coherence source, the accuracy is easily degraded by the output light power fluctuation and interferometric signal periodic nature. Interferograms from low coherence are relatively stable and the resolution limit can be enhanced two- fold in cascaded MZ interferometers [9].
Here, we propose an optical low coherence interferometry (OLCI) system including a fiber-optic MZ interferometer and a continuous-wave broad-band source used to characterize the high Q MRR on one MZ arm using the optical ruler for resolution enhancement. Glucose is utilized as an analyte and sensed using spatially-localized interference fringe patterns or interferograms for refractive index biosensors. The typical low-coherence interferogram sensor did not include the optical ruler, which is crucial for test accuracy. Furthermore, the proposed optical ruler in the OLCI was not located in the same optical path as the device under test (DUT), which meant that the wavelength utilized for an optical ruler will not be limited by the DUT wavelength selection. Since the optical paths between the optical ruler and DUT are different, a high coherent short wavelength with free space light tracking could be applied to the optical ruler for higher sensitivity. Refractive index sensors usually use the optical power or wavelength related for sensing. The former sensitivity is easily affected by the light power fluctuation and the sensitivity of the latter is limited by the availability of a costly high resolution optical spectrum analyzer (OSA). Different glucose concentrations could be derived using silicon-wire waveguide birefringence from relative interferogram movement distances.
2. Design and Theory
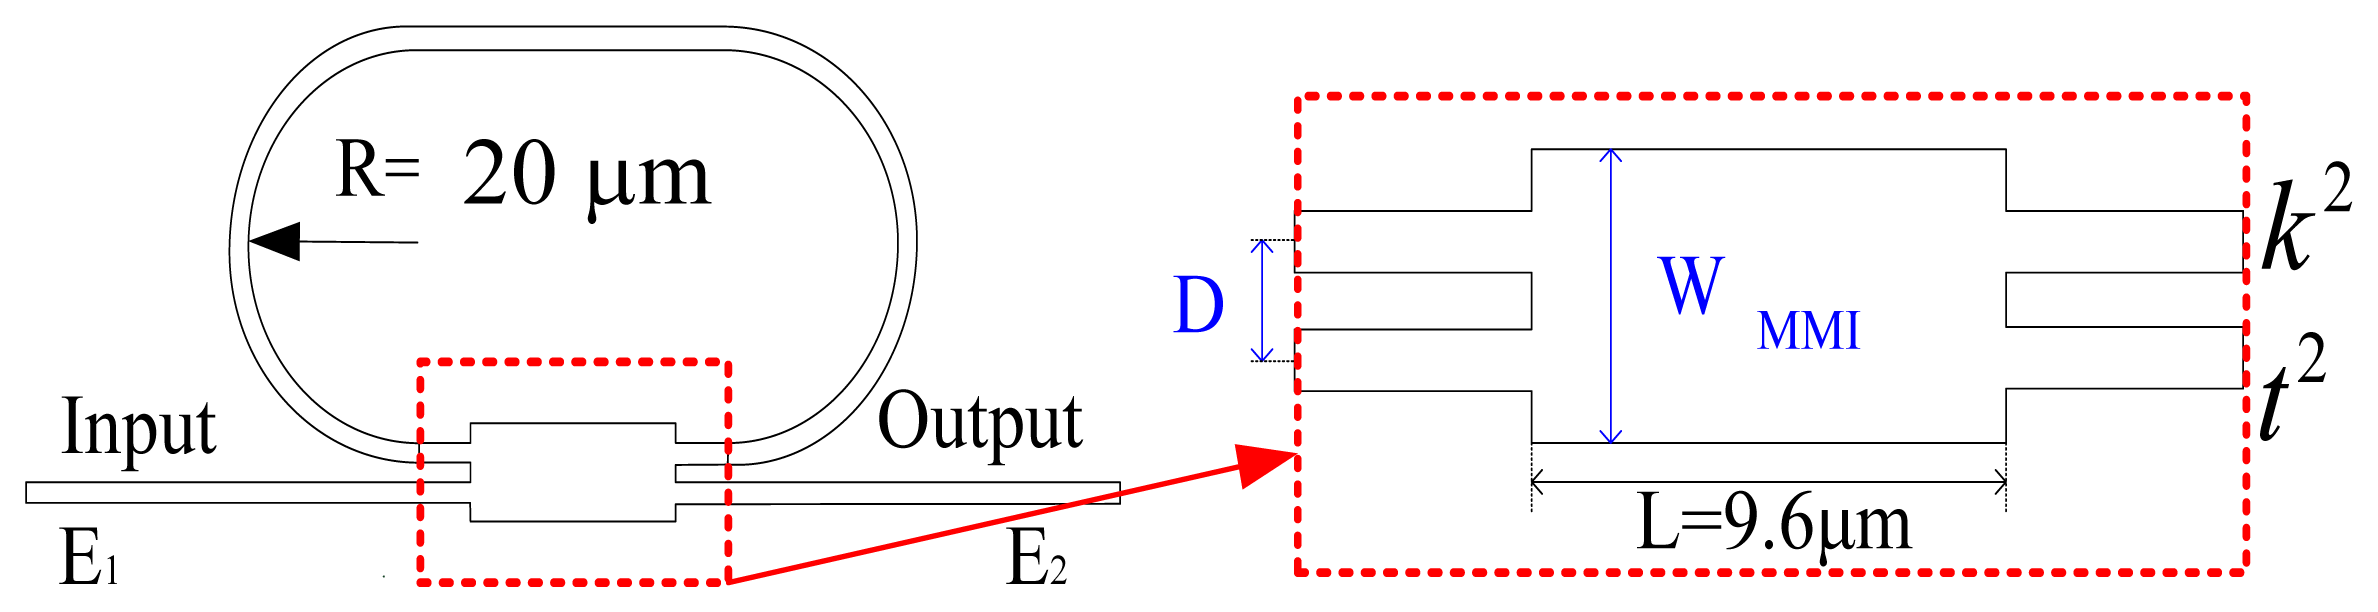
Because interferograms are demonstrated using low coherence sources, all elements in the OLCI system require broad band response. A schematic of the MMI-coupled MRR and MMI structure is illustrated in Figure 1. A MMI coupler is used for MRR coupling, shown in the inset of Figure 1. The power transmission of MRR in the bus waveguide can be expressed as [12]:
The quality factor Q of a MRR can also be derived and demonstrated as follows [12]:
The MMI, which is insensitive to the wavelength and has large processing tolerance, is used as the MRR coupling function. In this research we used the paired interference self-imaging MMI for equal splitting ratios, which requires the MMI length to be half the beat length [13]. The finite difference time-domain (FDTD), a direct solution of Maxwell's curl equations generated using the RSoft Fullwave tool, was utilized to simulate and predict the modal performance for silicon-wire waveguides based on the MMI coupler. The MMI for both the transverse electric (TE) and transverse magnetic (TM) polarizations was designed to have a length (L) of 9.6 μm, width (W) of 3 μm and input/output waveguide distance (D) of 1 μm when the silicon-wire waveguide has a width of 0.45 μm and height of 0.26 μm.
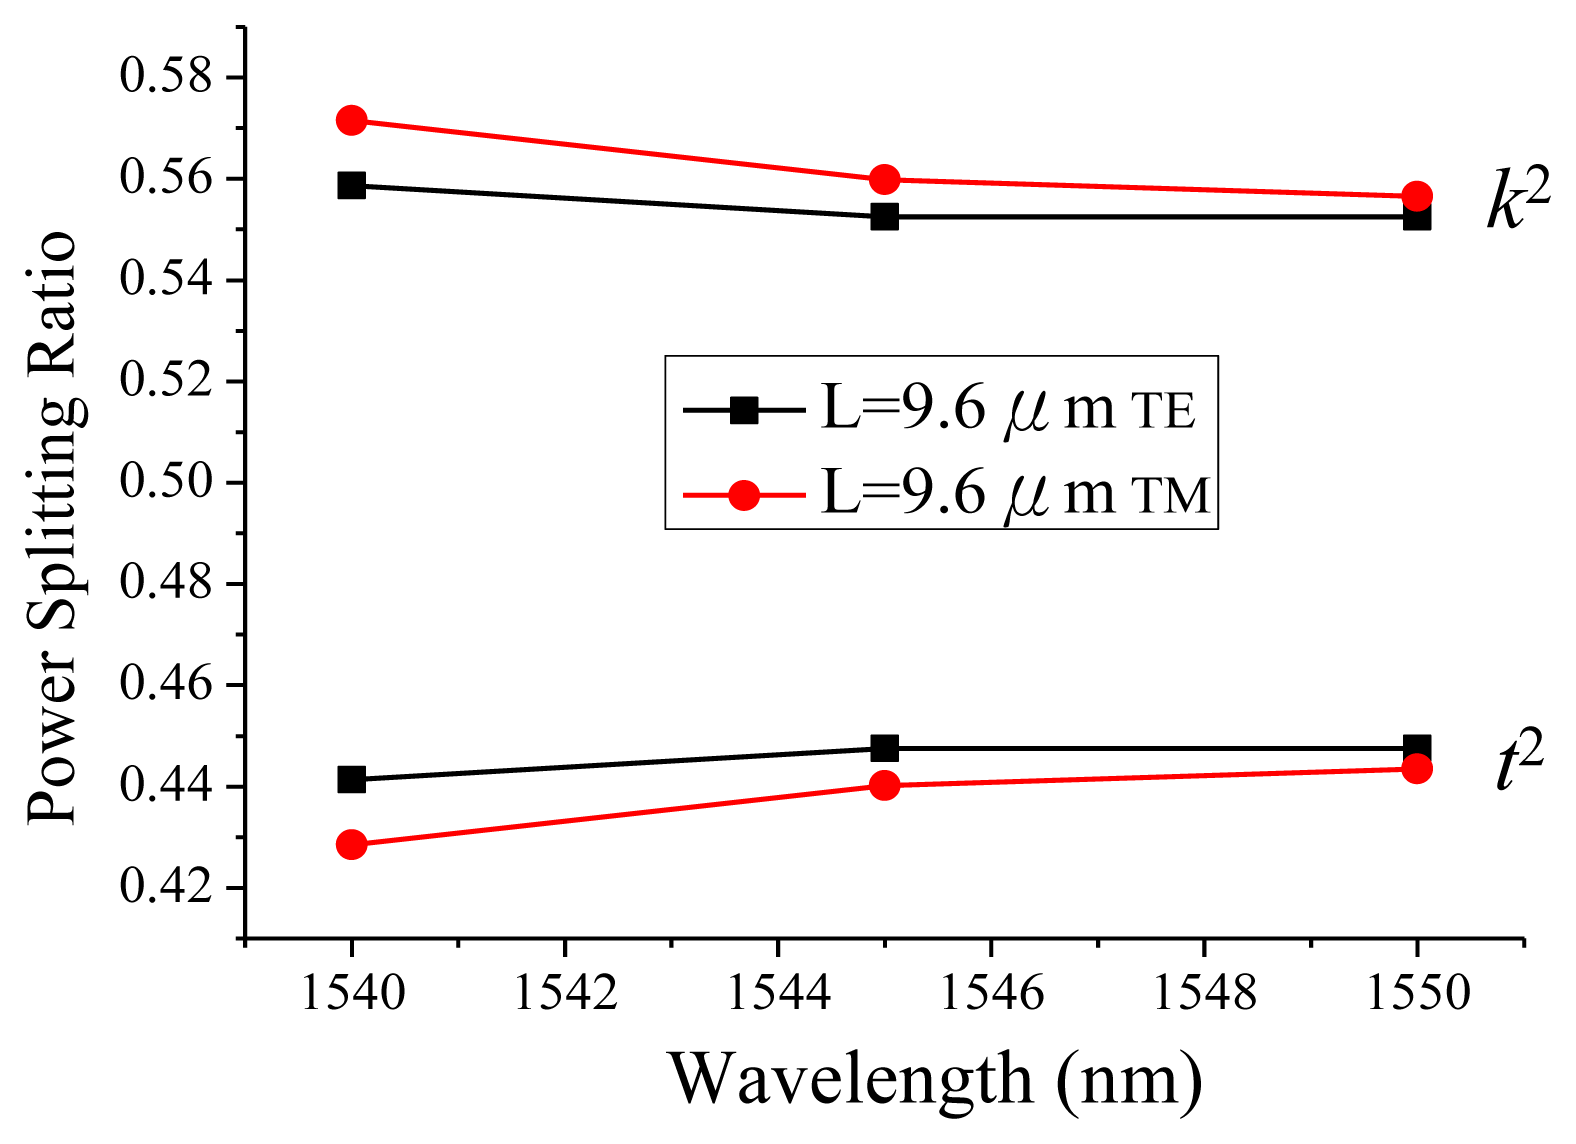
The FDTD is a 3D simulation of the whole MMI structure. The boundary conditions for a cross section with the same mesh size of 0.035 μm were −3 to 4 μm and −0.77 to 0.98 μm for the horizontal and vertical directions, respectively. A simulated mode from the current silicon-wire waveguide structure was taken as the launching field instead of the default selection and the simulation time was about 45 min. The power splitting ratio was calculated as 0.56 and 0.44 for k2 and t2, respectively. The optical power ratio difference between TE and TM polarizations was less than 0.01, as shown in Figure 2.
The effective length Leff of the MRR could be written as follows [14,15]:
The OLCI phase is represented by the interferograms and composed of the light wave propagation constant and interferometer arm lengths. Since a MRR with a narrow line width could achieve higher Q and longer effective length, the optical path difference between two interferometer arms is more easily detected by the cladding layer refractive index change. This relationship can be given using the following when the Leff from MRR is fixed and invariant with the environmental change:
When the relative moving distance ΔLMD could be affected by the various refractive indices Δn, the slope is represented by the MRR effective length Leff. The longer the MRR effective length is the higher the sensing limit that can be achieved. On the other hand, the silicon-wire waveguide effective refraction index in Equation (3) is related to the MRR effective length, which is the curve slope from ΔLMD and Δn in Equation (4). If polarization is applied to the MRR for different glucose sensing levels, the silicon wire effective index of refraction and birefringence can be derived from MRR interferograms.
3. Experiments and Discussions
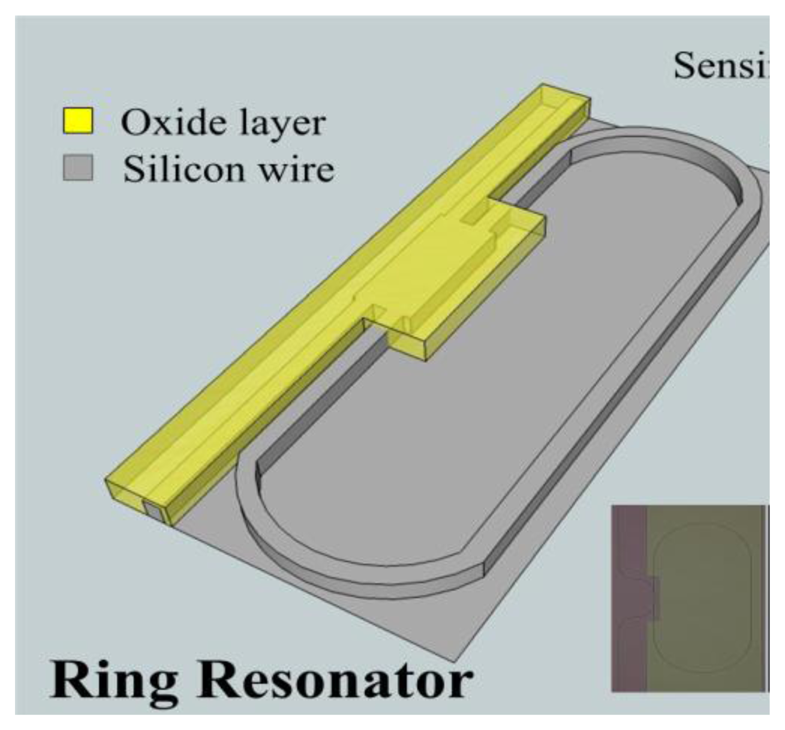
The top silicon layer and box layer of the silicon-on-insulator (SOI) wafer were 0.26 μm and 3 μm, respectively. Following RCA cleaning the SOI wafer was spin coated with 800-nm positive photoresist. I-line stepper lithography was implemented to pattern the silicon wire waveguides with reactive ion etcher utilized to fabricate the MMI coupled MRR on the silicon-wire rib waveguide with the 0.45 μm width and 0.26 μm height. At room temperature three main gas mixtures, Cl2, HBr, and O2 were used to obtain anisotropic silicon structures. In this processing mixture, Cl2 could react with silicon to form a polymer for sidewall passivation and provide etch anisotropy. The MMI and input/output waveguide were next covered by a 300 nm thick silicon dioxide with the ring perimeter left open for analyte sensing, as shown in Figure 3. The MMI coupler MRR image was taken using an optical microscope camera, as illustrated in the inset of Figure 3. The scanning electronic microscope (SEM) for silicon-wire waveguides is also shown in the inset of Figure 3.
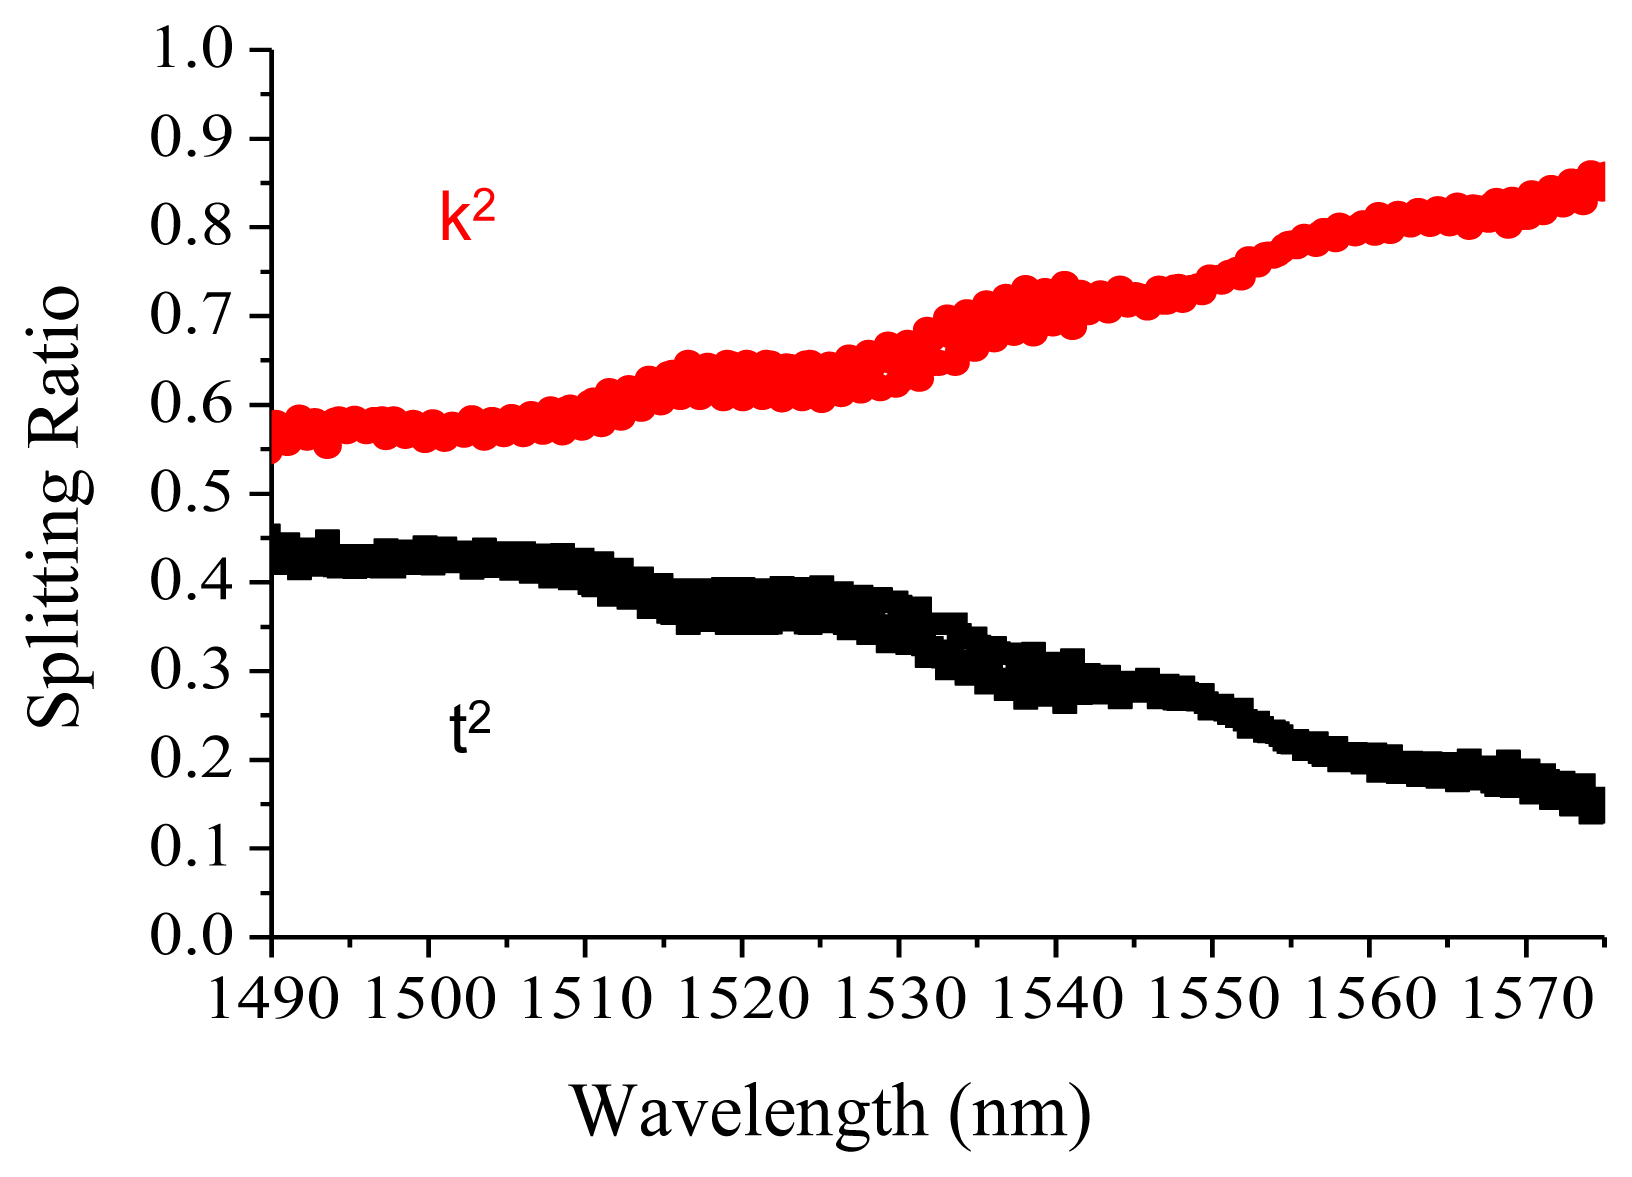
To understand the coupling coefficient for the MMI coupled MRR, an additional MMI with the same structure was intentionally allocated nearby for optical power splitting function analysis. The MMI is a 2 × 2 coupler and t2 and k2 are the self- and cross-coupling coefficients, respectively. Therefore, k2 represents the optical power coupled to MRR.
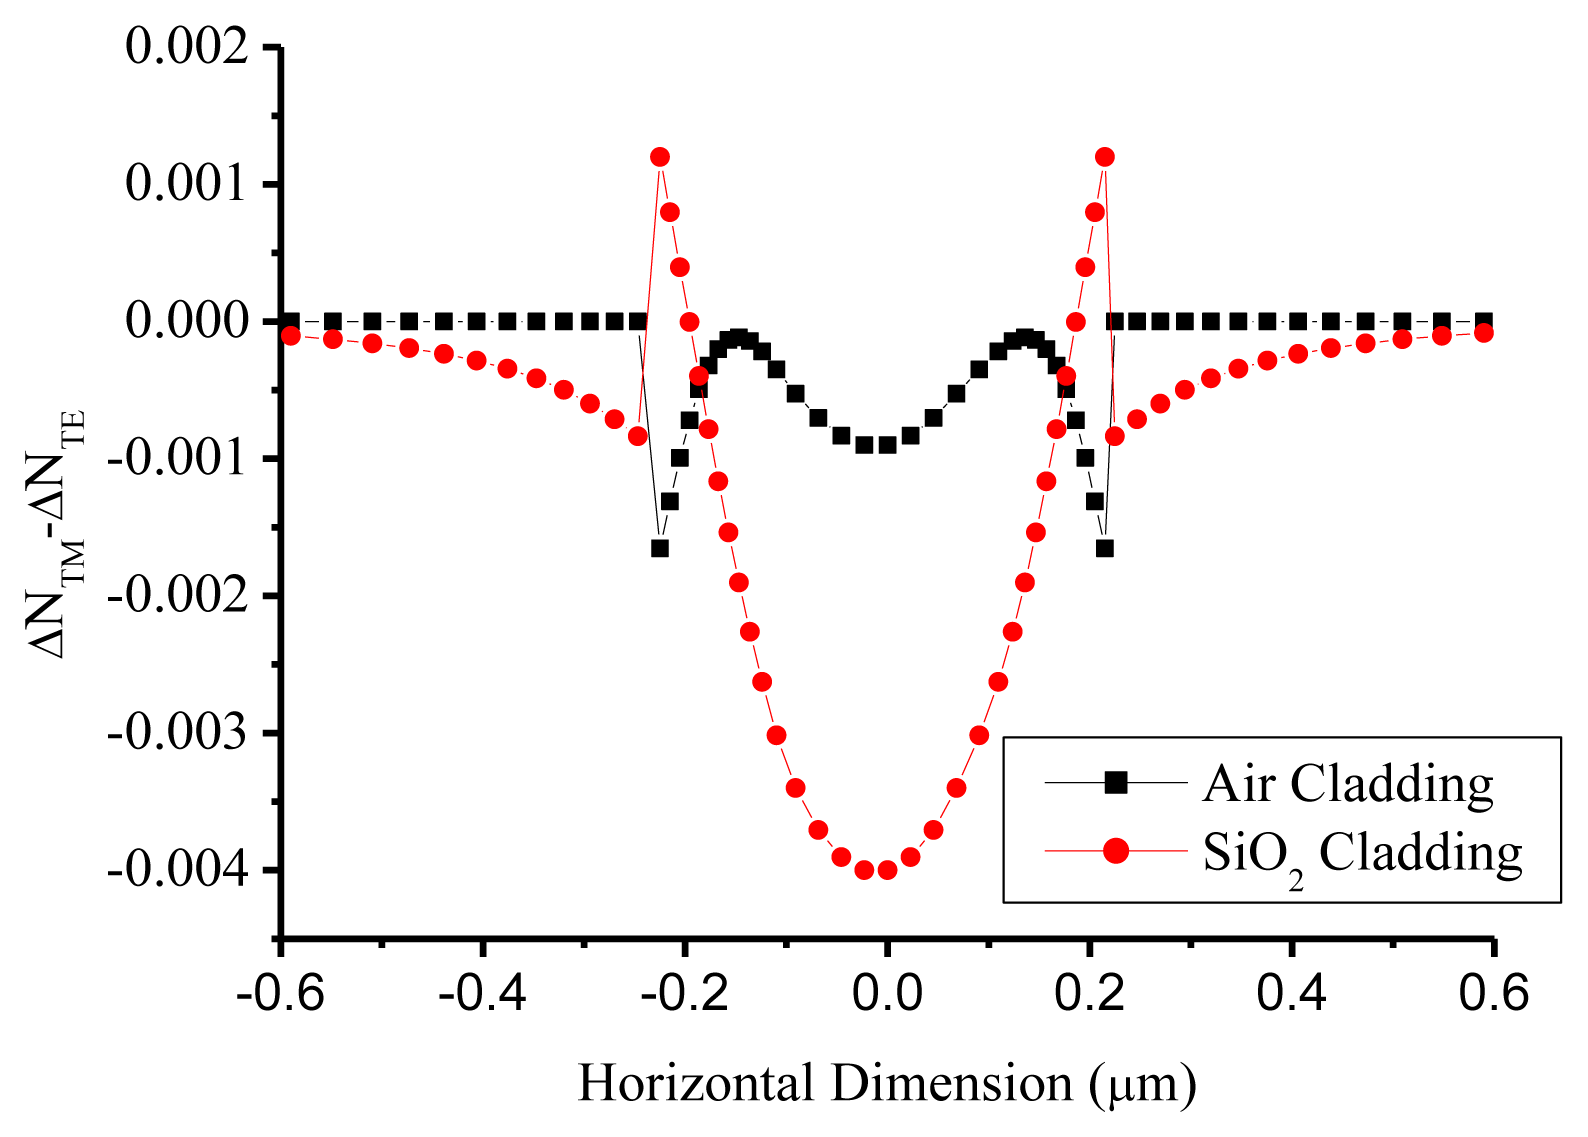
The MMI for the TM polarization is characterized in Figure 4 to have power ratios as 0.75 and 0.25 at 1,548.58 nm wavelength for k2 and t2, respectively, different from the theoretical calculation of 0.56/0.44. After the stress effect caused by the single 300 nm silicon dioxide cladding layer was considered, the calculated phase birefringence, which was proportional to stress effect [16] and executed by the Thermo Scientific C2V stress module, demonstrated non-uniform distribution in the silicon-wire waveguide, as shown in Figure 5. The air cladding was simulated for the birefringence comparison. The biggest birefringence occurred at the center of the silicon wire waveguide, where the most optical power was located, indicating that the MMI splitting ratio was significantly affected. The experimental splitting ratios of 0.75 and 0.25 were matched to the previous publication [12].
The bus waveguide and the coupler region were covered with plasma-enhanced chemical vapor deposition (PECVD) oxide. Our preliminary data showed the propagation loss difference between the air and PECVD oxide claddings on the silicon wire waveguides was around 0.1–0.2 dB/cm, which was matched to the previous publication [17]. In order to obtain the high Q for a long effective length, the MMI coupled MRR was studied with the lowest propagation loss and ring resonator perimeters. Our data showed that the silicon propagation loss was 5 dB/cm. The optical MMR perimeter was 3,368 μm with 20 μm bending radius.
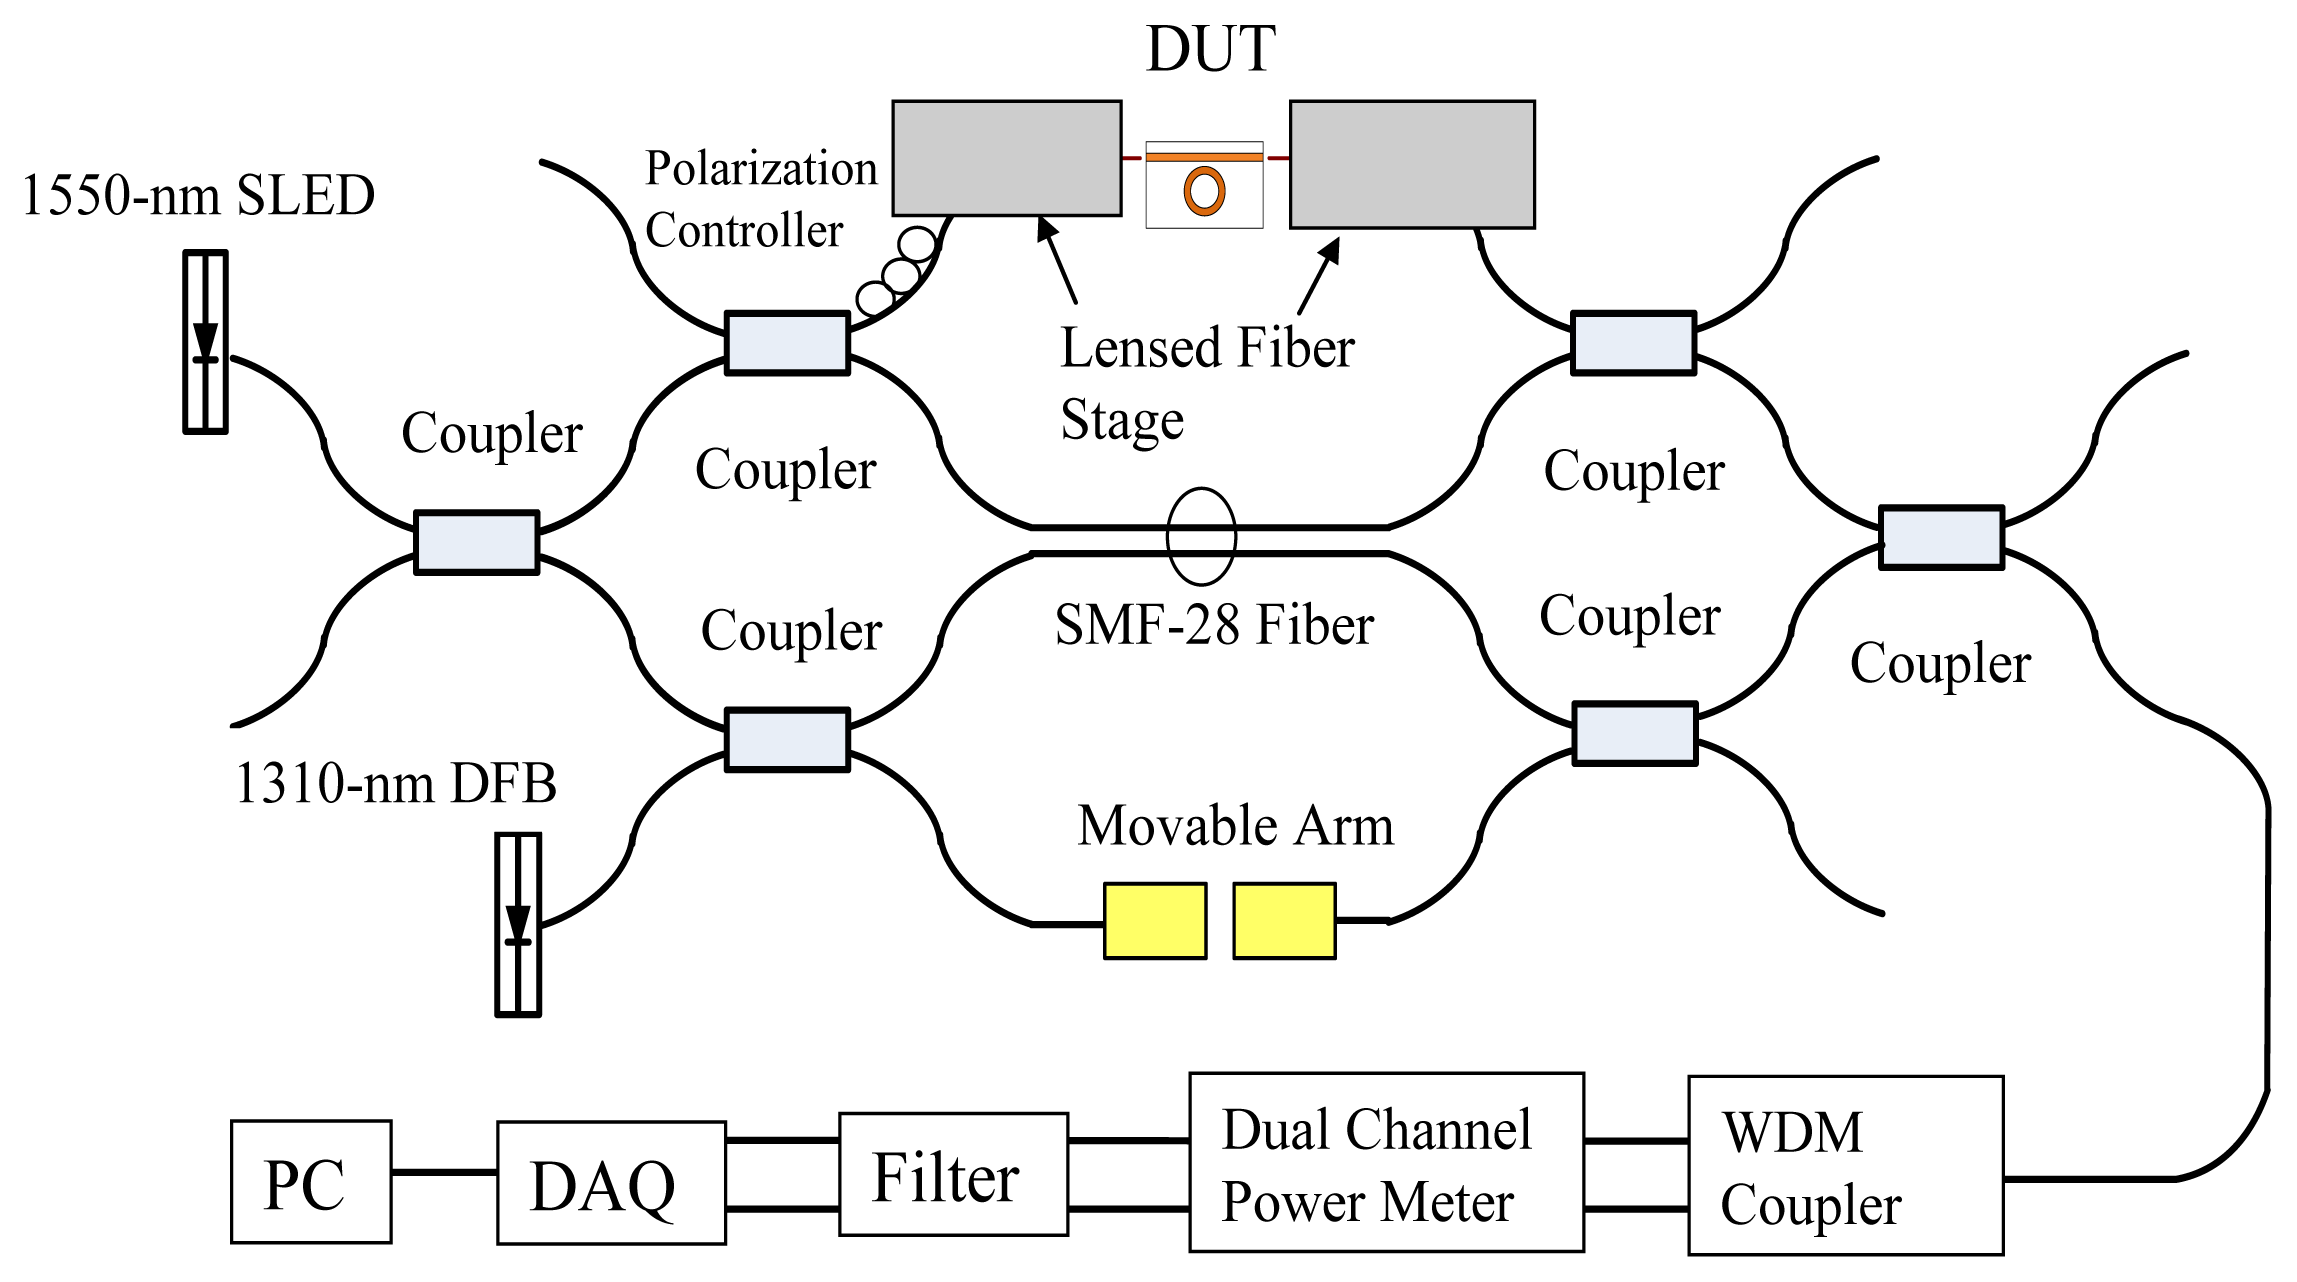
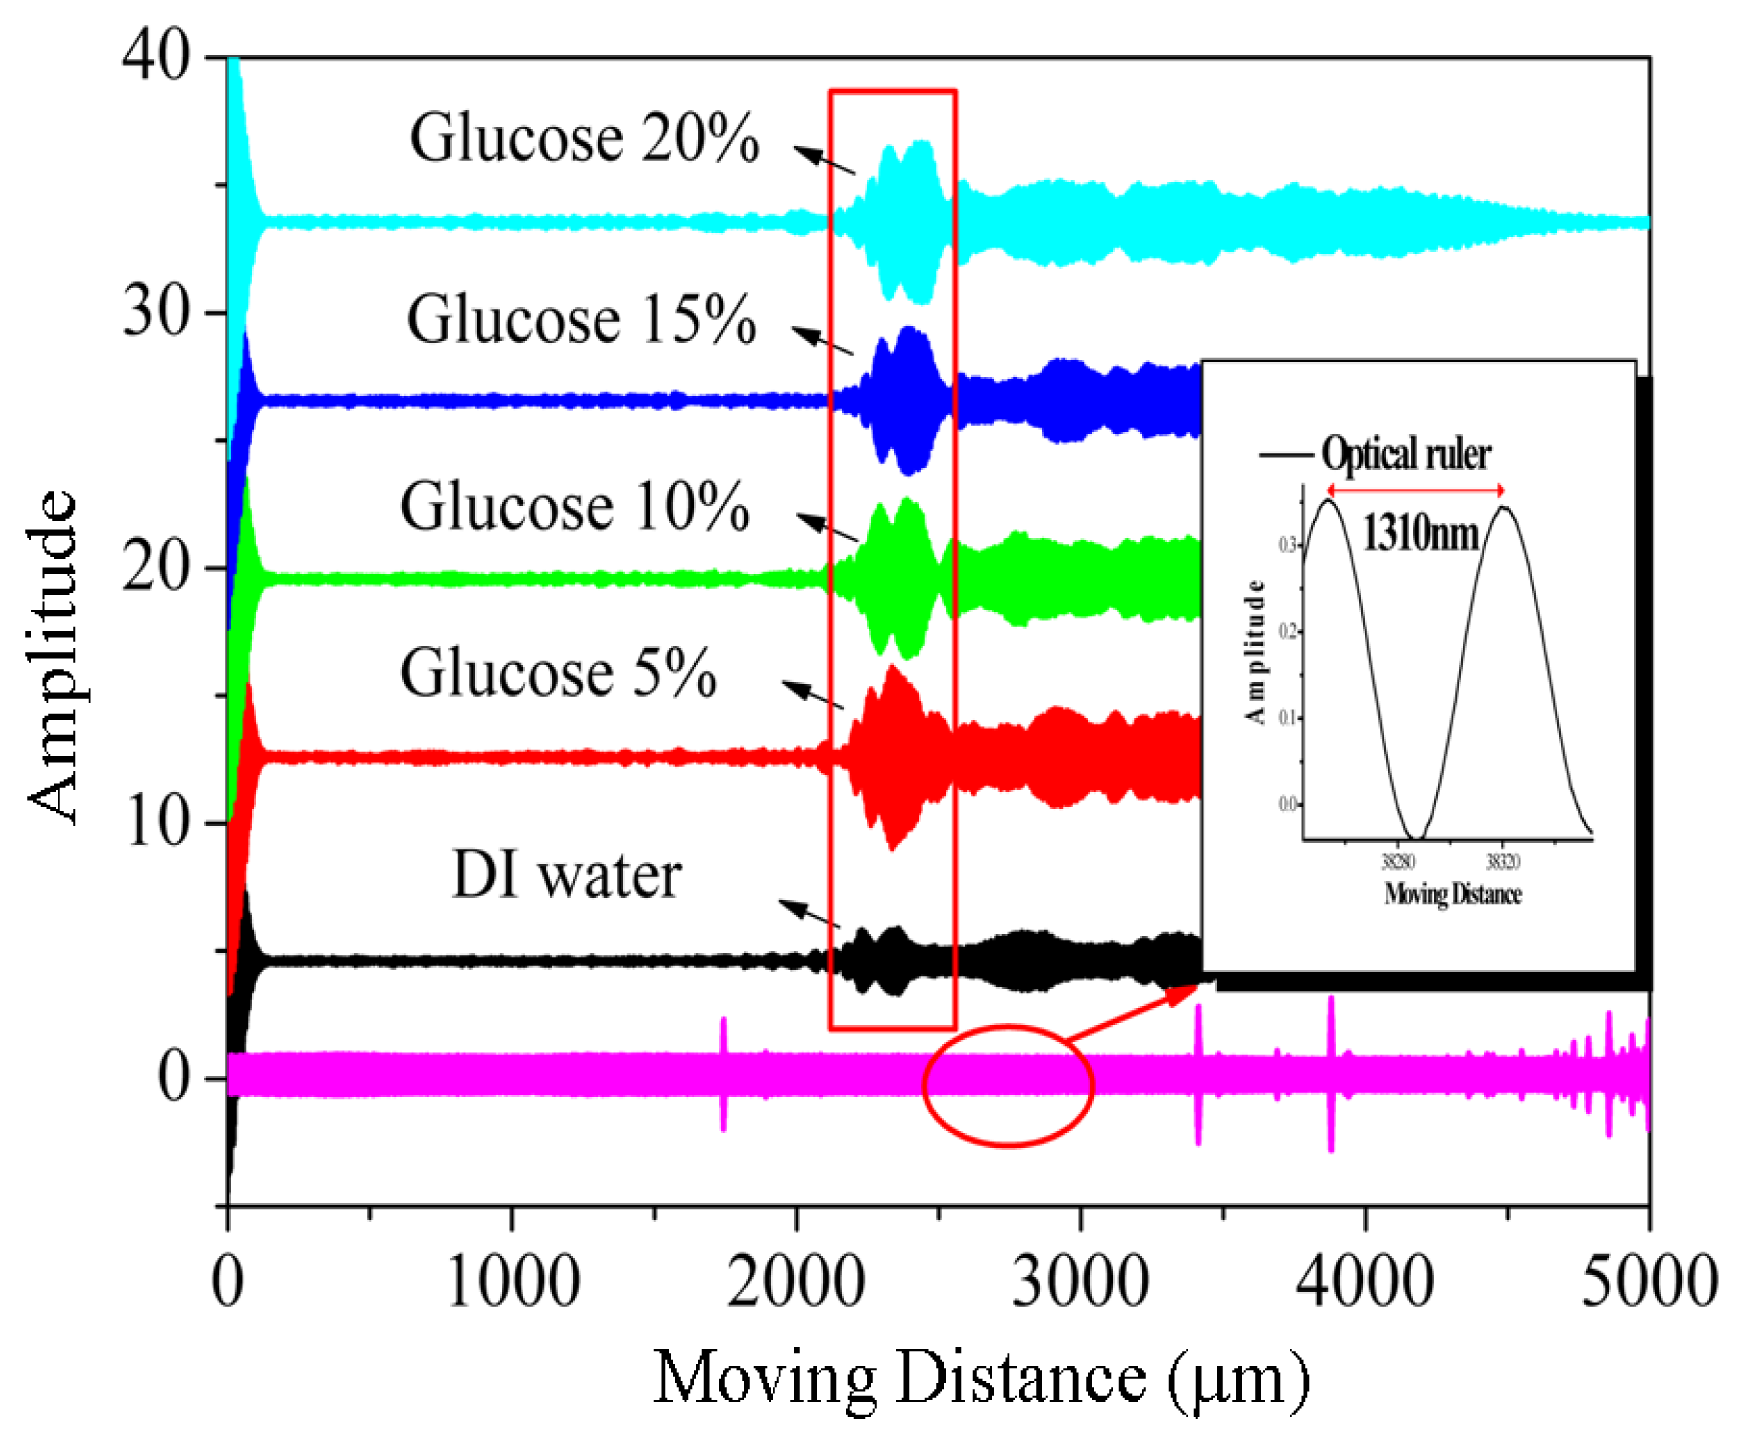
The OLCI included a fiber-optic MZ interferometer and a continuous-wave broadband source was utilized for characterization. The optical path difference between the two interferometer arms was changed by translating a motor driven stage, as shown in Figure 6. Therefore, a variable-delay interferometer could be illustrated using a spatially-localized interference fringe pattern or interferogram. The experimental setup separated TE and TM polarizations using a polarization controller. A super-luminescent diode (SLD), with a 3 dB spectral width of 60 nm and maximum output at 1,552 nm wavelength, involved with a 1,310 nm wavelength distributed feedback (DFB) laser as the optical ruler and propagated through OLCI where the DUT silicon-wire waveguide was installed in one of three arms. The collimators were placed onto a movable arm located on another MZ stage and controlled by a stepper motor. The optical power was analyzed using a dual channel power meter and the electrical filter and data acquisition (DAQ) card were executed for the noise filtering and analog/digital conversion functions. The relative collimator movement distance represents the interferogram phase difference and can derive the MRR effective length from Equation (4). A SMF-28 fiber functioned as the reference and demonstrated the first interferograms for every scan movement in Figure 7. To distinguish interferograms from the optical ruler, deionized water (DI) water and glucose concentrations of 5%, 10%, 15% and 20% in TE polarization, each interferogram intensity was intentionally shifted away from each other for around 10 arbitrary unit (A.U.) separation, as shown in Figure 7.
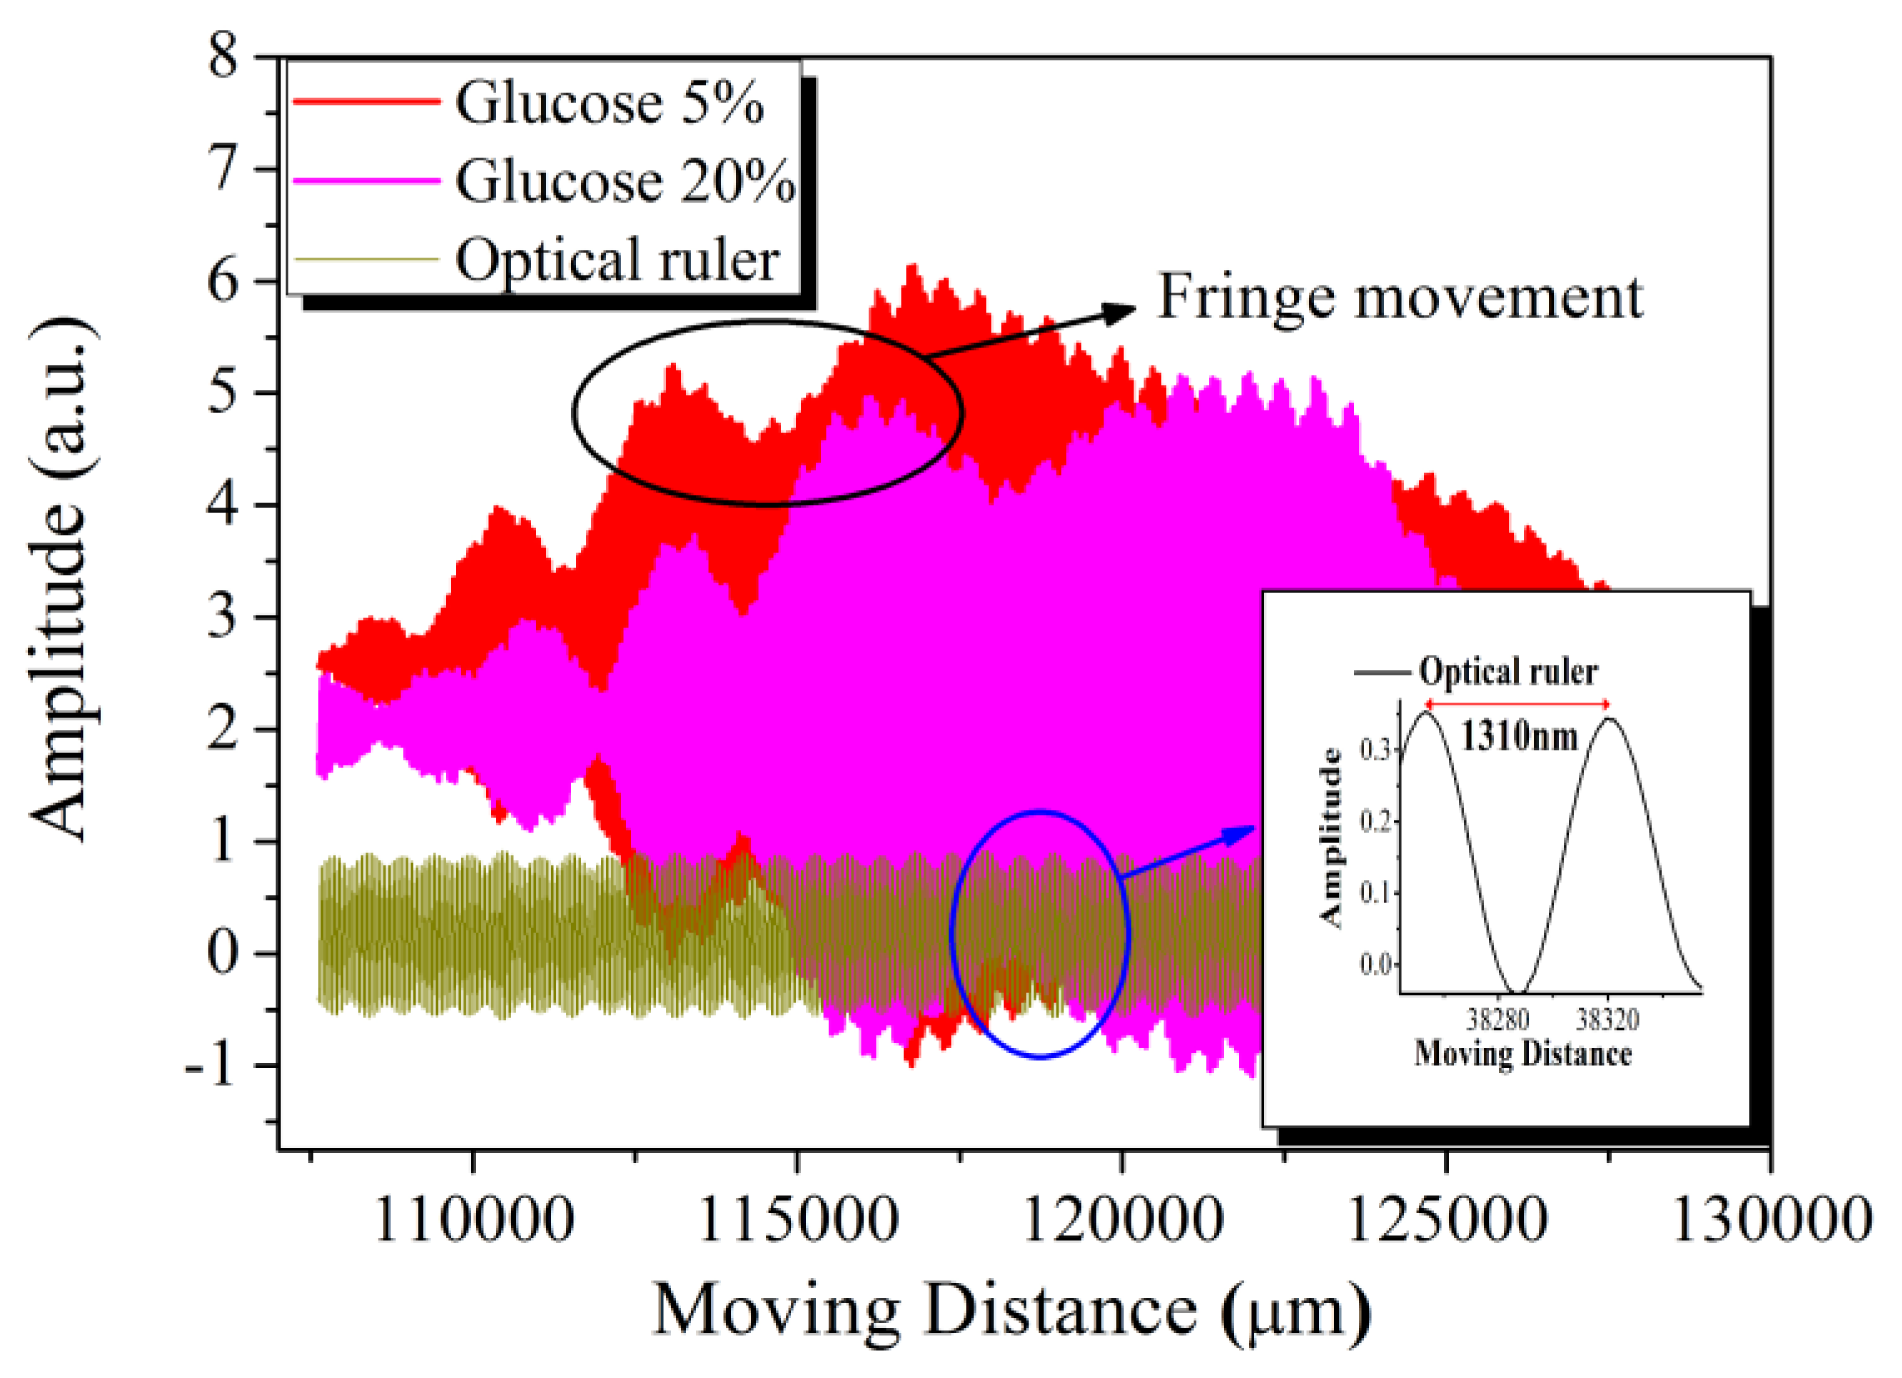
In Figure 7, the interferograms from glucose concentrations of 5% and 20% were taken to illustrate the relative movement distance. Curve fitting was applied on the selected peaks and the fringe movement was gauged from the relative distance between the full width at half maximum (FWHM) centers for each fitted curve, as shown in Figure 8.
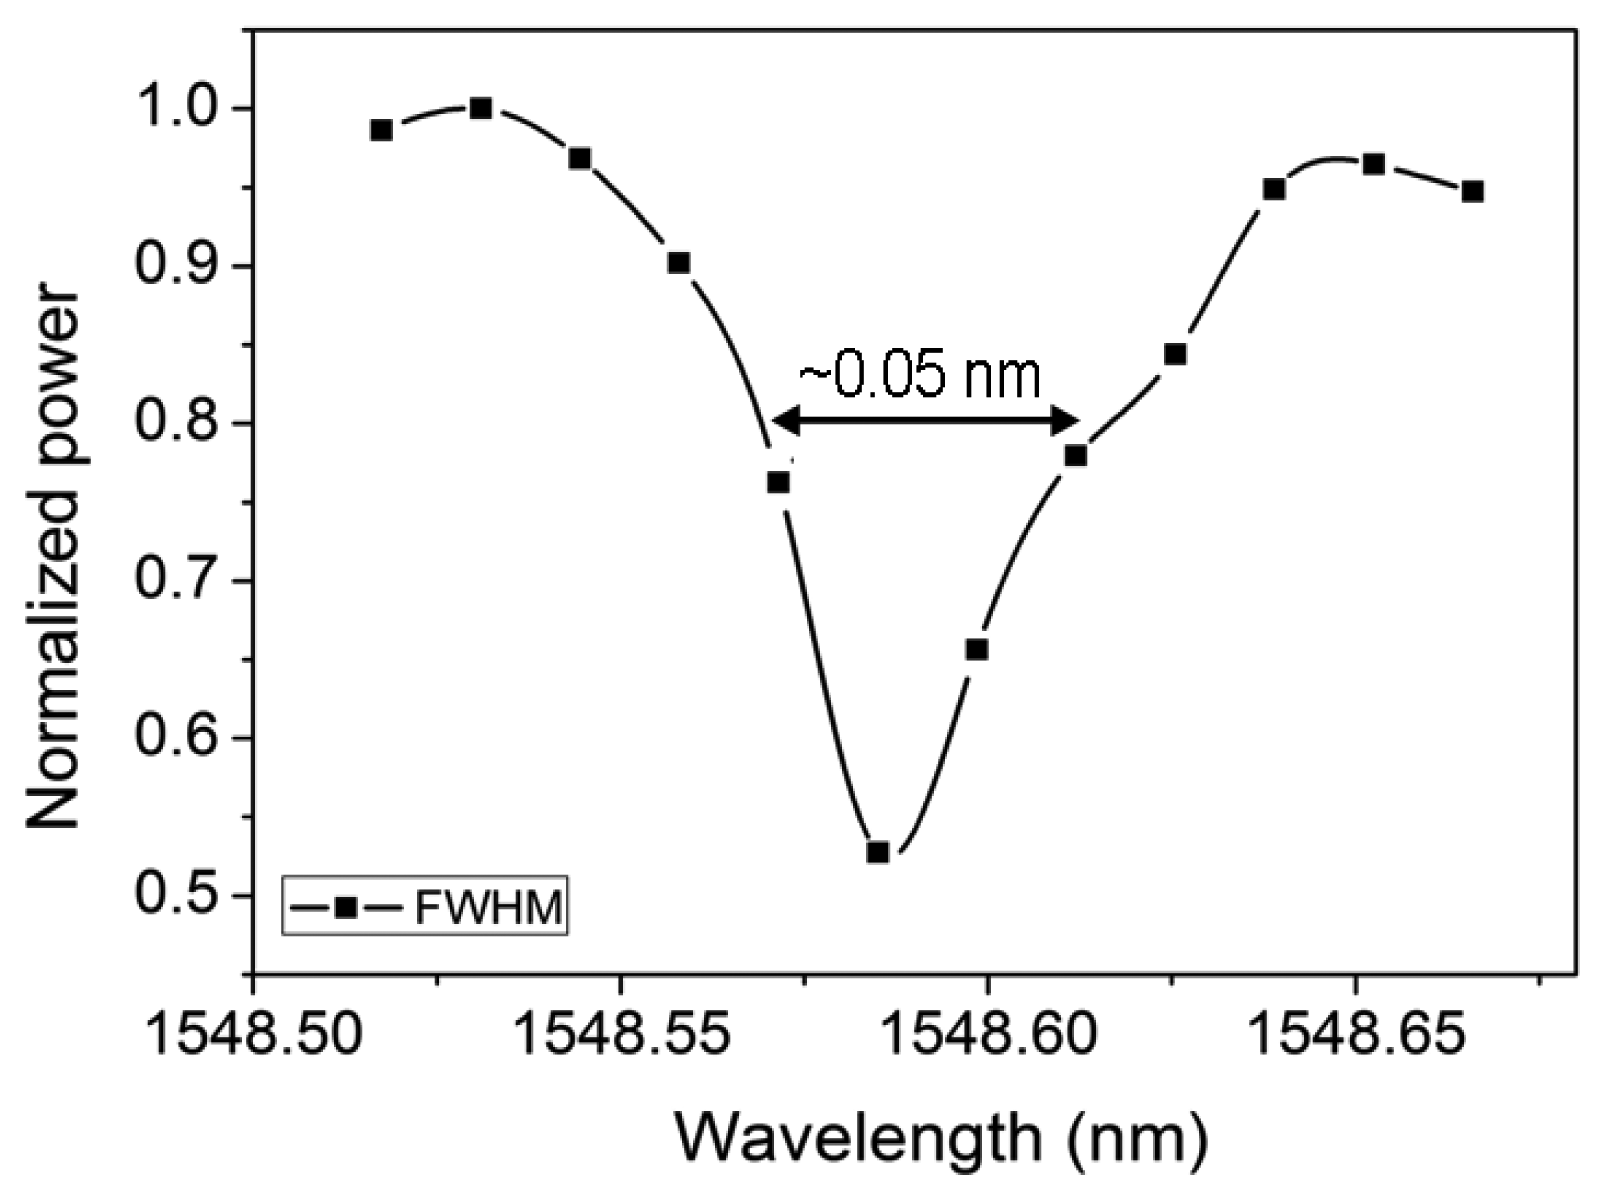
Due to the OSA resolution 0.1 nm limitation, the MRR resonance could not be distinguished well enough for the line width characterization. After considering the MMI coupler power cross-coupling coefficient as 0.75, the Q factor was then derived as ∼30,000 from the waveguide propagation loss 5 dB/cm for α, and MMI self-coupling coefficient 0.25 for t2 after ng and d were inserted as 4 [18] and 3,368 μm, respectively, from Equation (2). Furthermore, the DFB laser with the most stable 0.1 °C thermal tuning was utilized for testing, the FWHM demonstrated around 0.05 nm and the Q factor was ∼30,000, as shown in Figure 9 and the testing setup is shown in Figure 10.
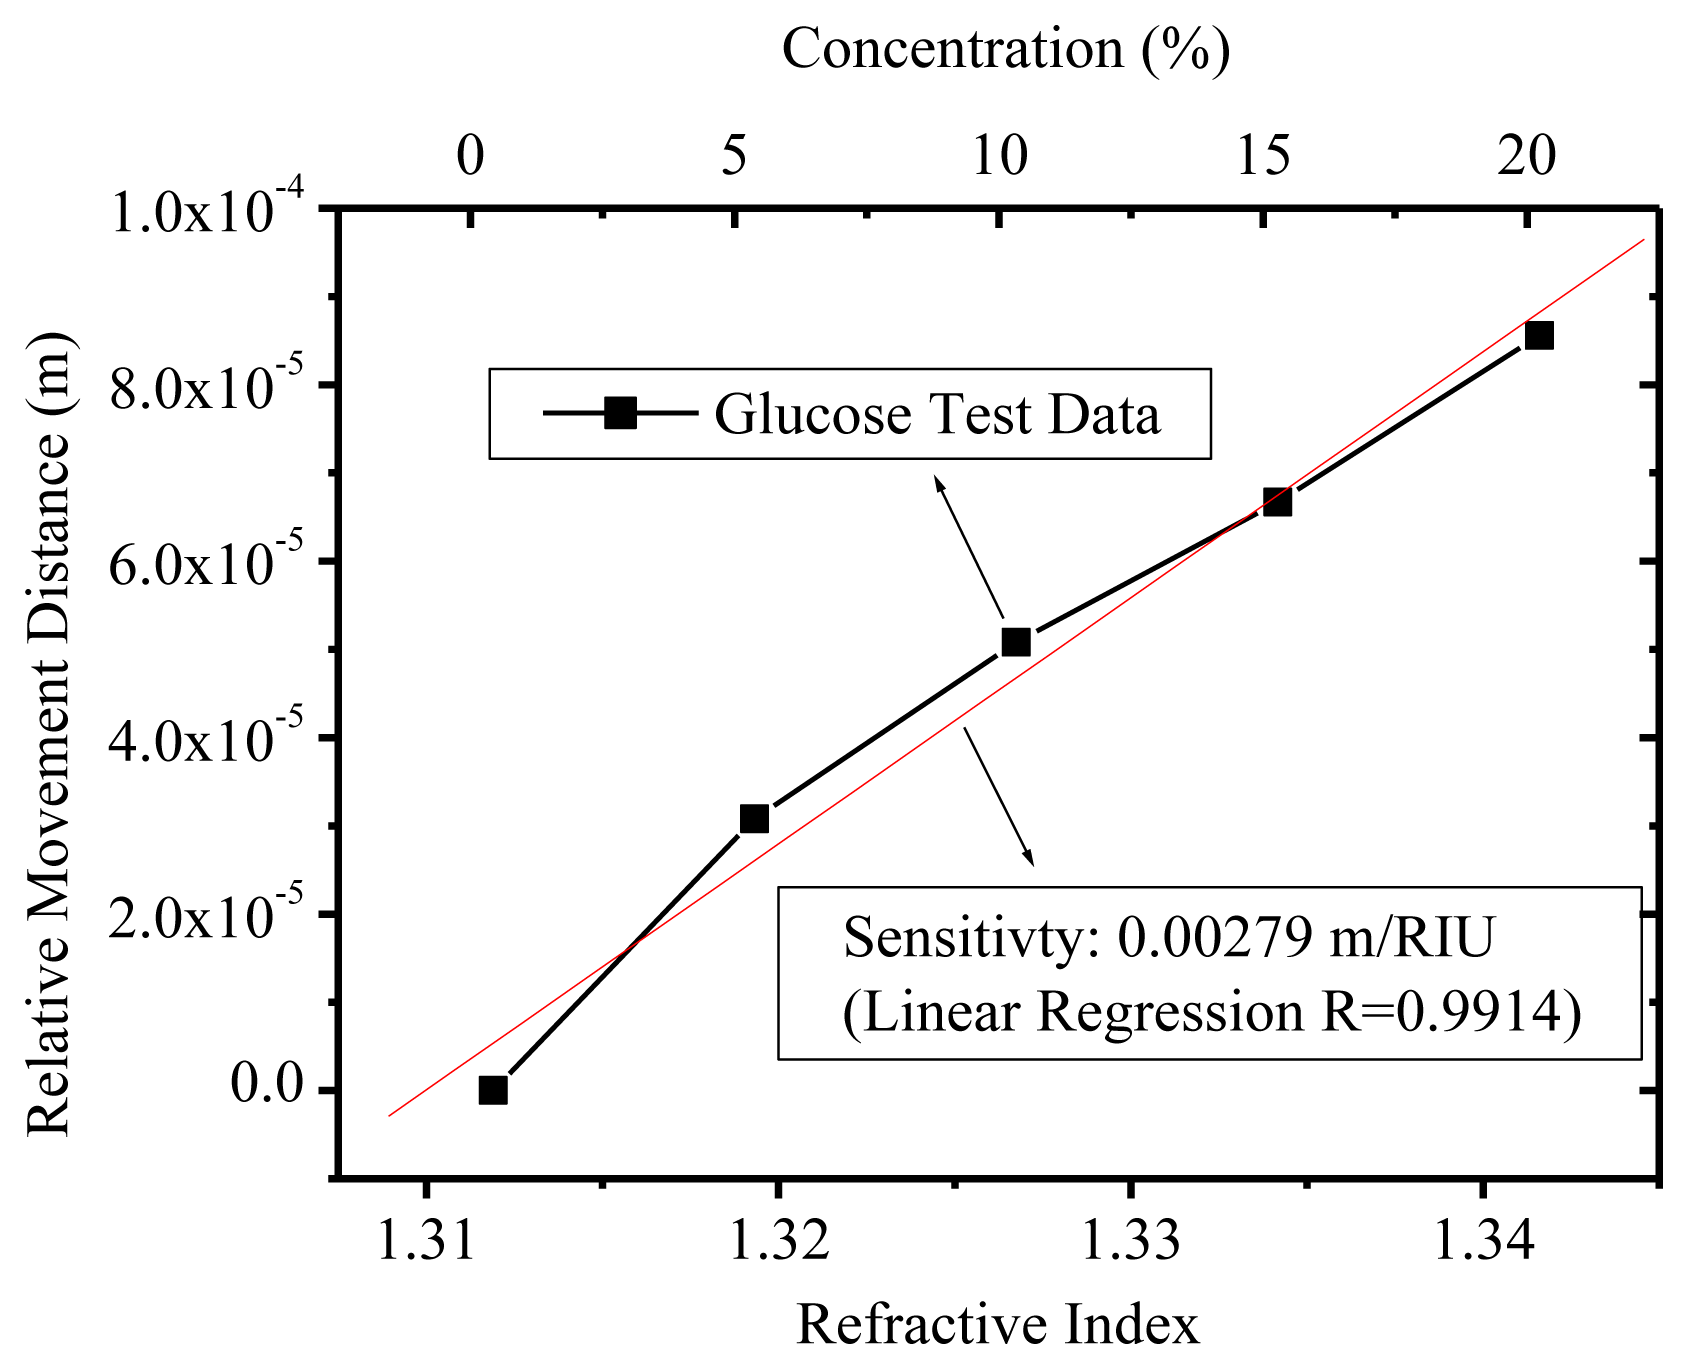
After the quality factor Q for an optical MRR was experimentally characterized as ∼30,000 at 1,548.58-nm wavelength, various glucose concentrations were prepared to increase from 5%, 10%, 15%, and 20%. The interferograms and their relative movement distances for TE polarization are illustrated in Figure 7. The fiber based OCLI system was sensitive to the polarization and the relative movement distance resolution was well controlled with 655 nm (= 1,310/2 nm) accuracy. We conclude that the sensing limitation was 2 × 10⁻⁴ (= 655 nm/0.00279 m) refractive index unit (RIU) from Equation (4). The glucose concentration could also be calculated as the refractive index [19] shown in Figure 11. The sensitivity was demonstrated as 0.00279 m/RIU after the linear fitting, which was Leff in Equation (4). From Equation (3)nTE could be derived as 2.65. The TM polarization was characterized, as shown in Figure 12, and its sensitivity was shown as 0.00365 m/RIU, which is more sensitive than the TE mode.
The TE curve is better than TM for linear regression and it may come from the rough top surface of the silicon wire waveguide due to the 800 nm photoresistor surviving failures in silicon core layer over-etch during RIE processing.
4. Conclusions
The proposed biosensing element is based on the SOI MRR effective length and takes advantage of its refractive index variation from interferograms for analyte detection. The waveguide effective index of refraction can also be derived from the MRR effective length. Our data demonstrated that the sensitivity was 0.00279 m/RIU and the sensing limitation achieved 2 × 10⁻⁴ with the optical ruler from 1,310 nm DFB laser. The sensitivity and detection limit could be further improved using MMI stress compensation.
Acknowledgments
The authors would like to thank Zih-Hao Ye and Jue-Yu Chen for their technical assistance and discussions. This paper was supported by two programs—the joint research program from National Taiwan University of Science and Technology/Taipei Medical University under the contract NTUST-TMU-101-09 and the National Science Council of the Republic of China, Taiwan, under the contract NSC-100-2221-E-011-090-MY3.
Conflicts of Interest
The authors declare no conflict of interest.
References
- Passaro, V.M.N.; Dell'Olio, F.; Casamassima, B.; de Leonardis, F. Guided-wave optical biosensors. Sensors 2007, 7, 508–536. [Google Scholar]
- Fathpour, S.; Jalali, B. Silicon Photonics for Telecommunications and Biomedicine; CRC Press: Boca Raton, FL, USA, 2012; Chapter 6. [Google Scholar]
- Blair, S.; Chen, Y. Resonant-enhanced evanescent-wave fluorescence biosensing with cylindrical optical cavities. Appl. Opt. 2001, 40, 570–582. [Google Scholar]
- De Vos, K.; Bartolozzi, I.; Schacht, E.; Bienstman, P.; Baets, R. Silicon-on-insulator microring resonaltor for sensitive and label-free biosensing. Opt. Express 2007, 15, 7610–7615. [Google Scholar]
- Ksendzov, A.; Lin, Y. Integrated optics ring-resonator sensors for protein detection. Opt. Lett. 2005, 30, 3344–3346. [Google Scholar]
- Ince, R.; Narayanaswamy, R. Analysis of the performance of interferometry, surface plasmon resolution and luminescence as biosensors and chemosensors. Anal. Chim. Acta 2006, 569, 1–20. [Google Scholar]
- Densmore, A.; Xu, D.-X.; Janz, S.; Waldron, P.; Mischki, T.; Lopinski, G.; Delâge, A.; Lapointe, J.; Cheben, P.; Lamontagne, B.; et al. Spiral-path high-sensitive silicon photonic wire molecular sensor with temperature-independent response. Opt. Lett. 2008, 33, 596–598. [Google Scholar]
- Wo, J.; Wang, G.; Gui, Y.; Sun, Q.; Liang, R.; Shum, P.P.; Liu, D. Refractive index sensor using microfiber-based Mach-Zehnder interferometer. Opt. Lett. 2012, 37, 67–69. [Google Scholar]
- Pozzi, M.; Zonta, D.; Wu, H.; Inaudi, D. Development and laboratory validation of in-line multiplexed low-coherence interfermetric sensors. Opt. Fiber Technol. 2008, 14, 281–293. [Google Scholar]
- Schmitt, K.; Schirmer, B.; Brandenburg, A. Development of a highly sensitive inteferometric biosensor. Proc. SPIE 2004, 5461, 22–29. [Google Scholar]
- Larin, K.V.; Akkin, T.; Esenaliev, R.O.; Motamedi, M.; Milner, T.E. Phase-sensitive optical low-coherence reflectometry for the detection of analyte concentrations. Appl. Opt. 2004, 43, 3408–3414. [Google Scholar]
- Xu, D.-X.; Densmore, A.; Waldron, P.; Lapointe, J.; Post, E.; Delâge, A.; Janz, S.; Cheben, P.; Schmid, J.H.; Lamontagne, B. High bandwidth SOI photonic wire ring resonators using MMI couplers. Opt. Express 2007, 15, 3149–3155. [Google Scholar]
- Soldano, L.; Pennings, E.C.M. Optical multi-mode interference devices based on self-imaging: Principles and applications. J. Light. Technol. 1995, 13, 615–627. [Google Scholar]
- Fan, X.; White, I.M.; Shopova, S.I.; Zhu, H.; Suter, J.D.; Sun, Y. Sensitive optical biosensors for unlabeled targets: A review. Anal. Chim. Acta 2008, 620, 8–26. [Google Scholar]
- Gorodetsky, M.L.; Savchenkov, A.A.; Ilchenko, V.S. Ultimate Q of optical microsphere resonators. Opt. Lett. 1996, 21, 453–455. [Google Scholar]
- Lockwood, D.J.; Pavesi, L. Silicon Photonics II Components and Integration; Springer-Verlag: Berlin, Germany, 2011; Chapter 2. [Google Scholar]
- Selvaraja, S.K.; Sleeckx, E.; Schaekers, M.; Bogaerts, W.; Thourhout, D.V.; Dumon, P.; Baets, R. Low-loss amorphous silicon-on-insulator technology for photonic integrated circuitry. Opt. Commun. 2009, 282, 1767–1770. [Google Scholar]
- Dulkeith, E.; Xia, F.; Schares, L.; Green, W.M.J.; Vlasov, Y.A. Group index and group velocity dispersion in silicon-on-insulator photonic wires. Opt. Express 2006, 14, 3853–3863. [Google Scholar]
- Su, H.; Huang, X.G. Fresnel-reflection-based fiber sensor for on-line measurement of solute concentration in solutions. Sens. Actuat. B 2007, 126, 579–582. [Google Scholar]


© 2014 by the authors; licensee MDPI, Basel, Switzerland. This article is an open access article distributed under the terms and conditions of the Creative Commons Attribution license (http://creativecommons.org/licenses/by/3.0/).
Share and Cite
Hsu, S.-H.; Yang, Y.-C.; Su, Y.-H.; Wang, S.-M.; Huang, S.-A.; Lin, C.-Y. Biosensing Using Microring Resonator Interferograms. Sensors 2014, 14, 1184-1194. https://doi.org/10.3390/s140101184
Hsu S-H, Yang Y-C, Su Y-H, Wang S-M, Huang S-A, Lin C-Y. Biosensing Using Microring Resonator Interferograms. Sensors. 2014; 14(1):1184-1194. https://doi.org/10.3390/s140101184
Chicago/Turabian StyleHsu, Shih-Hsiang, Yung-Chia Yang, Yu-Hou Su, Sheng-Min Wang, Shih-An Huang, and Ching-Yu Lin. 2014. "Biosensing Using Microring Resonator Interferograms" Sensors 14, no. 1: 1184-1194. https://doi.org/10.3390/s140101184