Thermal Balance Analysis of a Micro-Thermoelectric Gas Sensor Using Catalytic Combustion of Hydrogen

Abstract
: A thermoelectric gas sensor (TGS) with a combustion catalyst is a calorimetric sensor that changes the small heat of catalytic combustion into a signal voltage. We analyzed the thermal balance of a TGS to quantitatively estimate the sensor parameters. The voltage signal of a TGS was simulated, and the heat balance was calculated at two sections across the thermoelectric film of a TGS. The thermal resistances in the two sections were estimated from the thermal time constants of the experimental signal curves of the TGS. The catalytic combustion heat Qcatalyst required for 1 mV of ΔVgas was calculated to be 46.1 μW. Using these parameters, we find from simulations for the device performance that the expected Qcatalyst for 200 and 1,000 ppm H2 was 3.69 μW and 11.7 μW, respectively.1. Introduction
Inflammable gases such as CO, CH4, and H2, which can amount to several hundred parts per million in human breath [1,2], can be used for medical examination and detected by the micro-calorimetric device of a thermoelectric gas sensor (TGS) with a combustion catalyst. The TGS can be a useful platform device, because it is possible to modify the catalyst of the TGS for the target gas. We have reported that a TGS with a Pt-loaded alumina (40 wt%Pt/alumina) catalyst can detect H2 over a wide concentration range from as low as 0.5 ppm up to 5 vol.% H2 in air [3]. In addition, this device showed a good linearity between the H2 concentration in air and the sensing signal at the catalyst temperature of 100 °C. We have succeeded in measuring H2 in the human breath at the parts per million level [4]. Additional improvements in the TGS device are required for the detection of CO and CH4, such as much higher catalyst temperature and precise temperature control, because CO and CH4 are less inflammable as compared to H2. The thermal design of a TGS should be improved for efficient transport of the catalytic combustion heat of CO and CH4. In order to produce an effective design, the heat balance of the sensor during operation needs to be estimated. Moreover, the heat balance can predict the inflammable gas combustion energy of the catalyst, as the heat as a function of the sensor output is also important for the development of the catalyst. However, the heat of combustion of the small amount catalyst which is used for gas sensors is difficult to estimate since it is difficult to measure the temperature of small parts of devices like sensors.
In this paper, a calculation for the heat balance of both ends of the thermoelectric (TE) film of a sensor device is presented, and the sensor output is simulated. Calculations for the rate of catalytic combustion converted to a voltage signal using a heat balance calculation are compared with the experimental results that estimate the rate of catalytic combustion of a TE hydrogen sensor.
2. TGS Device Preparation
Figure 1 shows a photograph of the micro-TGS with the ceramic combustion catalyst used in this study. A double-sided polished Si substrate with a thickness of 0.35 mm was used. A silicon-germanium (SiGe) thin film was deposited by DC magnetron sputtering and patterned into the TE material by RIE etching. Micro-heater and electrode lines were fabricated using a lift-off technique involving platinum. To fabricate a membrane structure, the bottom of the substrate was etched using an aqueous KOH solution. The detailed process has been previously reported [5]. A metal colloid solution was stirred constantly, followed by the addition of Al2O3 powder to the solution to create a catalyst powder of 40 wt% metal content. Then, distilled water was added to the solution, and the solution was agitated at 70 °C until the water evaporated. The solid residue obtained was dried at 90 °C for 30 min and then baked in air at 300 °C for 2 h to obtain the catalyst powder. A ceramic paste of the catalyst was prepared by mixing terpineol, ethyl cellulose, and distilled water at a weight ratio of 9:1:5. A drop of the ceramic paste was placed on the thin membrane of the micro-TGS using an air dispenser. The size of the drop on the membrane could be controlled to 0.6 mm in diameter by changing the dispensing time and air pressure. After paste deposition, the device was baked in air at 300 °C for 2 h.
Table 1 lists the material constants and boundary conditions for the TGS used in this study. The heat capacity of the dispensed 40 wt%Pt/Al2O3 catalyst, Ccatalyst, was 4.34 μJ/K, as estimated from the specific heat capacity, density and volume. The catalytic specific heat capacity was estimated from the catalytic constituent and material constants for Pt and Al2O3. The dimensions of the dispensed catalyst, diameter, thickness, and volume were measured using a P16+ Profiler manufactured by KLA-Tencor. The heat capacities of the membrane, Cmembrane, in sections A and B were assumed to be the same as Ccatalyst since the size of the membrane and the size of the catalyst are similar. CA was computed as the sum of Ccatalyst and Cmembrane and is equal to 8.68 μJ/K. CB was simply equal to Cmembrane, which is 4.34 μJ/K. α was 0.2 mV/K in this study, as obtained from [3].
The gas response of the sensor was investigated using a flow chamber. After placing a sensor in the flow chamber, air and the hydrogen were allowed to alternately flow into the chamber. The operating temperature was adjusted by heater control and the cold-side junction was monitored using an IR camera (Nikon, LAIRD-270A). The voltage signal from the sensor was monitored using a digital multimeter (KeithleyK2700).
3. Design and Detection Principle for the Calorimetric Device of a TGS
3.1. Thermal Balance in a TGS
A TGS consists of a thermal sensor that detects the temperature difference. The heat balance for a thermal sensor is briefly denoted by the following equation [8–10]:
The temperature difference T(t)−Tambient depends linearly on the thermal resistance R and heating power input P. A sensor with a low heating power output and big thermal resistance leads to a large temperature difference. In the TGS, the hot and cold junctions of a TE film are on a membrane, which can reduce unwanted noise caused by air flow, for example. Therefore, the heat balances in two junctions of a TE film become important and differ from each other in Equation (1). A TGS emits a signal VS according to the temperature difference ΔT between both ends of the TE film; ΔT is determined by two energy balances of the TE film at both ends.
Figure 1 shows an optical image of the TGS device [3]. Two sections of the heater meander line on the membrane are called sections A and B, and the center section of the straight heater line is called section C. The two different temperatures at the heater meander sections A and B in the membrane are temperatures TA and TB, respectively, of the ends of the TE film in the lumped parameter system. VS of the TGS can be expressed as follows from the Seebeck effect:
3.2. Voltage Signal ΔVgas for Inflammable Gas
The voltage signal ΔVS for combustion gas is the voltage difference between the saturated voltage of the TGS in inflammable gas Vgas and that in air Vair:
When the TGS signal is saturated, the TGS is considered to be in a thermally steady state. Thus, the left-hand sides of Equations (3) and (4) can be set to zero at steady state (dT/dt = 0), and be rewritten as follows:
To determine Vgas, Equations (6) and (7) are substituted into Equation (2):
In order to solve for Vair as in Equation (8), Equations (6) and (7) are substituted into Equation (2), where Qcatalyst in Equation (6) is set to zero in air:
In order to calculate ΔVgas, Equations (8) and (9) are substituted into Equation (5):
The parameters that determine ΔVgas for the TGS are α, Qcatalyst, and RA.
3.3. Voltage Signal VS(t)
If we consider that Equations (3) and (4) are a first-order system response, these equations can be changed into the following by Laplace analysis [8]:
Then, the thermal time constants τA and τB are expressed as follows:
If Equations (11) and (12) are substituted into Equation (2)VS (t) is calculated as
The time constant of the voltage signal τS in Equation (15) is determined by the correlation of sections A and B. Furthermore, τS depends only on section A, indicating that τS = τA when the sensor is thermally stabilized by heating, and the combustion gas is introduced.
4. Experimental Verification and Discussions
4.1. Voltage Signal Response VS(t) of the TGS for Hydrogen Gas
The Qcatalyst is proportional to the hydrogen concentration of the air flow [3]. It is assumed that the catalyst combustion energy Qcatalyst is the constant in Equations (3) and (4). In TGS, the catalyst combustion energy is proportional to the gas concentration such as the H2. It takes time that the gas concentration in the chamber reaches the gas concentration of the flow to the chamber when the certain gas concentration flows to the chamber. So, the catalyst combustion heat is not the ideal constant parameter since the gas concentration in the chamber is not constant.
Figure 2 shows the voltage signal response curve of the TGS for 200 ppm H2. The catalyst of the TGS device was heated up to 120 °C by its micro-heater. First, air flowed up to 30 s, then H2 flowed from 30 to 60 s, and then air flowed again, where the flow rate was changed from 200 to 1,800 ccm. The time constant is small by the gas mass flow because the time until the hydrogen concentration in the chamber reaches to 200 ppm is short.
4.2. Combustion Reaction Limited VS(t) of the TGS at High Gas Flow End
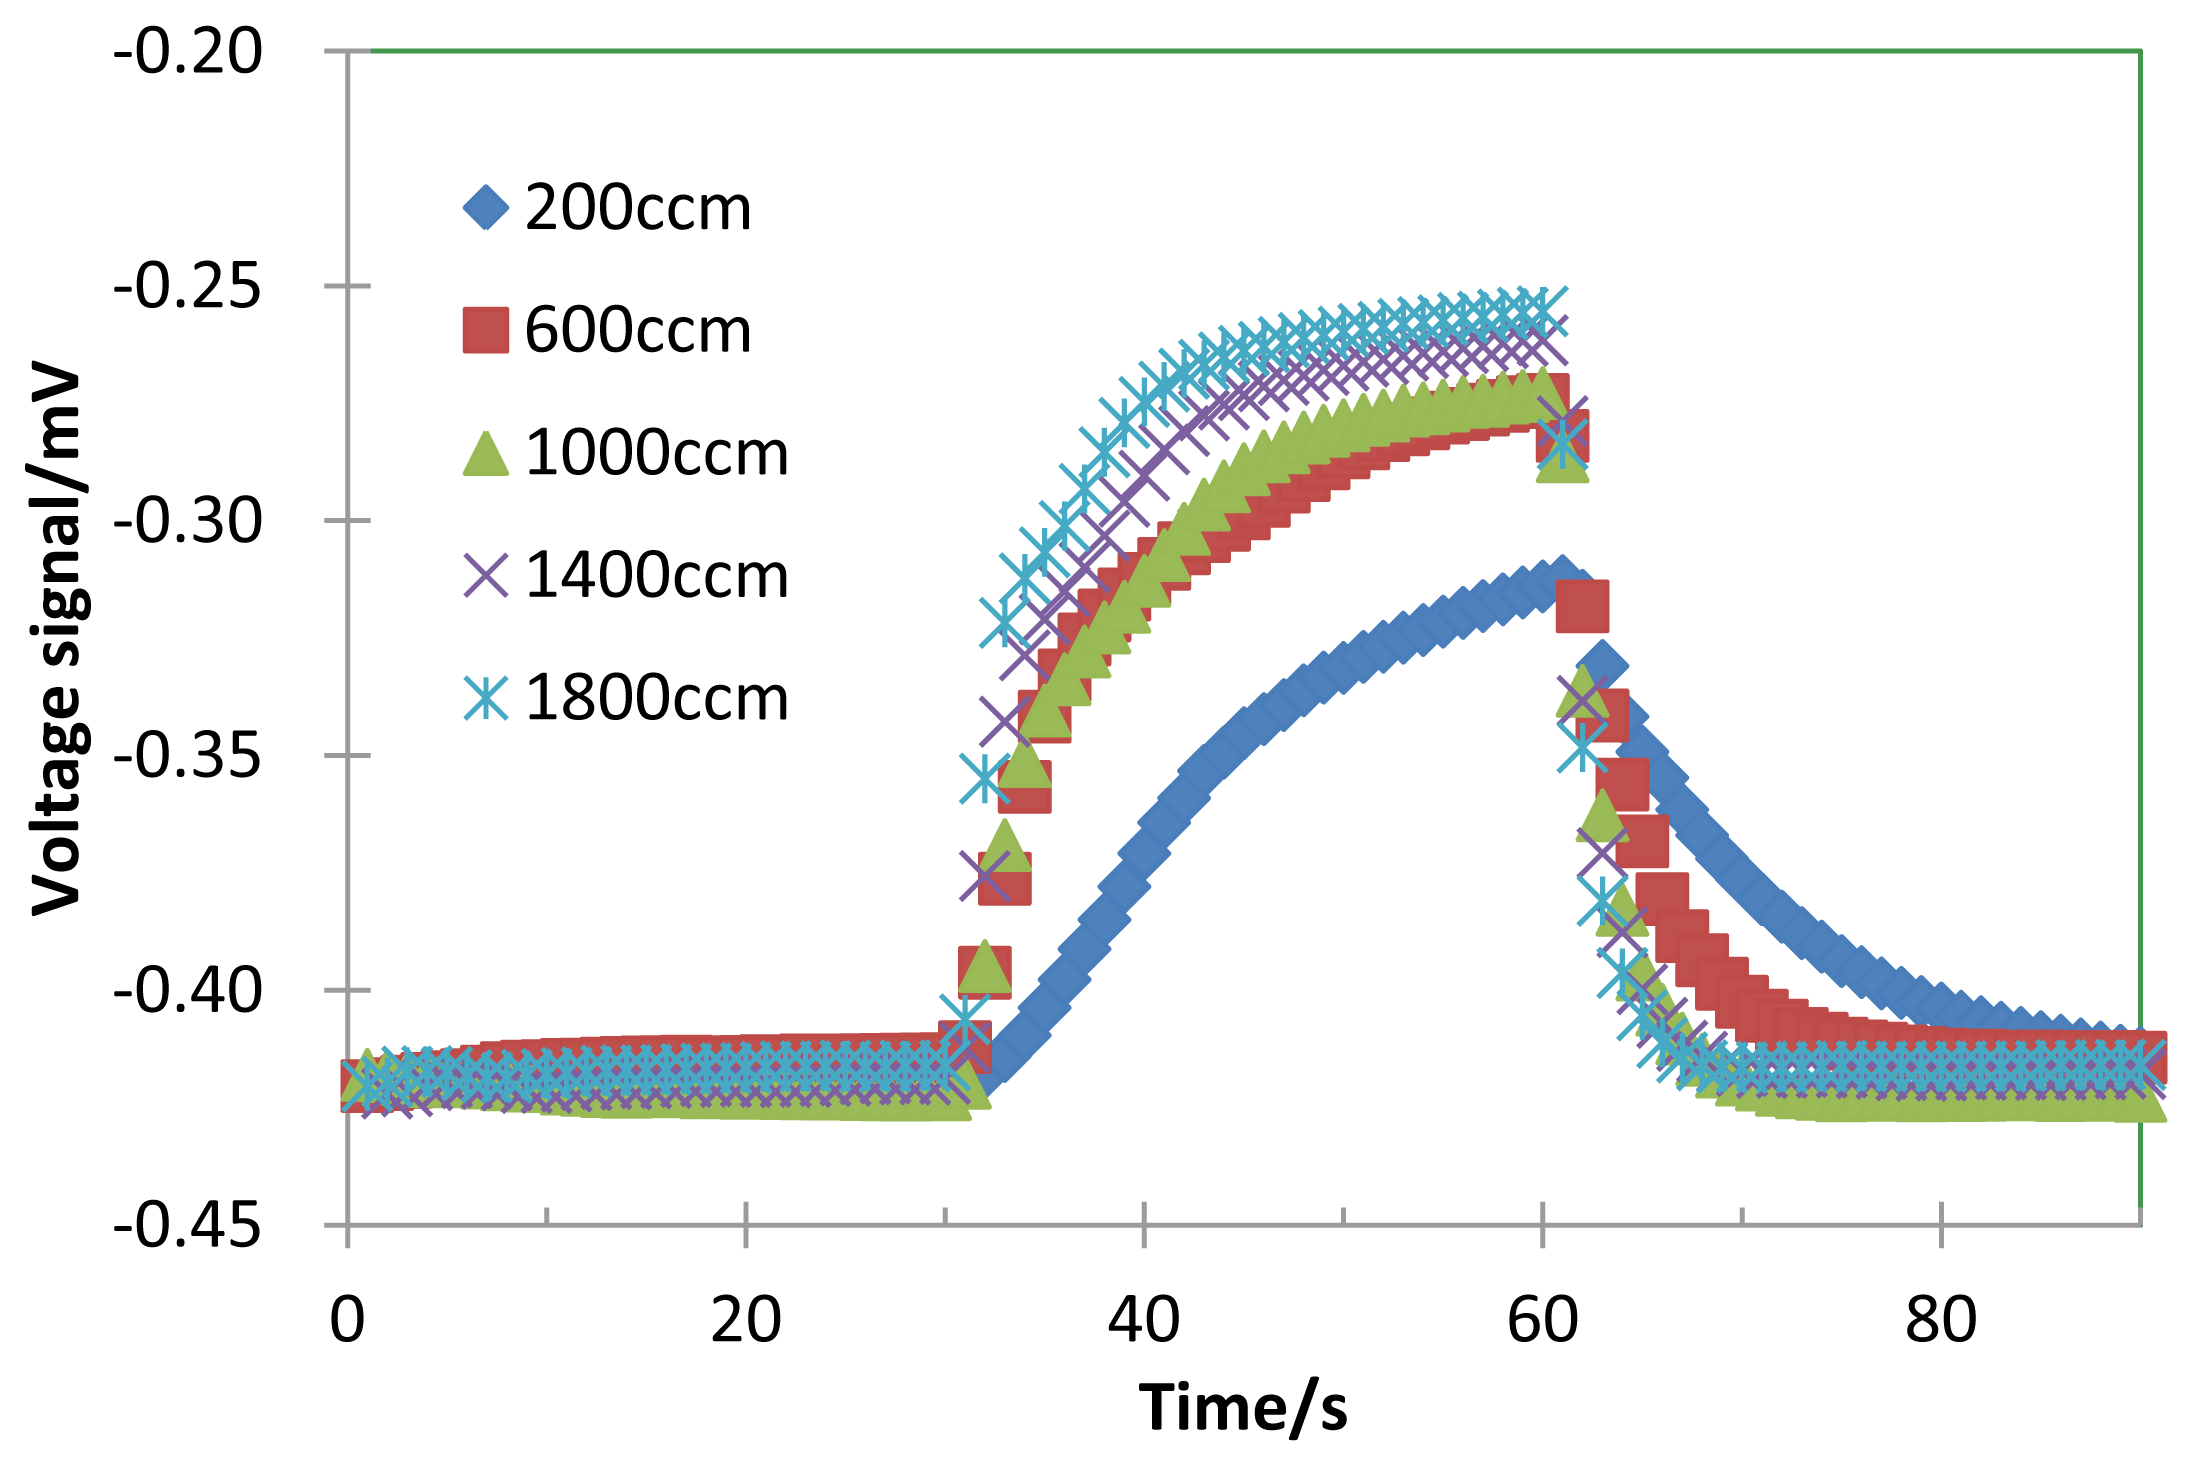
Figure 3 shows the flow rate dependence of the thermal time constant, τA, and the voltage difference, ΔVgas, of the TGS for 200 ppm H2 combustion under various gas flow rate from 200 to 1,800 ccm. τA measured at the elapsed time from 60 s to decreasing at 63.2% of the saturated value of ΔVgas. For the gas flow rate below 1,000ccm, τA decreased from 10 to 3 s with the flow rate, and became constant over 1,000 ccm. τA will be independent of the flow rate in the reaction limited state.
In Figures 2 and 3, ΔVgas increased with the flow rate. If the operating temperature is high enough to activate the combustion, the reaction would be diffusion-limited, being controlled by the diffusion of the hydrogen gas to the catalyst surface.
4.3. Estimation of Thermal Time Constants
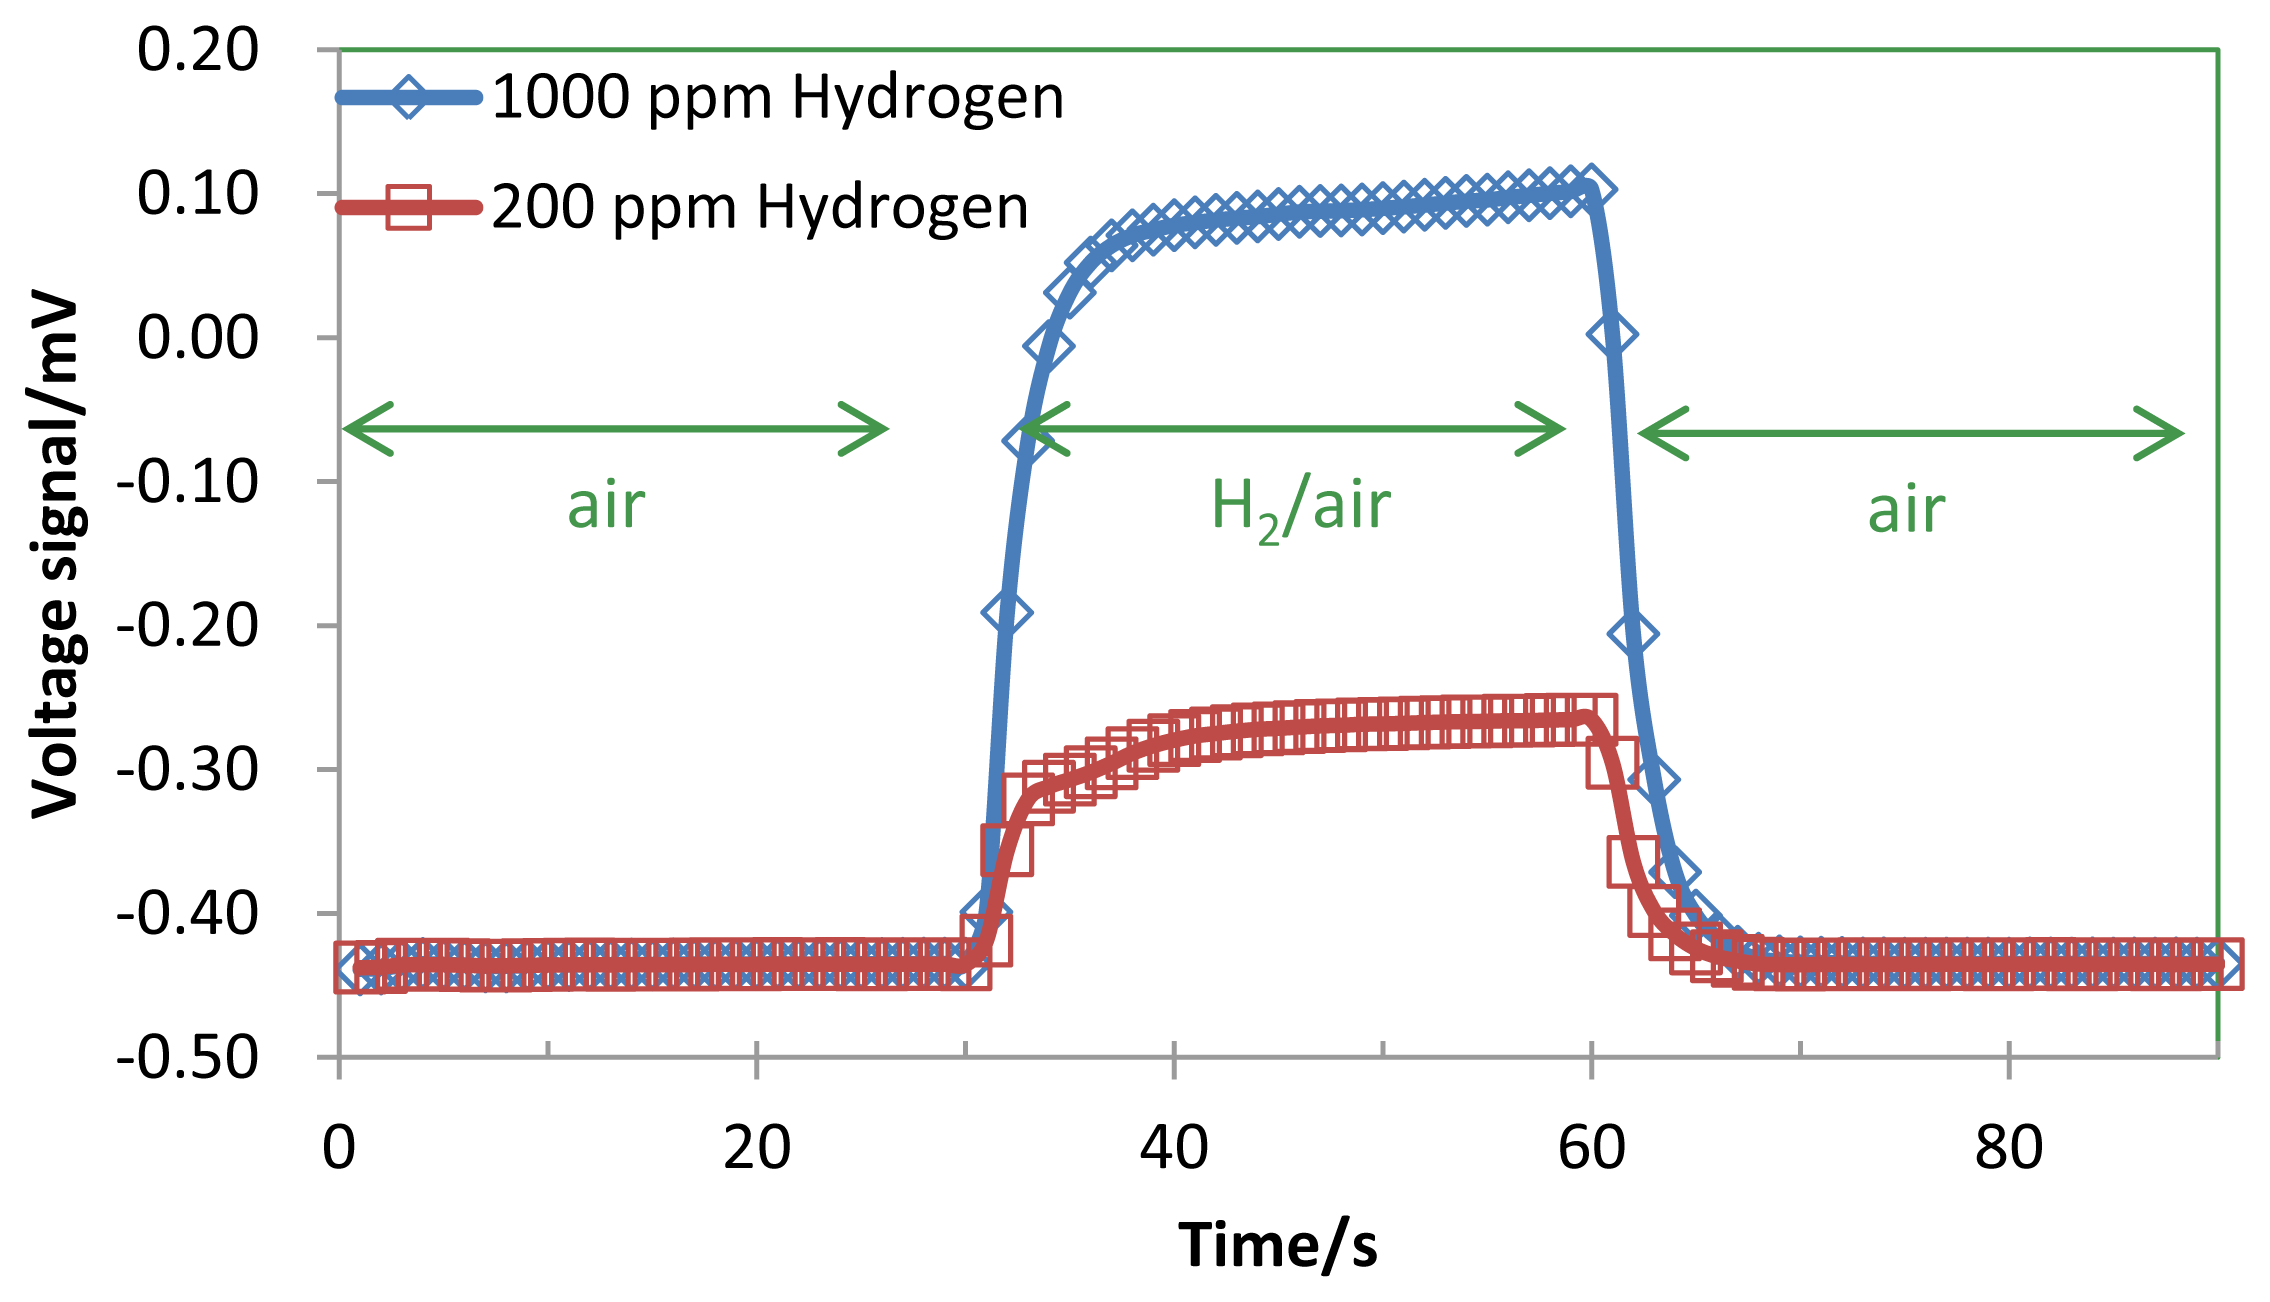
Figure 4 shows the response curves and ΔVgas of the TGS for 200 ppm and 1,000 ppm H2 in air. Table 2 lists the estimated parameters from the experimental response curves in Figure 4. The catalyst of the TGS device was heated up to 120 °C by its micro-heater with a heater power of 50.0 mW.
Assuming that the thickness of Pt heater pattern on the TGS is constant, QheaterA and QheaterB were designed to be the same and were estimated to be 10.0 mW from the dimensions of the Pt heater pattern measured by the optical microscope image and Joule's laws. As shown in Figure 4, the thermal time constants of two signal curves were the same and equal to 8 s. The gas flow was introduced at steady state after the micro-heater had stabilized. We can then regard the time constant of 2.0 s as τA, as described in Equation (15). From CA in Table 1 and the thermal time constant of section A, τA = RA × CA, RA was estimated to be 230.4 K/mW. Using this value for τA and Vair = −0.435 mV in Figure 4, RB was estimated as 230.6 K/mW, and τB was calculated as 1 s. Qcatalyst can be calculated from Equation (10) as follows:
Qcatalyst required for 1 mV of ΔVgas was calculated to be 21.7 μW. The reciprocal of the coefficient of 46.1 in Equation (16) is a parameter representing voltage per unit catalytic combustion heat [V/W] that represents the efficiency of the TGS device. ΔVgas of the TGS for 200 and 1,000 ppm H2 was 0.170 and 0.537 mV, respectively, and the expected Qcatalyst using Equation (16) for 200 and 1,000 ppm H2 was estimated as 3.69 μW and 11.7 μW, respectively. An enthalpy of hydrogen combustion is 286 kJ/mol. The molar quantity of hydrogen combustion of TGS is 3.35 × 10⁻⁶ mol/s since the heat generation of 1,000 ppm hydrogen combustion is 11.7 μW.
4.4. Simulated Voltage Signal Response VS(t)
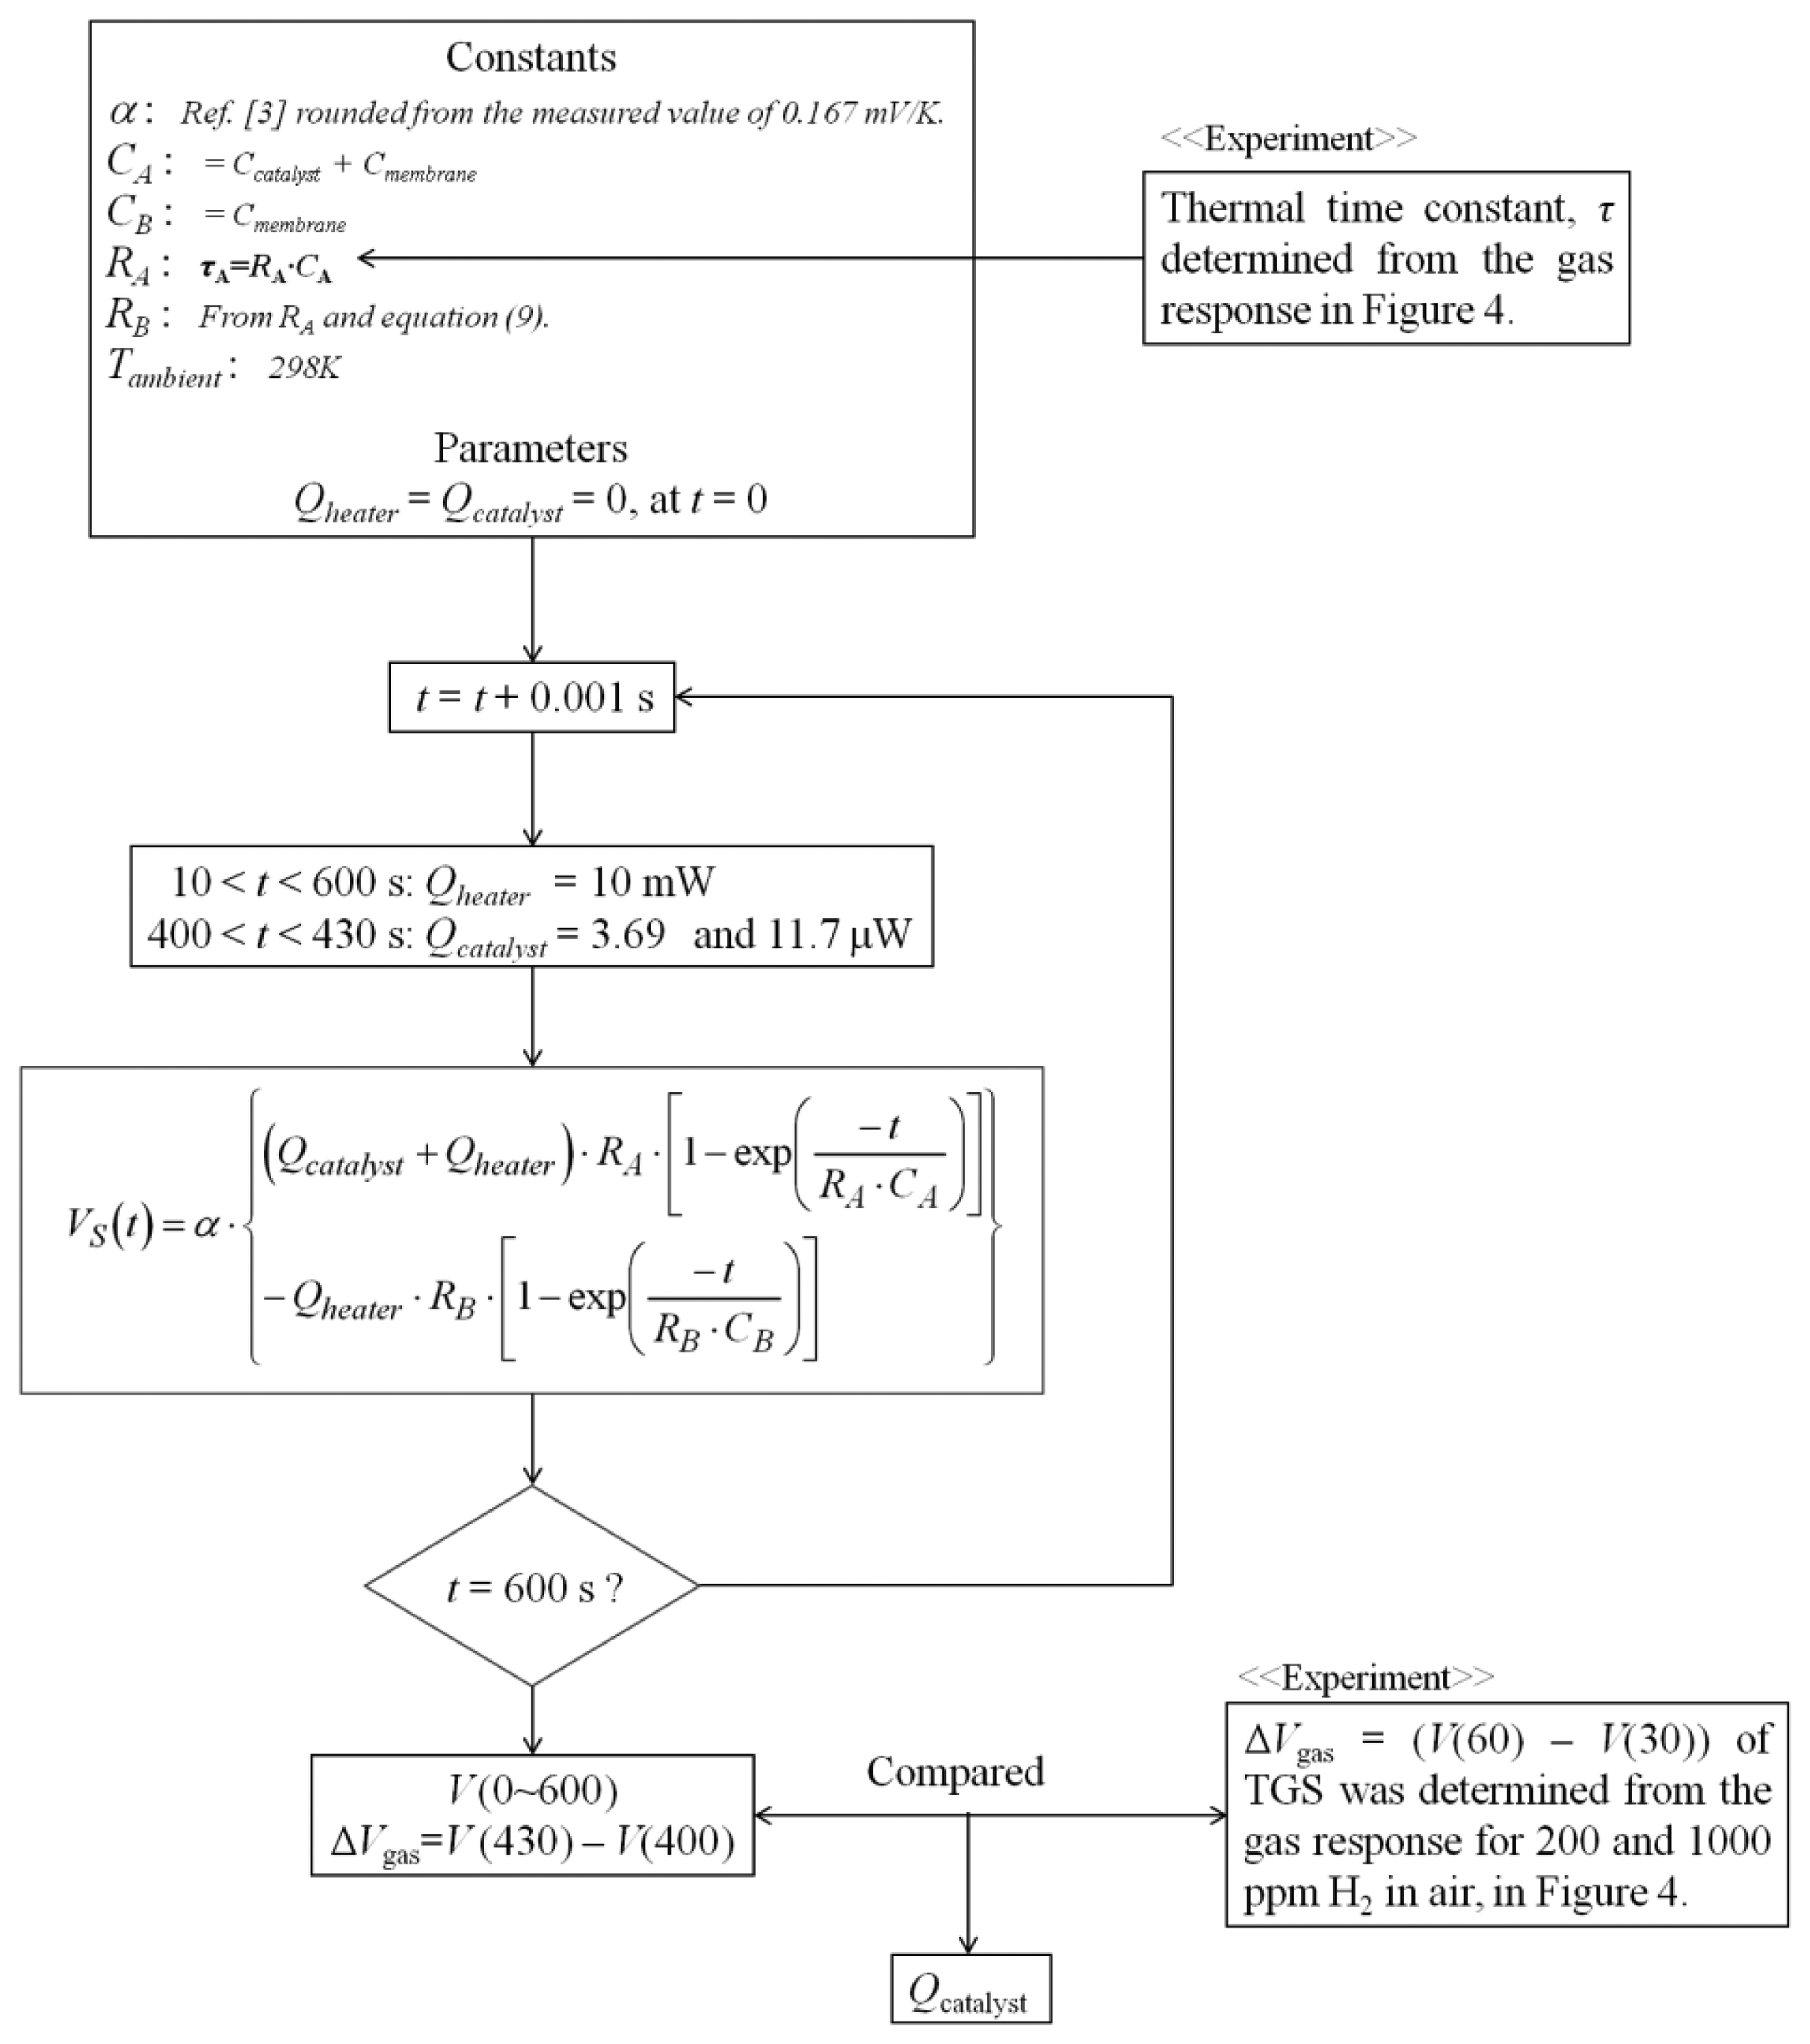
Simulations were performed using Equation (15). The flow scheme of the simulation is shown in Figure 5. The simulation time was 600 s, where the heater operation was carried out after 10 s, assuming that the catalyst generates heat from 400 to 430 s. The simulation time step was 1 ms. Figure 6 shows the simulated response curves for VS of the TGS as a function of Qcatalyst from 5.0 to 15.0 μW. ΔVgas of the TGS for Qcatalyst = 3.69 and 11.7 μW was 0.230, 0.460, and 0.691 mV, respectively.
The signal curves in Figure 6 matchthe signals in Figure 4. However, ΔVgas of the 1,000 ppm hydrogen in Figure 4 increased slightly with increasing time. Because Qcatalyst increased with increasing catalytic activity since the catalyst temperature increased with the 1,000 ppm H2 combustion. In Figure 6, the voltage signal was saturated since Qcatalyst was constant. In case of the voltage signal of the 200 ppm hydrogen in Figure 2, the catalytic activity was stable since the voltage signal was saturated. It is easy to calculate the voltage signal of TGS with the combustion of the low H2.
RA in this study has been calculated from the time constant of 2 s. Comparing this to the value 0.05 s of our previous report [11], then the new RA is estimated to be 5.8 K/mW. The reason why the RA is too large is due to the fact the gas combustion process requires a thermally induced slow reaction and this makes the time constantmuch longer, which leads to a huge apparent thermal resistance. It is originated from the DELAYED time constant problem, which is very unique and a difficult problem of the chemical reaction of catalytic combustion.
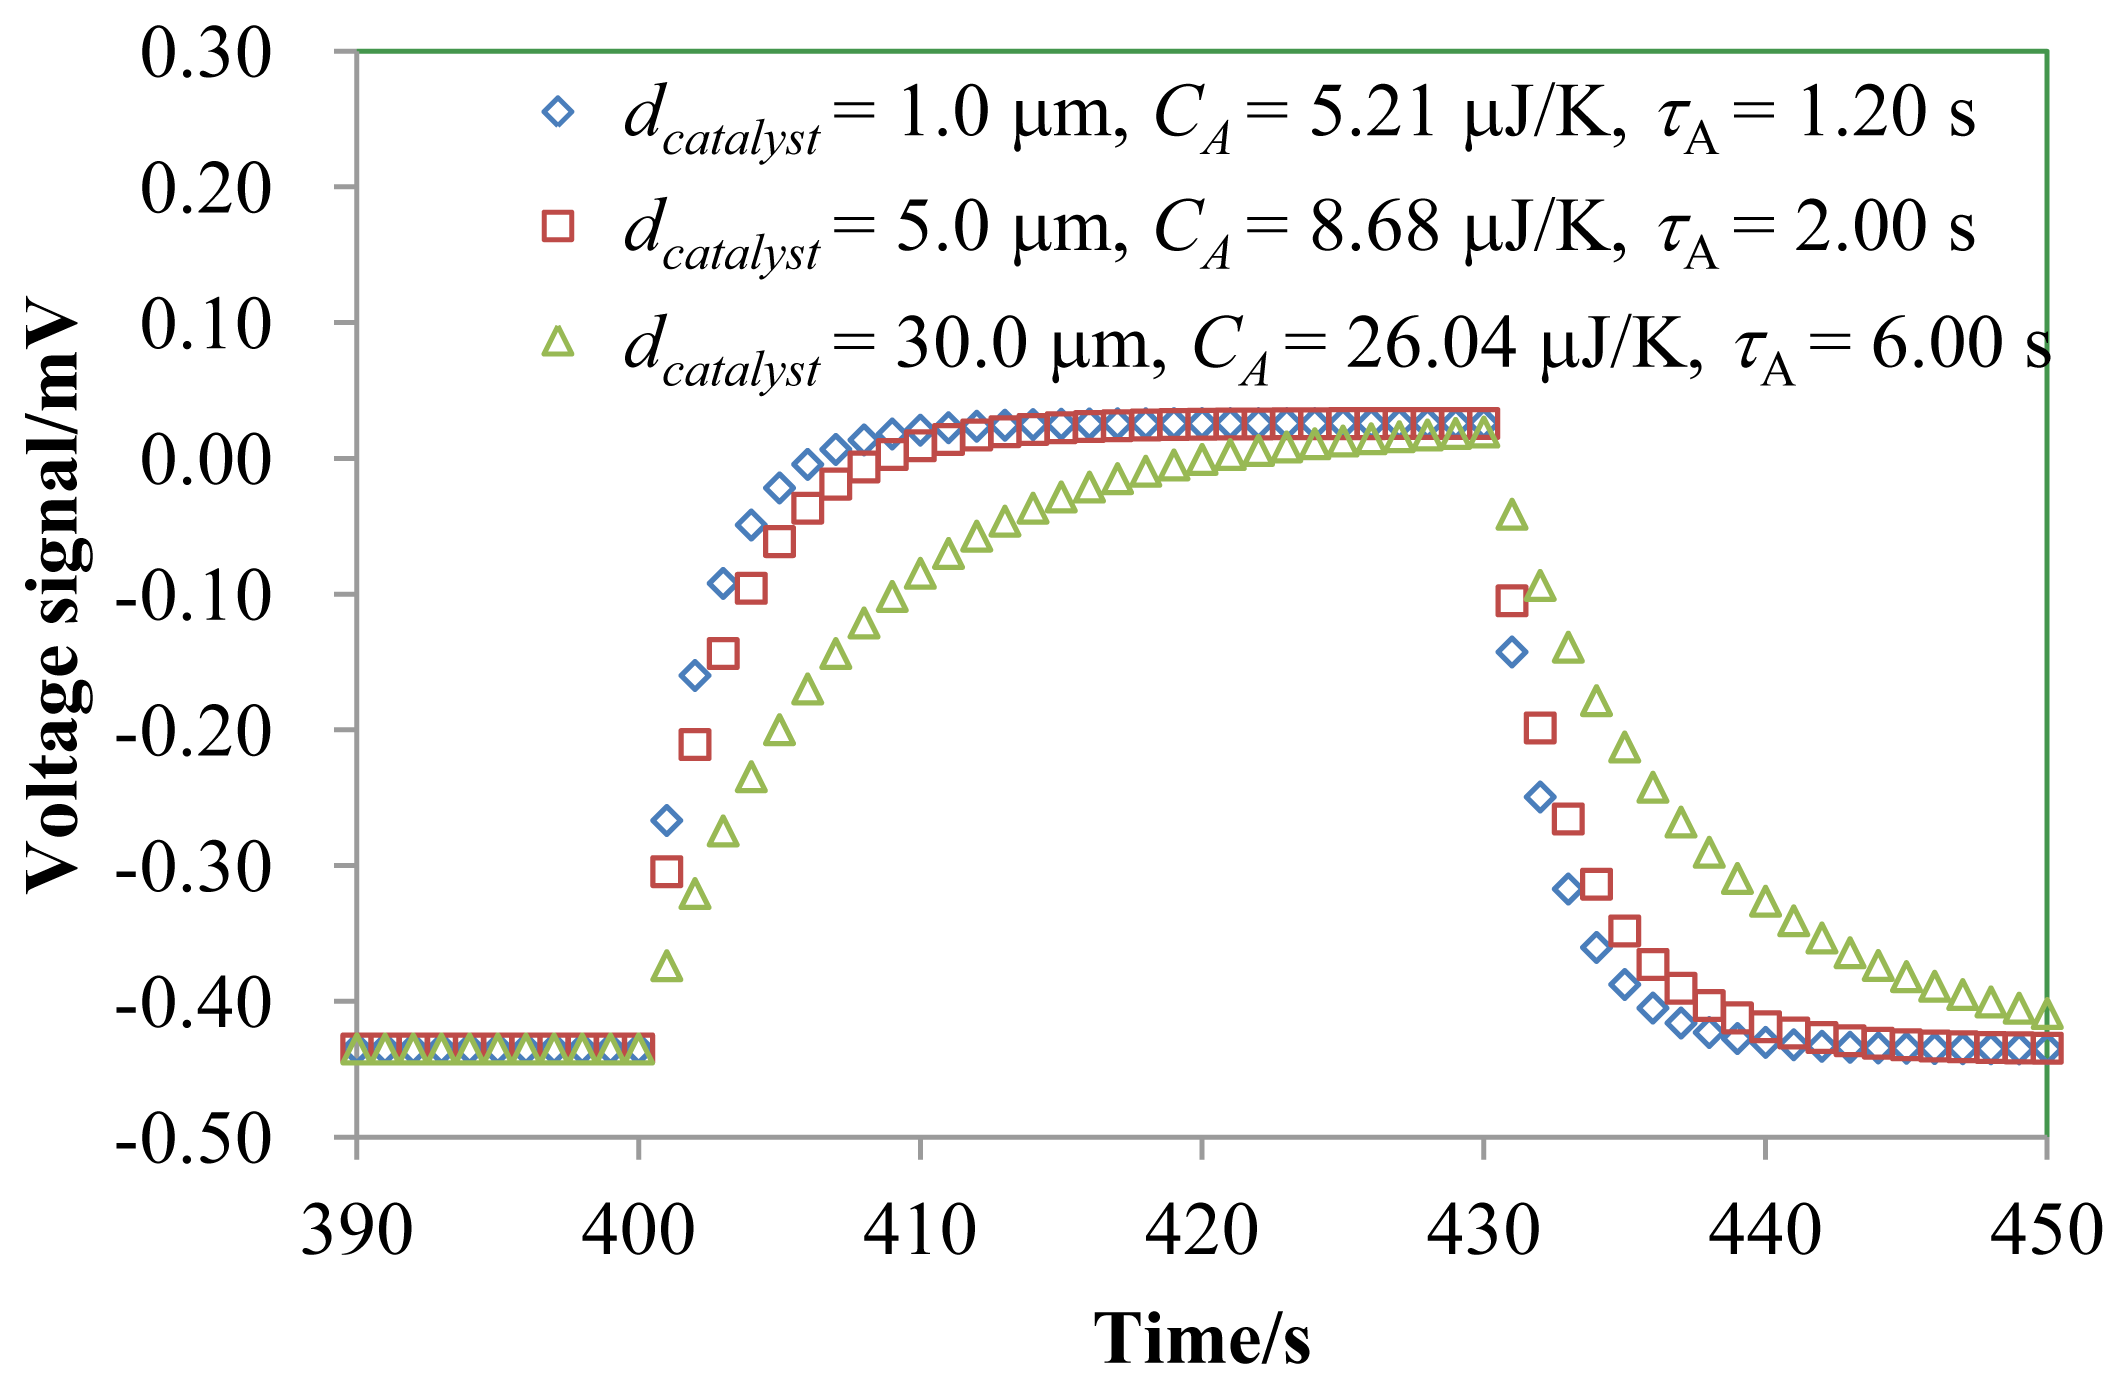
One important parameter of the gas sensor device is how fast the sensor responds to the gas, i.e., the time constant. We have investigated the effect of the heat capacity of the catalyst thickness dcatalyst on the thermal time constant, as shown in Figure 7.
In our TGS device, a performance enhancement can be achieved by reducing dcatalyst. The increase in the time constant with an increase in the dimension of the catalyst has also been plotted as a function of dcatalyst from 1.00 to 30.0 μm. The values of τA for dcatalyst = 1.00, 5.00, and 30.0 μm were 1.2, 2.0 and 6.0 s, respectively. Qcatalyst required for 1.0 mV of ΔVgas was calculated to be 0.0217 mW. τH is 2 s and τA is 0.1 s. τH is bigger than τA since the supply rate of H2 limits the rate of the combustion for H2.
5. Conclusions
We have analyzed the thermal balance of a micro-TGS, calculated the heat balance at the two sections across a TE film of the TGS device, and estimated the sensor output voltage. RA and RB at the two sections were estimated to be 230.4 K/mW and 230.6 K/mW from the thermal time constants of the experimental signal curves. Qcatalyst required for 1 mV of ΔVgas was calculated to be 0.0217 mW. On the basis of these parameters, simulations for the device performance were performed, and the expected Qcatalyst for 200 and 1,000 ppm H2 was 3.69μW and 11.7 μW, respectively.
Acknowledgments
This work was supported by the project entitled “Development Project for Extremely-Early Diagnostics Technologies for Human Diseases” of Aichi Prefecture, Japan.
Conflicts of Interest
The authors declare no conflict of interest.
References
- Behall, K.M.; Scholfield, D.J.; van der Sluijs, A.M.; Hallfrisch, J. Breath hydrogen and methane expiration in men and women after oat extract consumption. J. Nutr. 1998, 128, 79–84. [Google Scholar]
- Roberge, M.T.; Finley, J.W.; Lukaski, H.C.; Borgerding, A.J. Evaluation of the pulsed discharge helium ionization detector for the analysis of hydrogen and methane in breath. J. Chromatogr. A. 2004, 1027, 19–23. [Google Scholar]
- Nishibori, M.; Shin, W.; Houlet, L.F.; Tajima, K.; Itoh, T.; Murayama, N.; Matsubara, I. New structural design of micro-thermoelectric sensor for wide range hydrogen detection. J. Ceram. Soc. Jpn. 2006, 114, 853–856. [Google Scholar]
- Shin, W.; Nishibori, M.; Izu, N.; Itoh, T.; Matsubara, I.; Nose, K.; Shimouchi, A. Monitoring breath hydrogen using thermoelectric sensor. Sens. Lett. 2011, 9, 684–687. [Google Scholar]
- Shin, W.; Nishibori, M.; Houlet, L.F.; Itoh, T.; Izu, N.; Matsubara, I. Fabrication of thermoelectric gas sensors on micro-hotplates. Sens. Actuators B Chem. 2009, 139, 340–345. [Google Scholar]
- Wagman, D.D.; Evans, W.H.; Parker, V.B.; Schumm, R.H.; Halow, I.; Balley, S.M.; Churney, K.L.; Nuttall, R.L. The NBS Tables of Chemical Thermodynamic Properties. Selected Values for Inorganic and C1 and C2 Organic Substances in SI Units; American Chemical Society: Washington, DC, USA, 1982. [Google Scholar]
- Zumdahl, S.S.; Zumdahl, S.L.; Decoste, D.J. World of Chemistry; Houghton Mifflin Company: Boston, MA, USA, 2002. [Google Scholar]
- van Oudheusden, B.W. Effect of operating conditions on the dynamic response of thermal sensors with and without analog feedback. Sens. Actuators A Phys. 1997, 58, 129–135. [Google Scholar]
- Simon, I.; Barsan, N.; Bauer, M.; Weimar, U. Micromachined metal oxide gas sensors: opportunities to improve sensor performance. Sens. Actuators B Chem. 2001, 73, 1–26. [Google Scholar]
- Gospel, W.; Hesse, J.; Zemel, J.N. Sensors A Comprehensive Survey; WILEY VCH: Weinheim, Germany, 1990; pp. 11–69. [Google Scholar]
- Houlet, L.F.; Tajima, K.; Shin, W.; Itoh, T.; Izu, N.; Matsubara, I. Platinum micro-hotplates on thermal insulated structure for micro-thermoelectric gas sensor. IEE J Trans. Sens. Micromach 2006, 126, 568–572. [Google Scholar]
Nomenclature
| P | heating power input |
| T | temperature |
| t | time |
| R | thermal resistance |
| Qcatalyst | heat generation of catalytic combustion |
| QheaterA | heat generation of heater for section A |
| QheaterB | heat generation of heater for section B |
| Tambient | ambient temperature, mainly room temperature |
| ΔTAB | temperature difference between sections A and B |
| TA | temperature in section A |
| TB | temperature in section B |
| CA | heat capacity of section A |
| CB | heat capacity of section B |
| RA | thermal resistance of section A |
| RB | thermal resistance of section B |
| VS | voltage signal of the TGS |
| Vgas | voltage signal in the combustion gas |
| Vair | voltage signal in air |
| ΔVgas | voltage difference between the responses in air and the inflammable gas |
| τA | thermal time constant of section A |
| τB | thermal time constant of section B |


| Parameter | Symbol | Value | Unit | References |
|---|---|---|---|---|
| Specific heat capacity Pt | - | 134 | J/(kg·K) | [6] |
| Density Pt | - | 21.45 | g/cm3 | [7] |
| Specific heat capacity Al2O3 | - | 800 | J/(kg·K) | “Network database system for thermophysical property data” by AIST and 790 J/(kg·K) is rounded to 800 J/(kg·K). |
| Density Al2O3 | - | 4 | g/cm3 | Product data sheet by Taimei Chemicals Co., Ltd. and 3.95 g/cm3 is rounded to 4.00 g/cm3. |
| Dispensed catalytic diameter | - | 600 | μm | Rounded from the values (565 and 4.64 μm) measured by a KLA-Tencor P16+ Profiler. |
| Dispensed catalytic thickness | dcatalyst | 5 | μm | |
| Dispensed catalytic volume | - | 1.41 × 10⁻³ | mm3 | |
| Seebeck coefficient | α | 0.2 | mV/K | Rounded from the measured value of 0.167 mV/K [3]. |
| Heat capacity catalyst 40wt%Pt/Al2O3 | Ccatalyst | 4.34 | μJ/K | Estimated from the specific heat capacity and density for the catalyst. |
| Heat capacity for the membrane | Cmembrane | 4.34 | μJ/K | The heat capacity of the membrane in sections A and B was assumed to be the same as the heat capacity of the catalyst. |
| Heat capacity for section A | CA | 8.68 | μJ/K | =Ccatalyst +Cmembrane |
| Heat capacity for section B | CB | 4.34 | μJ/K | =Cmembrane |
| Ambient temperature | Tambient | 298 | K |
| Parameter | Symbol | Value | Unit | Reference |
|---|---|---|---|---|
| Voltage signal of the TGS in air | Vair | −0.435 | mV | Measured, Assuming that the thickness of Pt heater pattern on the TGS is constant, QheaterA and QheaterB were designed to be the same and were estimated to be 10.0 mW from the dimensions of the Pt heater pattern measured by the optical microscope image and Joule's laws. As shown in Figure 4, the thermal time constants of two signal curves were the same and equal to 8 s. The gas flow was introduced at steady state after the micro-heater had stabilized. We can then regard the time constant of 2.0 s as τA, as described in Equation (15). From CA in Table 1 and the thermal time constant of section A, τA = RA × CA, RA was estimated to be 230.4 K/mW. Using this value for τA and Vair = −0.435 mV in Figure 4, RB was estimated as 230.6 K/mW, and τB was calculated as 1 s. Qcatalyst can be calculated from Equation (16) as follows: |
| Whole heater power 50 mW | - | 50.0 | mW | Measured and rounded |
| Heater power of sections A and B | QheaterA QheaterB | 10.0 | mW | Estimated from each heater pattern size dimension and the whole heater power 50 mW |
| Time constant of section A | τA | 2.0 | s | Estimated from gas response of the TGS, Figure 4 |
| Time constant of section B | τB | 1.0 | s | From τB = RB × CB, Equation (14) |
| Thermal resistance of section A | RA | 230.4 | K/mW | From τA = RA × CA, Equation (13) |
| Thermal resistance of section B | RB | 230.6 | K/mW | From Vair = α × Qheater × (RA – RB), Equation (9) |
*The elapsed time at 63.2% of the saturated ΔVgas.
© 2014 by the authors; licensee MDPI, Basel, Switzerland. This article is an open access article distributed under the terms and conditions of the Creative Commons Attribution license (http://creativecommons.org/licenses/by/3.0/).
Share and Cite
Nagai, D.; Akamatsu, T.; Itoh, T.; Izu, N.; Shin, W. Thermal Balance Analysis of a Micro-Thermoelectric Gas Sensor Using Catalytic Combustion of Hydrogen. Sensors 2014, 14, 1822-1834. https://doi.org/10.3390/s140101822
Nagai D, Akamatsu T, Itoh T, Izu N, Shin W. Thermal Balance Analysis of a Micro-Thermoelectric Gas Sensor Using Catalytic Combustion of Hydrogen. Sensors. 2014; 14(1):1822-1834. https://doi.org/10.3390/s140101822
Chicago/Turabian StyleNagai, Daisuke, Takafumi Akamatsu, Toshio Itoh, Noriya Izu, and Woosuck Shin. 2014. "Thermal Balance Analysis of a Micro-Thermoelectric Gas Sensor Using Catalytic Combustion of Hydrogen" Sensors 14, no. 1: 1822-1834. https://doi.org/10.3390/s140101822